Vibration Analysis Basics: RMS, ISO 10816, Bearing Faults
Vibration analysis is the measurement of how a machine vibrates and the interpretation of that signal to find developing faults, such as unbalance, misalignment, looseness, and bearing damage, weeks before they cause a failure. It is the most widely used technique in predictive maintenance for rotating machines: pumps, fans, motors, compressors, and gearboxes.
This page explains the concepts behind it for readers who are new to the field: what a vibration sensor records, which values Trendz derives from the recording, and how those values lead to a conclusion like “bearing damage on the outer race”. Each section closes with a pointer to where the concept appears in Trendz, so you can verify it on your own machines.
Sensors and samples
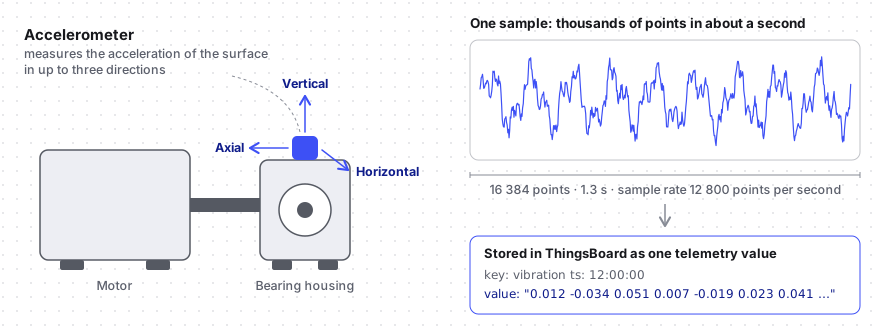
Section titled “Sensors and samples”Vibration is measured with an accelerometer, a compact sensor mounted on the bearing housing of a machine, where the forces acting on the shaft reach the outside. It measures acceleration, the rate at which the surface is being pushed back and forth, in g or in m/s². A triaxial sensor measures three directions at once: vertical, horizontal, and axial, along the shaft.
What a sample is
Section titled “What a sample is”Vibration telemetry differs from temperature or pressure in one important way: speed. A bearing fault can excite the housing thousands of times per second, so a single reading per minute carries no information about it. The sensor therefore records a short burst, comparable to a short audio recording of the machine, and the whole burst is stored as one telemetry value. Trendz calls this a sample. A sample contains thousands of points, and the sample rate, the number of points recorded per second, determines the highest frequency that can be analyzed: half the sample rate.
See it in Trendz: the telemetry format for samples is described in Getting Started.
Vibration metrics: RMS, peak-to-peak, and crest factor
Section titled “Vibration metrics: RMS, peak-to-peak, and crest factor”A sample is too large to read directly, so Trendz reduces it to a small set of values, much as a sound level meter reduces noise to a single decibel figure.
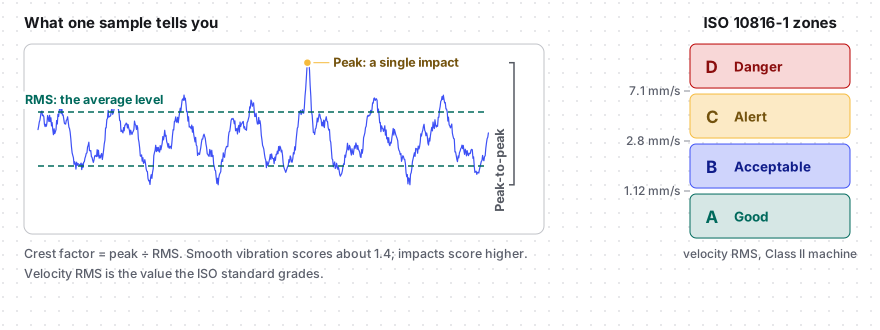
- Acceleration RMS: The average vibration level of the sample, in g. It reflects the overall intensity of the motion, including the high-frequency activity of bearings and gears.
- Velocity RMS: The same average expressed in mm/s. Trendz derives it from the acceleration. This is the value the industry standard grades, because it tracks the energy that wears a machine out.
- Peak-to-peak: The largest single swing in the sample. It responds to individual impacts that an average conceals.
- Crest factor: The peak divided by the RMS, a measure of how impulsive the vibration is. Smooth vibration scores around 1.4; a bearing that has started to produce impacts scores considerably higher. The value rises early in a fault and falls again as the damage spreads, so Trendz displays it but does not grade a machine on it.
Comparison with the machine’s normal
Section titled “Comparison with the machine’s normal”Absolute values are hard to interpret across machines. Two identical pumps on different foundations vibrate at different levels when both are healthy, and a level that is normal for one signals a problem on the other. Condition monitoring therefore works with trends: each machine is compared with its own history, and a change from that baseline matters more than the absolute number. Trendz applies this to every metric and reports the change as a factor. A value of 2.0× means the reading has doubled relative to what is normal for that machine.
ISO 10816-1 severity zones
Section titled “ISO 10816-1 severity zones”Velocity RMS also has an industry-wide severity scale, ISO 10816-1. The standard grades the overall vibration velocity measured on the bearing housing, over the 10 to 1000 Hz range, into four zones:
| Zone | Meaning | Typical action |
|---|---|---|
| A | Good. Vibration typical of a newly commissioned machine | None |
| B | Acceptable. Suitable for unrestricted long-term operation | None |
| C | Alert. Unsatisfactory for long-term operation | Plan maintenance within a limited period |
| D | Danger. Severe enough to cause damage | Act without delay |
The zone limits depend on the machine class, because a large machine on a flexible foundation naturally vibrates more than a small rigidly mounted one:
| Class | Machine | A to B | B to C (alert) | C to D (danger) |
|---|---|---|---|---|
| Class I | Small machines, up to 15 kW | 0.71 mm/s | 1.8 mm/s | 4.5 mm/s |
| Class II | Medium machines, 15 to 75 kW | 1.12 mm/s | 2.8 mm/s | 7.1 mm/s |
| Class III | Large machines on rigid foundations | 1.8 mm/s | 4.5 mm/s | 11.2 mm/s |
| Class IV | Large machines on flexible foundations | 2.8 mm/s | 7.1 mm/s | 18.0 mm/s |
A Class II pump reading 3.1 mm/s is in zone C, while the same reading on a Class III compressor is still zone B. Once the class is set in Machine details, every machine in the model receives a zone letter alongside its readings, and the zone boundaries appear as reference lines on the velocity RMS trend.
ISO 10816-1 has been withdrawn and replaced by ISO 20816-1, which combines it with the shaft vibration standard ISO 7919-1 and keeps the A to D zone scheme. The class limits in the table above come from ISO 10816-1. They are still the values most vibration sensors, handbooks, and analysts quote, which is why Trendz uses them.
See it in Trendz: the metrics and their factors are shown on the Overview tab, and they can drive alarms as described in Monitoring and alarms.
Time waveform and FFT spectrum
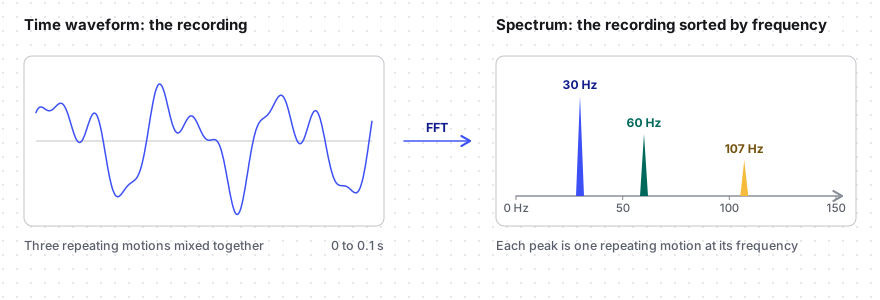
Section titled “Time waveform and FFT spectrum”The time waveform is the sample plotted as recorded: vibration against time. It reveals impacts, events that repeat once per revolution, and the general character of the motion.
Spectrum
Section titled “Spectrum”The spectrum is the same sample sorted by frequency. A chord played on a piano reaches the ear as one sound, yet it consists of a few distinct notes. The spectrum performs that separation for a machine: a Fast Fourier Transform (FFT) decomposes the recording into the repeating motions it contains and draws one peak per motion, positioned at its frequency and scaled to its strength.
This separation is what makes diagnosis possible. Each mechanical fault produces vibration at characteristic frequencies. The waveform shows that the machine vibrates; the spectrum shows what causes it.
Acceleration, velocity, and displacement
Section titled “Acceleration, velocity, and displacement”The sensor measures acceleration, but the same motion can be described in two other ways. Velocity is how fast the surface moves, and displacement is how far it moves. The three are linked mathematically, so Trendz derives velocity and displacement from the recorded acceleration and lets you switch between them on any waveform or spectrum with the Display units. The motion does not change; the emphasis does.
| Quantity | Unit | Emphasizes | Use it for |
|---|---|---|---|
| Acceleration | g | High frequencies, from hundreds of Hz upward | Bearing and gear condition, impacts, envelope analysis |
| Velocity | mm/s | The middle range, about 10 to 1000 Hz, evenly | Overall machine condition, ISO 10816-1 zones, shaft faults like unbalance and misalignment |
| Displacement | µm | Low frequencies, below about 10 Hz | Slow machines, structural movement, and once-per-revolution motion in the polar plot |
The reason is a property of vibration itself. For the same displacement, velocity grows in proportion to the frequency and acceleration in proportion to its square. A slow, large movement of the whole machine is therefore most visible as displacement, while the fast, tiny impacts inside a bearing are most visible as acceleration. Velocity sits in between and tracks the energy of the vibration, which is why the industry standard uses it.
In practice: read overall condition and the 1× and 2× region in velocity, look for bearing and gear activity in acceleration, and switch to displacement when a slow machine or a structural problem is suspected.
Harmonics
Section titled “Harmonics”A perfectly smooth repeating motion produces a single peak in the spectrum. Real machines rarely move that smoothly. When a repeating motion is distorted in any way, by a coupling that binds twice per turn, by a part that lifts and lands, by an impact on every pass, the spectrum shows a series of peaks at whole multiples of the base frequency: 2×, 3×, 4×, and so on. The base frequency is the fundamental; the multiples are its harmonics. A musical instrument works the same way: a note contains overtones at multiples of its pitch, and the pattern of overtones gives the instrument its character.
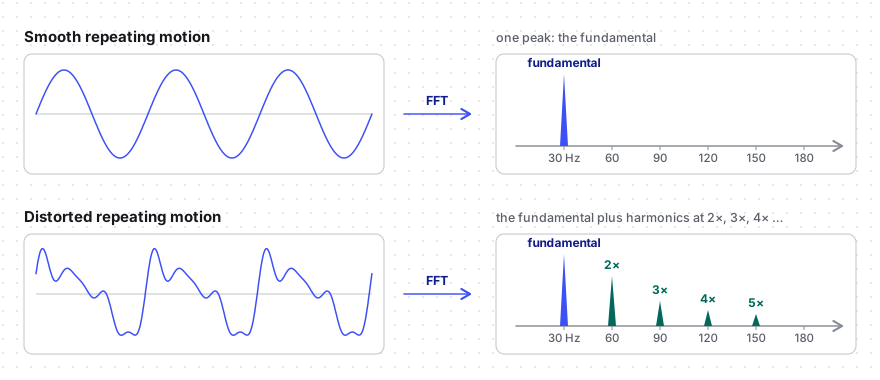
In vibration analysis, the pattern of harmonics identifies the fault. A single clean peak indicates a smooth periodic force, like unbalance. A fundamental with a strong 2× indicates a motion that repeats twice per turn, like misalignment. A long series of harmonics indicates impacts or rattling, like looseness. A series of harmonics of a bearing fault frequency indicates repeated impacts inside the bearing. Harmonics are therefore evidence, and Trendz counts them: a labeled peak with several harmonics is trusted more than a peak standing alone.
A related pattern is the sideband: pairs of small peaks spaced evenly on both sides of a main peak. They indicate that one motion is modulating another, which is typical of gear and inner race faults.
See it in Trendz: both charts and the quantity switch are on the Analyzer tab, described in Analyzer tab. Its Harmonics and Sidebands overlays mark the multiples of any selected peak on the spectrum.
Rotation speed and orders
Section titled “Rotation speed and orders”Most fault frequencies are tied to the rotation speed of the shaft. A motor running at 1800 RPM completes 30 revolutions per second and therefore vibrates at 30 Hz. Analysts refer to this frequency as 1× and express other frequencies as multiples of it, called orders: 2× is twice the shaft speed, 3× three times, and so on. Because the order scale is independent of the actual speed, the same fault patterns apply to a slow pump and a fast fan alike.
Orders also separate peaks into two groups. A peak on a whole order, 1×, 2×, or 3×, originates from the shaft. A peak between whole orders originates from a component with its own rotation rate, most often a bearing element.
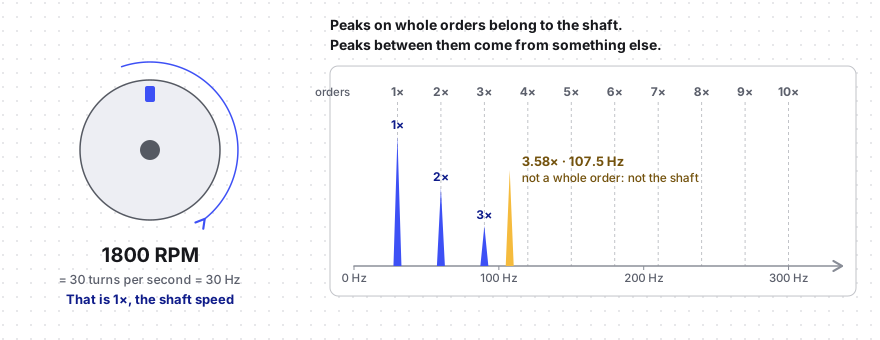
Trendz needs the shaft speed to apply this: as a fixed value, a device attribute, or a telemetry key for machines that change speed. With the speed known, it converts orders to Hz, labels the peaks, and enables fault diagnosis. Without it, Trendz still tracks levels but cannot attribute what it sees.
See it in Trendz: the speed is set under Machine details. The Analyzer overlays mark the 1× line and its harmonics on any spectrum.
Fault signatures: unbalance, misalignment, looseness, and bearing damage
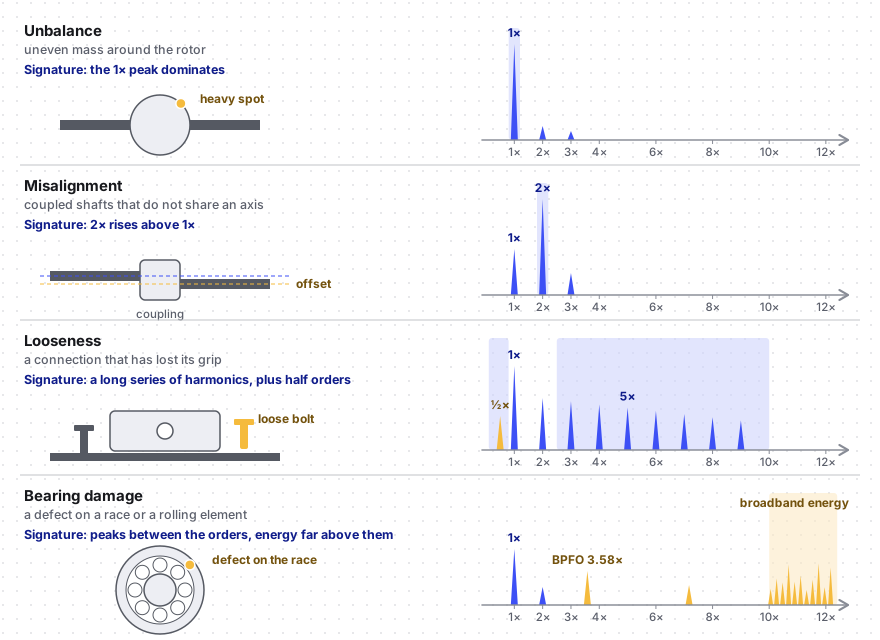
Section titled “Fault signatures: unbalance, misalignment, looseness, and bearing damage”Four mechanical faults account for most problems in rotating machinery, and each leaves a recognizable pattern in the spectrum.
- Unbalance: Mass distributed unevenly around the rotor, like deposits on one side of a fan wheel. The rotor pushes outward once per revolution, so the 1× peak grows and dominates.
- Misalignment: Two coupled shafts that do not share a common axis, like a motor and a pump offset by a fraction of a millimeter. The coupling flexes twice per revolution, so the 2× peak rises, often above 1×.
- Looseness: A connection that has lost its preload: a foundation bolt, a bearing worn loose in its housing. The parts move against each other and produce a long series of harmonics, 3×, 4×, 5×, and beyond, sometimes with half orders.
- Bearing damage: A defect on a race or a rolling element. It produces peaks between whole orders and broadband energy at frequencies well above any shaft fault. The next section explains how Trendz analyzes it.
Frequency bands
Section titled “Frequency bands”A spectrum contains hundreds of individual frequencies, and following each of them over time is neither practical nor reliable. Analysts therefore divide the spectrum into a few frequency bands: ranges of frequency, defined in orders of shaft speed, that each collect the vibration of one family of causes. Instead of hundreds of values, a machine is described by a handful of band levels, and each level has a physical meaning.
| Band | Range | Typical causes |
|---|---|---|
| Sub-harmonic | 0.1 to 0.8× | Looseness, rubbing parts, belt problems |
| 1× | 0.8 to 1.2× | Unbalance, a bent shaft, eccentricity |
| 2× | 1.8 to 2.2× | Misalignment, a cracked shaft |
| Harmonics | 2.5 to 10× | Looseness, coupling problems, blade or vane passing |
| Non-synchronous | above 10× | Bearing and gear activity, which does not follow the shaft speed |
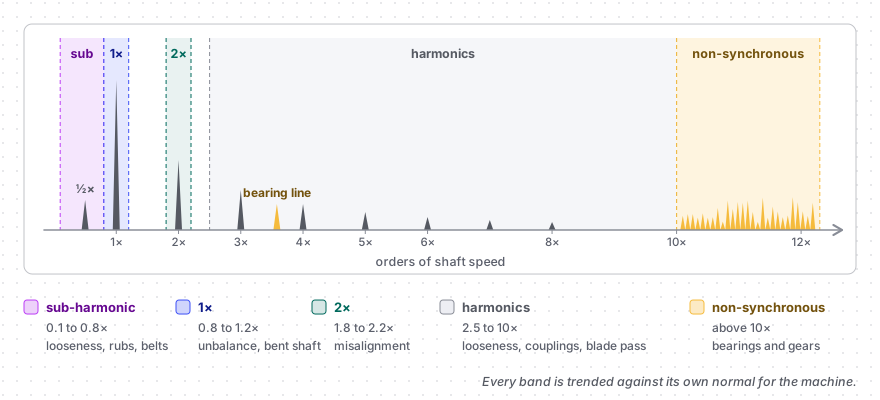
Because the ranges are defined in orders, they move with the shaft speed and stay valid for slow and fast machines alike.
Bands are used by trending them. Each band level is followed over time and compared with what is normal for that machine. A band that grows while the others stay flat points at its own family of causes, and the combination tells the families apart: growth in 1× alone suggests unbalance; 2× growing ahead of 1× suggests misalignment; growth spread across the sub-harmonic and harmonics bands suggests looseness; growth confined to the non-synchronous band suggests a bearing or gear problem and calls for the bearing analysis described in the next section. Band trending is reliable because it does not depend on finding individual peaks, and it works even when the spectrum is noisy.
See it in Trendz: Trendz computes the five band levels for every sample, compares each with the machine’s own median, and turns the pattern of growth into a score per fault family, reported as Probable or Not seen. The scores are on the Overview tab, and the Shaft faults view shows the trend of each band.
Bearing fault frequencies (BPFO, BPFI, BSF, FTF) and envelope analysis
Section titled “Bearing fault frequencies (BPFO, BPFI, BSF, FTF) and envelope analysis”A rolling bearing consists of four parts: an outer race, an inner race, a set of balls or rollers between them, and a cage that keeps the rolling elements spaced. When a defect forms on the outer race, each rolling element that passes over it produces a small impact. The impacts repeat at a rate determined by the bearing geometry, and each part has its own rate:
| Frequency | Damaged part |
|---|---|
| BPFO | Outer race |
| BPFI | Inner race |
| BSF | Rolling element |
| FTF | Cage |
These rates are expressed in orders, so they hold at any speed. An SKF 6205, a common small bearing, produces impacts at 3.585 orders when its outer race is damaged. At 1800 RPM that corresponds to 107.5 Hz. With the bearing model known, the frequencies to watch are known as well.
Envelope analysis
Section titled “Envelope analysis”The difficulty is that the impacts are weak. Against the overall vibration of the machine they disappear in a normal spectrum. Envelope analysis recovers them. Each impact causes the bearing housing to resonate briefly at a high frequency, far above the shaft-related vibration. The method isolates that high-frequency resonance with a filter, traces its outline, the envelope, and computes the spectrum of the envelope. The resonance itself is discarded; what remains is its rhythm, a clear peak at the fault frequency and its multiples. Trendz applies this method to every sample.
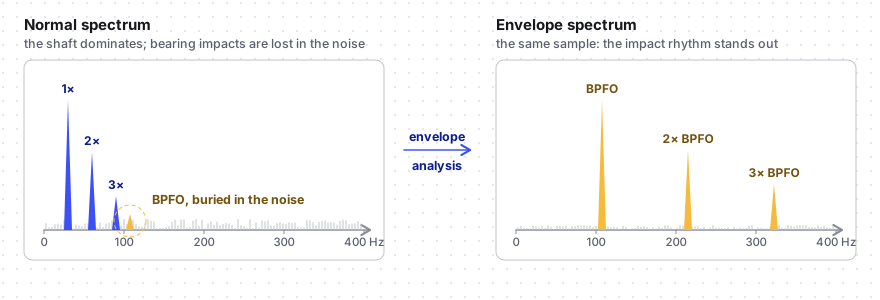
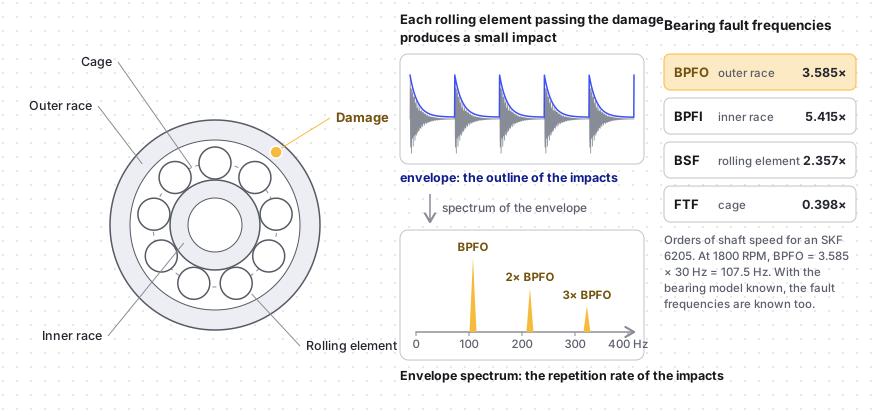
Trendz marks BPFO, BPFI, BSF, and FTF on the envelope spectrum for every configured bearing, scores how closely the peaks match, and names the damaged part. Because it tracks each fault frequency over time, it also reports when a peak first appeared and how fast it is growing.
See it in Trendz: the Envelope view of the Analyzer shows the envelope spectrum with the fault frequencies marked, the Bearing faults view of the Overview tracks them over time, and a Bearing defect alarm rule raises a ThingsBoard alarm when one is detected.
Was this helpful?