Hit Target: Will the Budget or Goal Be Met?
Hit Target tells you, before a period ends, whether each device or asset will meet its target: stay under a limit, such as a monthly energy budget, or reach a goal, such as a weekly production quota.
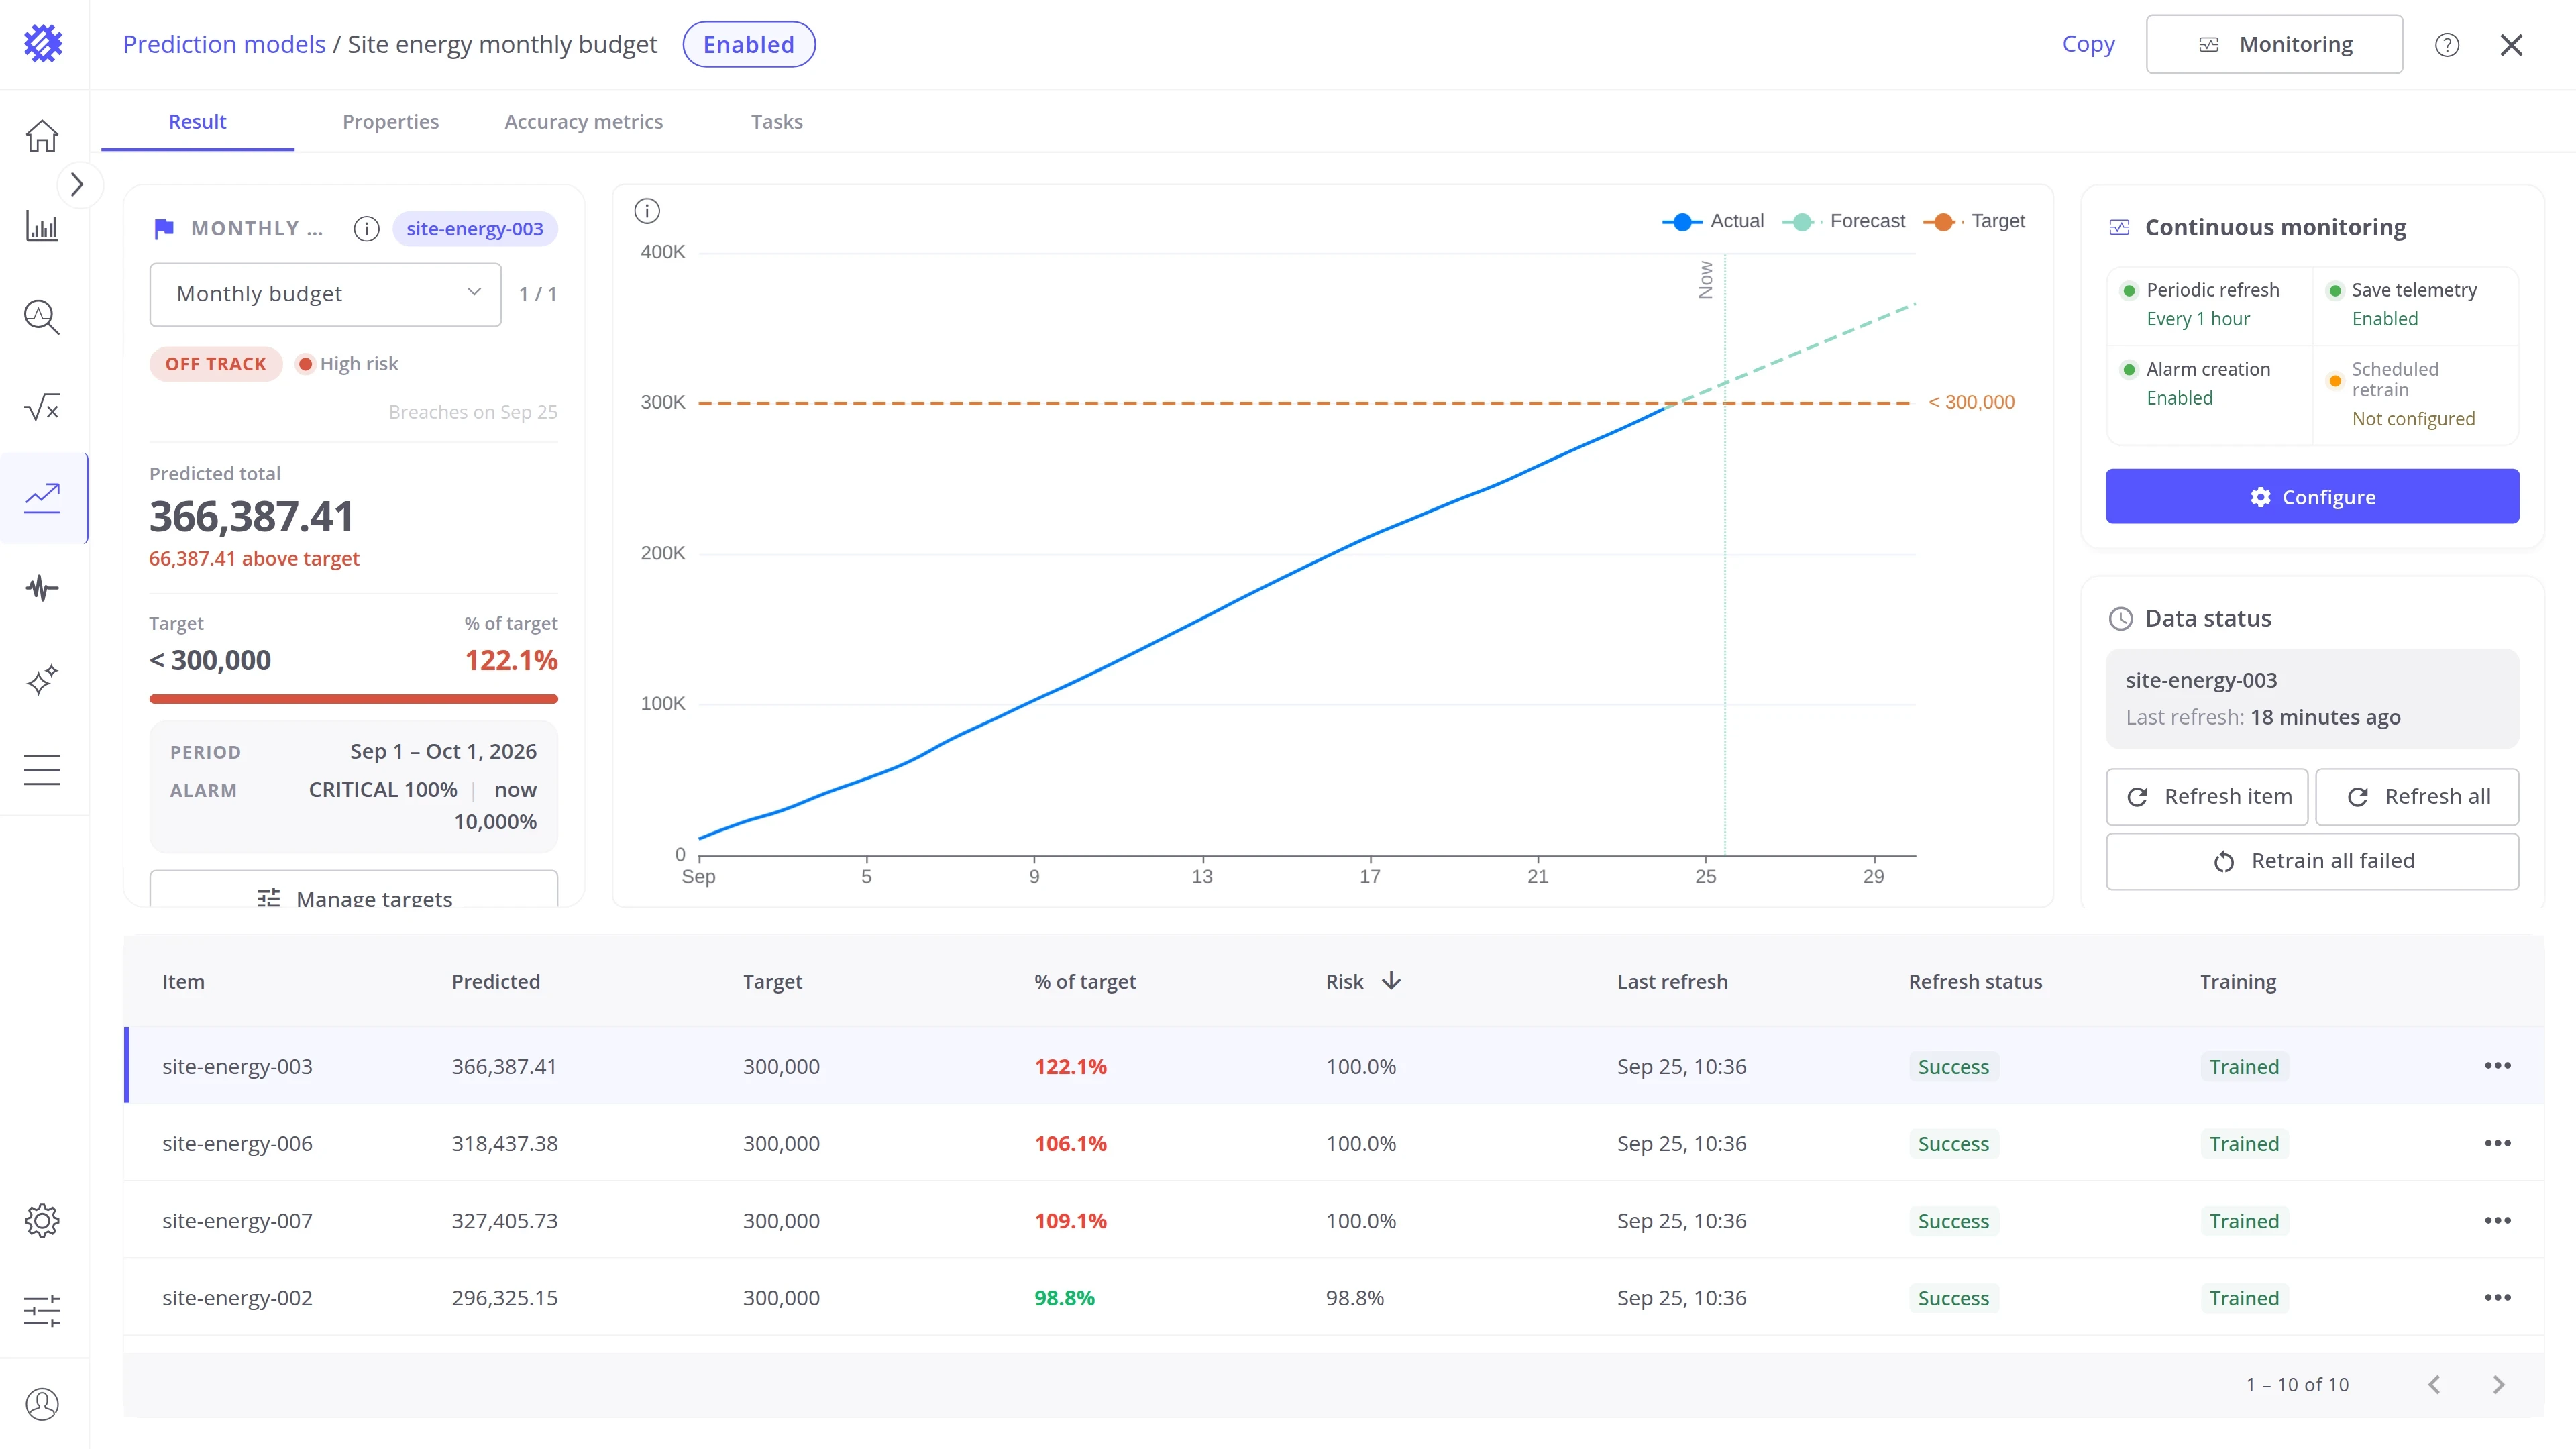
Part of the period is already measured. Trendz forecasts the rest, adds it to what is measured, and compares this predicted total with the target. For example, a site forecast to use 366,000 kWh this month is over its 300,000 kWh budget, so it is Off track. Each item also gets a risk score, and can raise a ThingsBoard alarm while it is at risk, so you can act while the period still has time left.
When to use it
Section titled “When to use it”Use Hit Target when the question is yes or no by the end of a period: will each item stay within its limit, or reach its goal?
| Use case | What Hit Target predicts | What you do with it |
|---|---|---|
| Stay within the energy budget | Whether each site ends the month under its 300,000 kWh budget | Act on the sites heading over budget while the month still has days left |
| Meet the production quota | Whether each line reaches its weekly quota of units | Move orders or shifts to the lines that will fall short |
The target is checked over the prediction period, so the period you pick in step 3 is also the deadline. If you need the values themselves rather than a yes or no, use Forecast. For a total over a period without a target, use Period Total, and for the moment a value crosses a limit, Time to Threshold.
How to create a model
Section titled “How to create a model”Step 1: Open the wizard
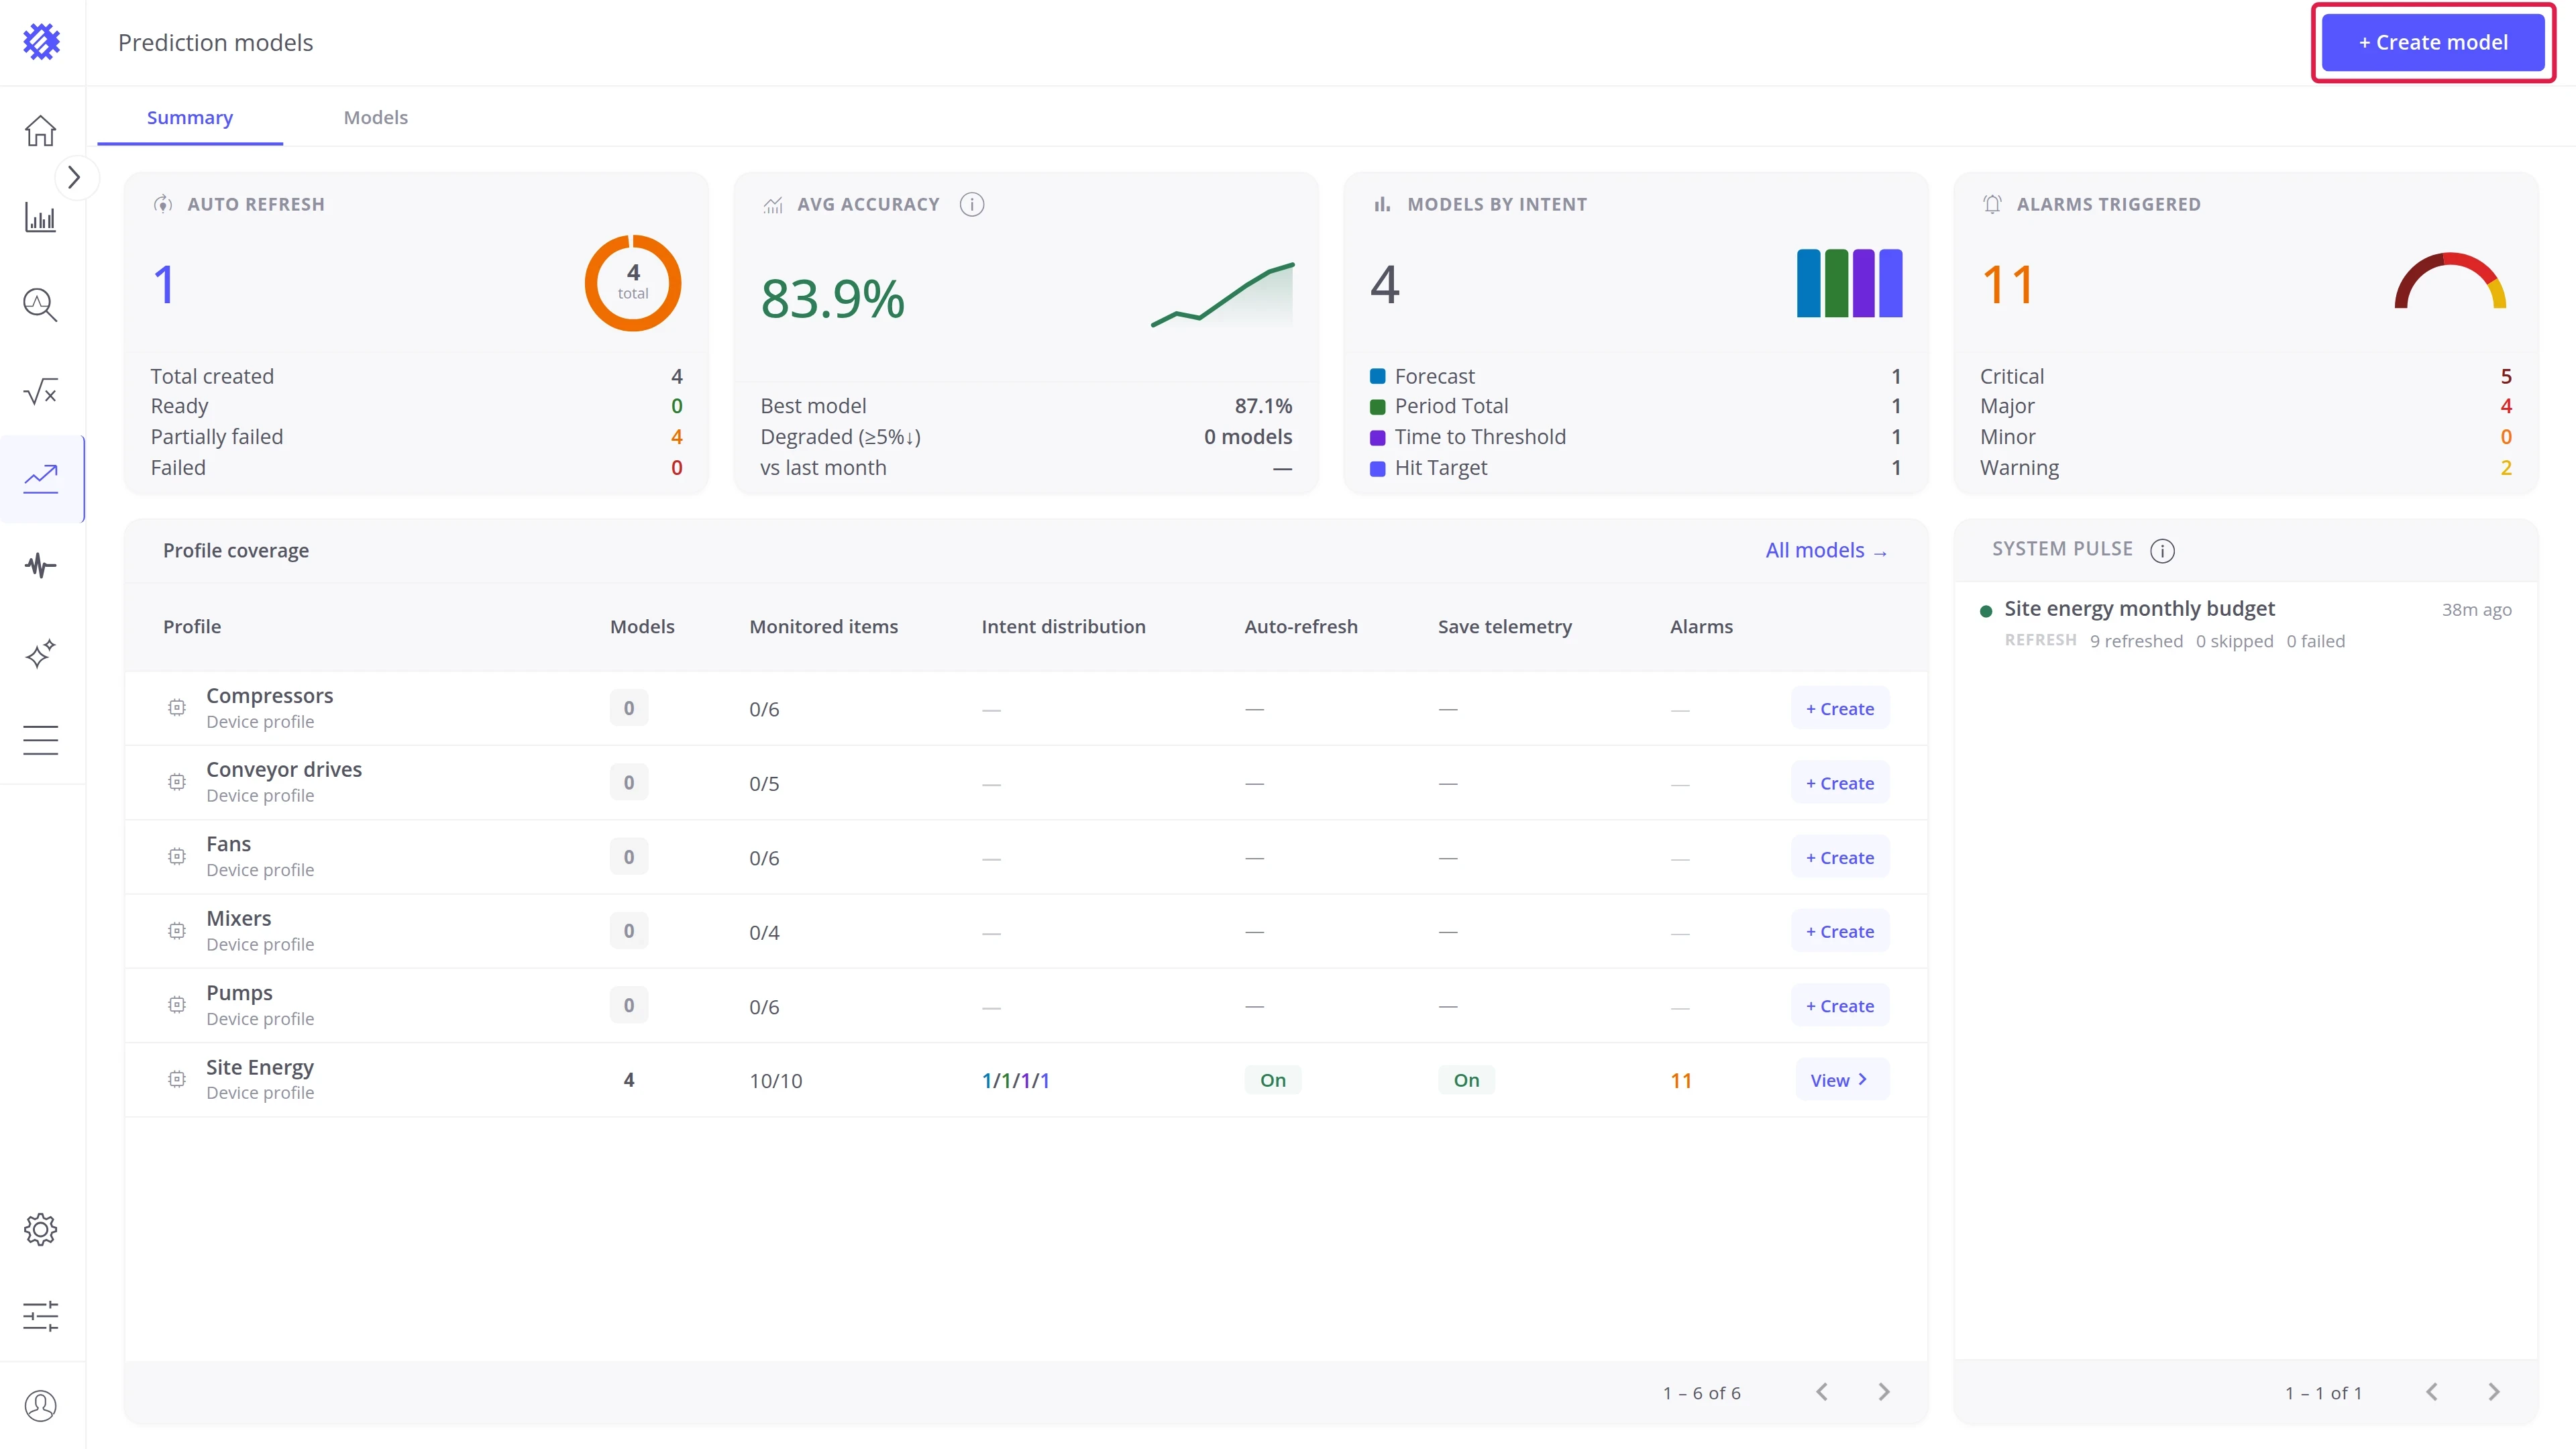
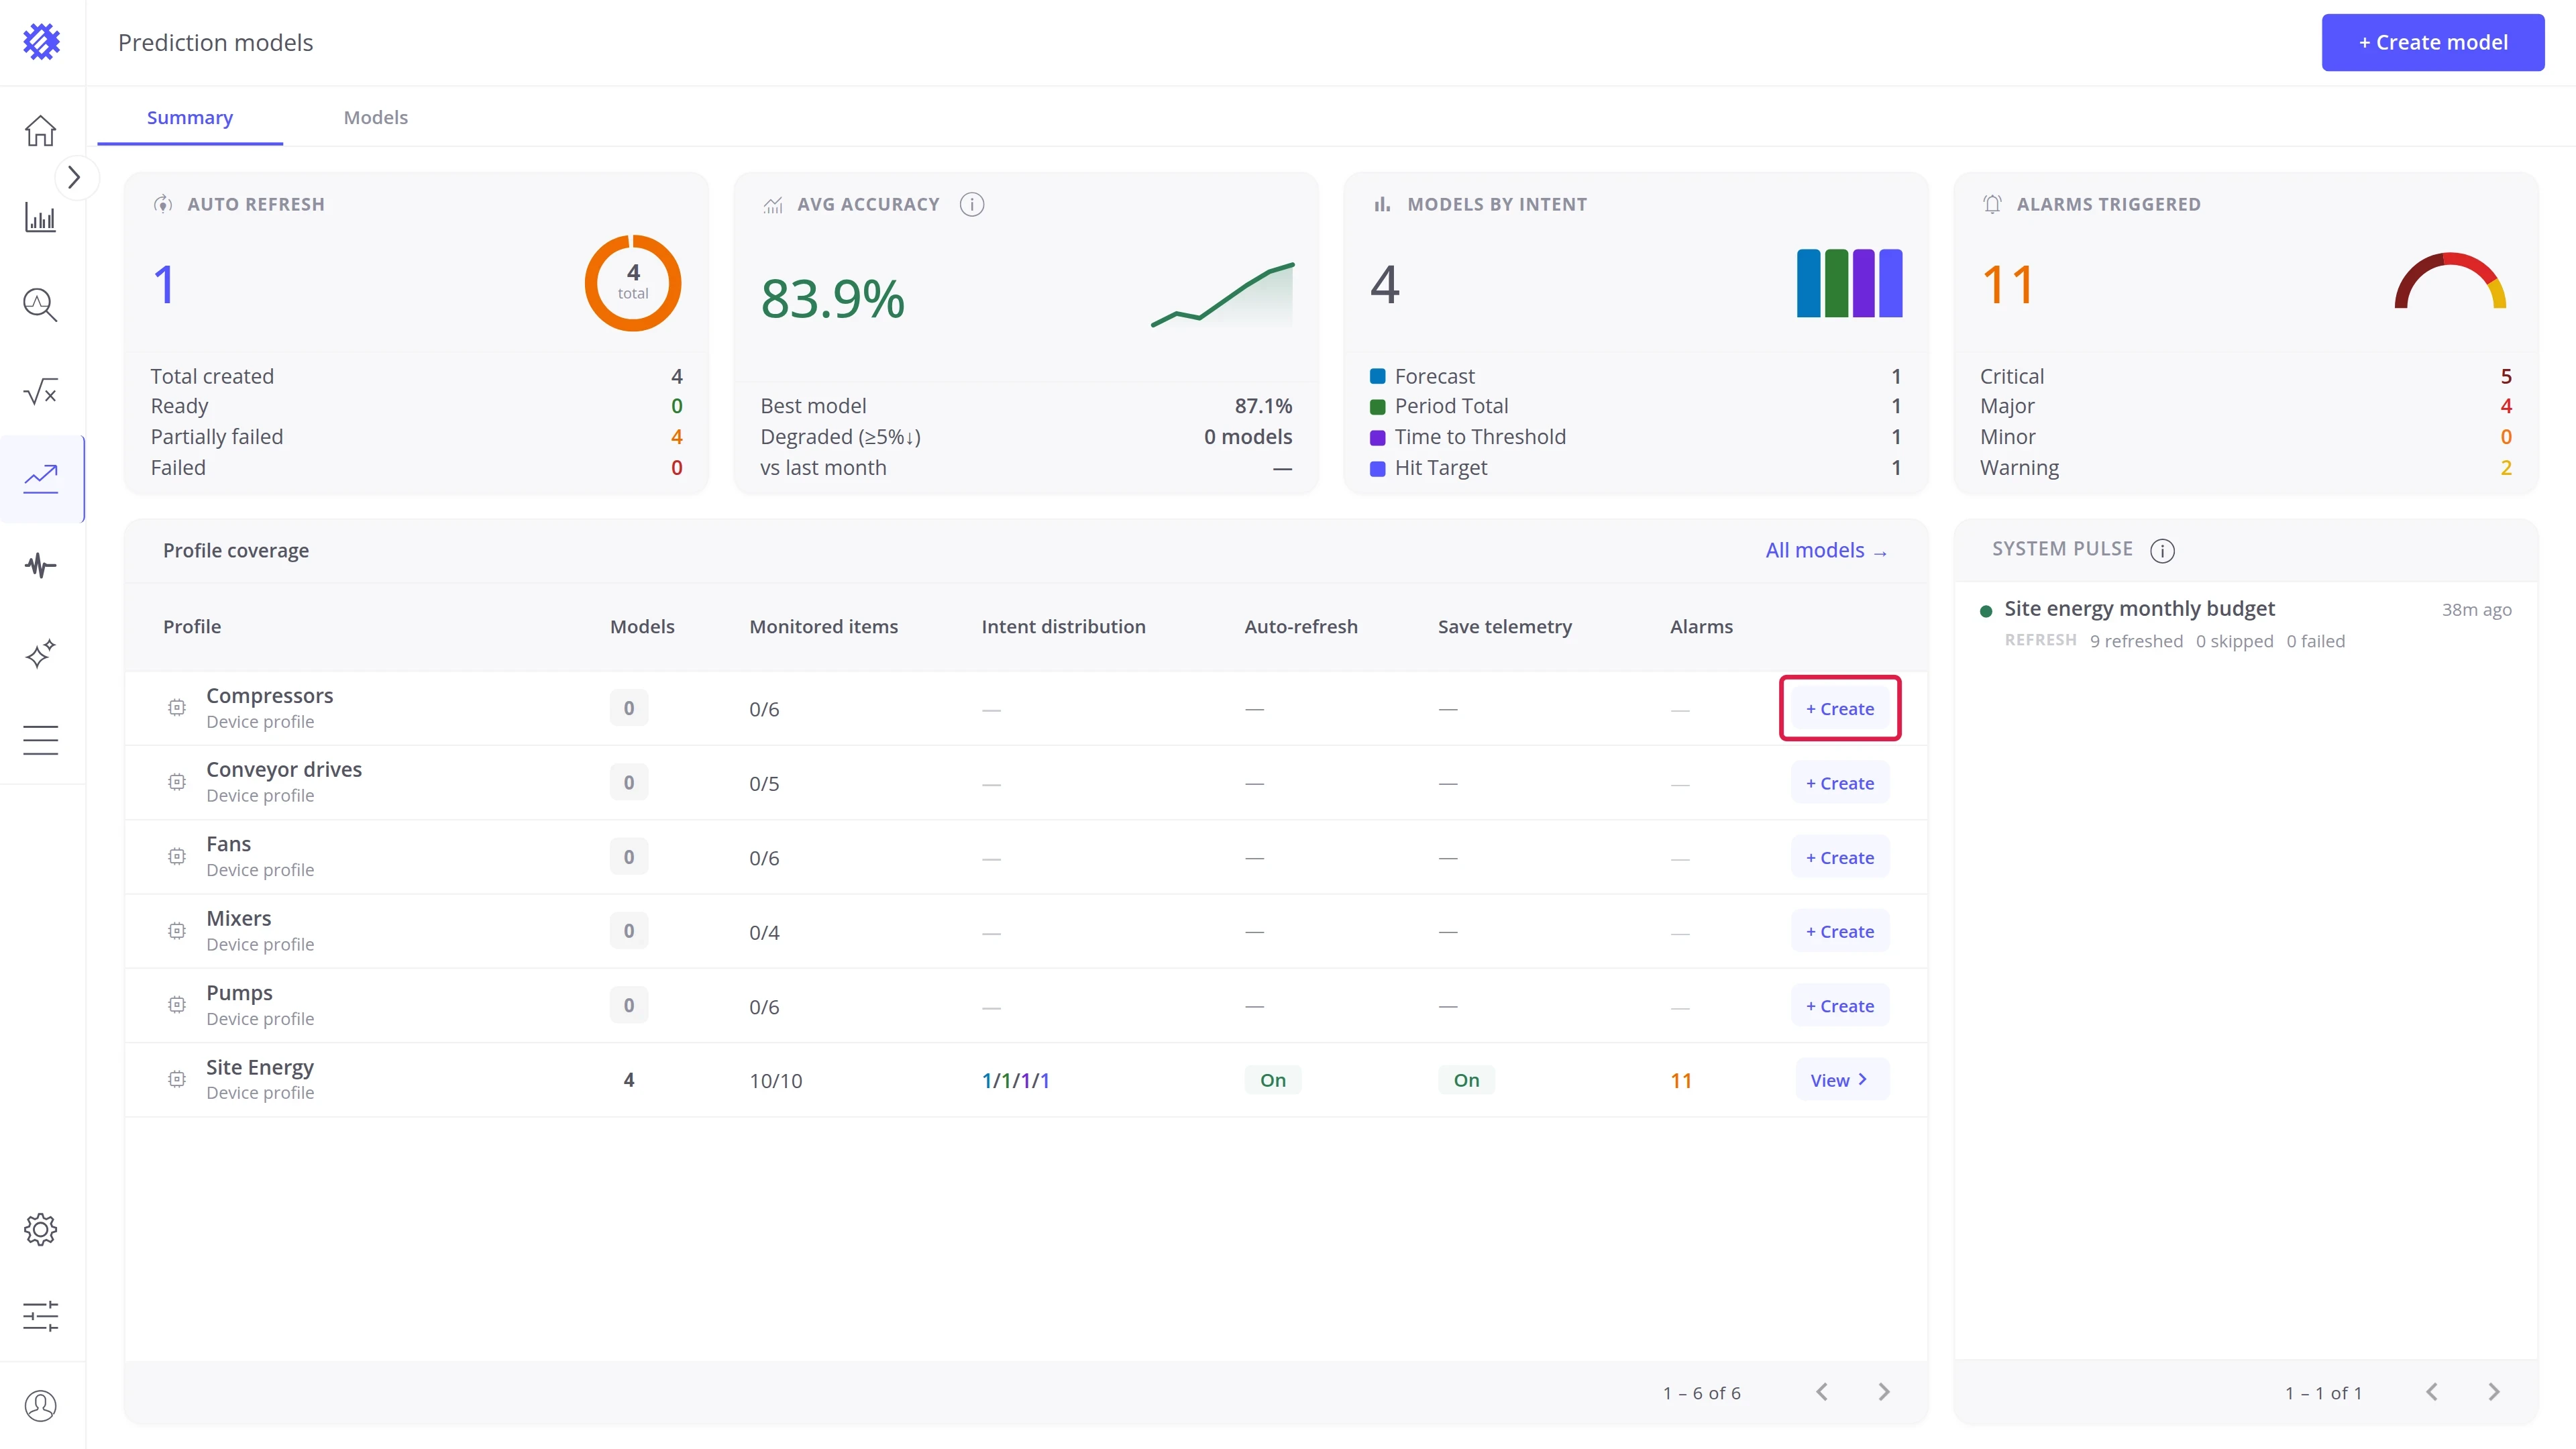
Section titled “Step 1: Open the wizard”Two entry points are available on the Prediction models page:
- Create model — button in the top-right corner, visible on both tabs.
- + Create — inline button on any profile row of the Profile coverage table. Opens the wizard with that profile pre-selected.
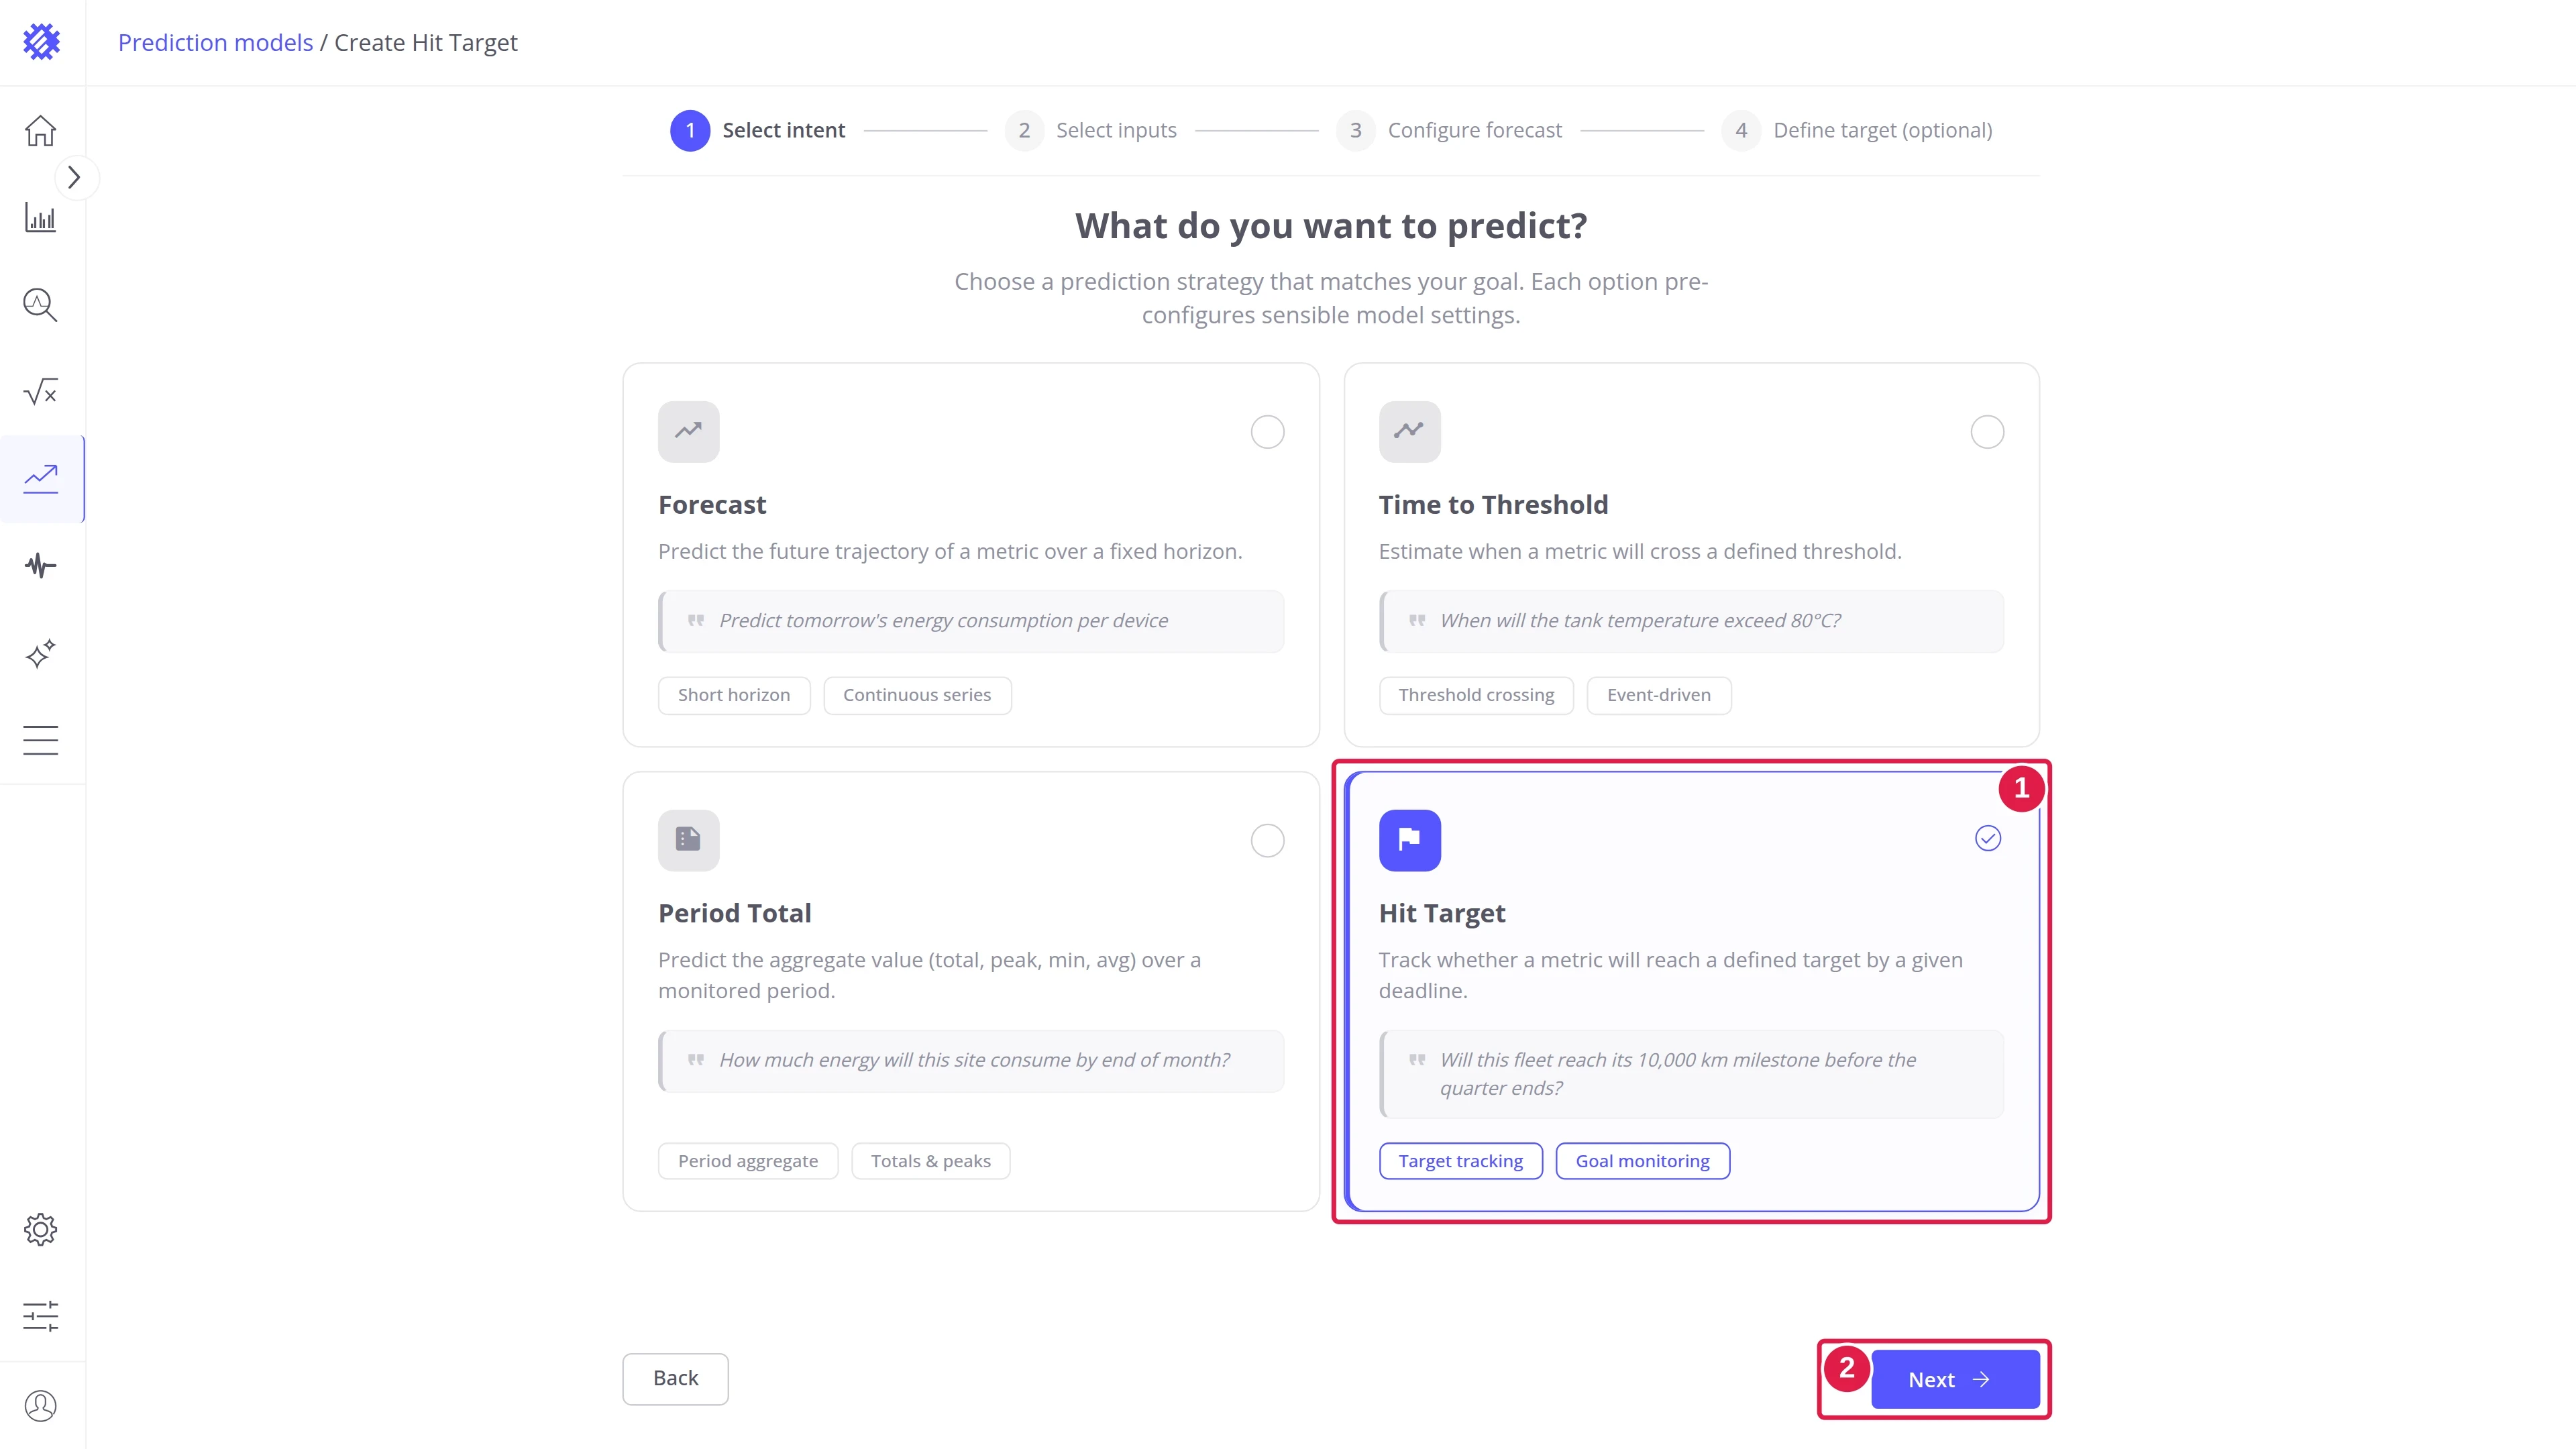
The wizard opens on What do you want to predict?:
- Select the Hit Target card (1).
- Click Next (2).
- The intent decides what the model reports and cannot be changed later.
- The other three intents are described in Forecast, Period Total, and Time to Threshold.
Step 2: Configure inputs
Section titled “Step 2: Configure inputs”The Inputs configuration step defines the items the model trains on and the metric the target is measured on.
Entity selection — select the entity type and the profile to predict:
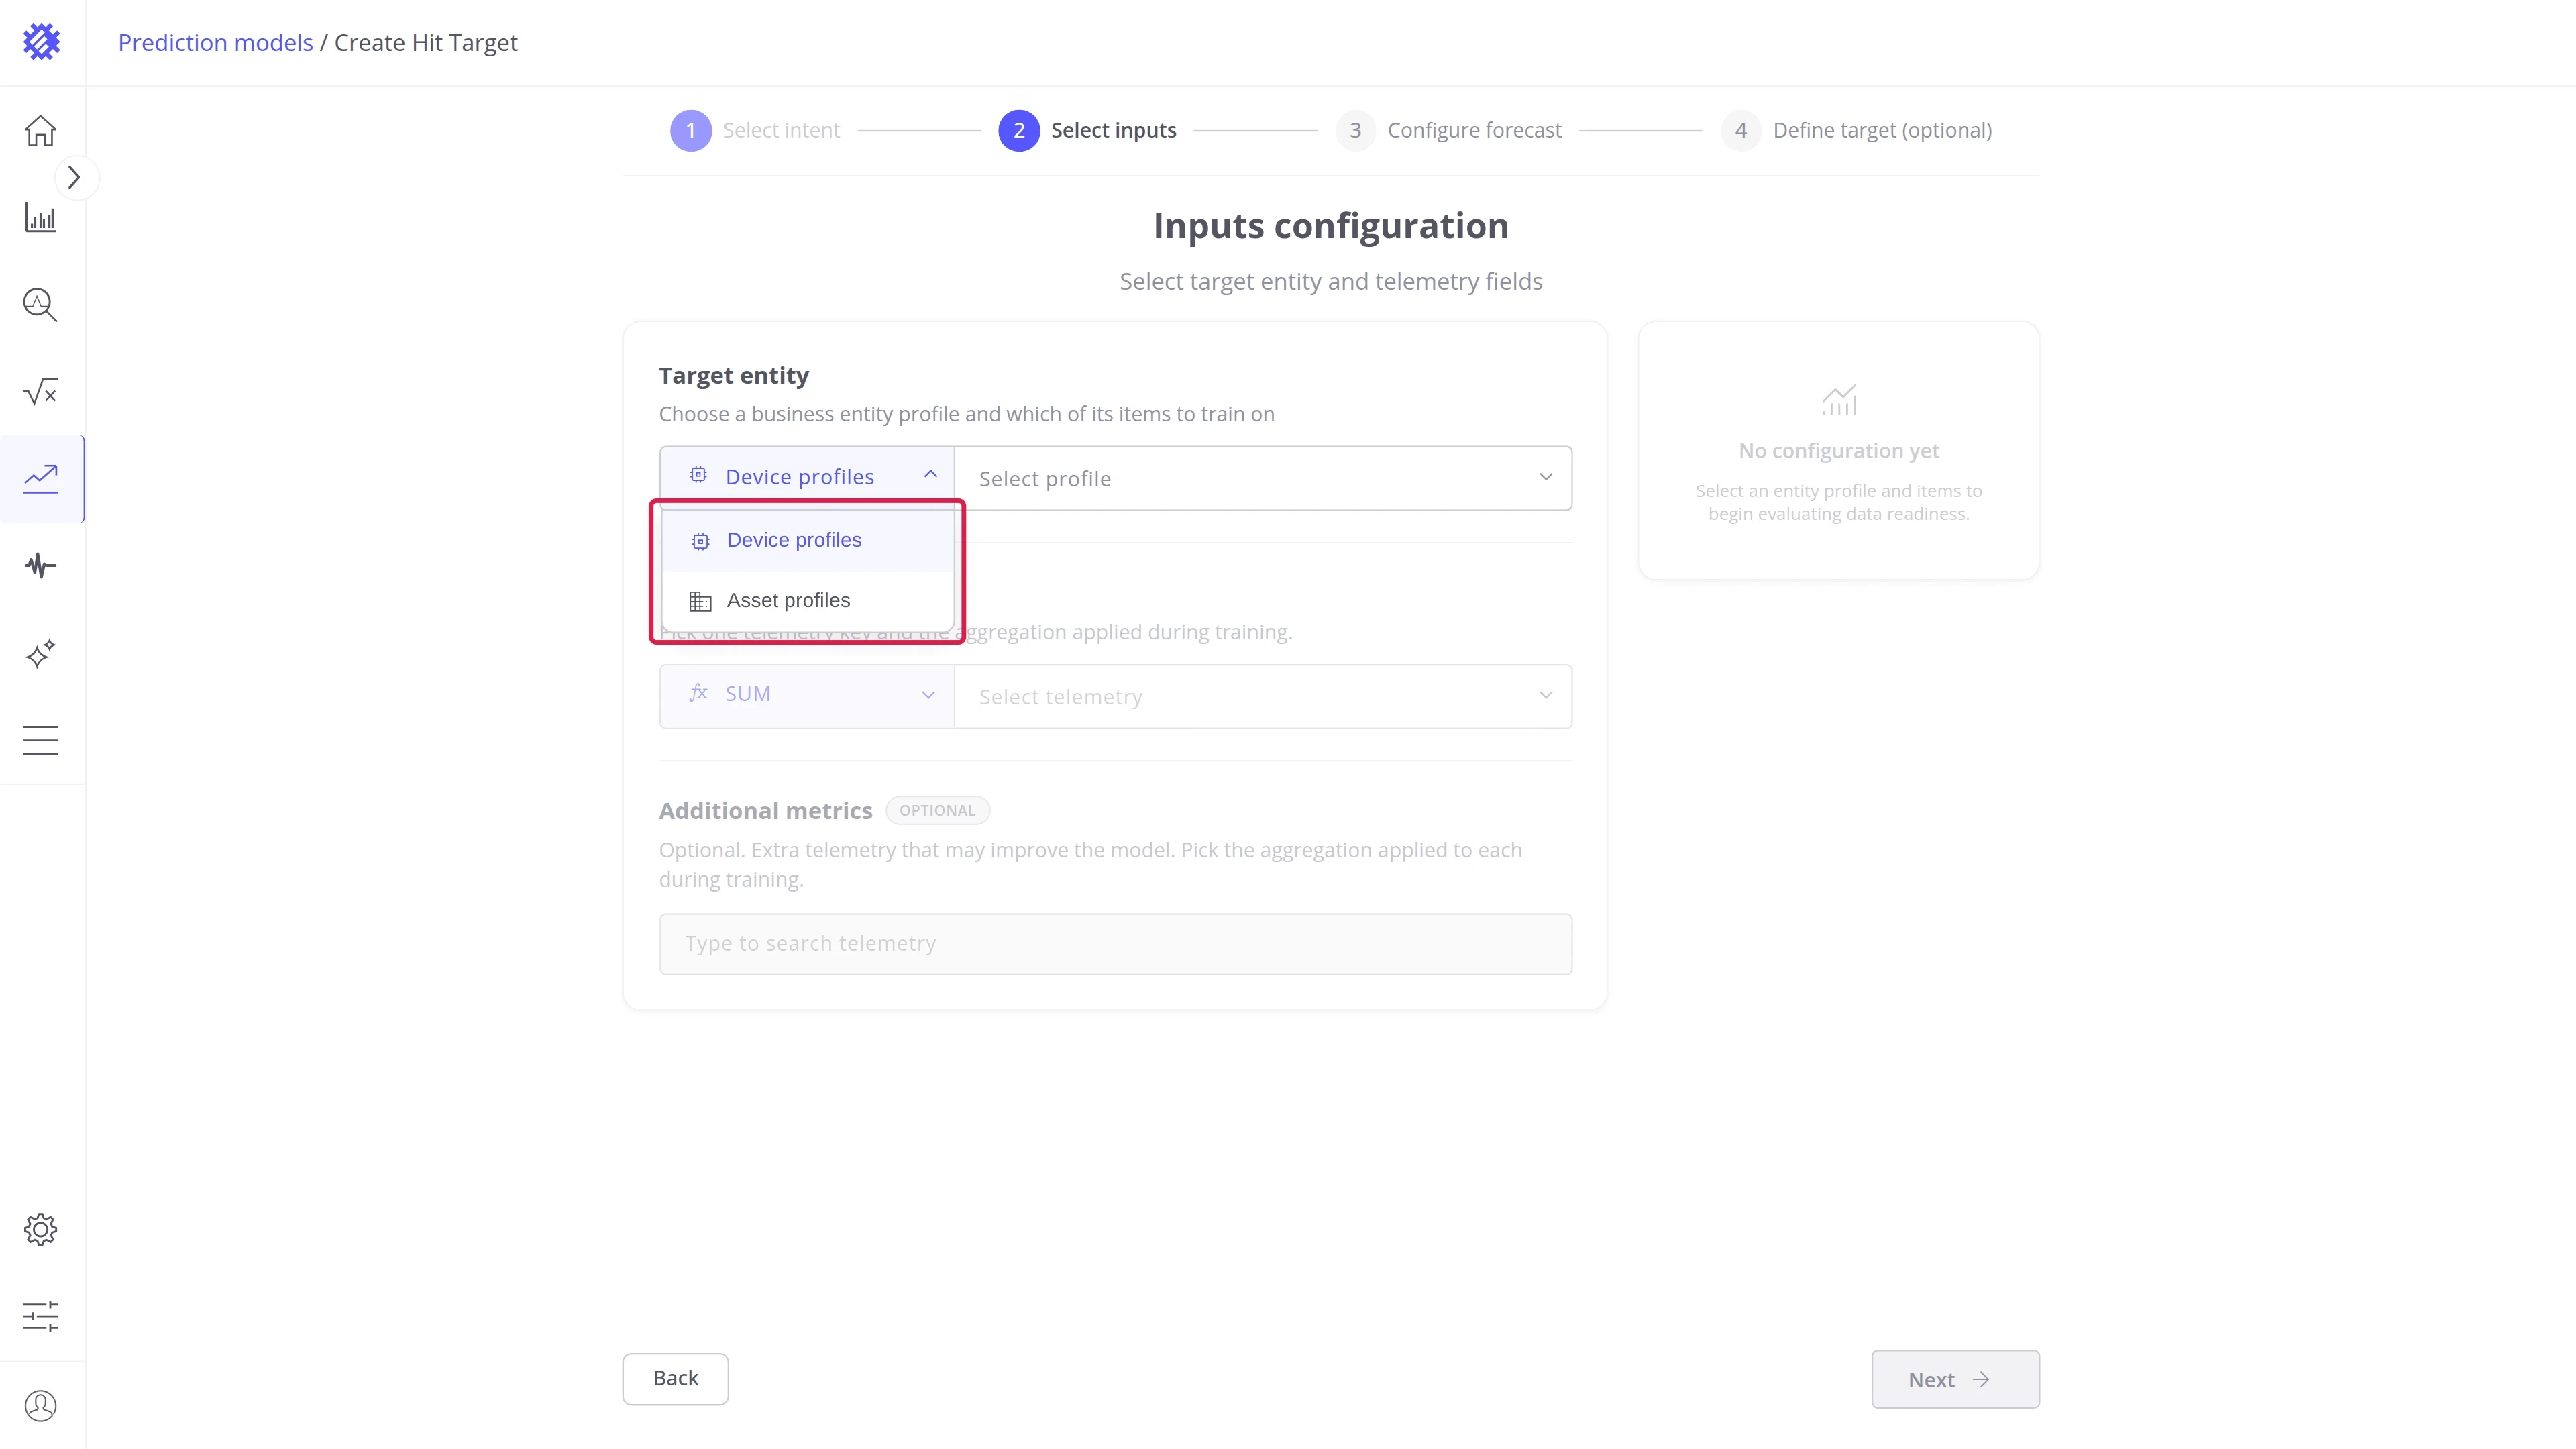
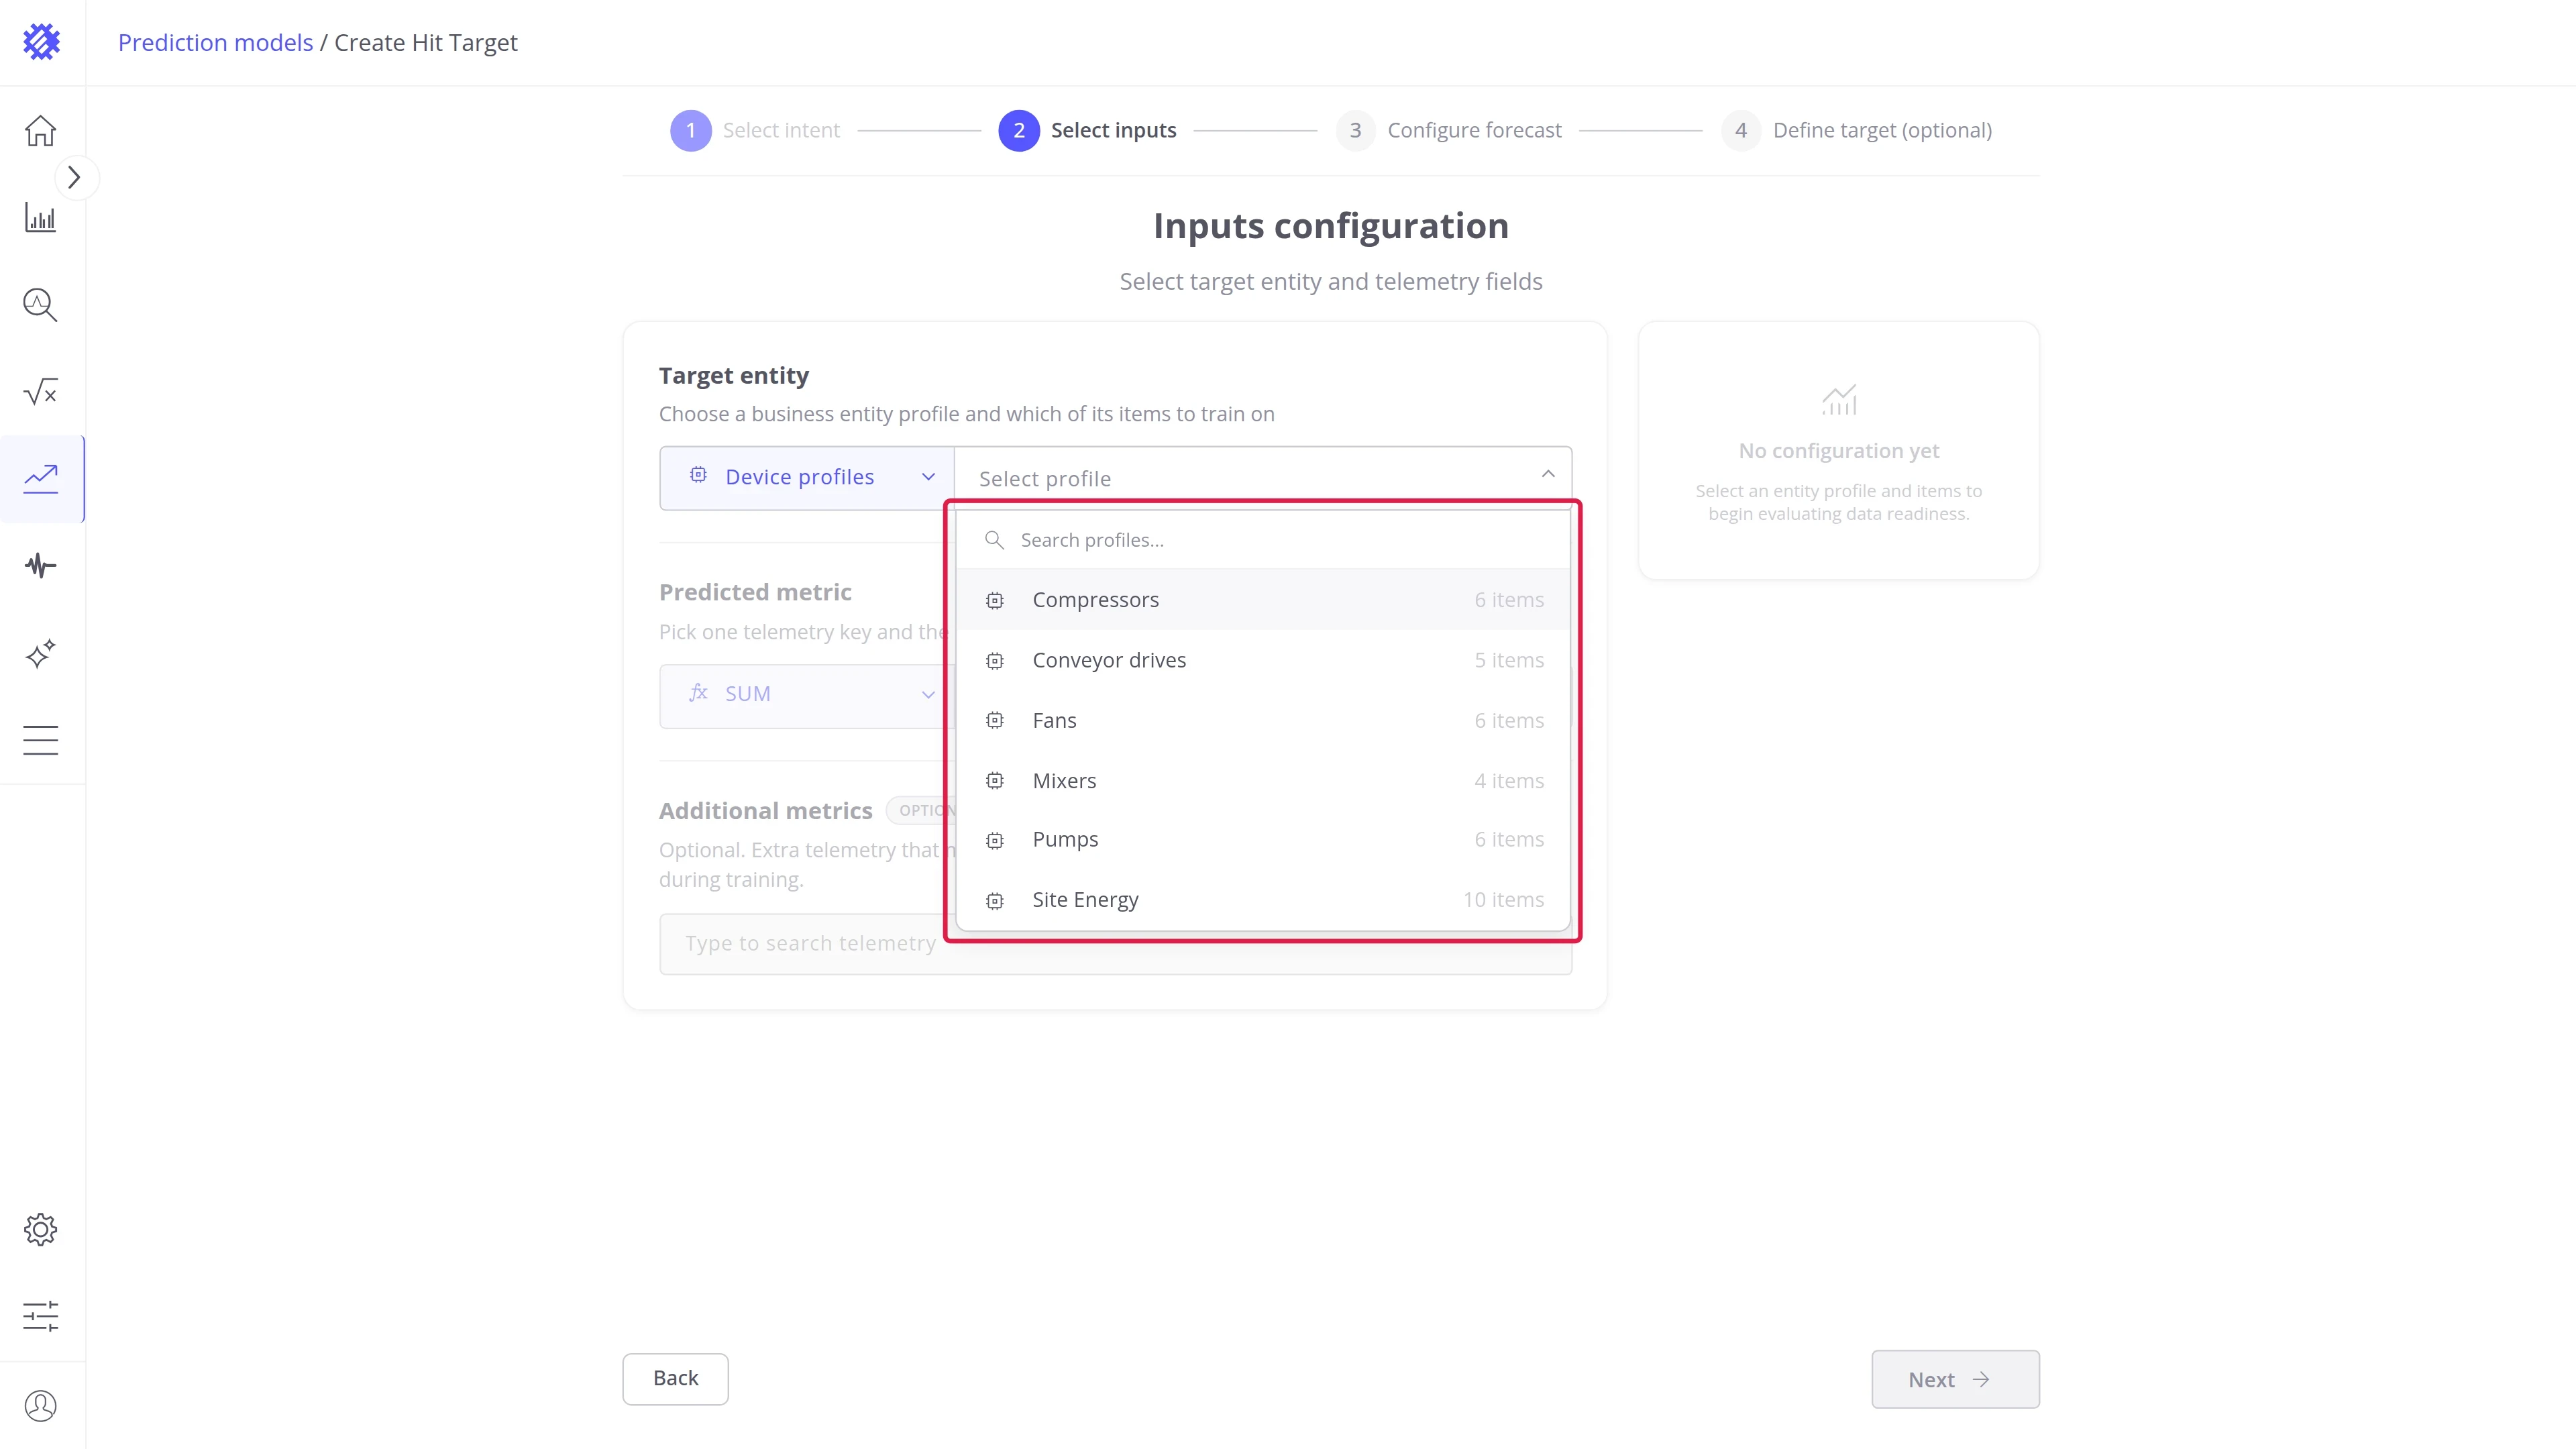
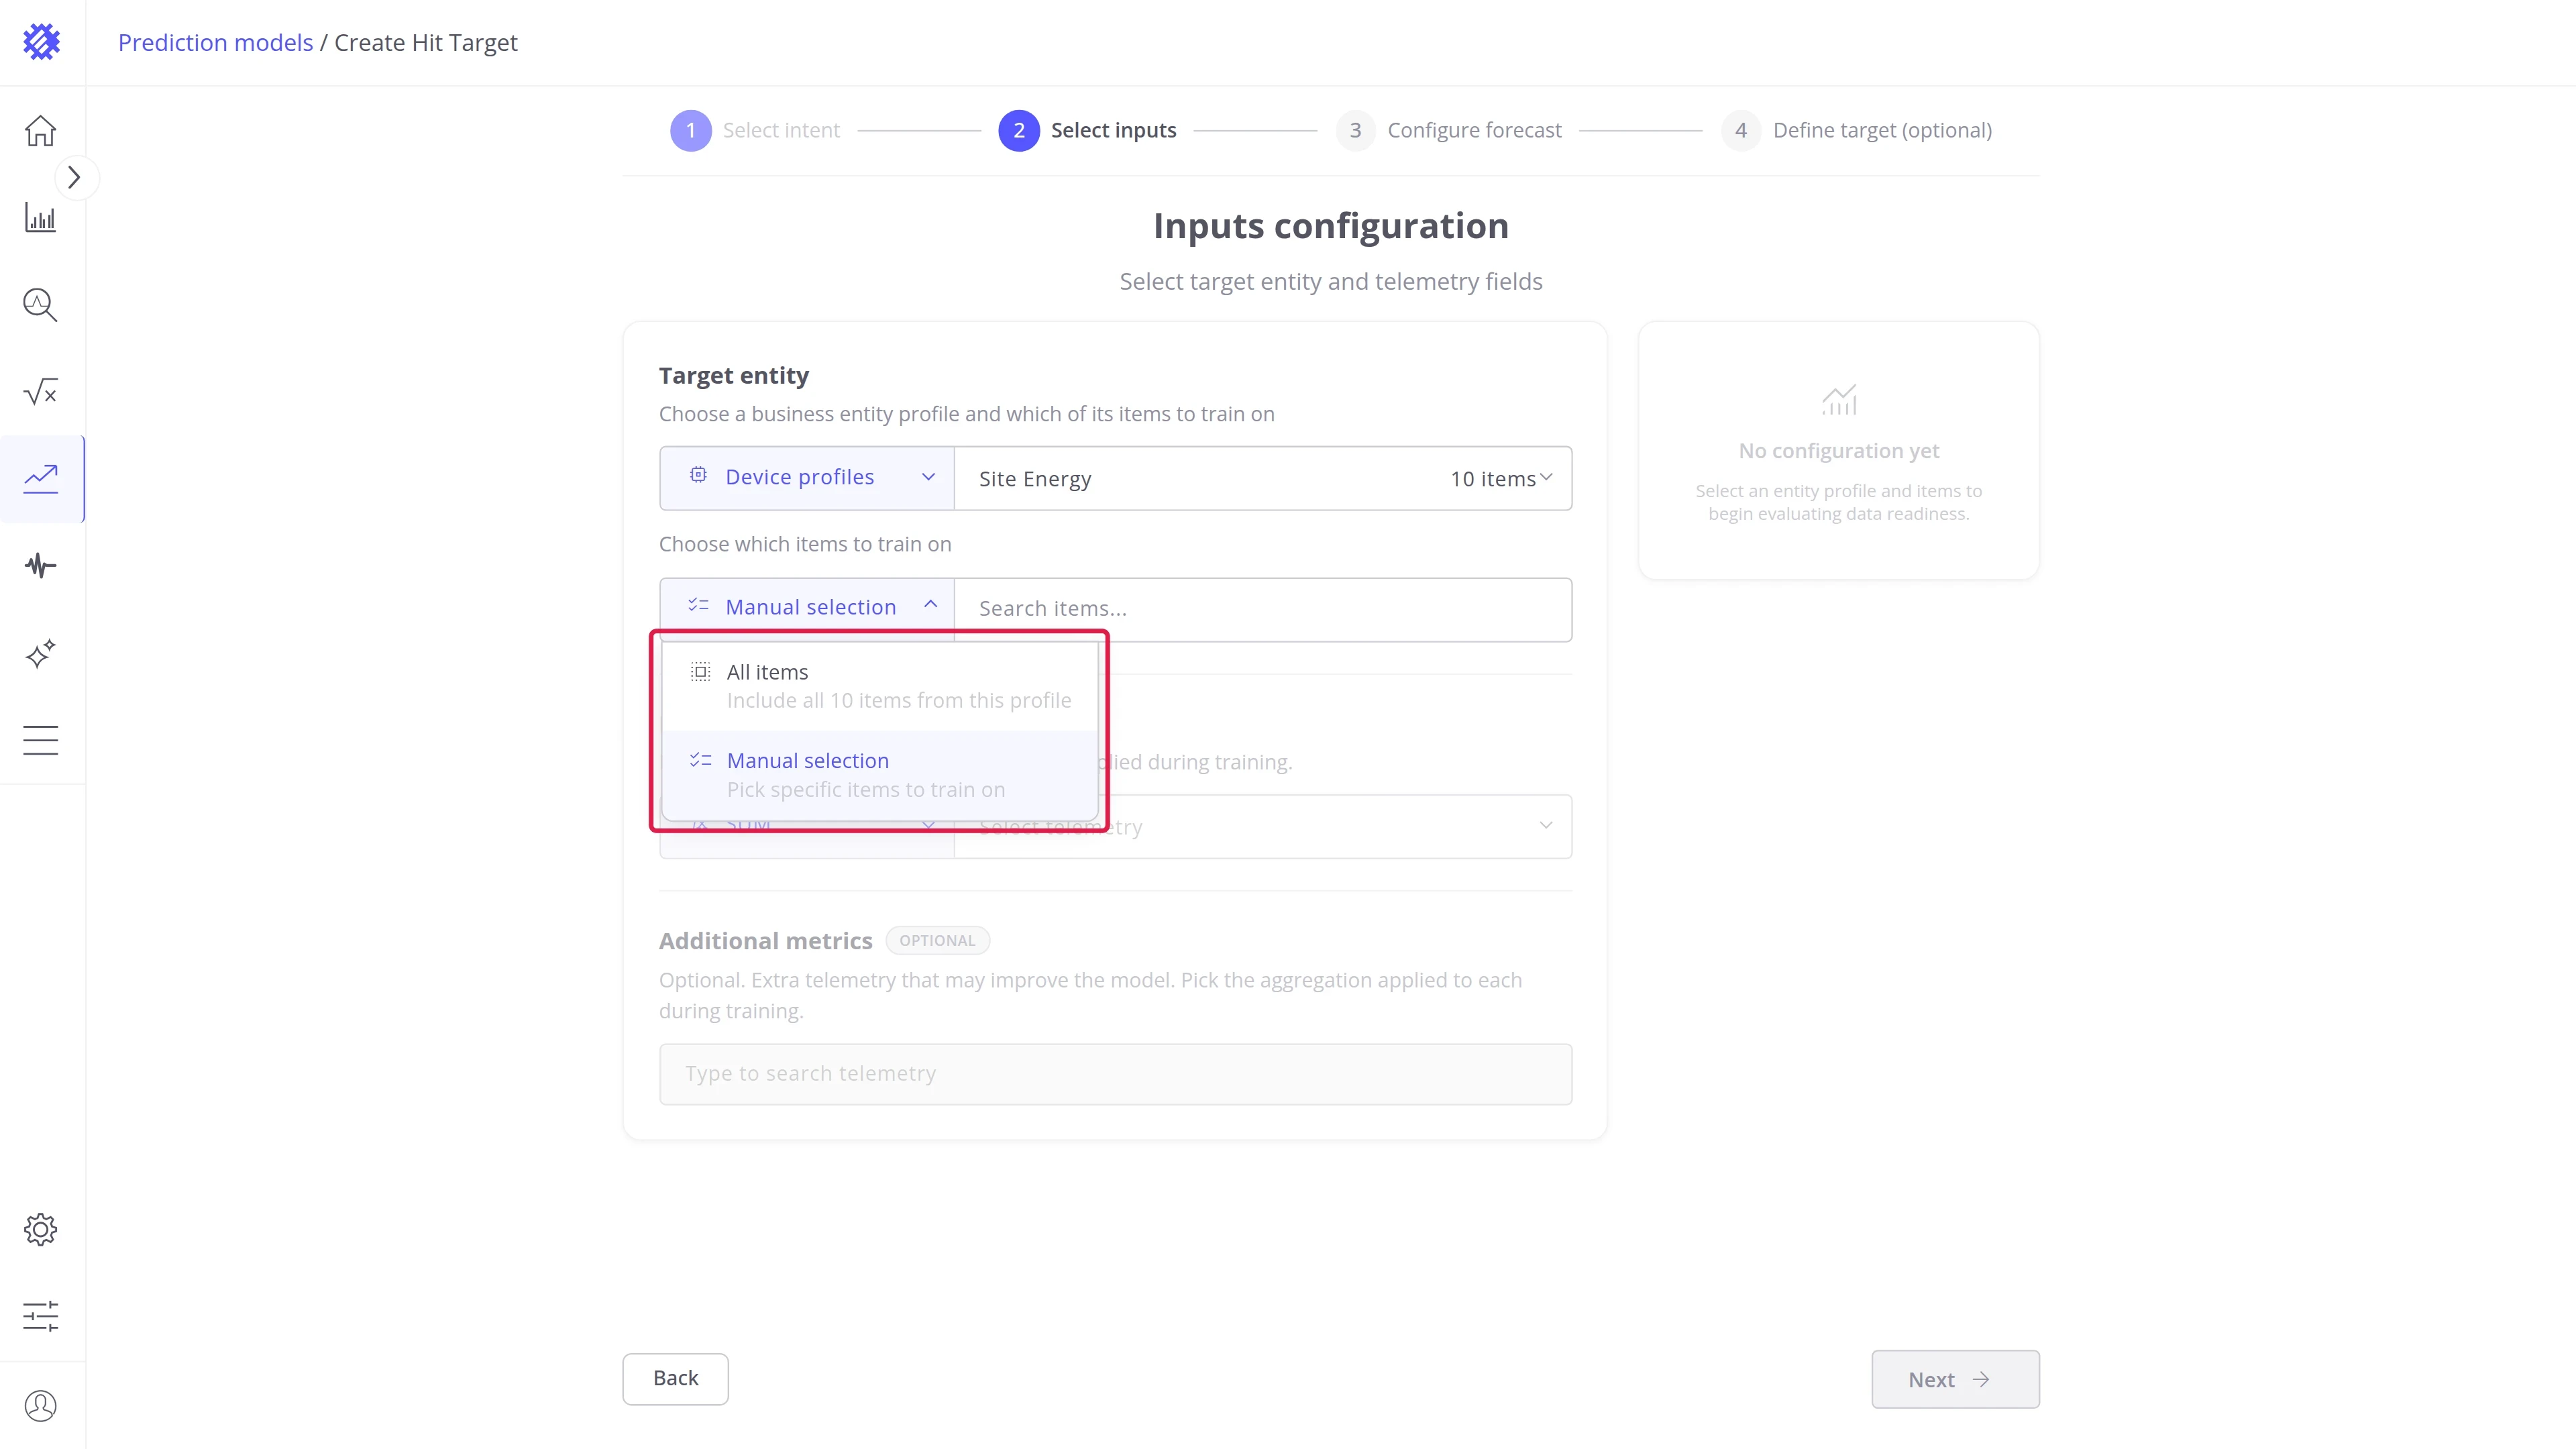
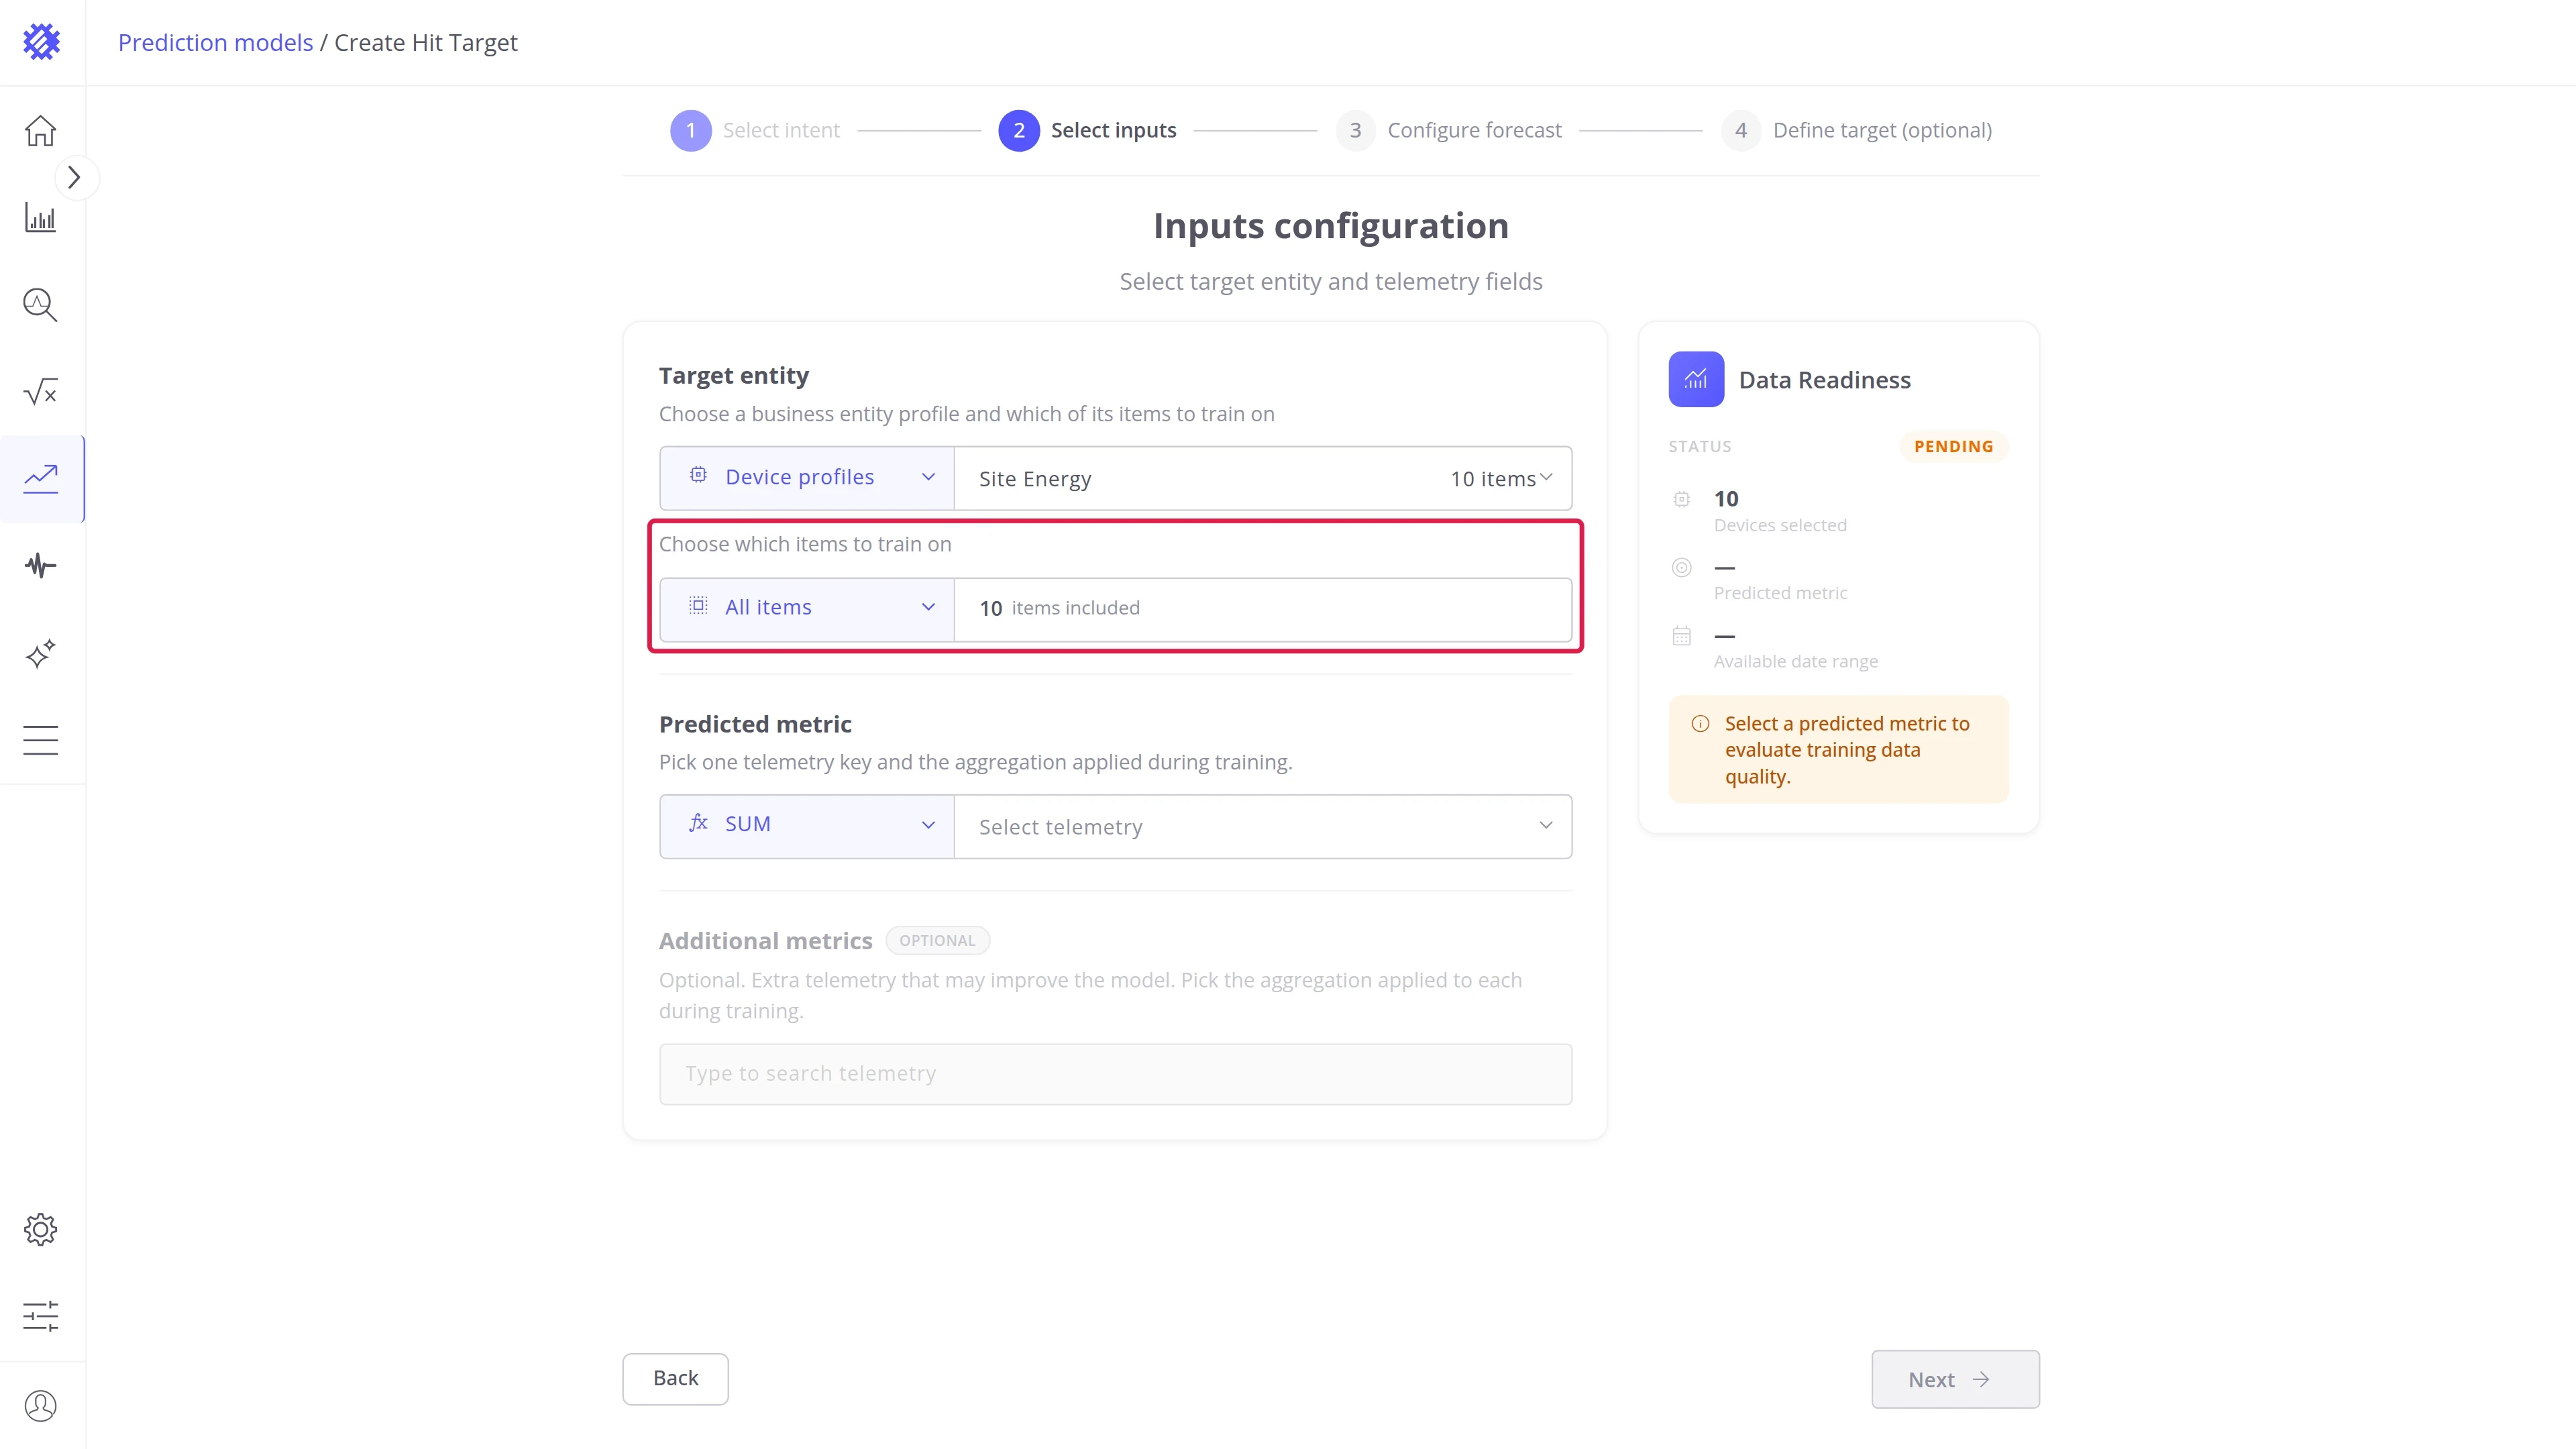
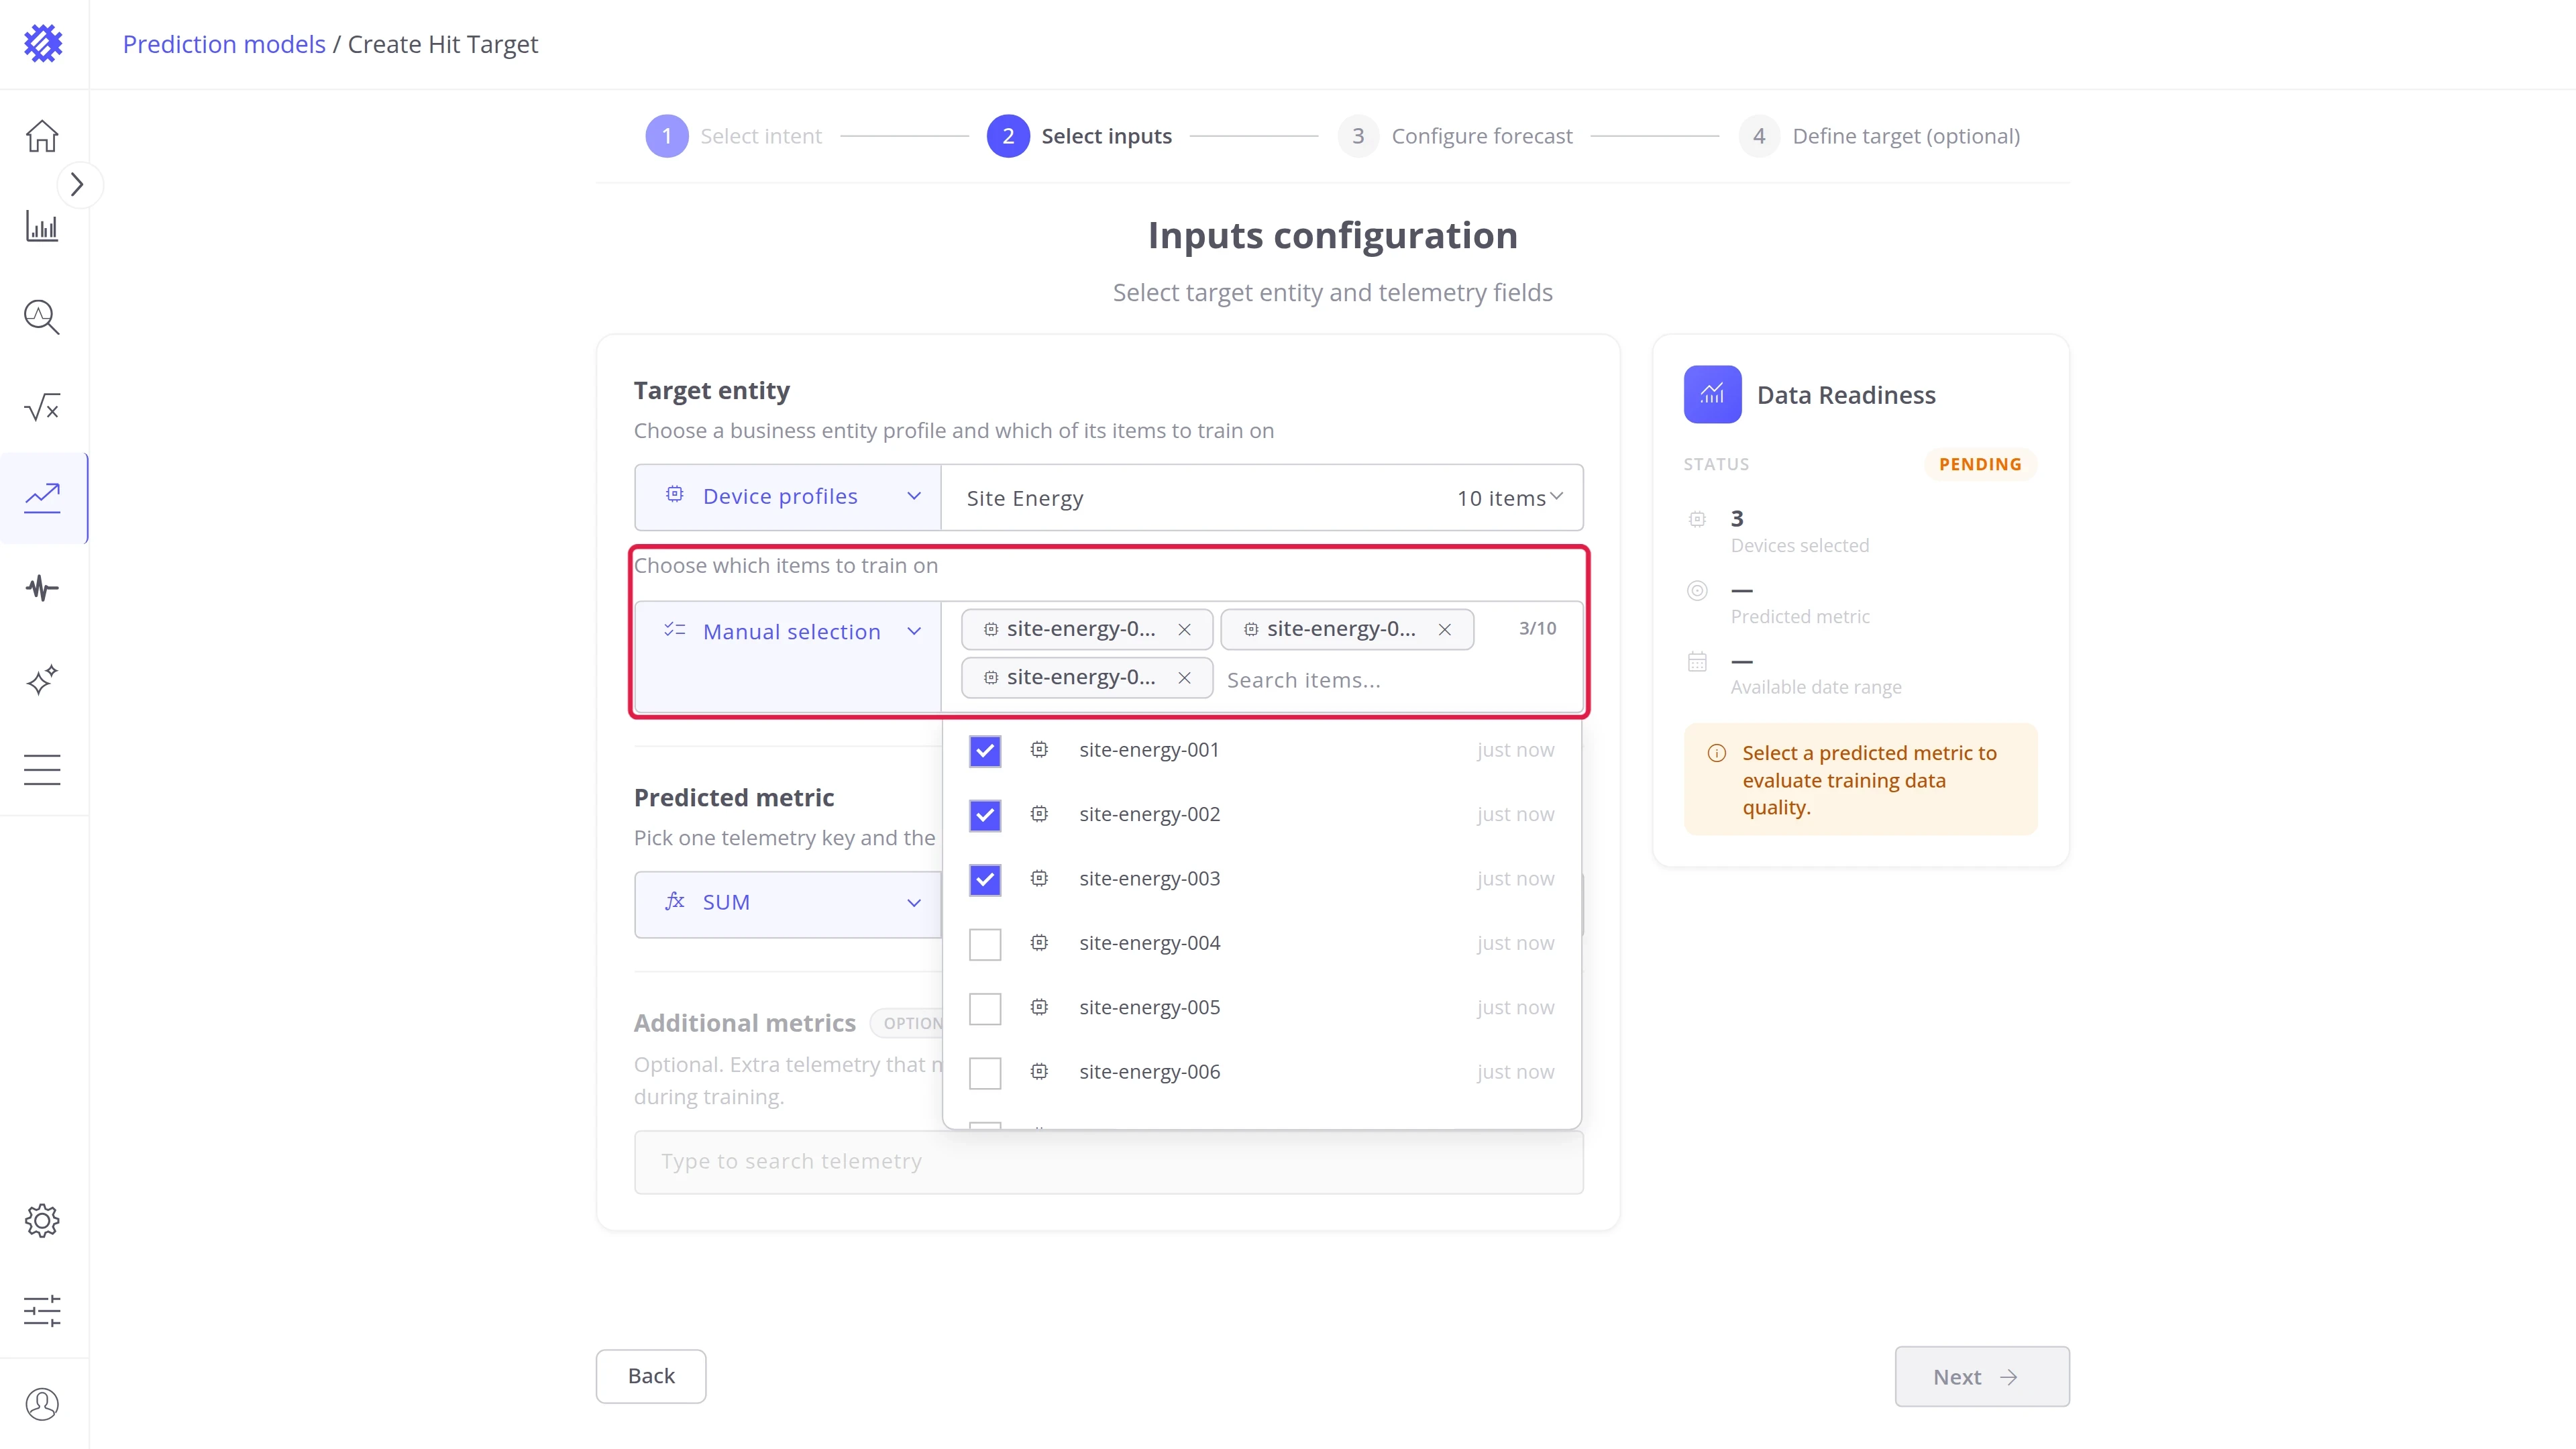
Item selection — choose which items of the profile train the model:
| Mode | Behavior |
|---|---|
| All items | Includes every item in the profile, including devices added to it later. |
| Manual selection | Pick specific items from a searchable list. |
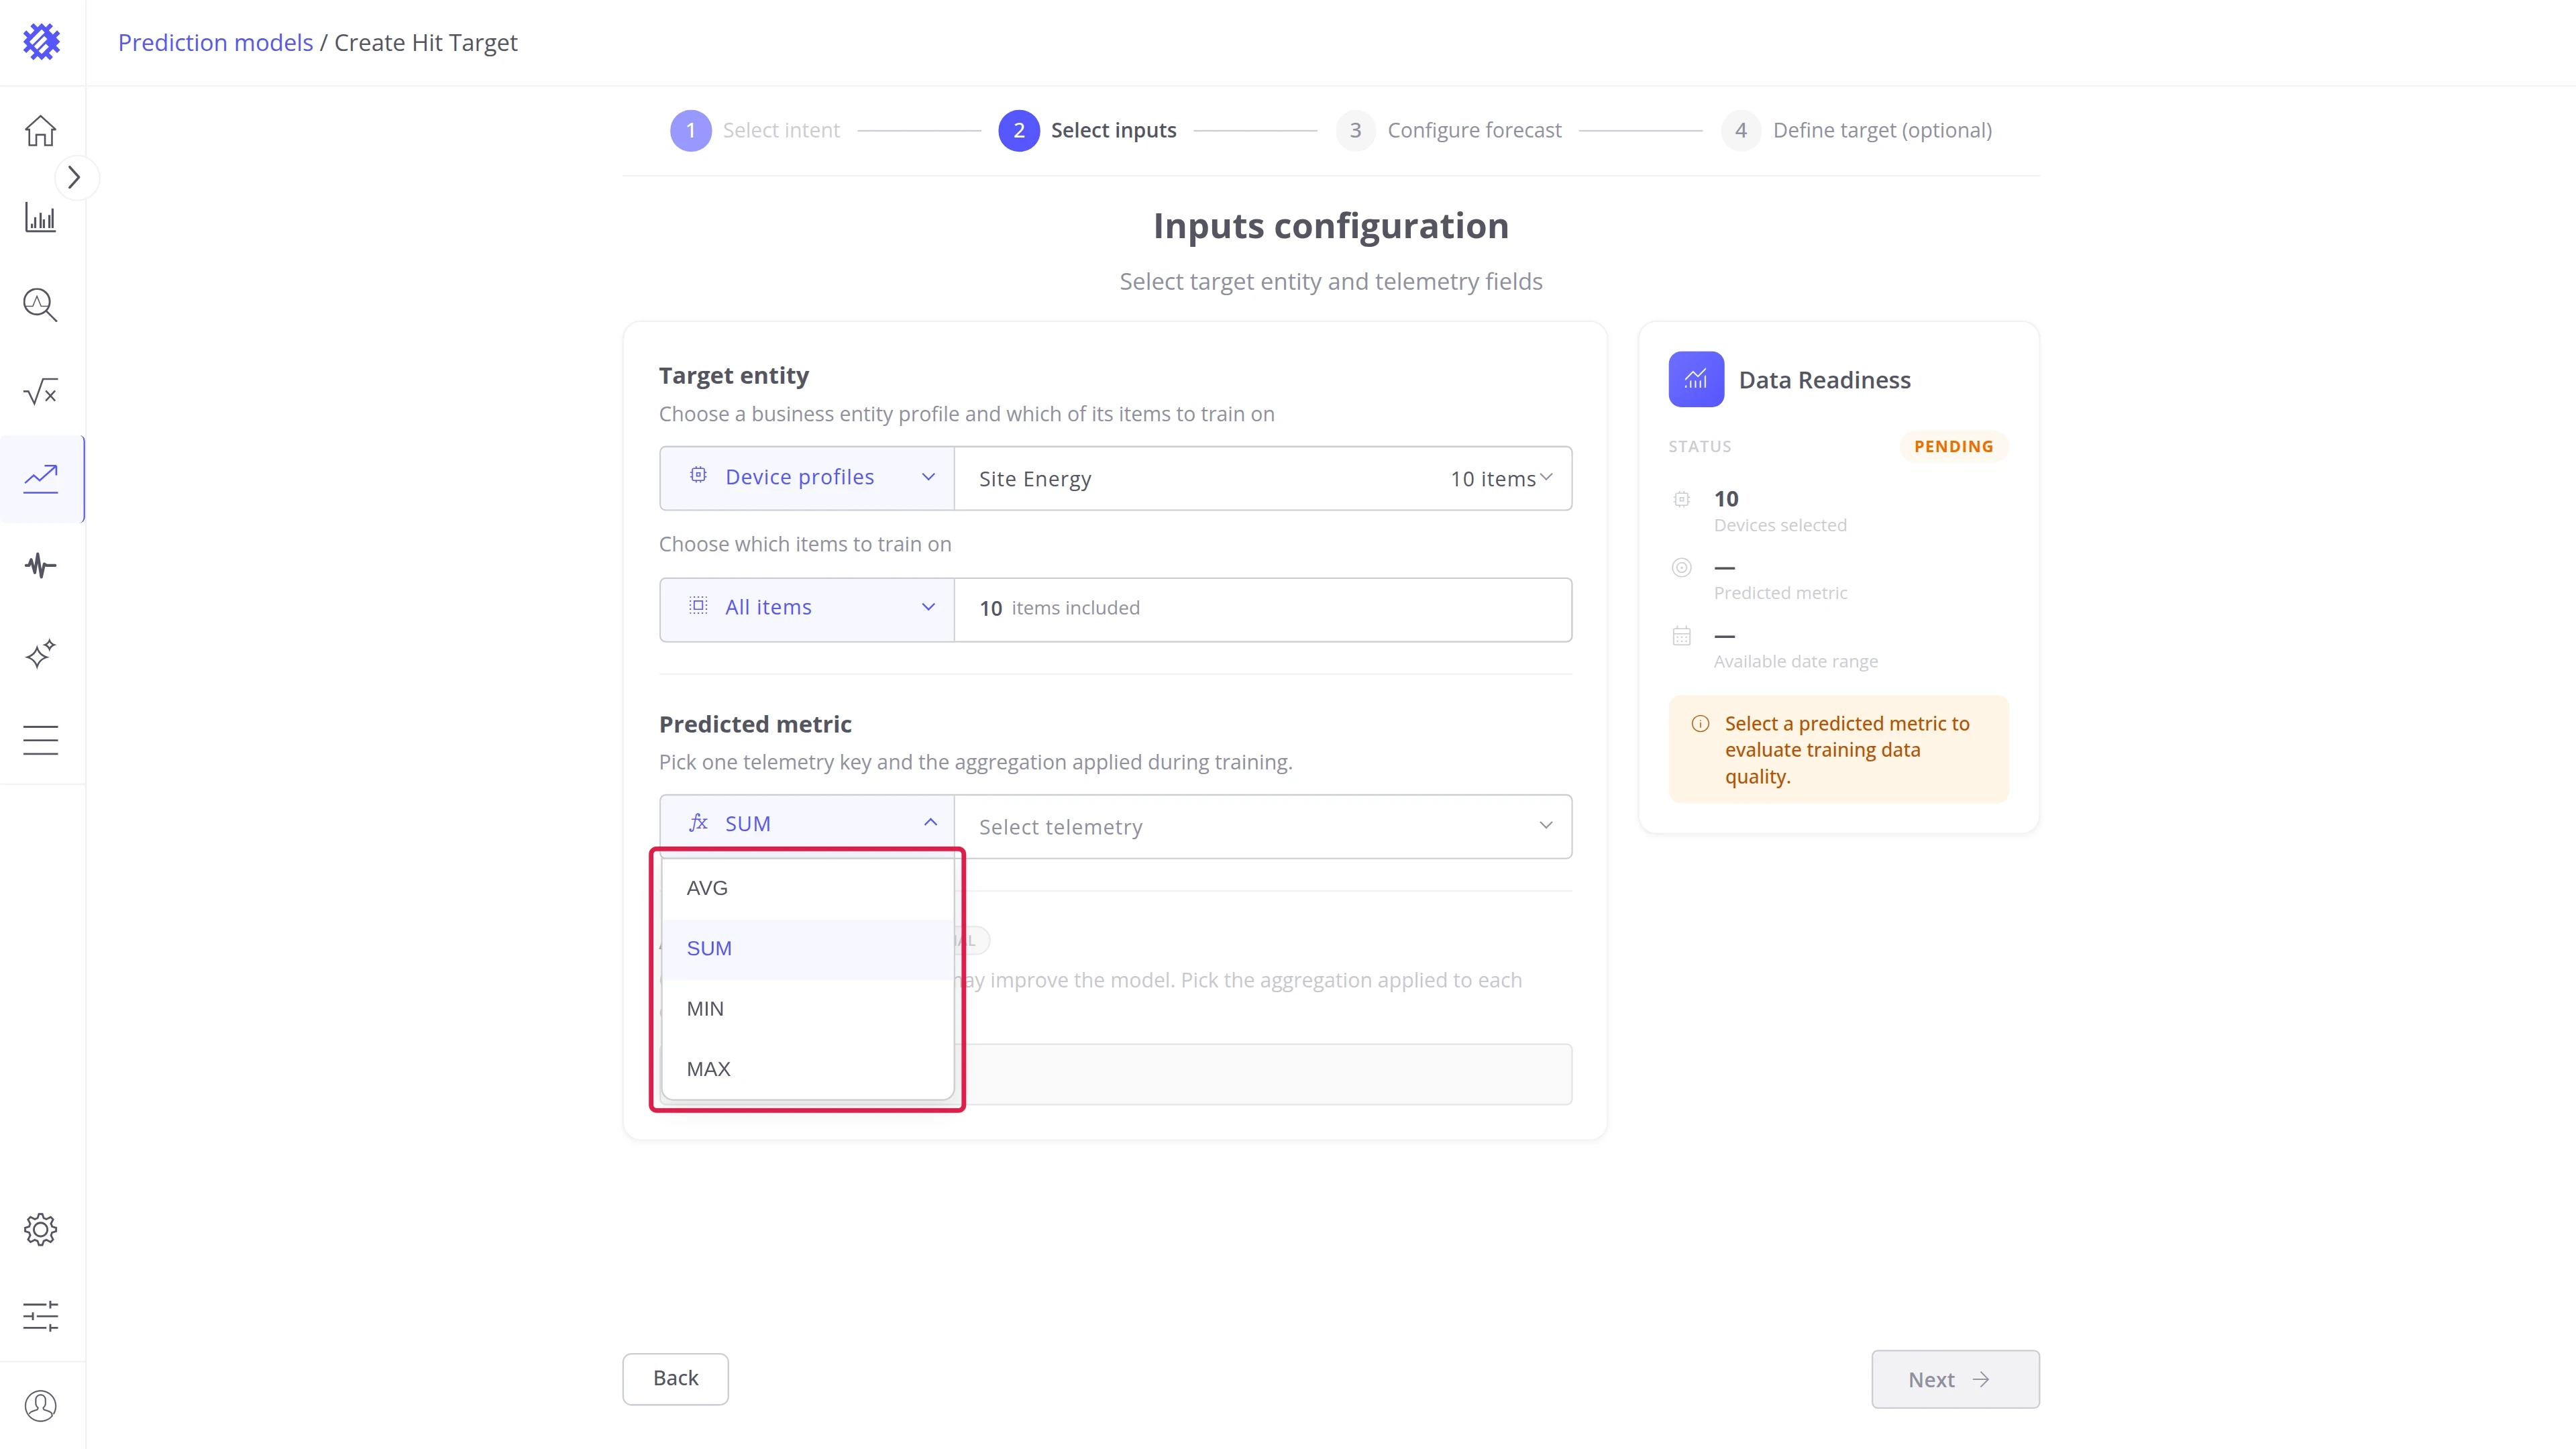
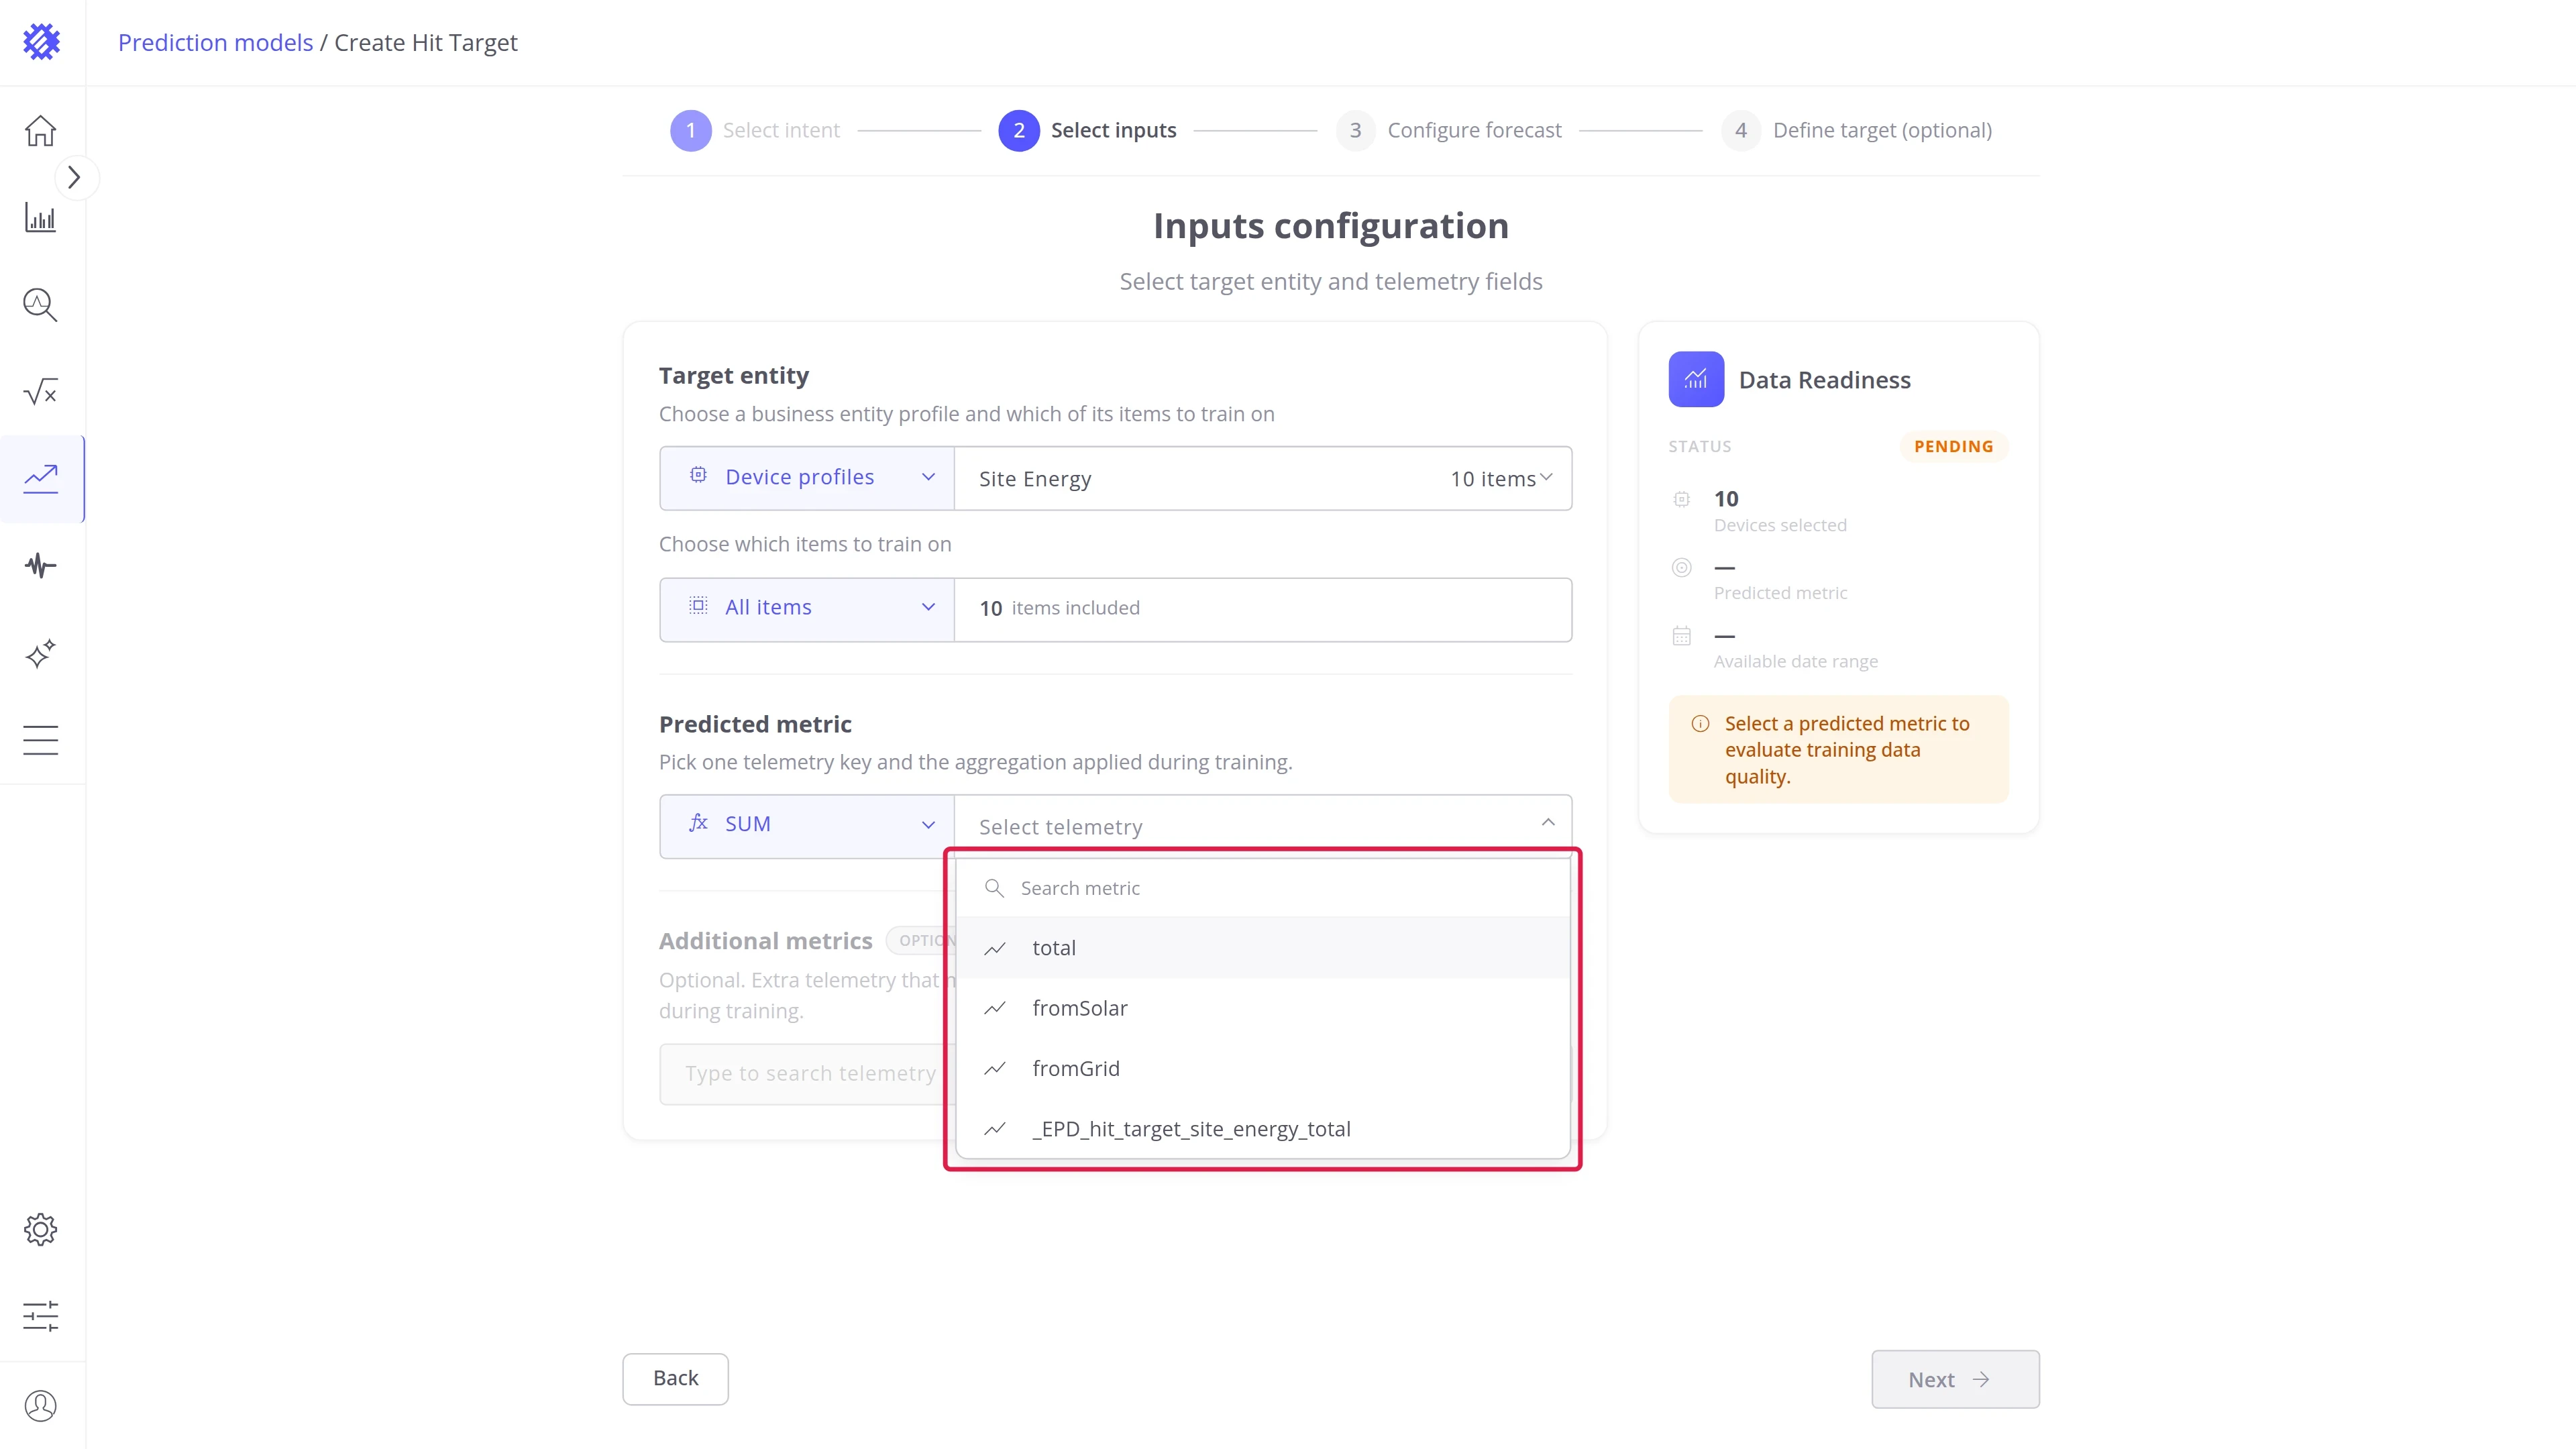
Predicted metric — pick the telemetry key to forecast and the aggregation applied to it during training. The target in step 4 is measured on this metric:
| Aggregation | Use for |
|---|---|
| SUM | Counters such as energy, water, or produced units. |
| AVG | Levels such as temperature, pressure, or humidity. |
| MAX, MIN | Peaks and troughs, for example the highest demand of an hour. |
The aggregation turns every reading inside one bucket into a single value. For a budget or a quota, pick SUM, so the running total adds up the real consumption or output.
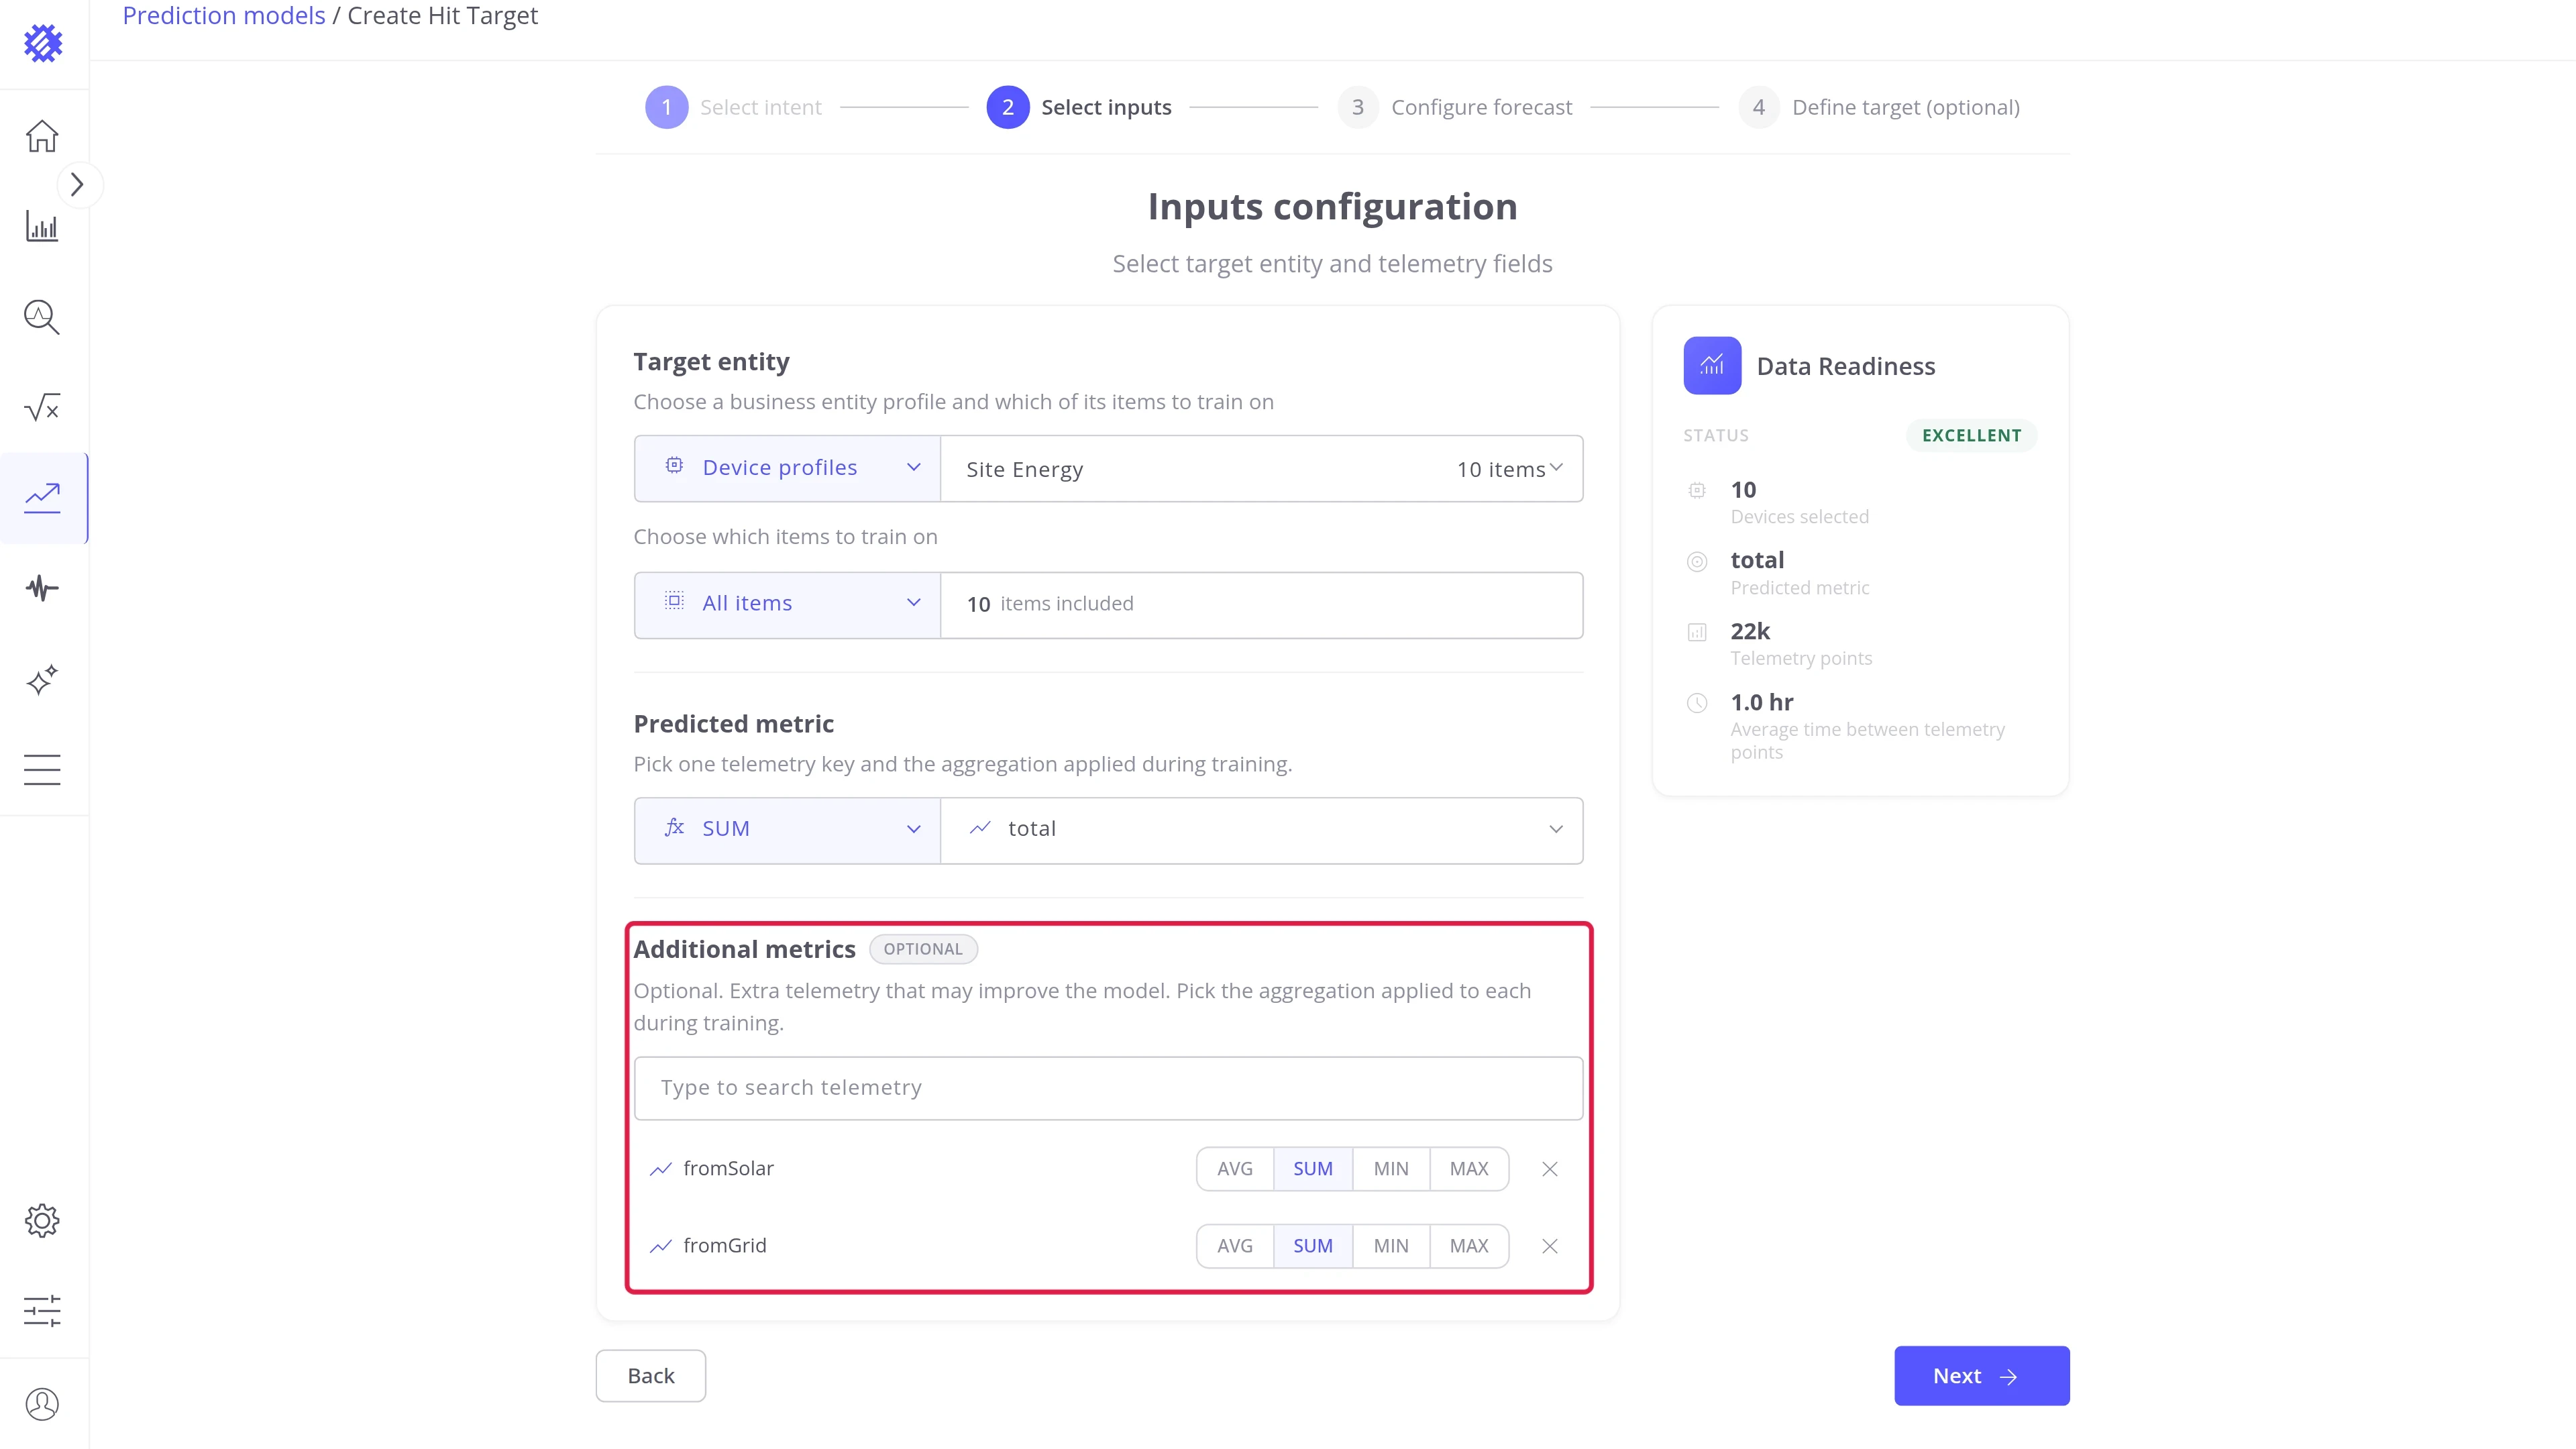
Additional metrics — optional extra telemetry that may explain the predicted one, each with its own aggregation. Type to search the keys of the profile:
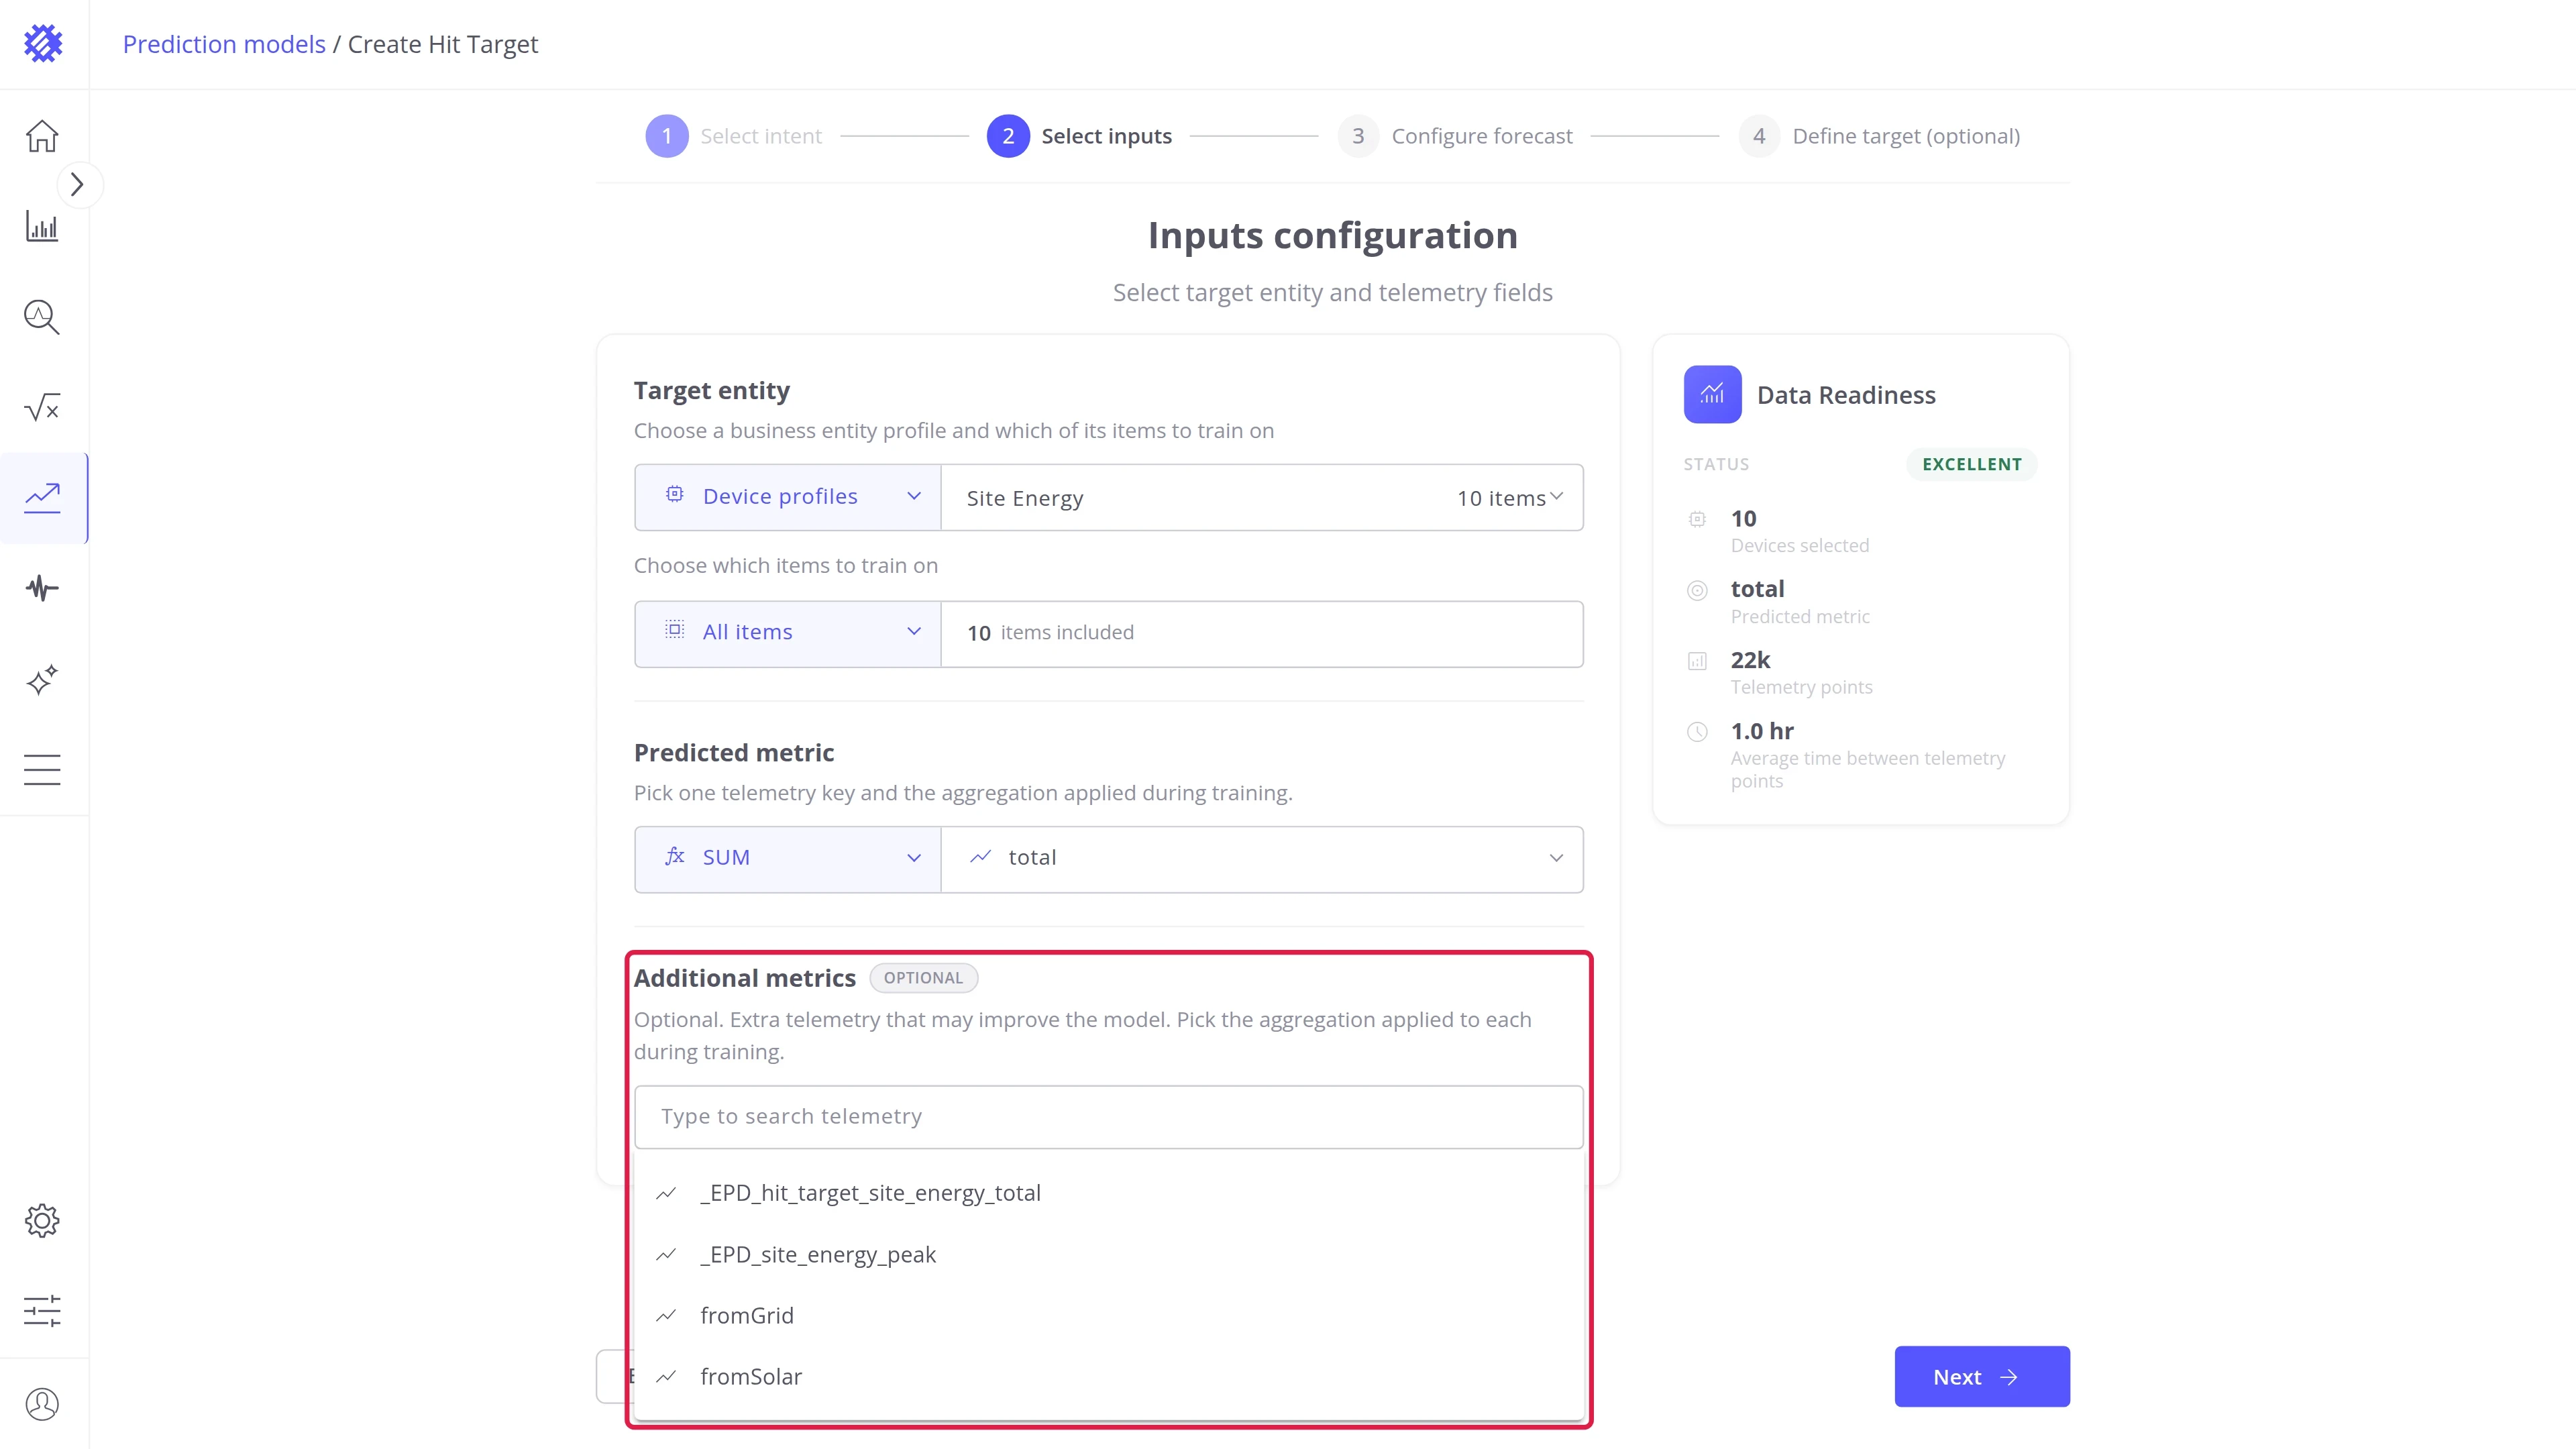
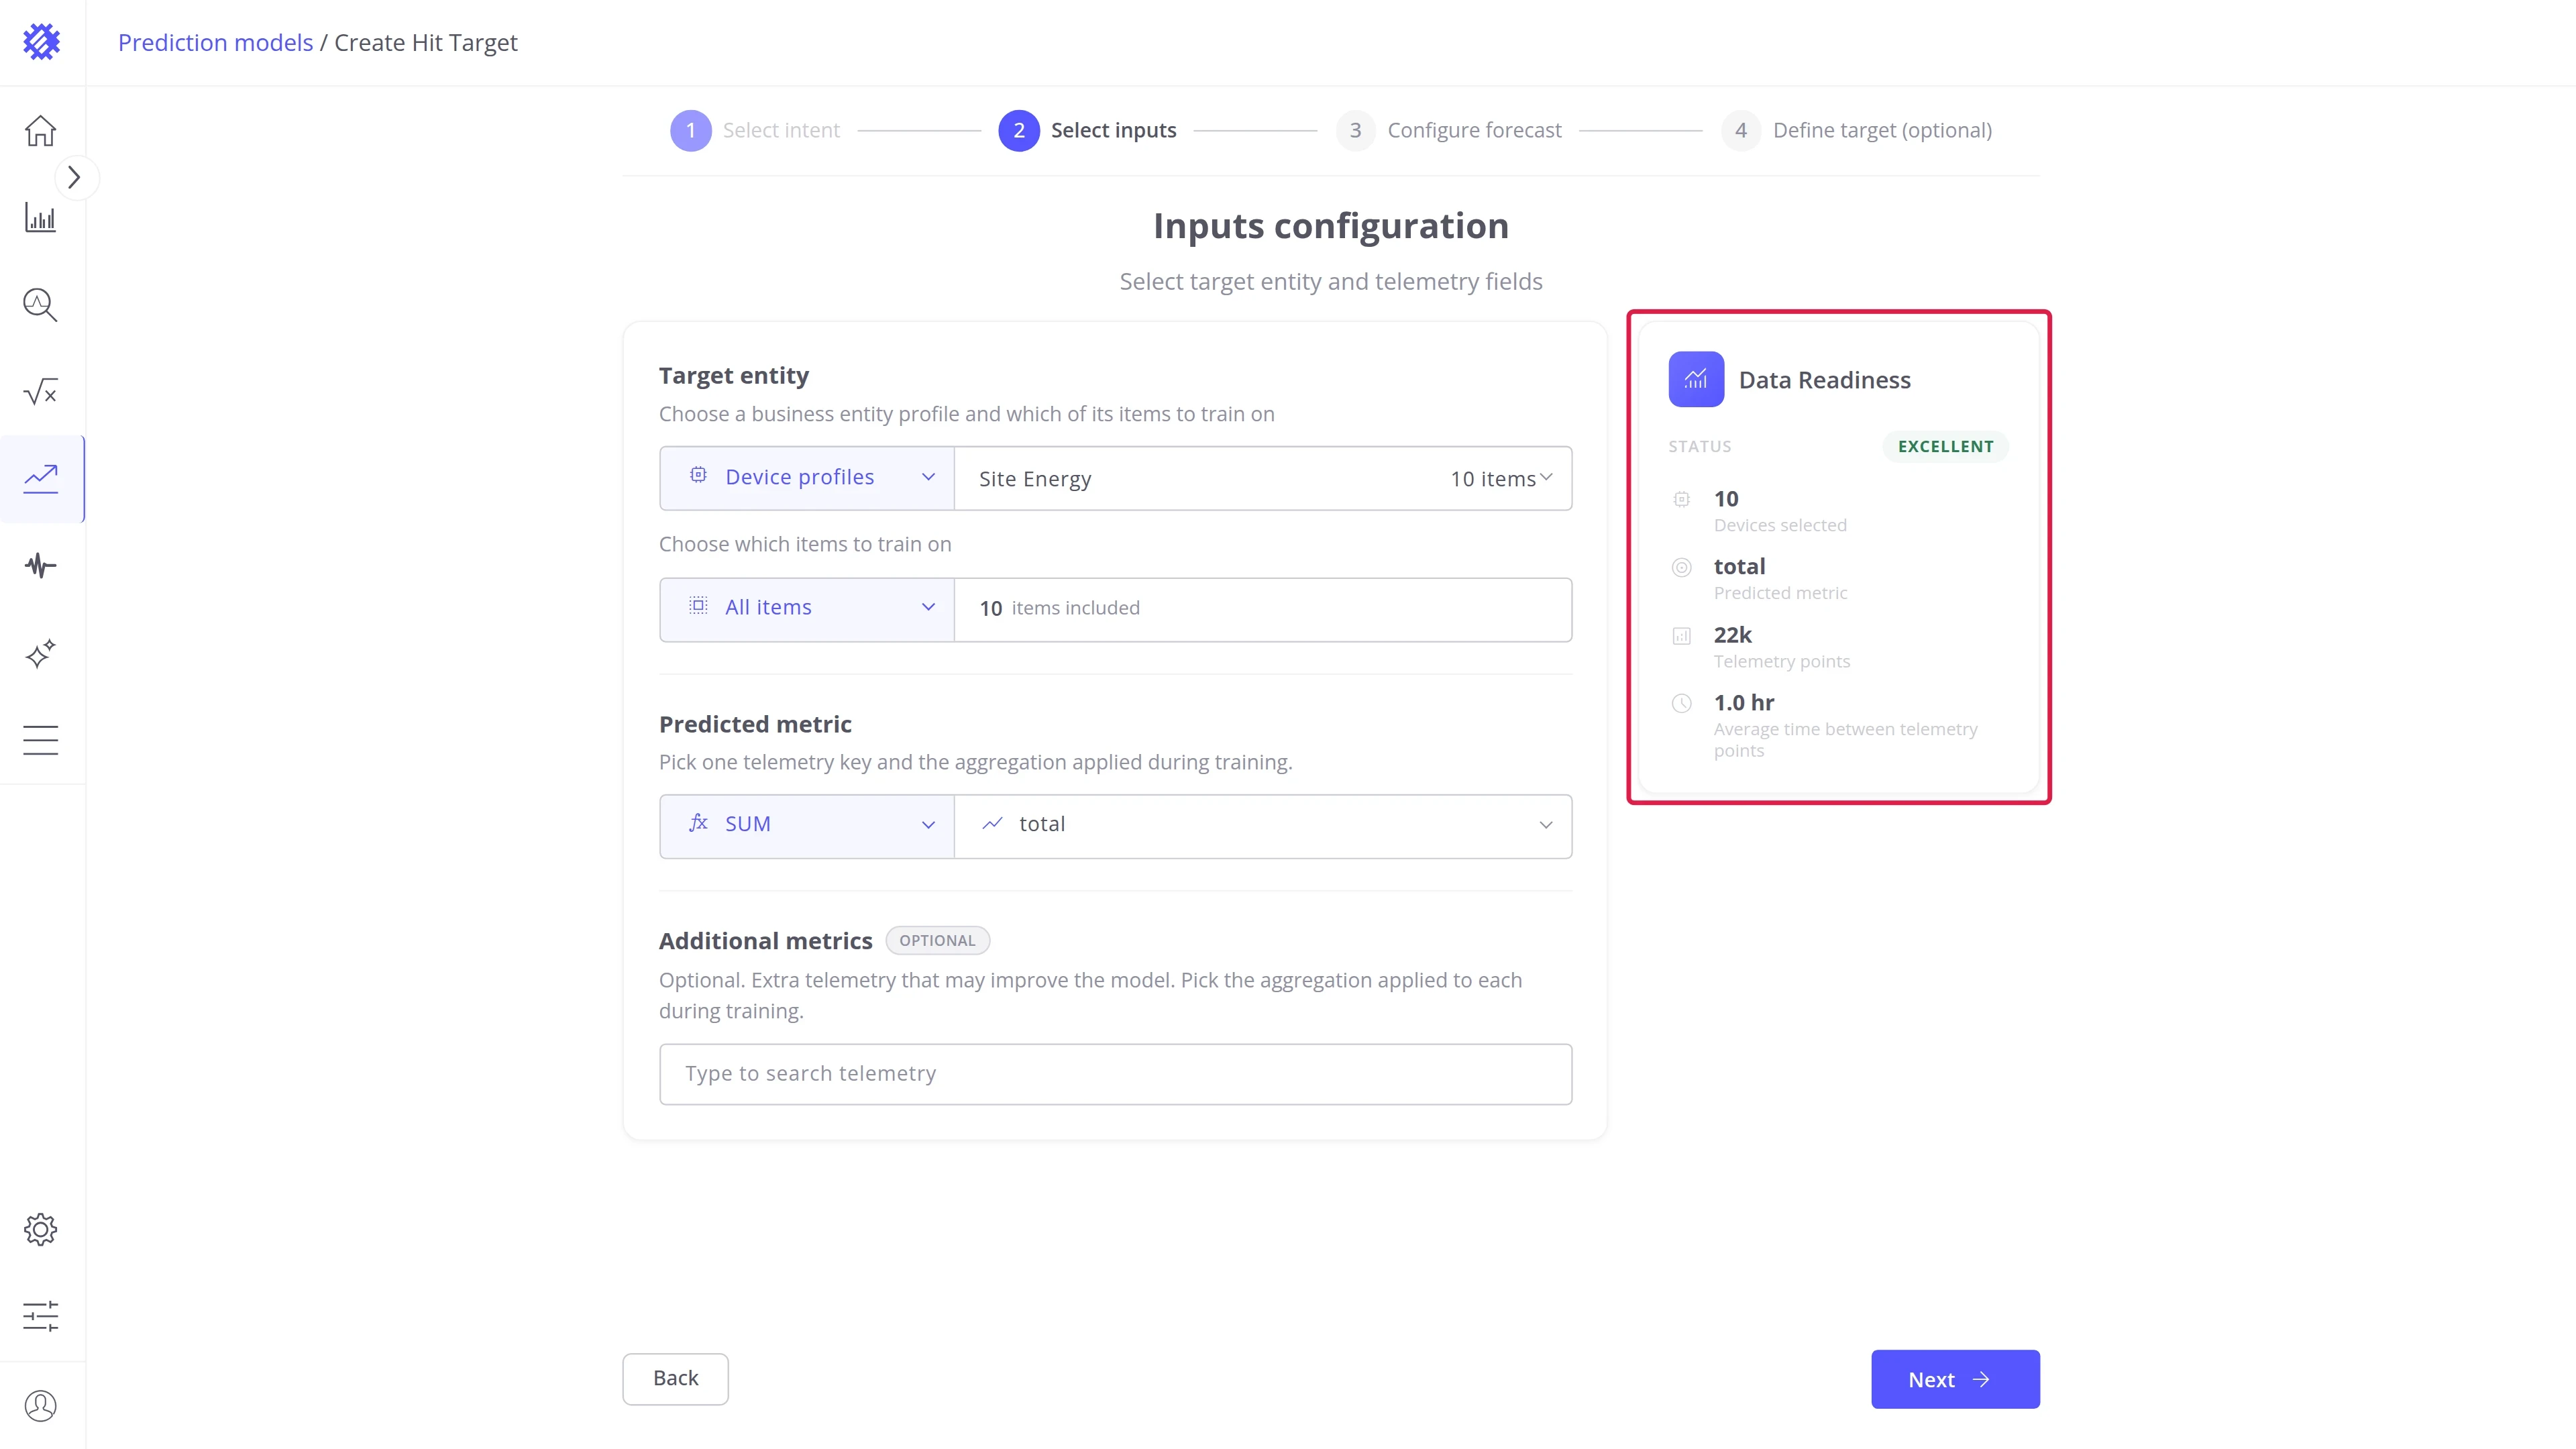
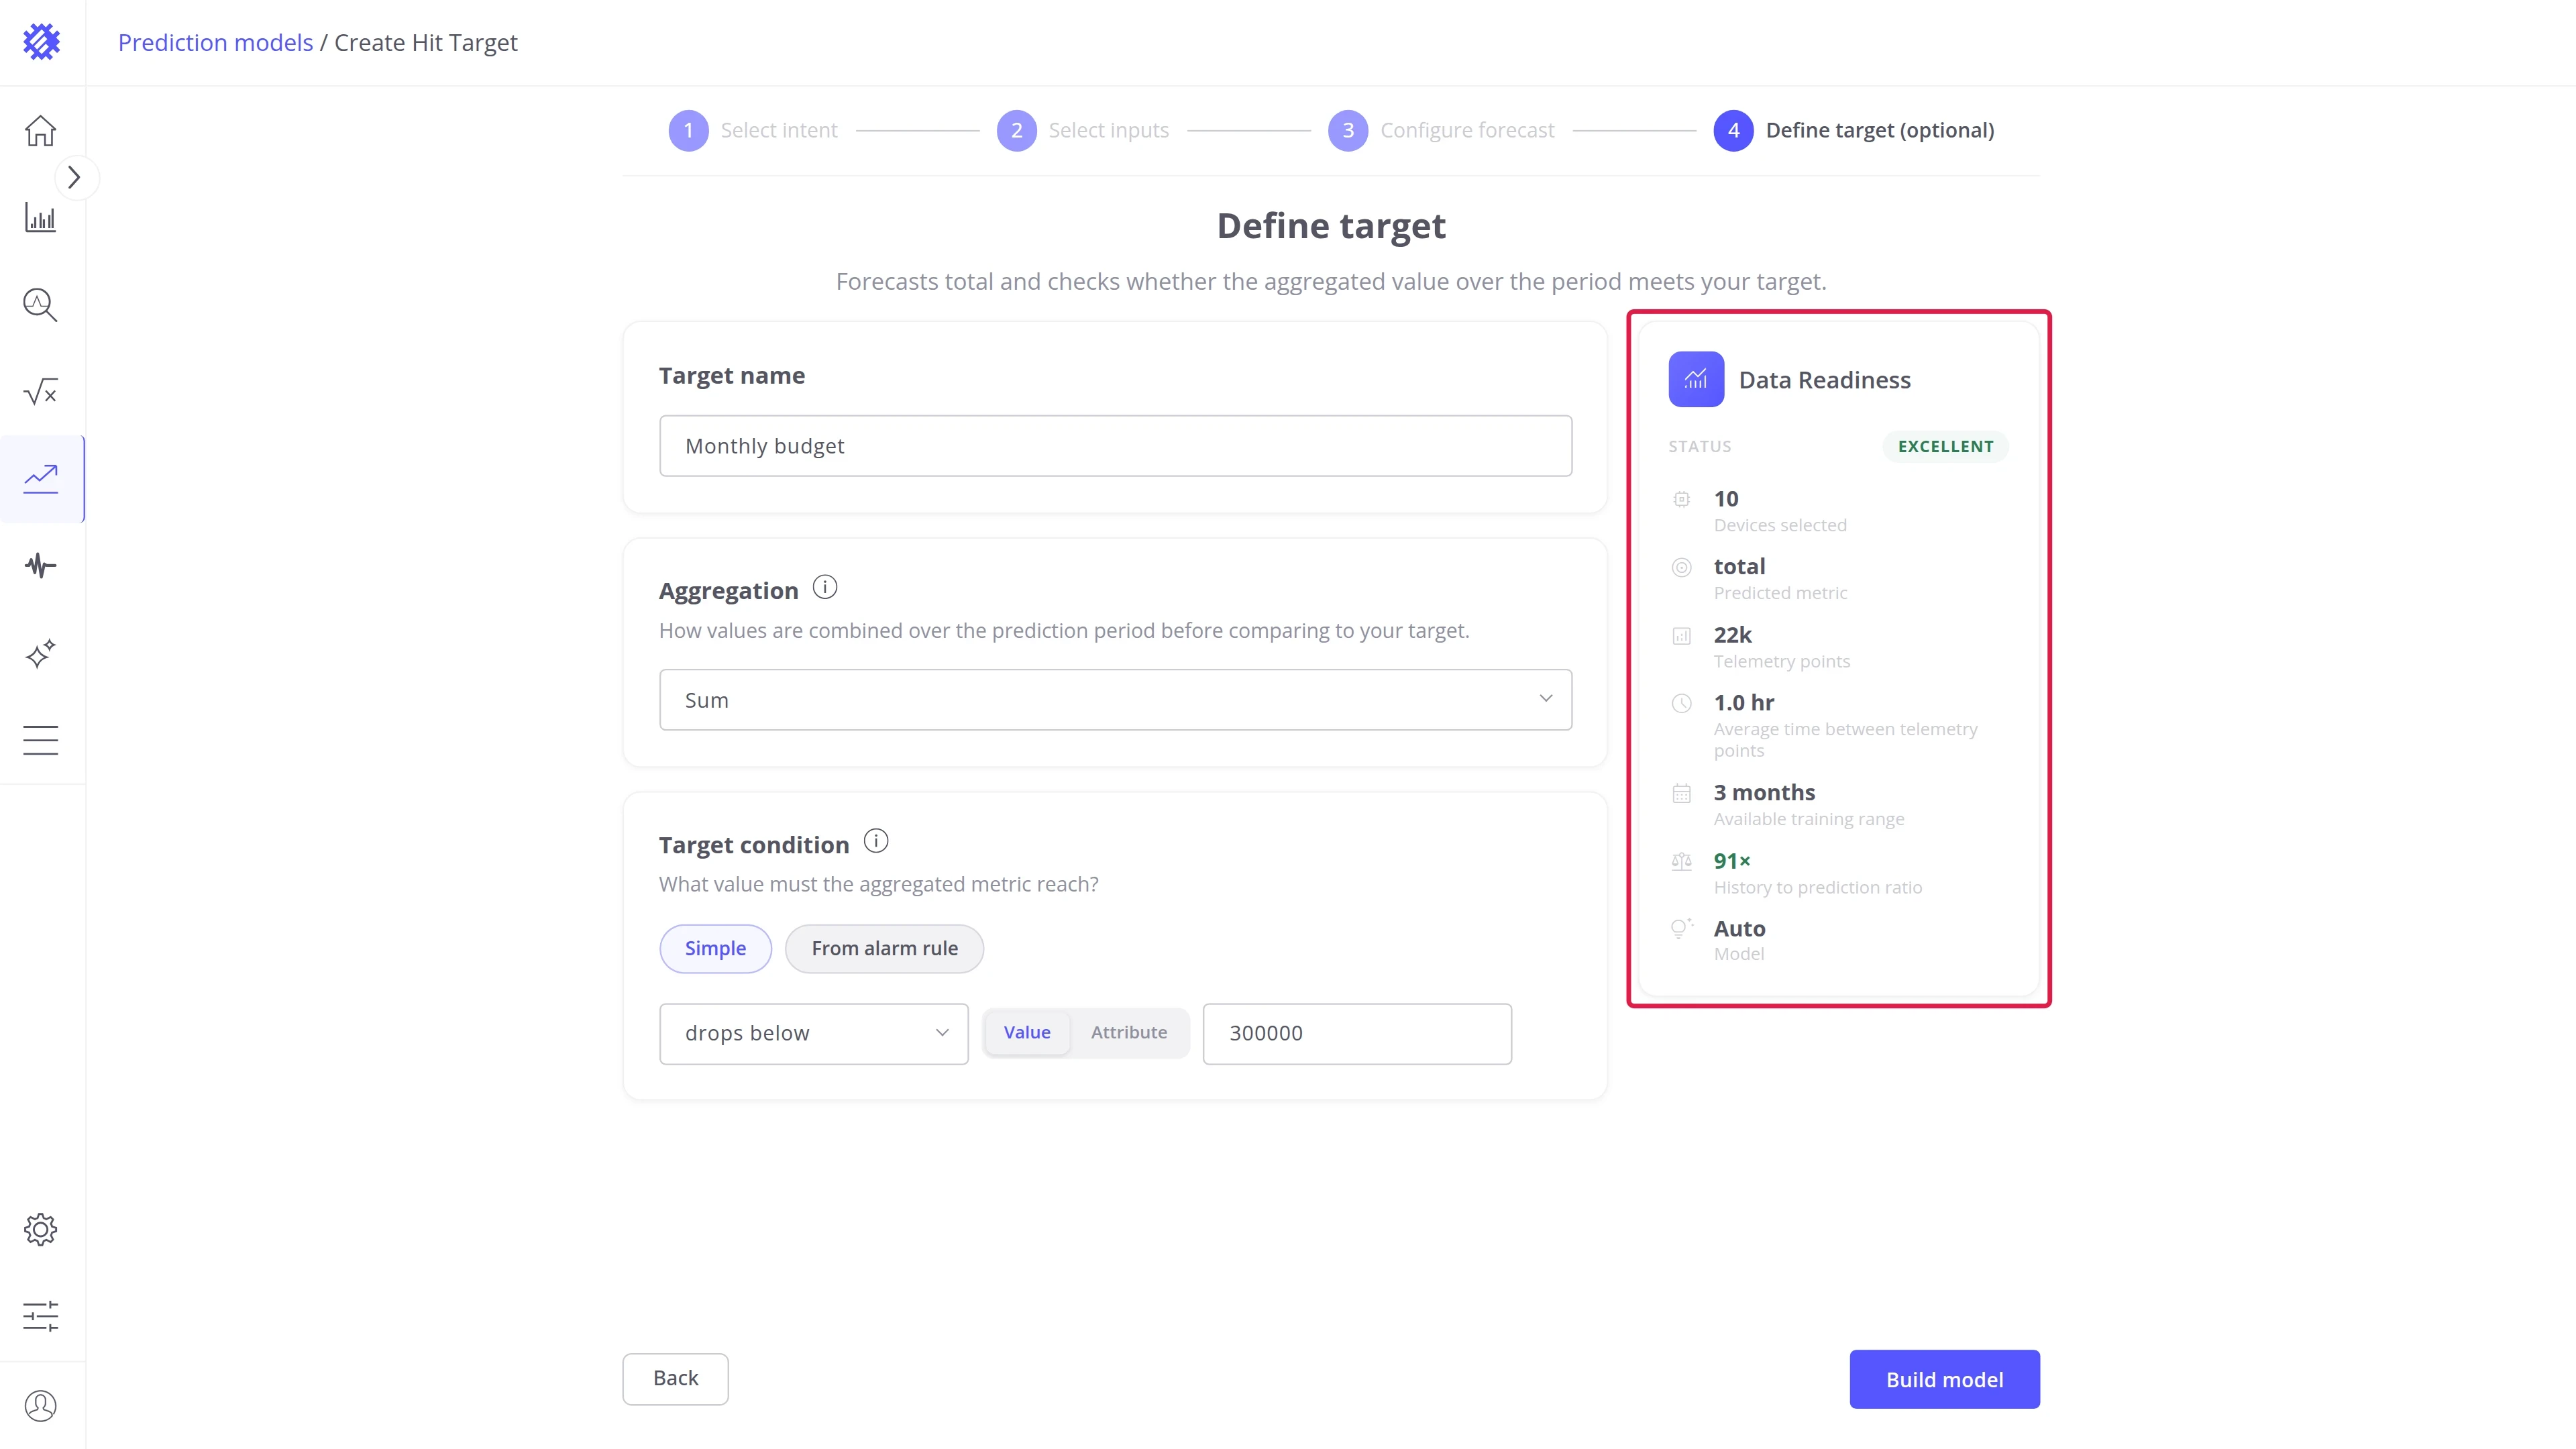
Data Readiness — grades the choice as you go: items selected, the predicted metric, how many telemetry points they hold, and the average spacing between them.
Step 3: Configure the forecast
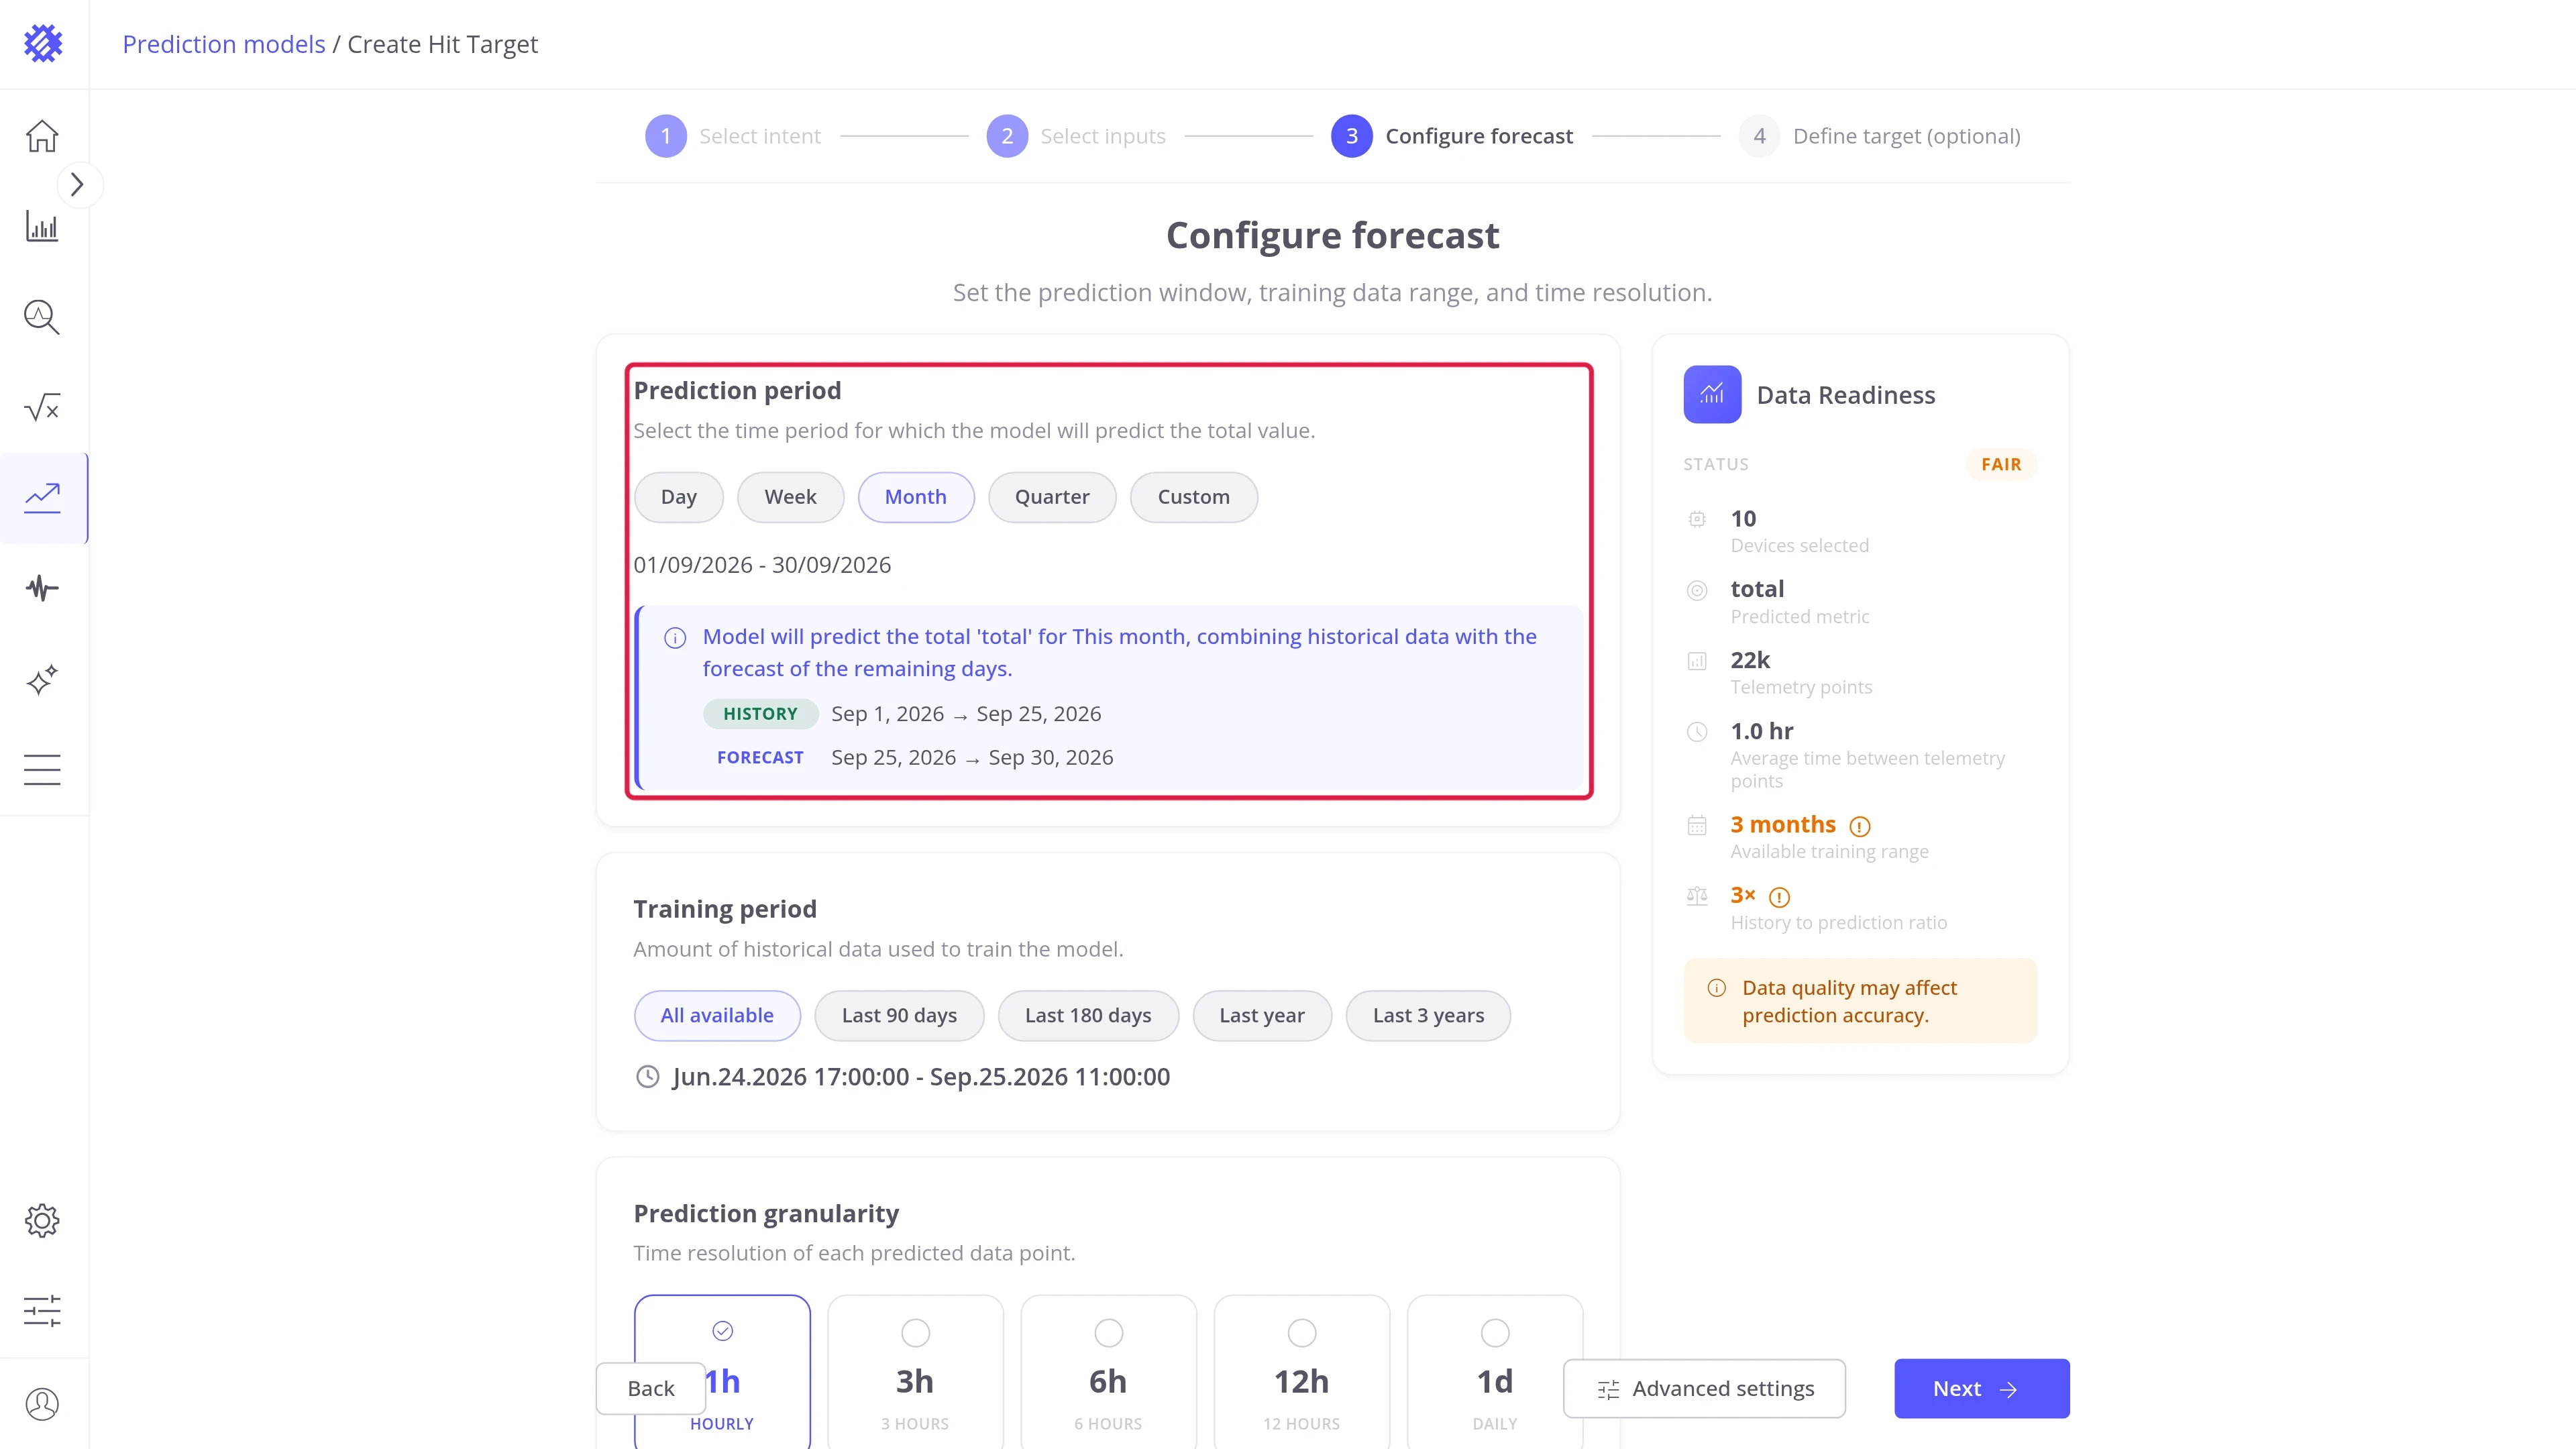
Section titled “Step 3: Configure the forecast”Prediction period — the deadline. The target is checked over this period: the measured part runs from the start of the period to now, and the forecast covers the rest. Pick Day, Week, Month, or Quarter, or Custom and type the number of units. For the monthly budget, pick Month. The period snaps to whole calendar units, and the box under the chips shows the History and Forecast parts:
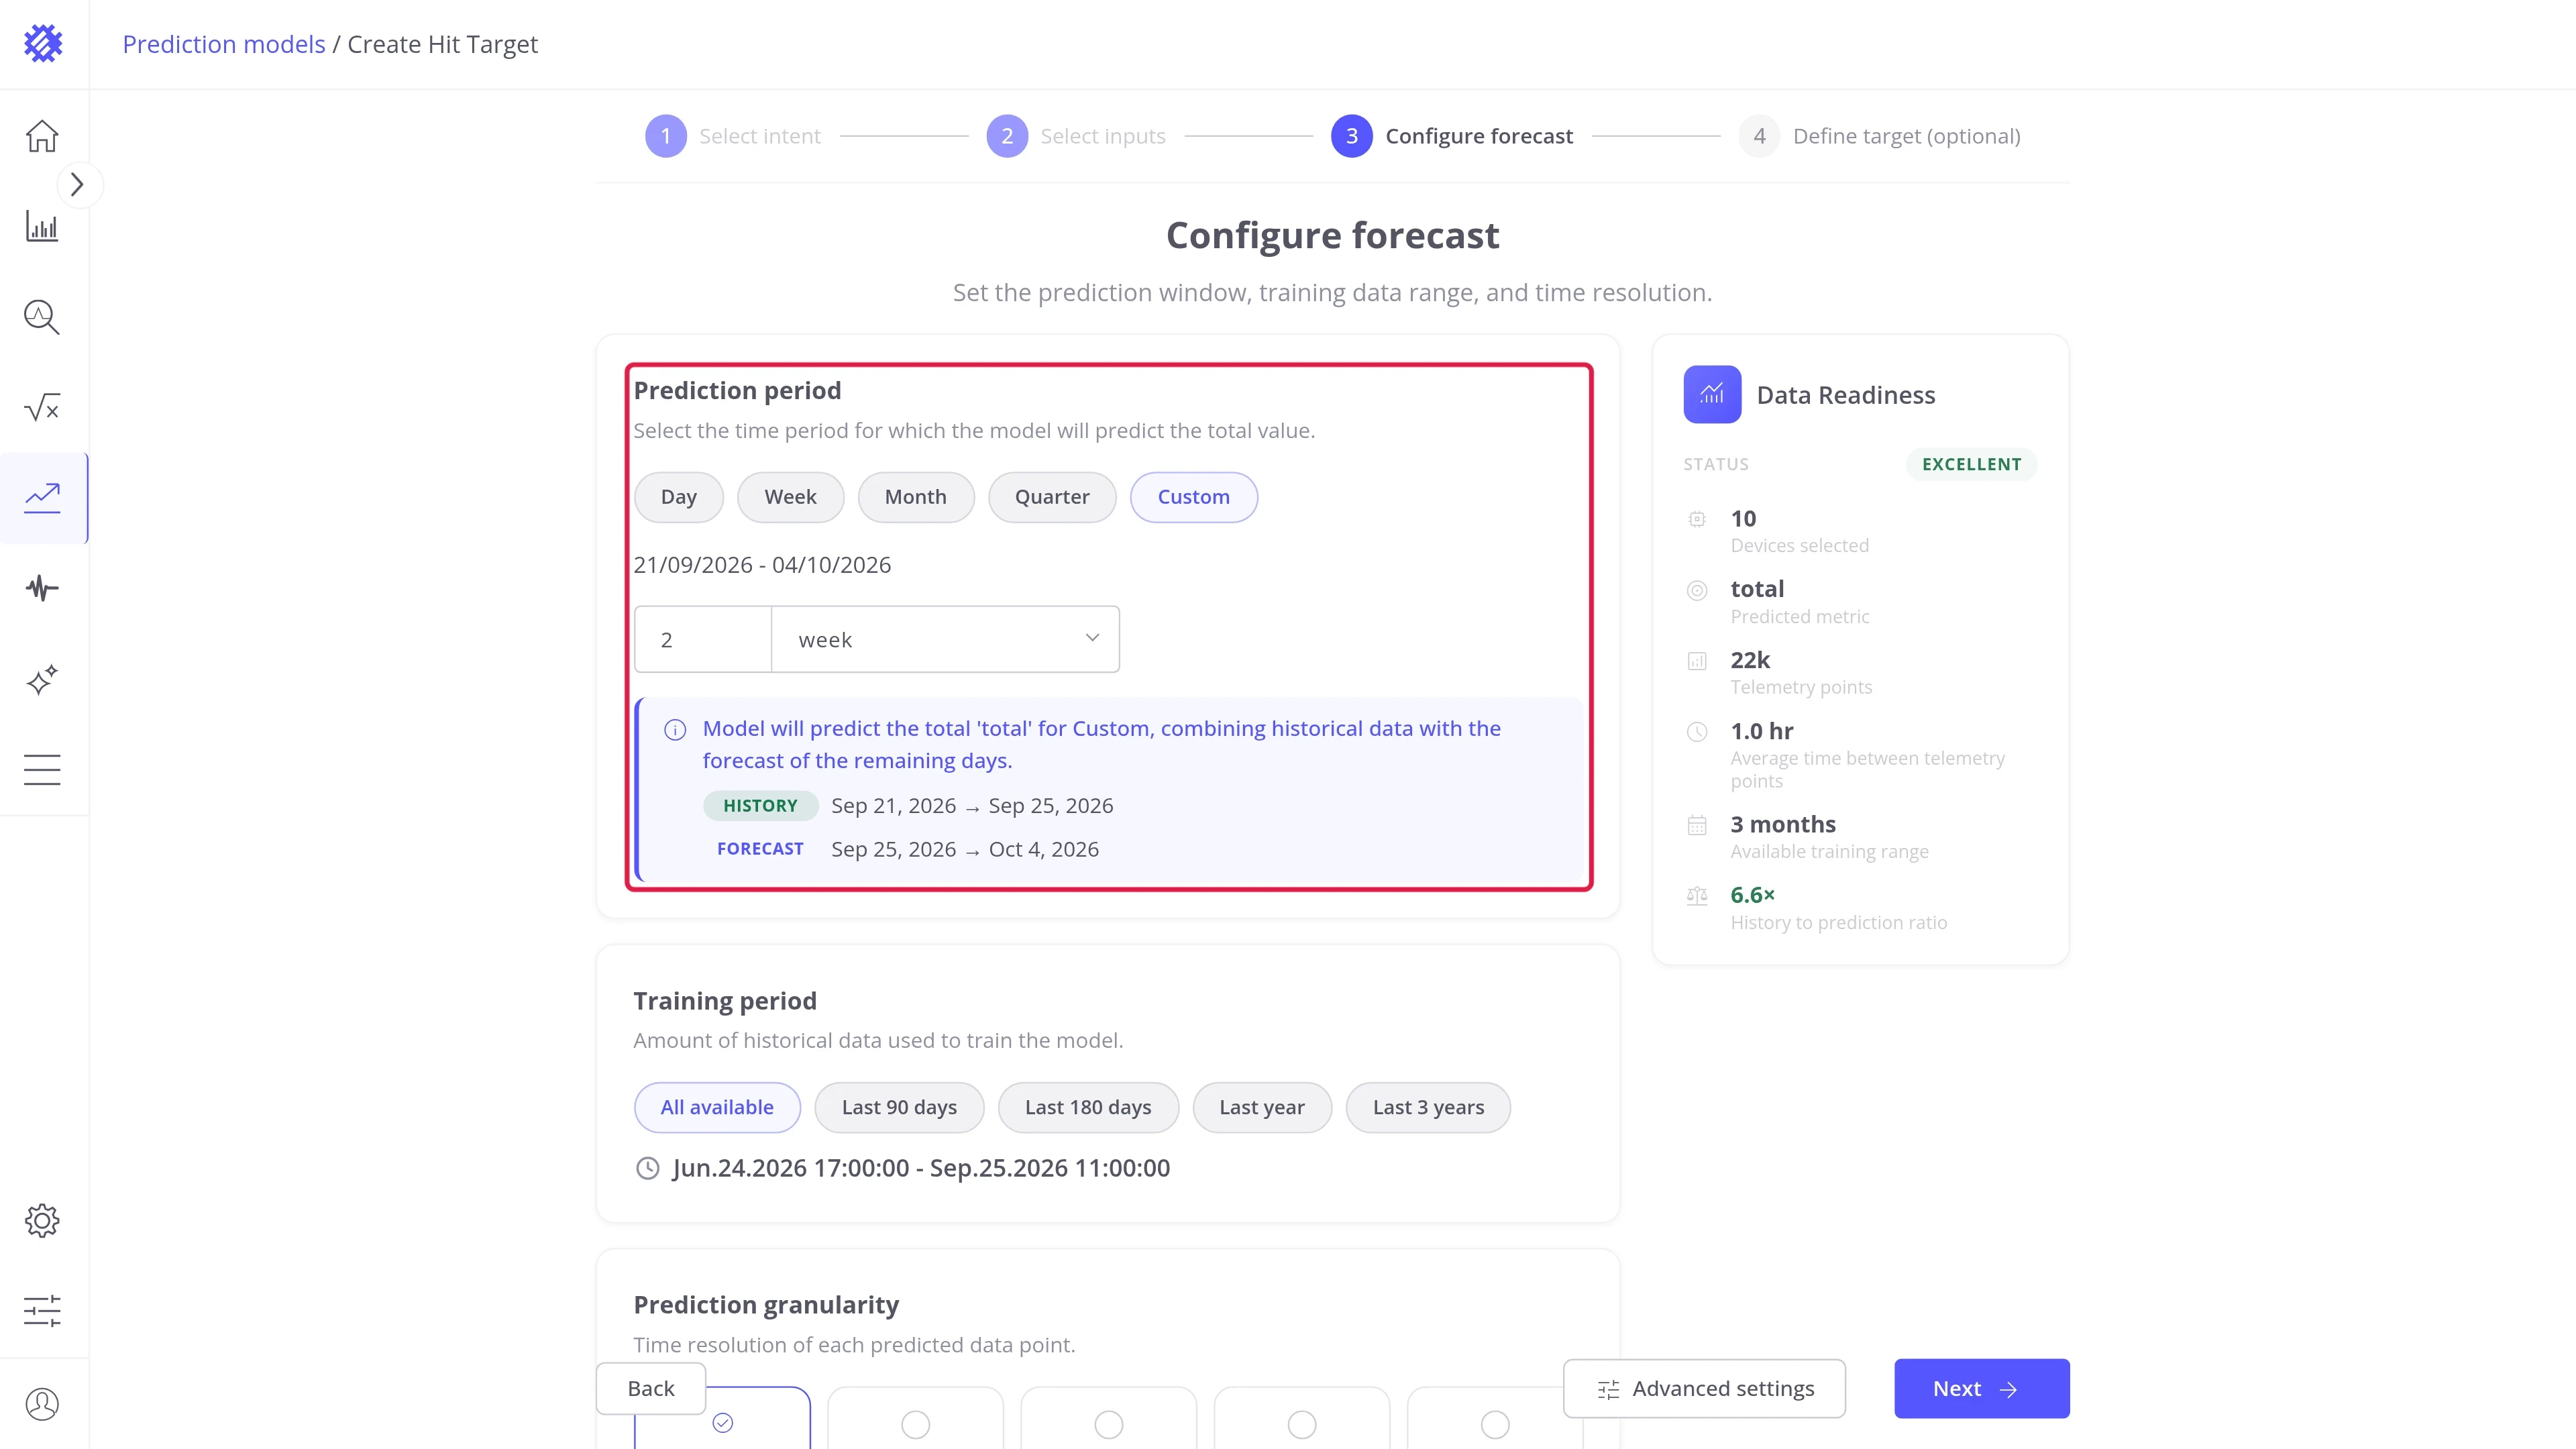
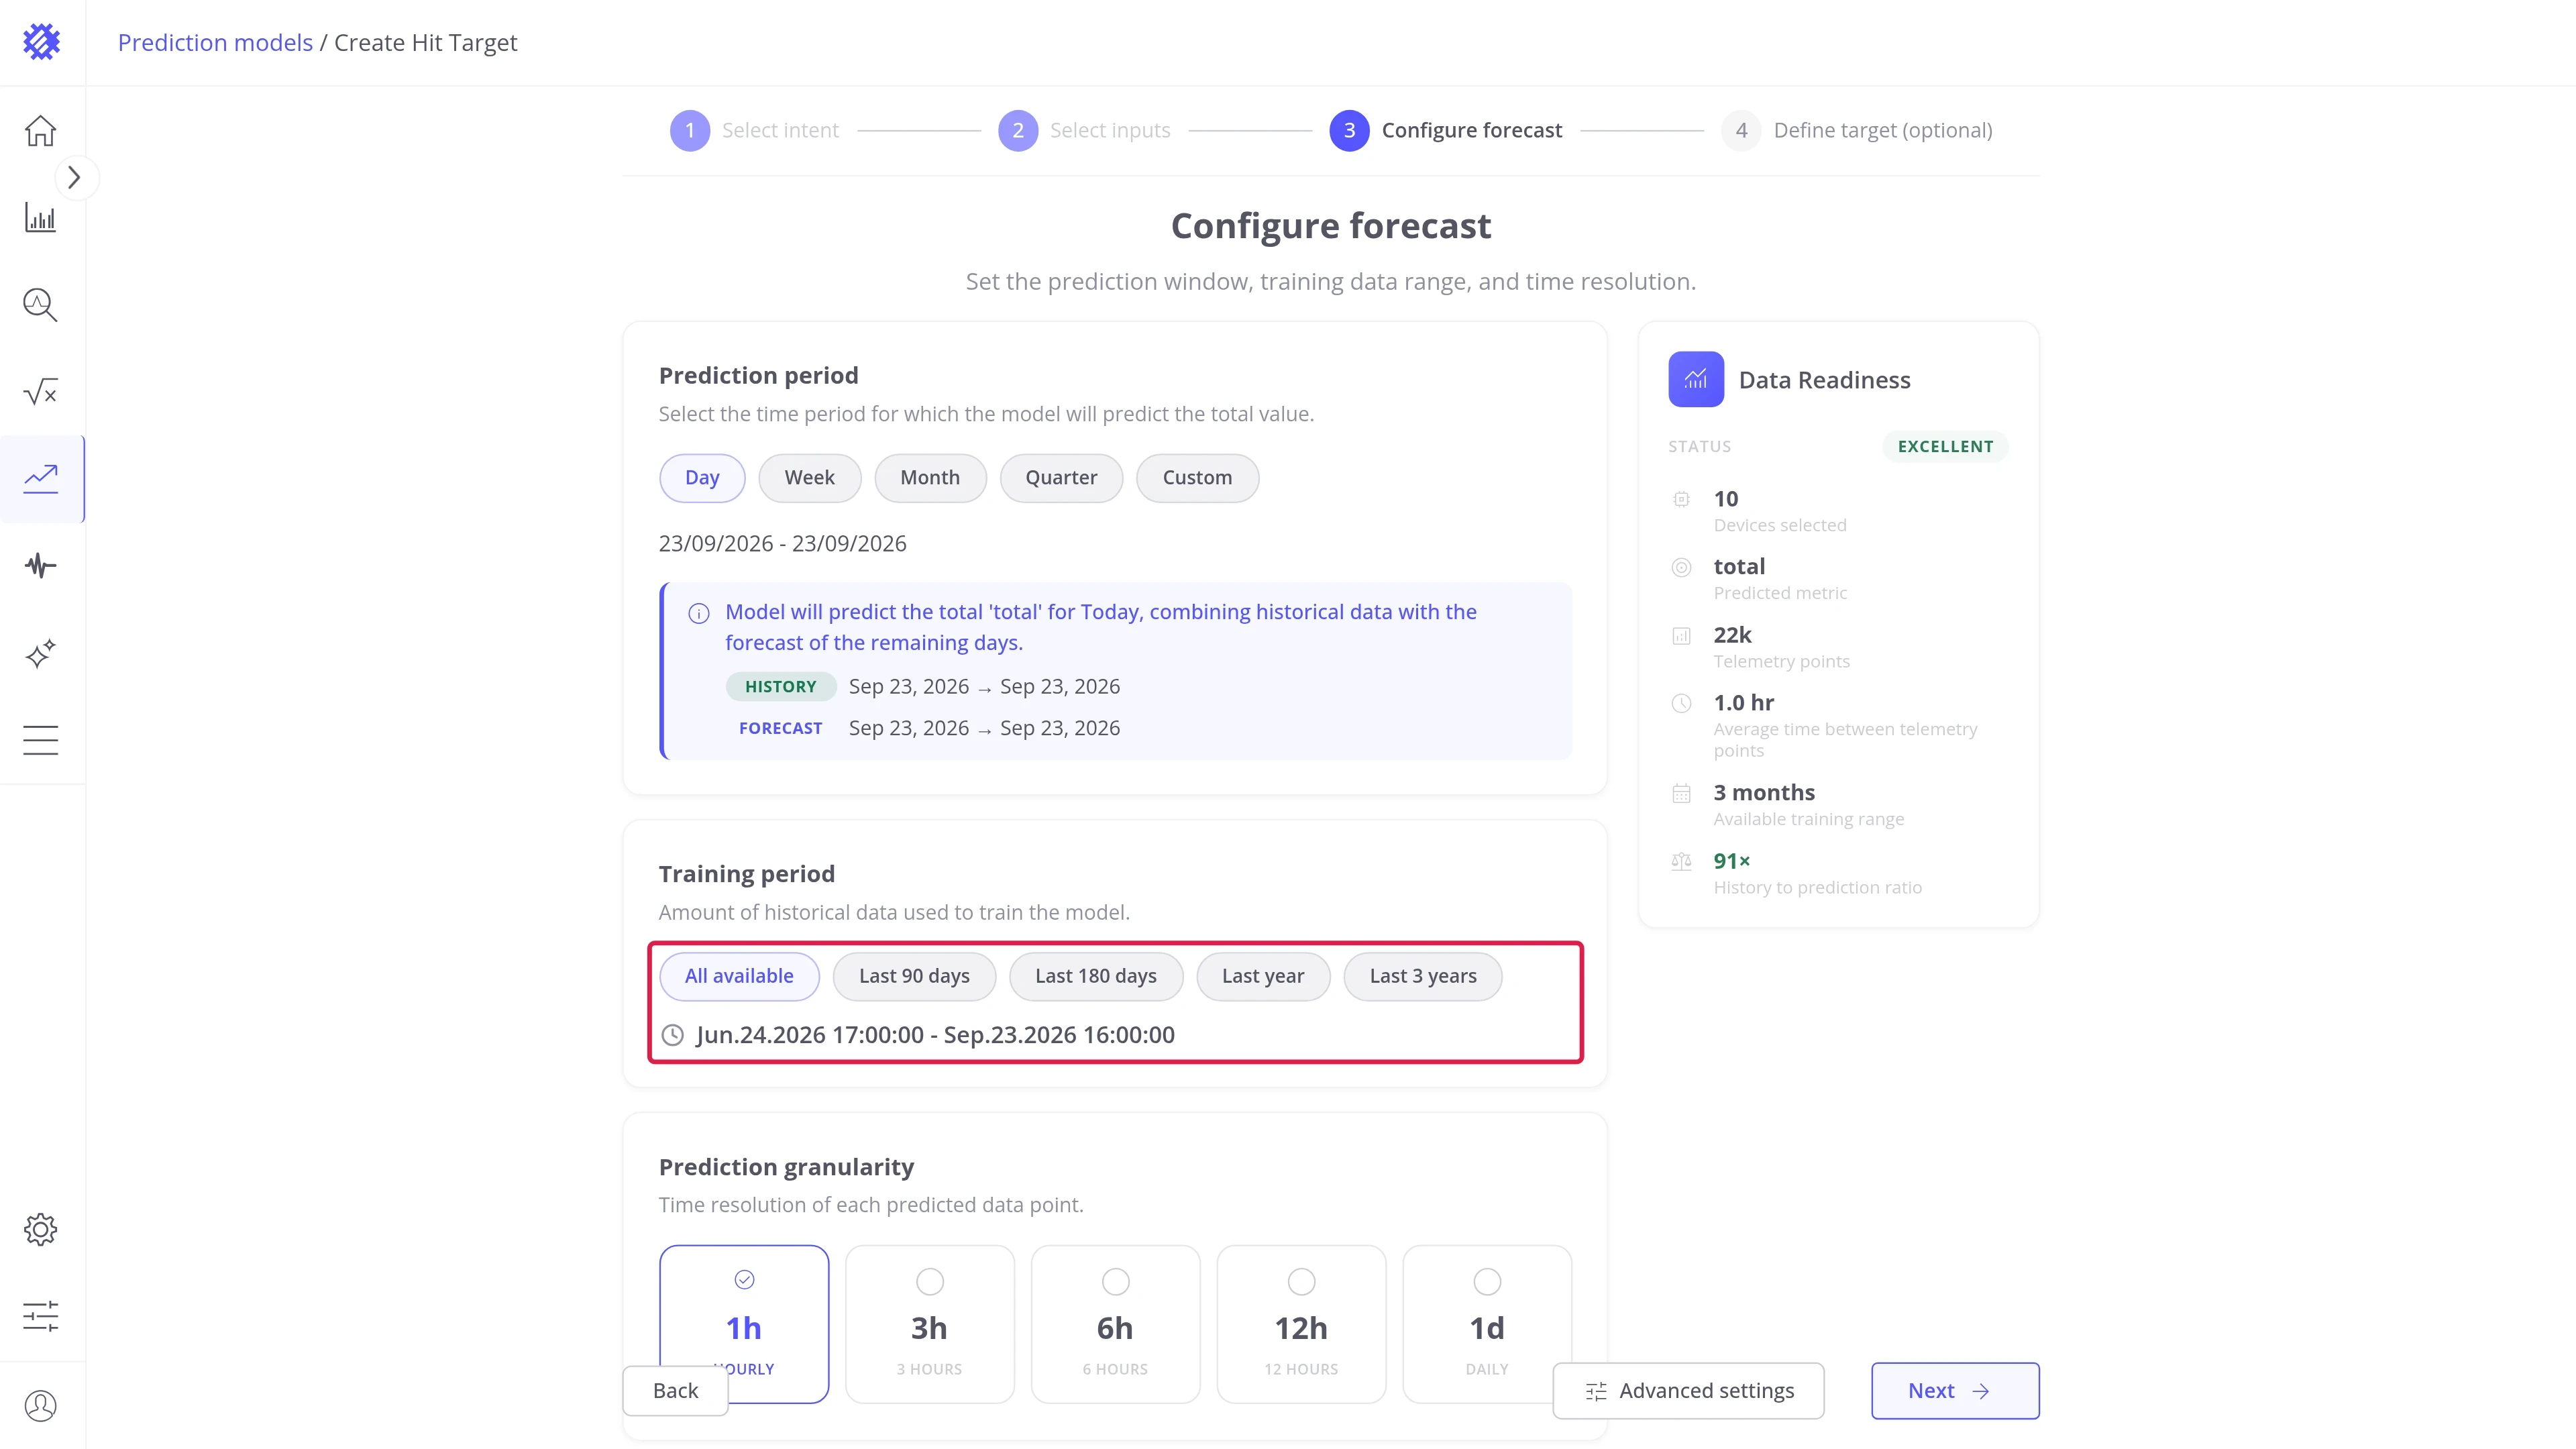
Training period — choose how much history the model learns from. The readiness panel grades it against the length of the period: three months of history for a one-month period is a 3× ratio, graded Fair, with a warning that data quality may affect accuracy:
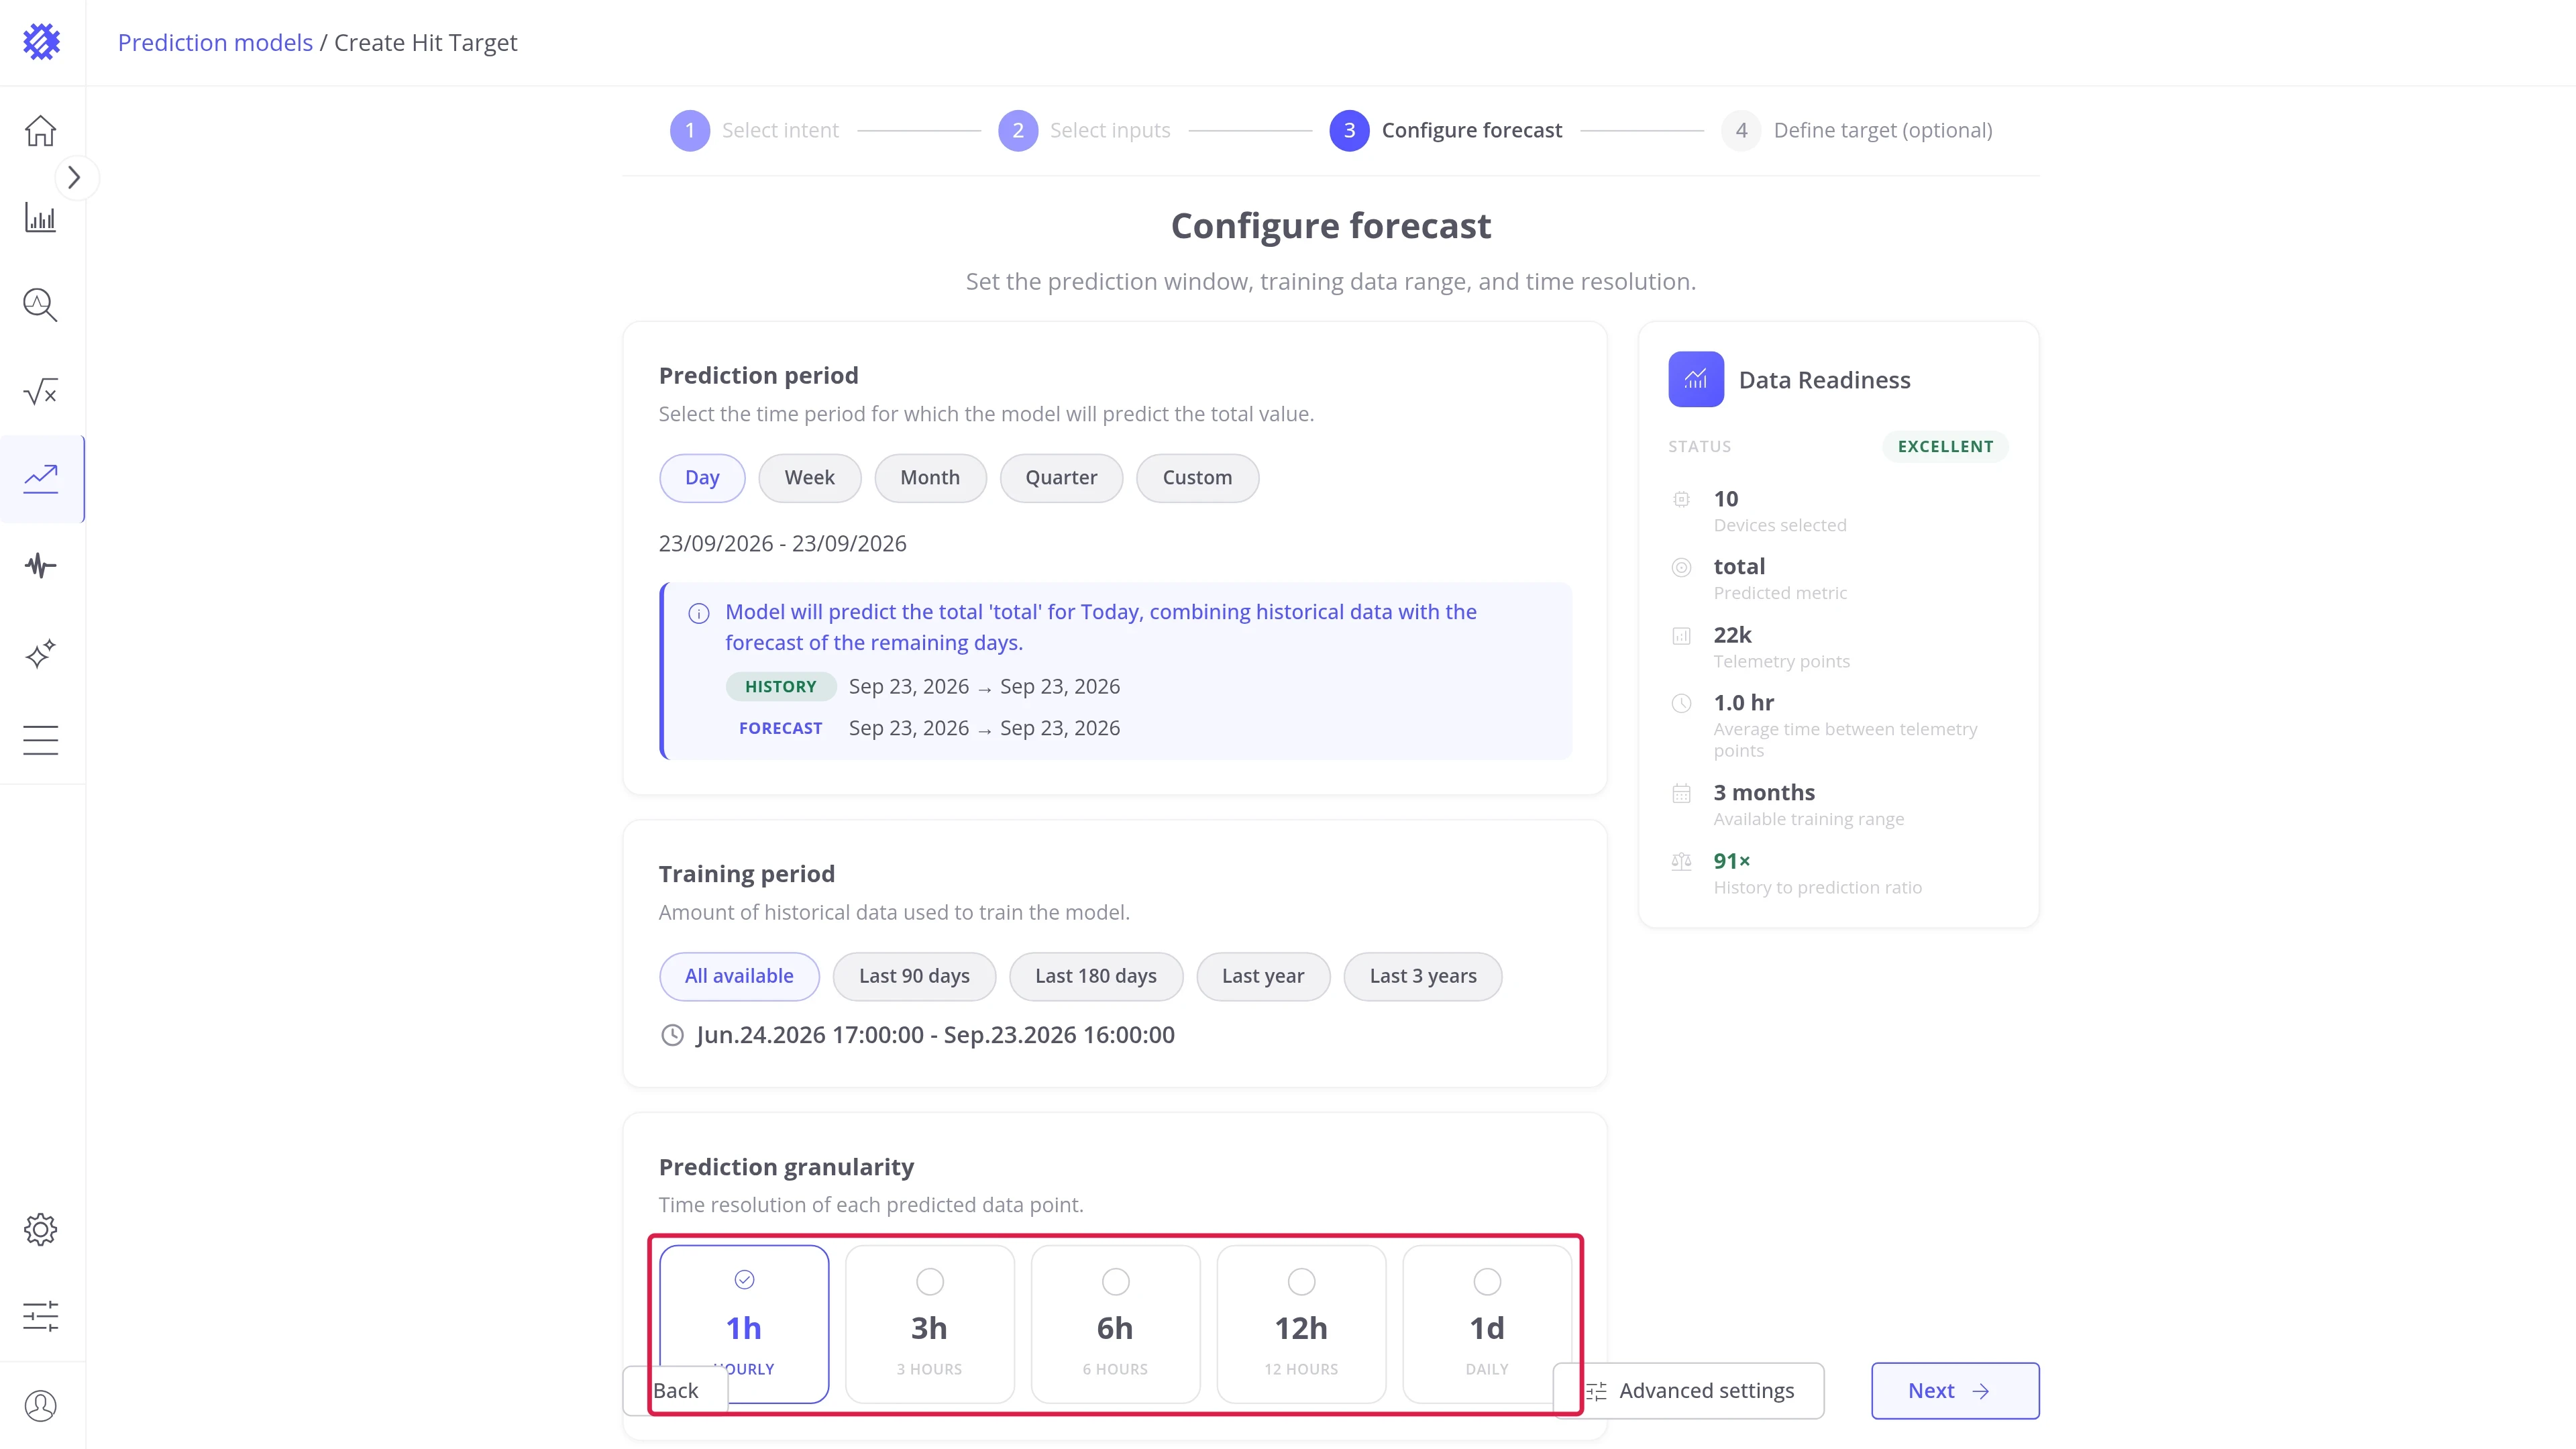
Prediction granularity — pick the length of one bucket. The forecast has the same step, so the running total on the Result tab moves one bucket at a time:
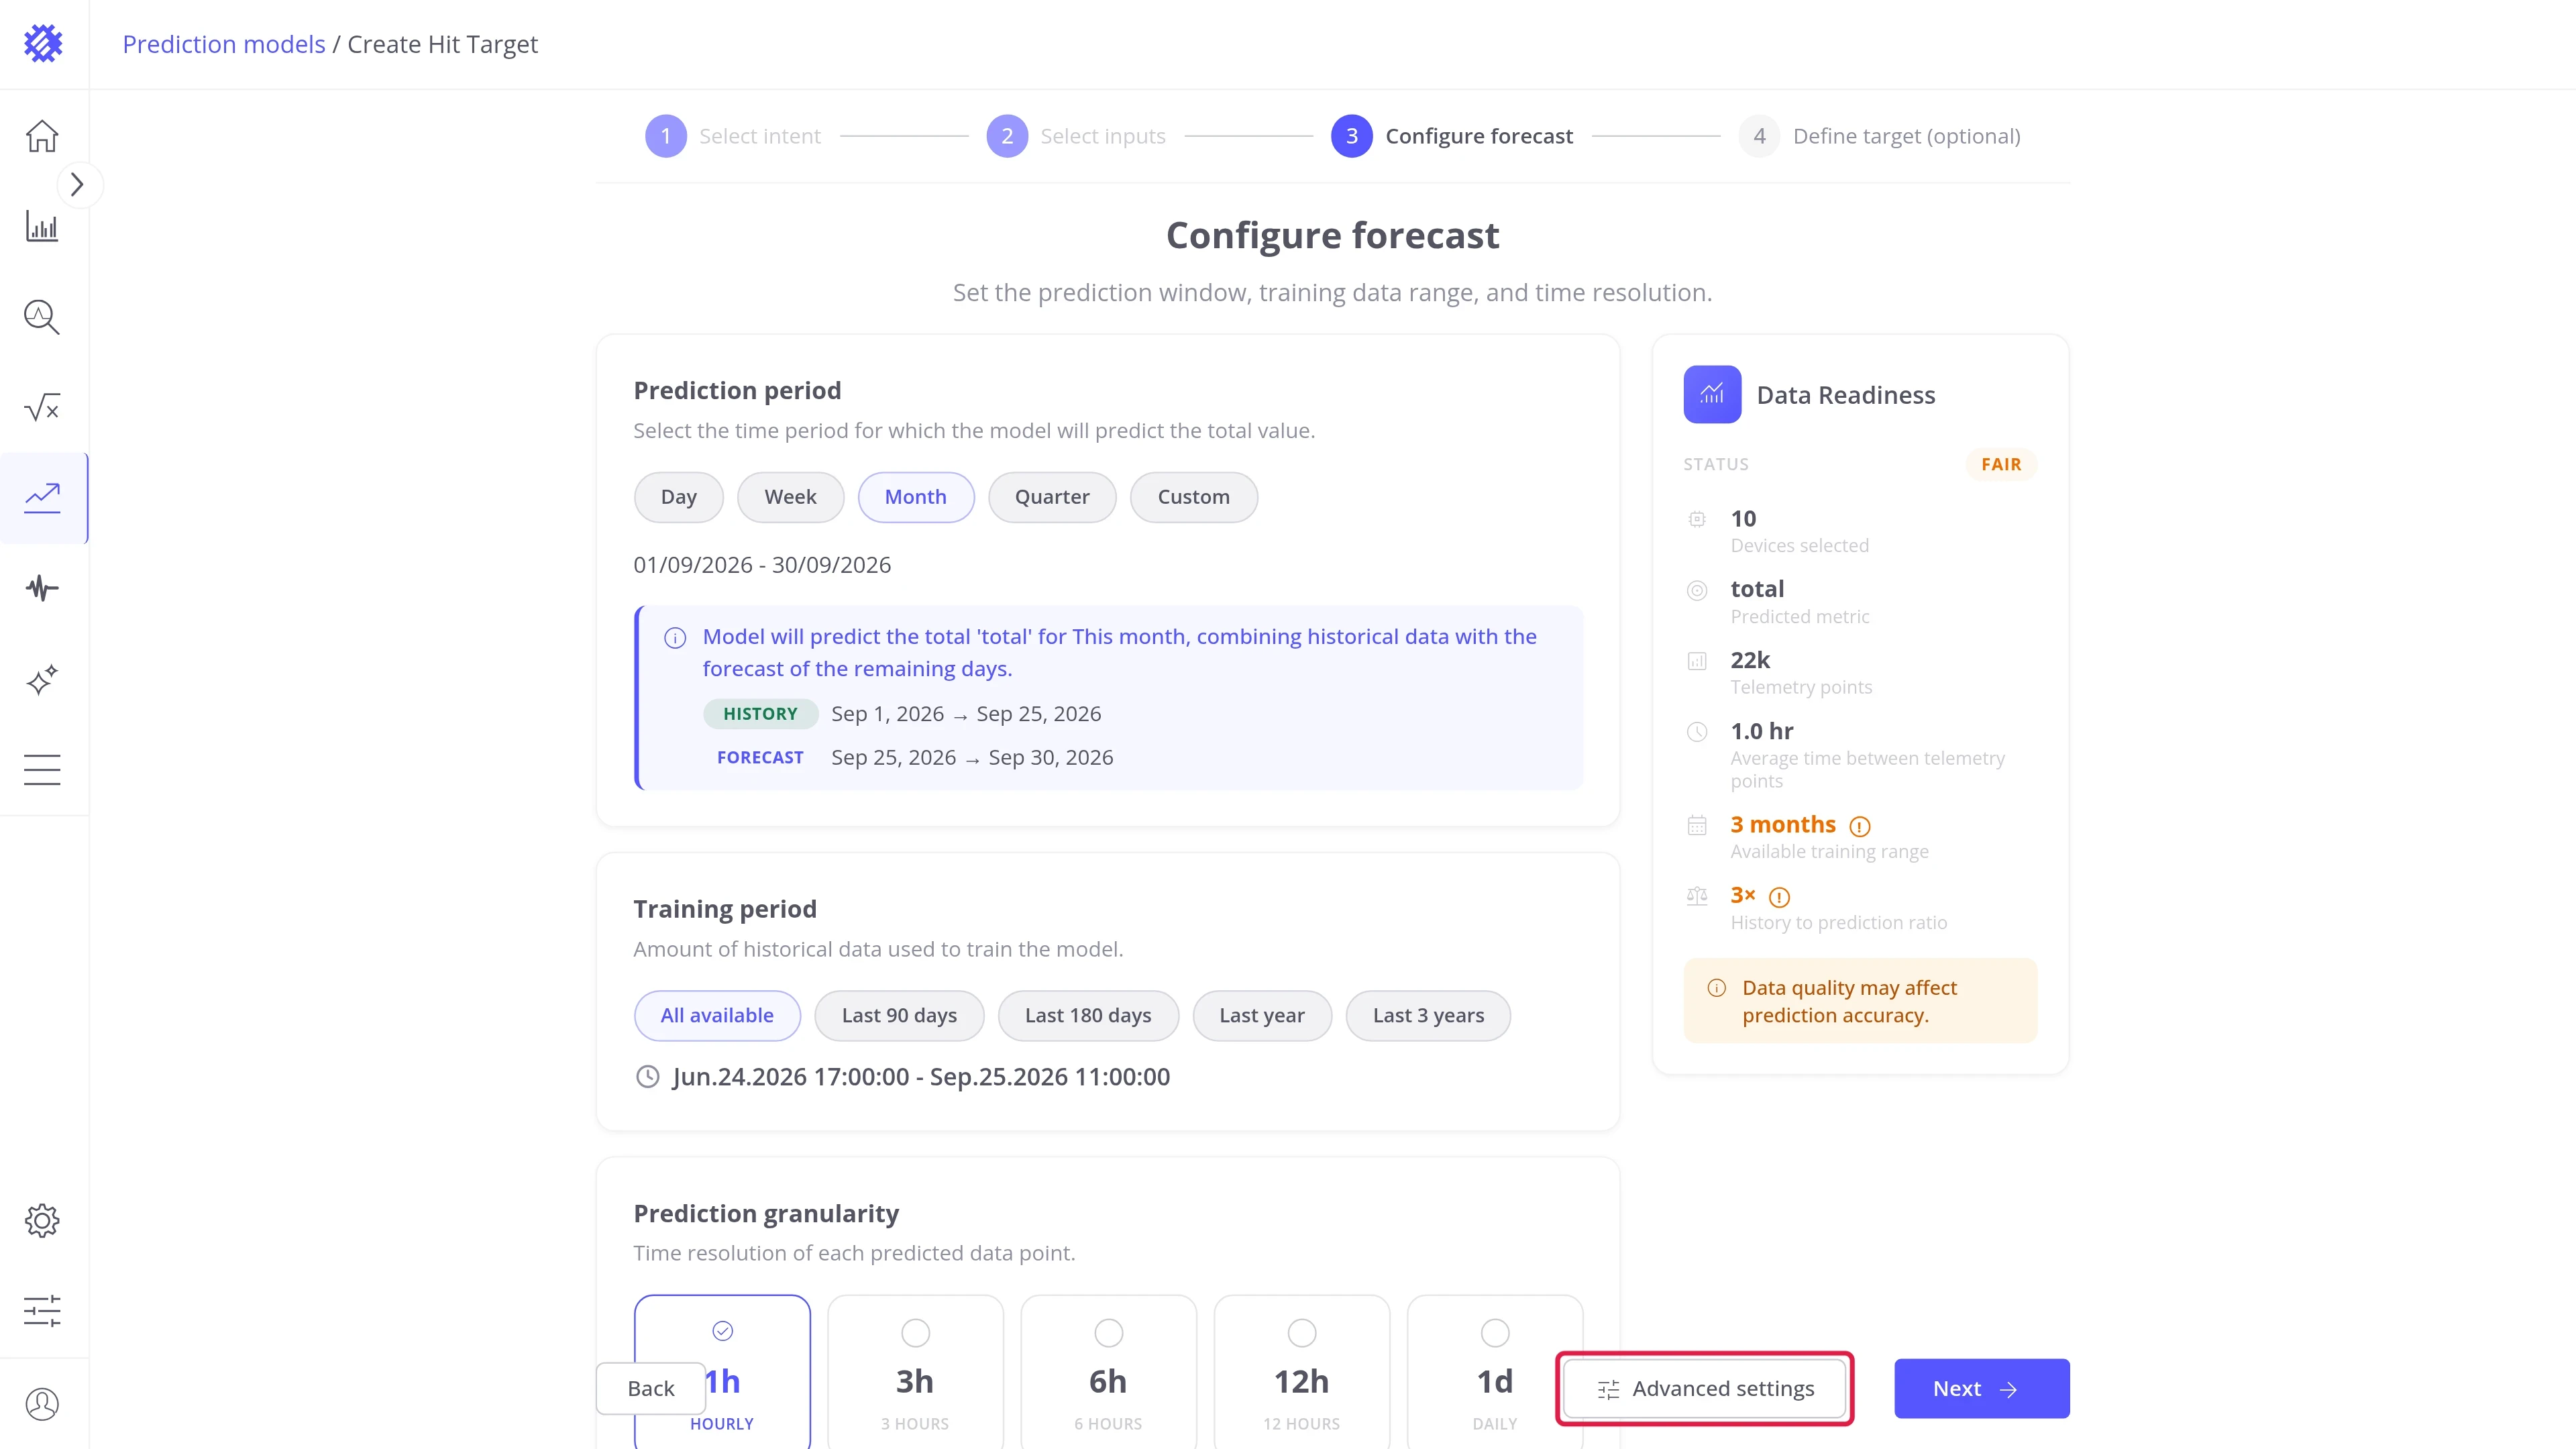
Advanced settings — optional. Adds a step with the prediction method and the forecast bounds. Leaving the method on Auto lets Trendz pick one per item:
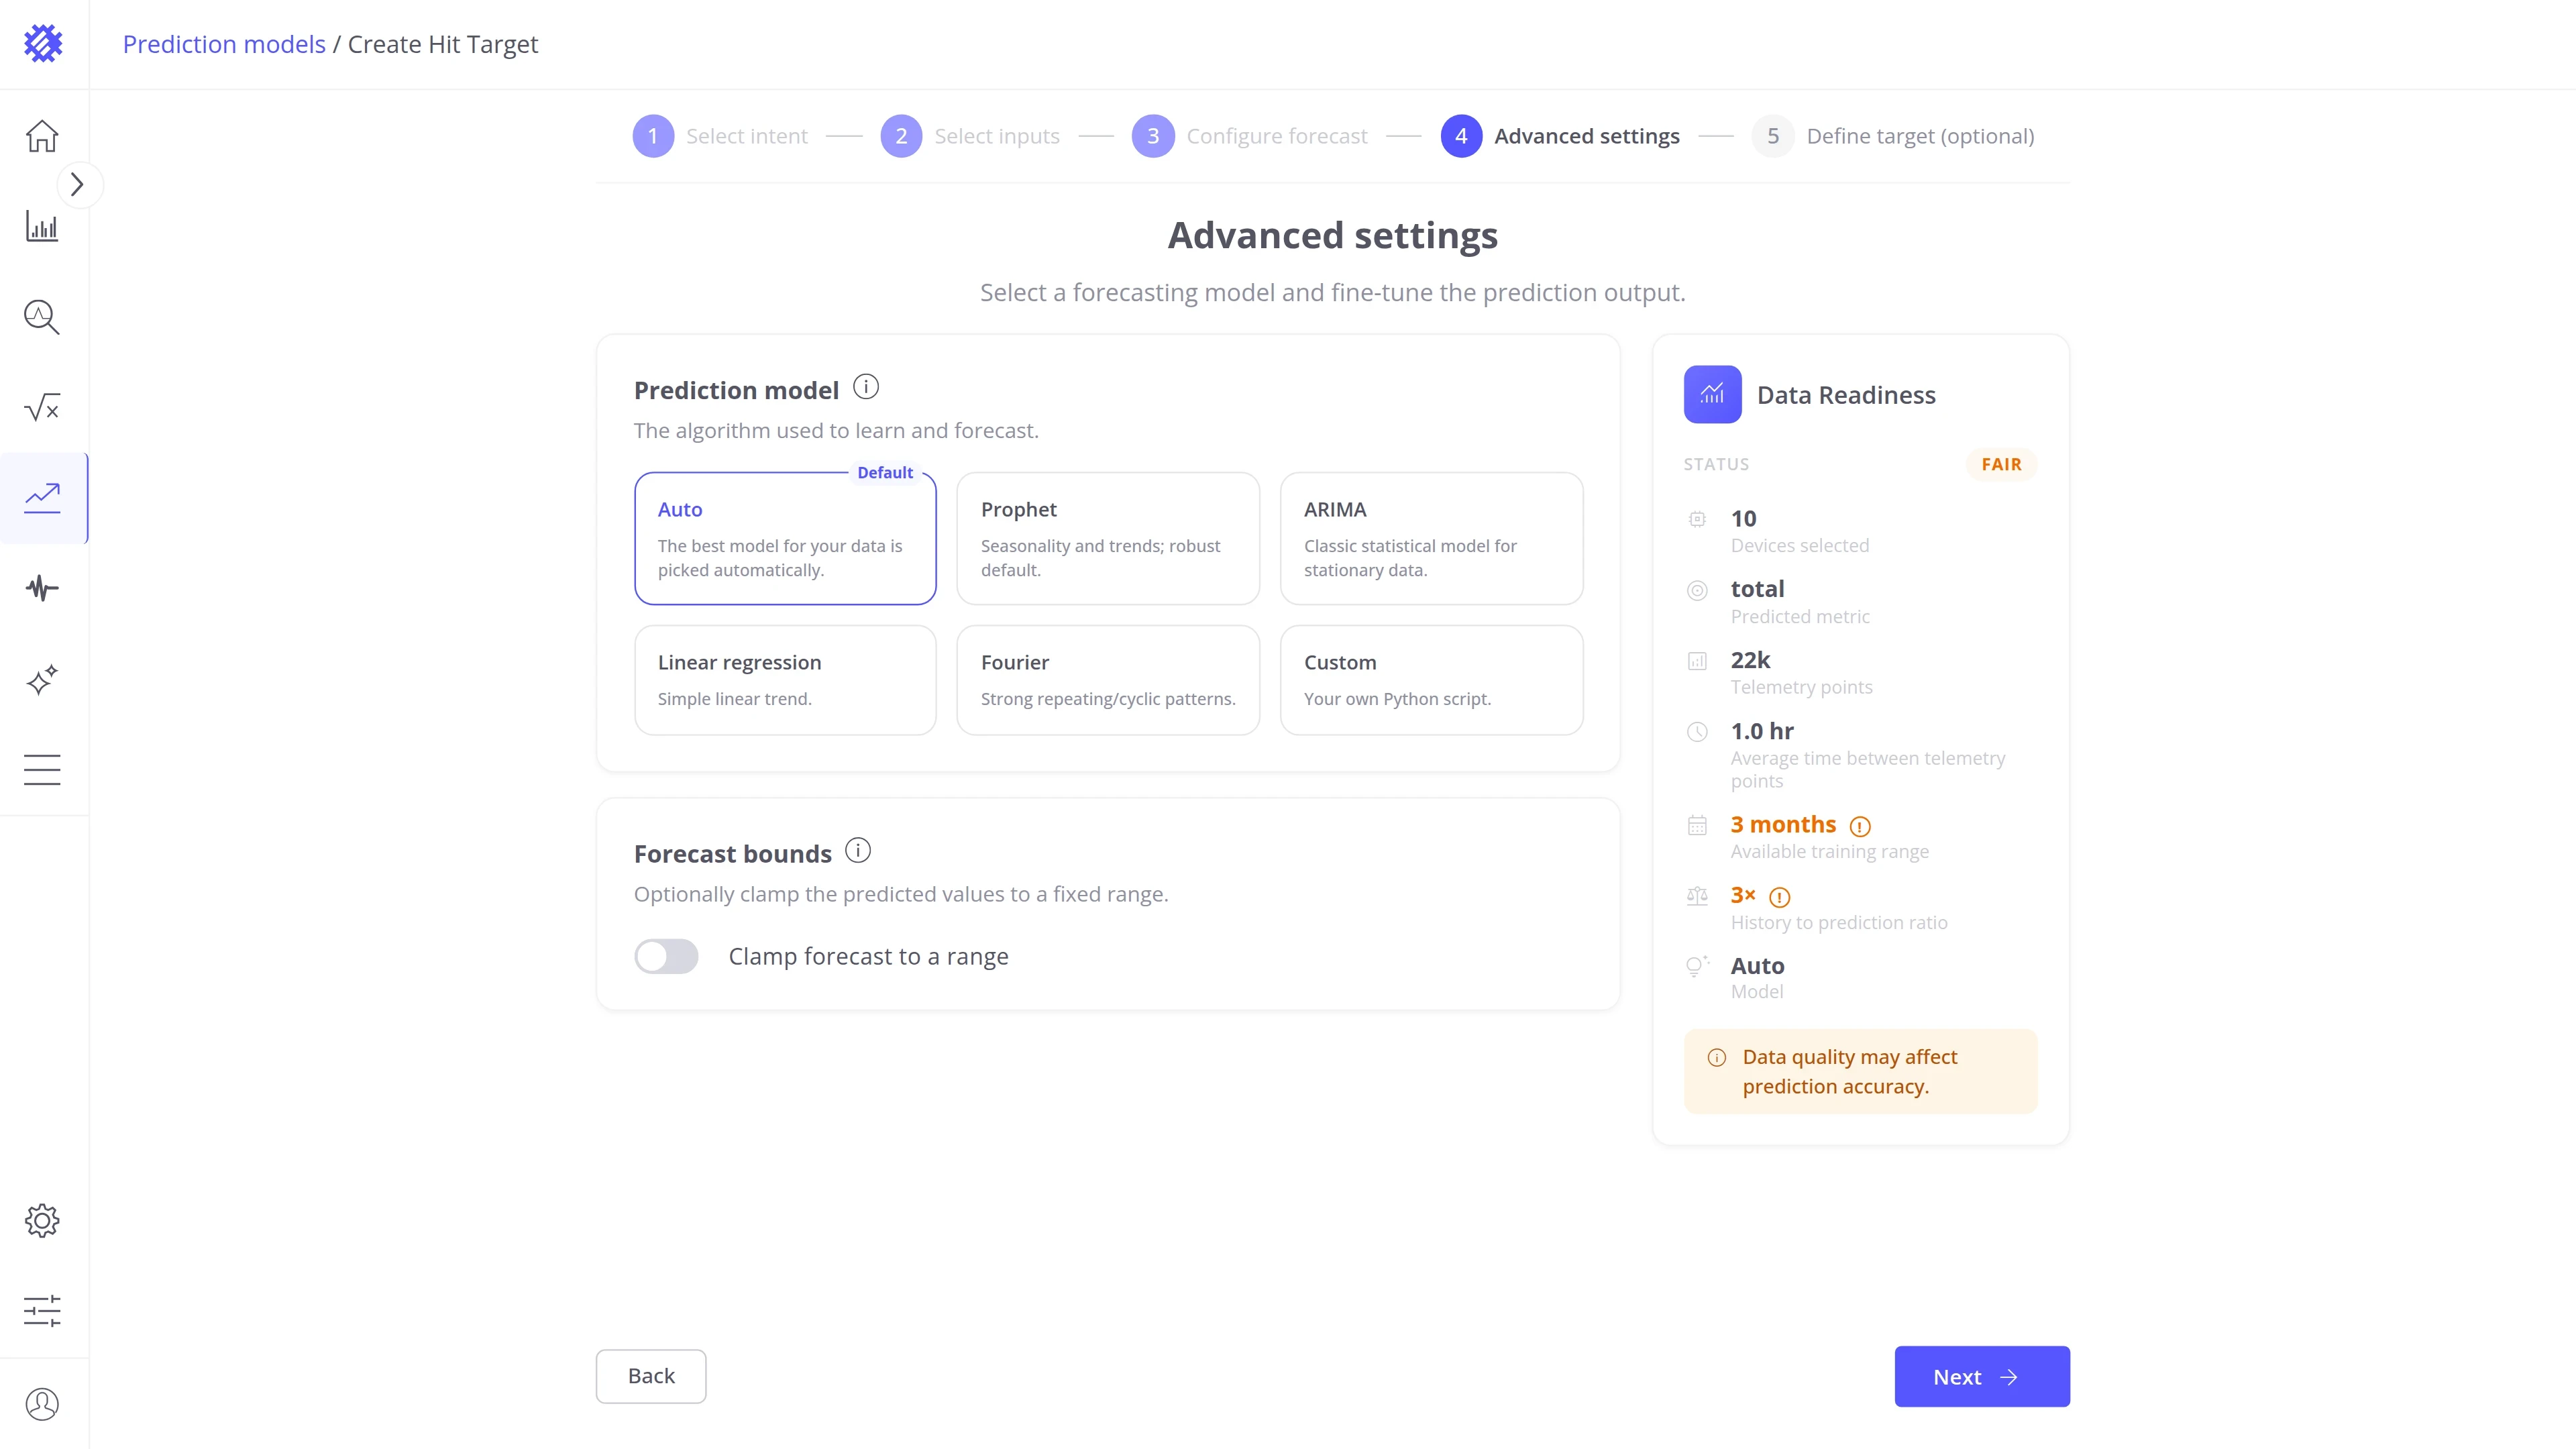
Every setting of this step is described in Wizard advanced settings.
Step 4: Define the target
Section titled “Step 4: Define the target”The fourth step creates the first target.
Target name — what the target is called on the Result tab.
Aggregation — how the values of the prediction period are combined before they are compared with the target:
| Aggregation | Behavior |
|---|---|
| Sum | The total over the prediction period. |
| Average | The mean. |
| Minimum, Maximum | The lowest or the highest value. |
Target condition — what value the aggregated metric must reach:
| Mode | Behavior |
|---|---|
| Simple | One comparison: drops below a limit to stay under, or goes above a goal to reach. The value is a Value, or an Attribute read per item. |
| From alarm rule | Reuses one severity of an existing ThingsBoard alarm rule. |
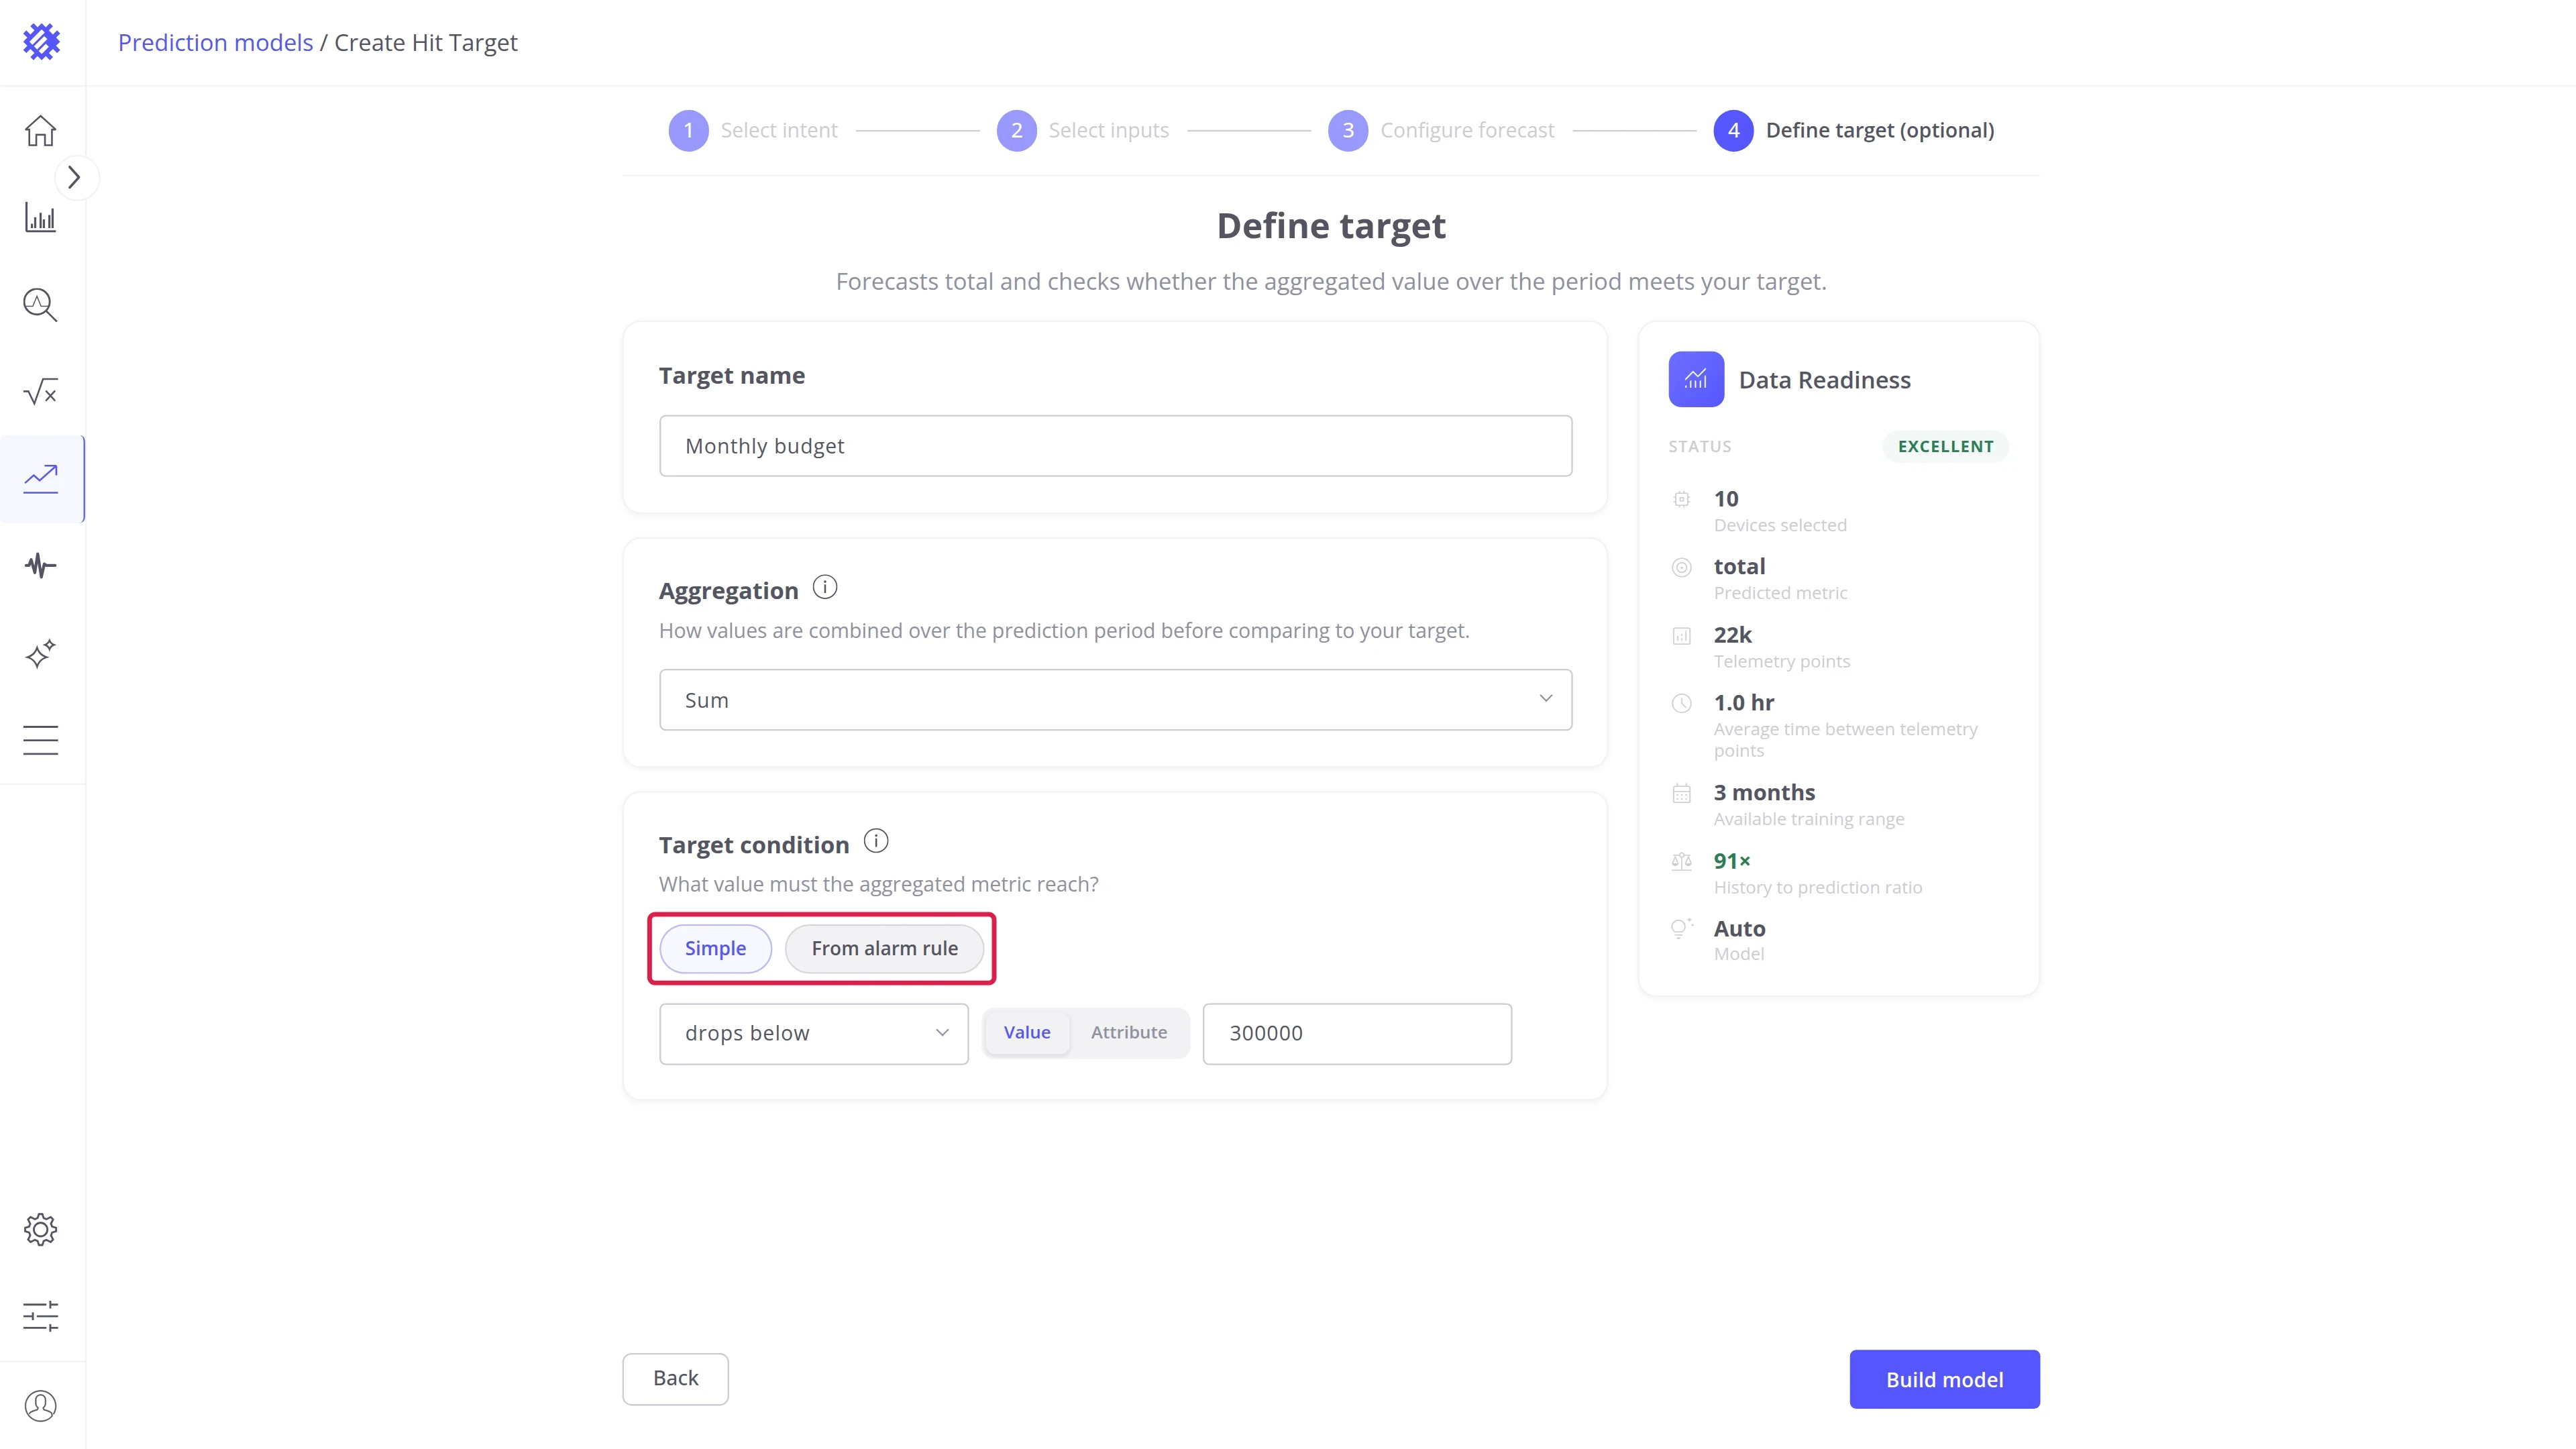
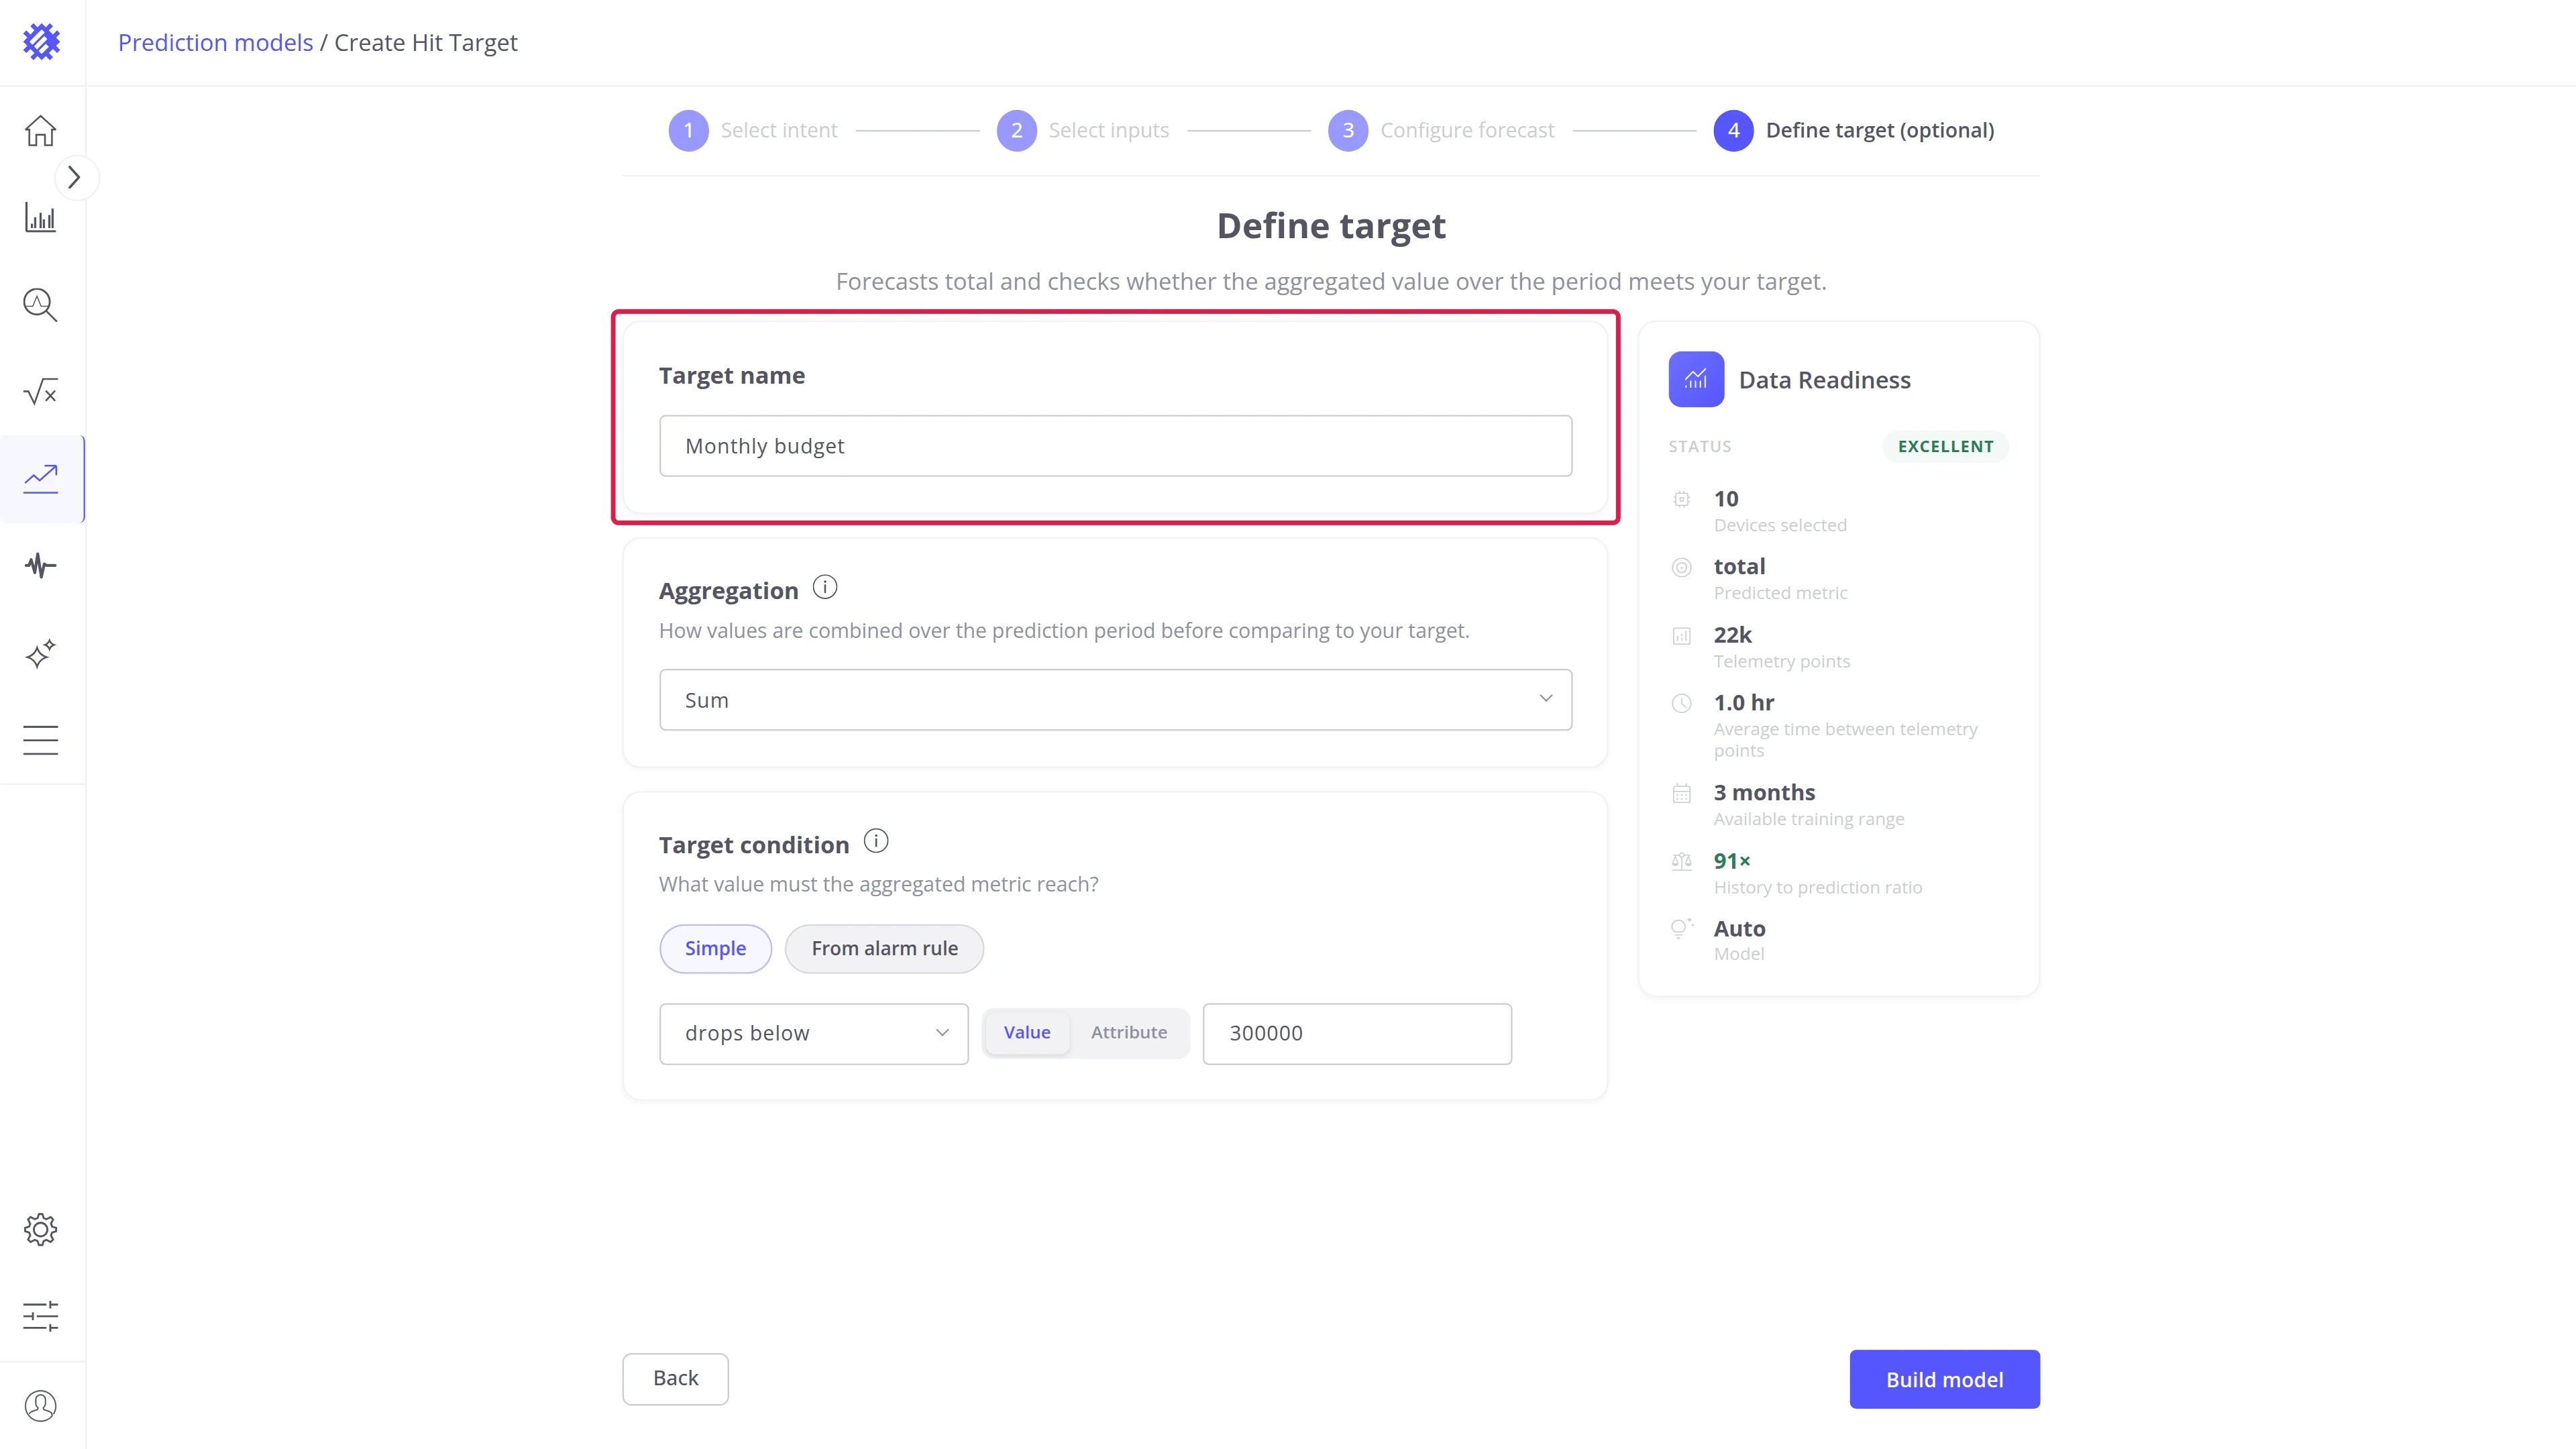
An Attribute gives every site its own budget from its own attribute, with one target.
Alarms and telemetry for the target are switched on afterwards, in Targets.
Step 5: Build the model
Section titled “Step 5: Build the model”Data Readiness — check the status before you train. The better it is, the better the resulting forecast:
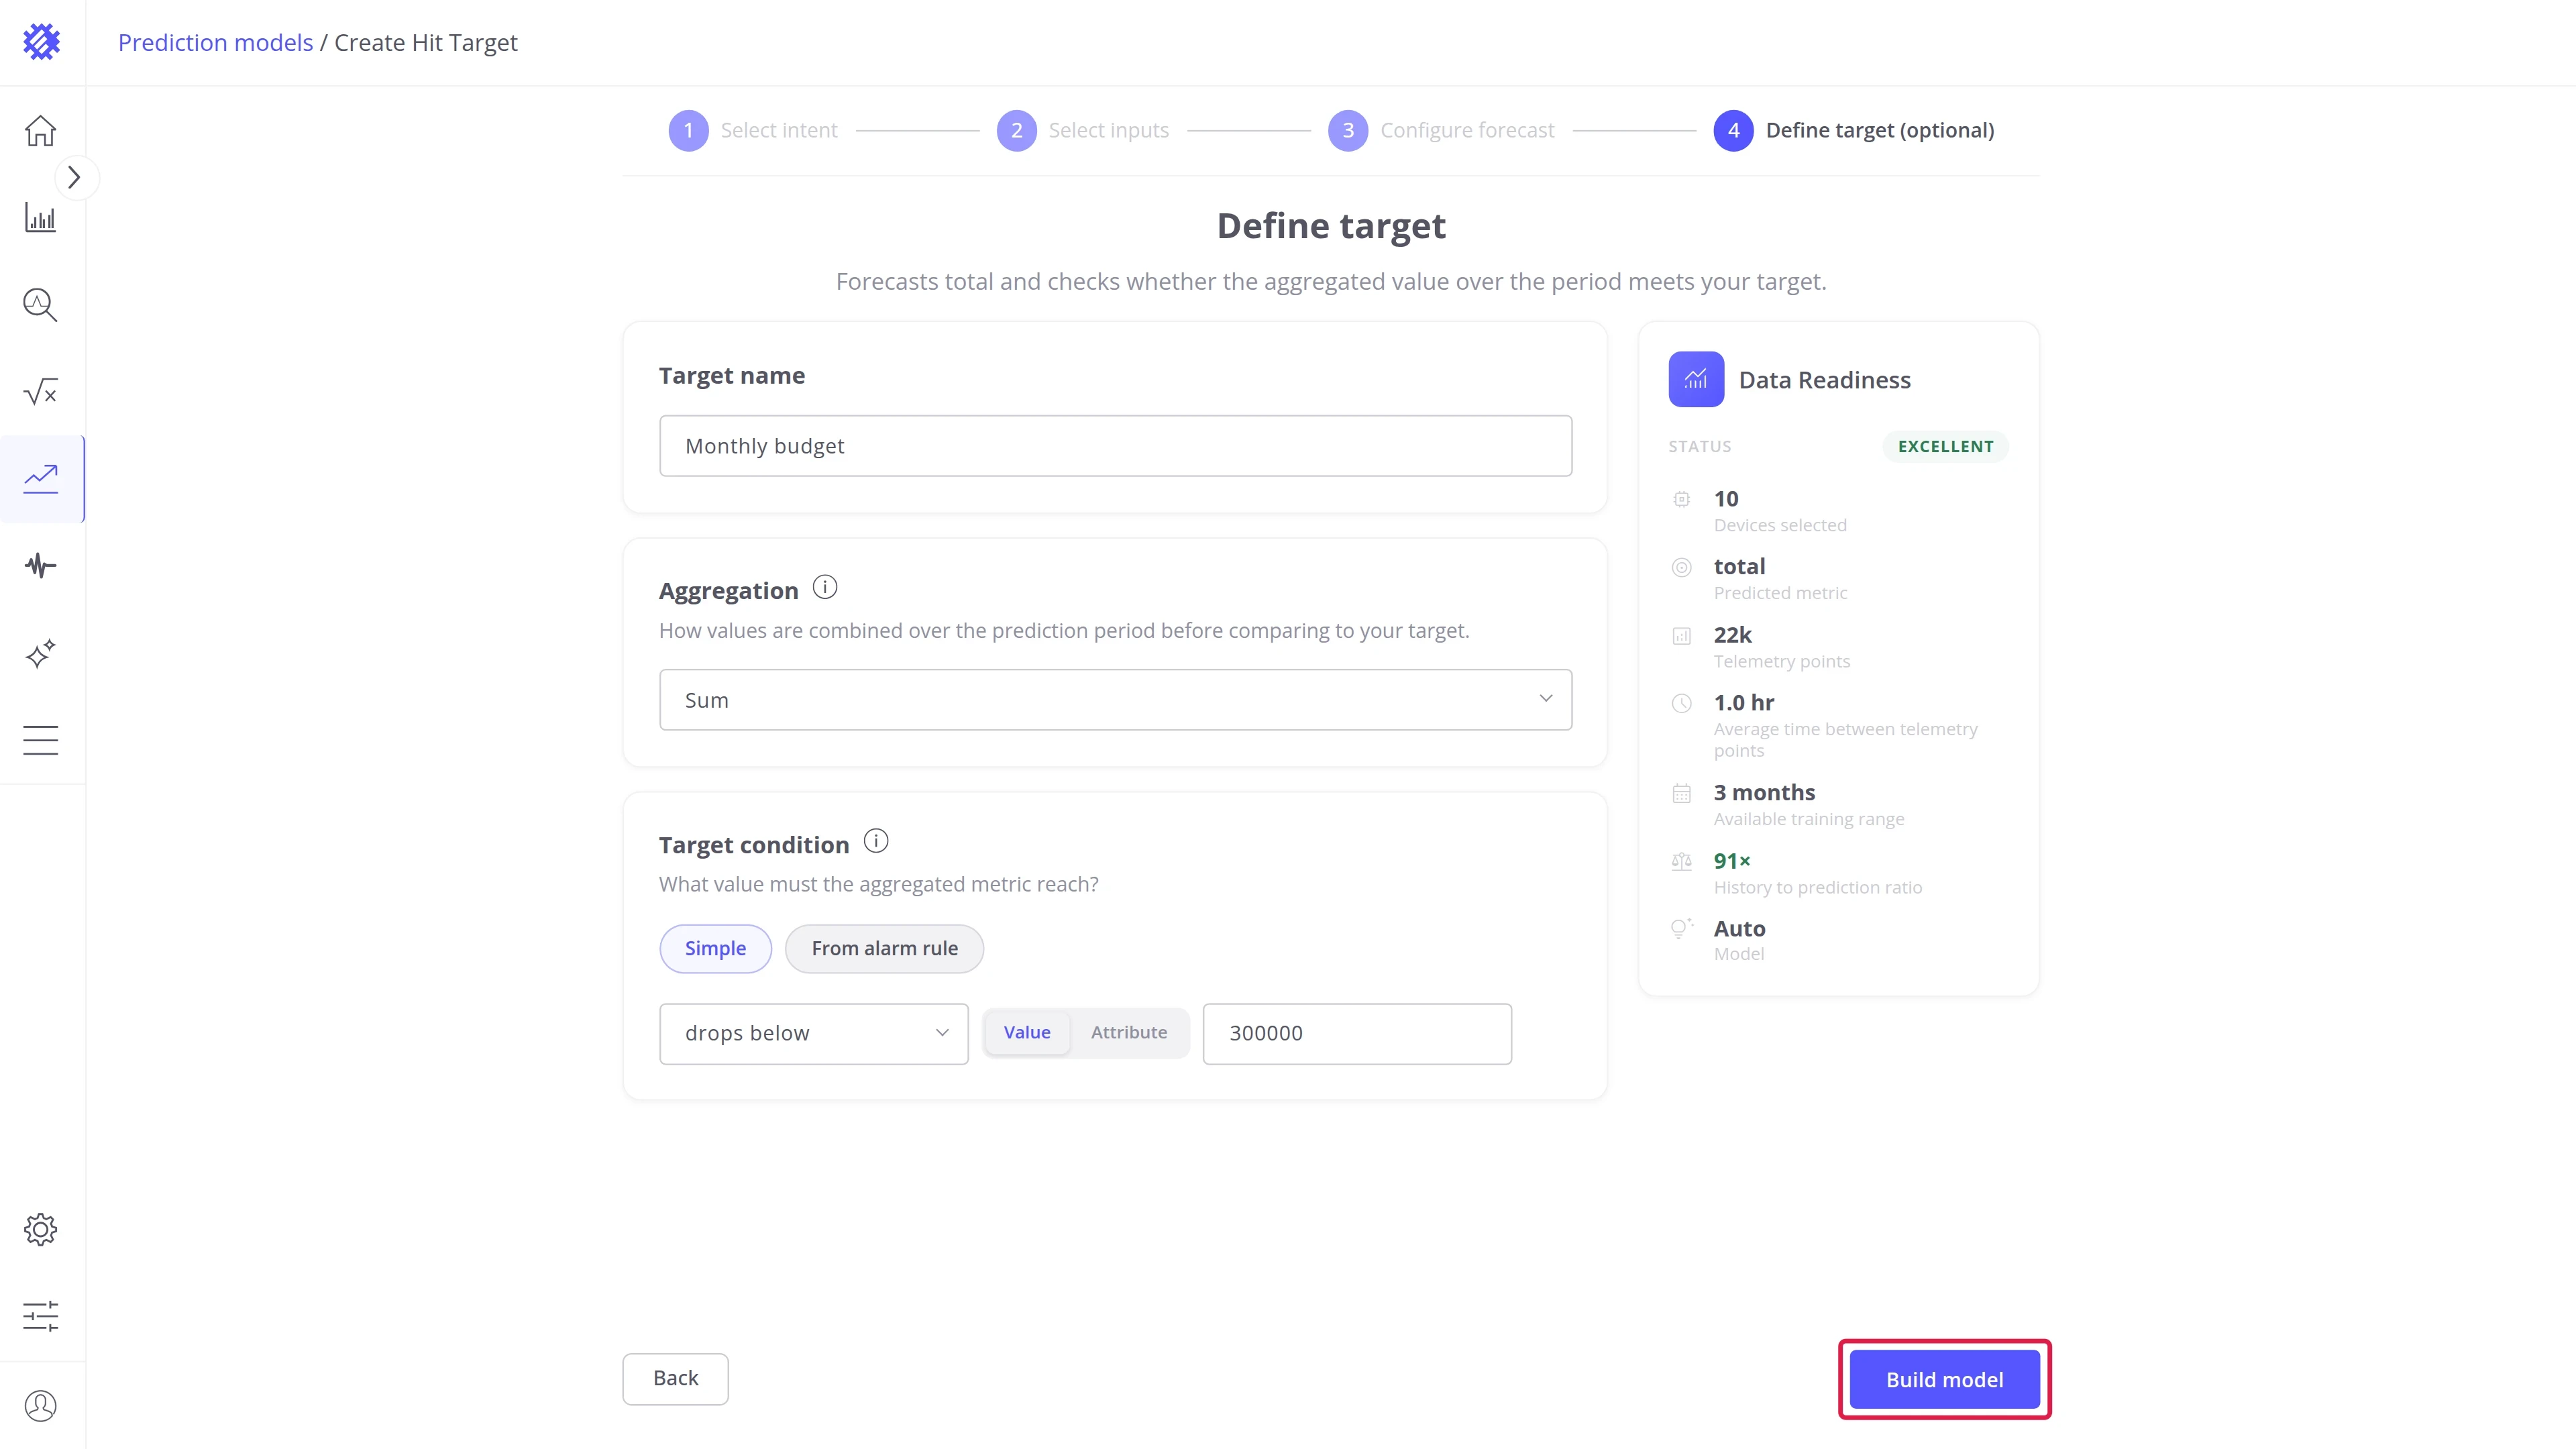
Build model — trains one model per item, checks the target for each, and opens the Result tab when the run finishes:
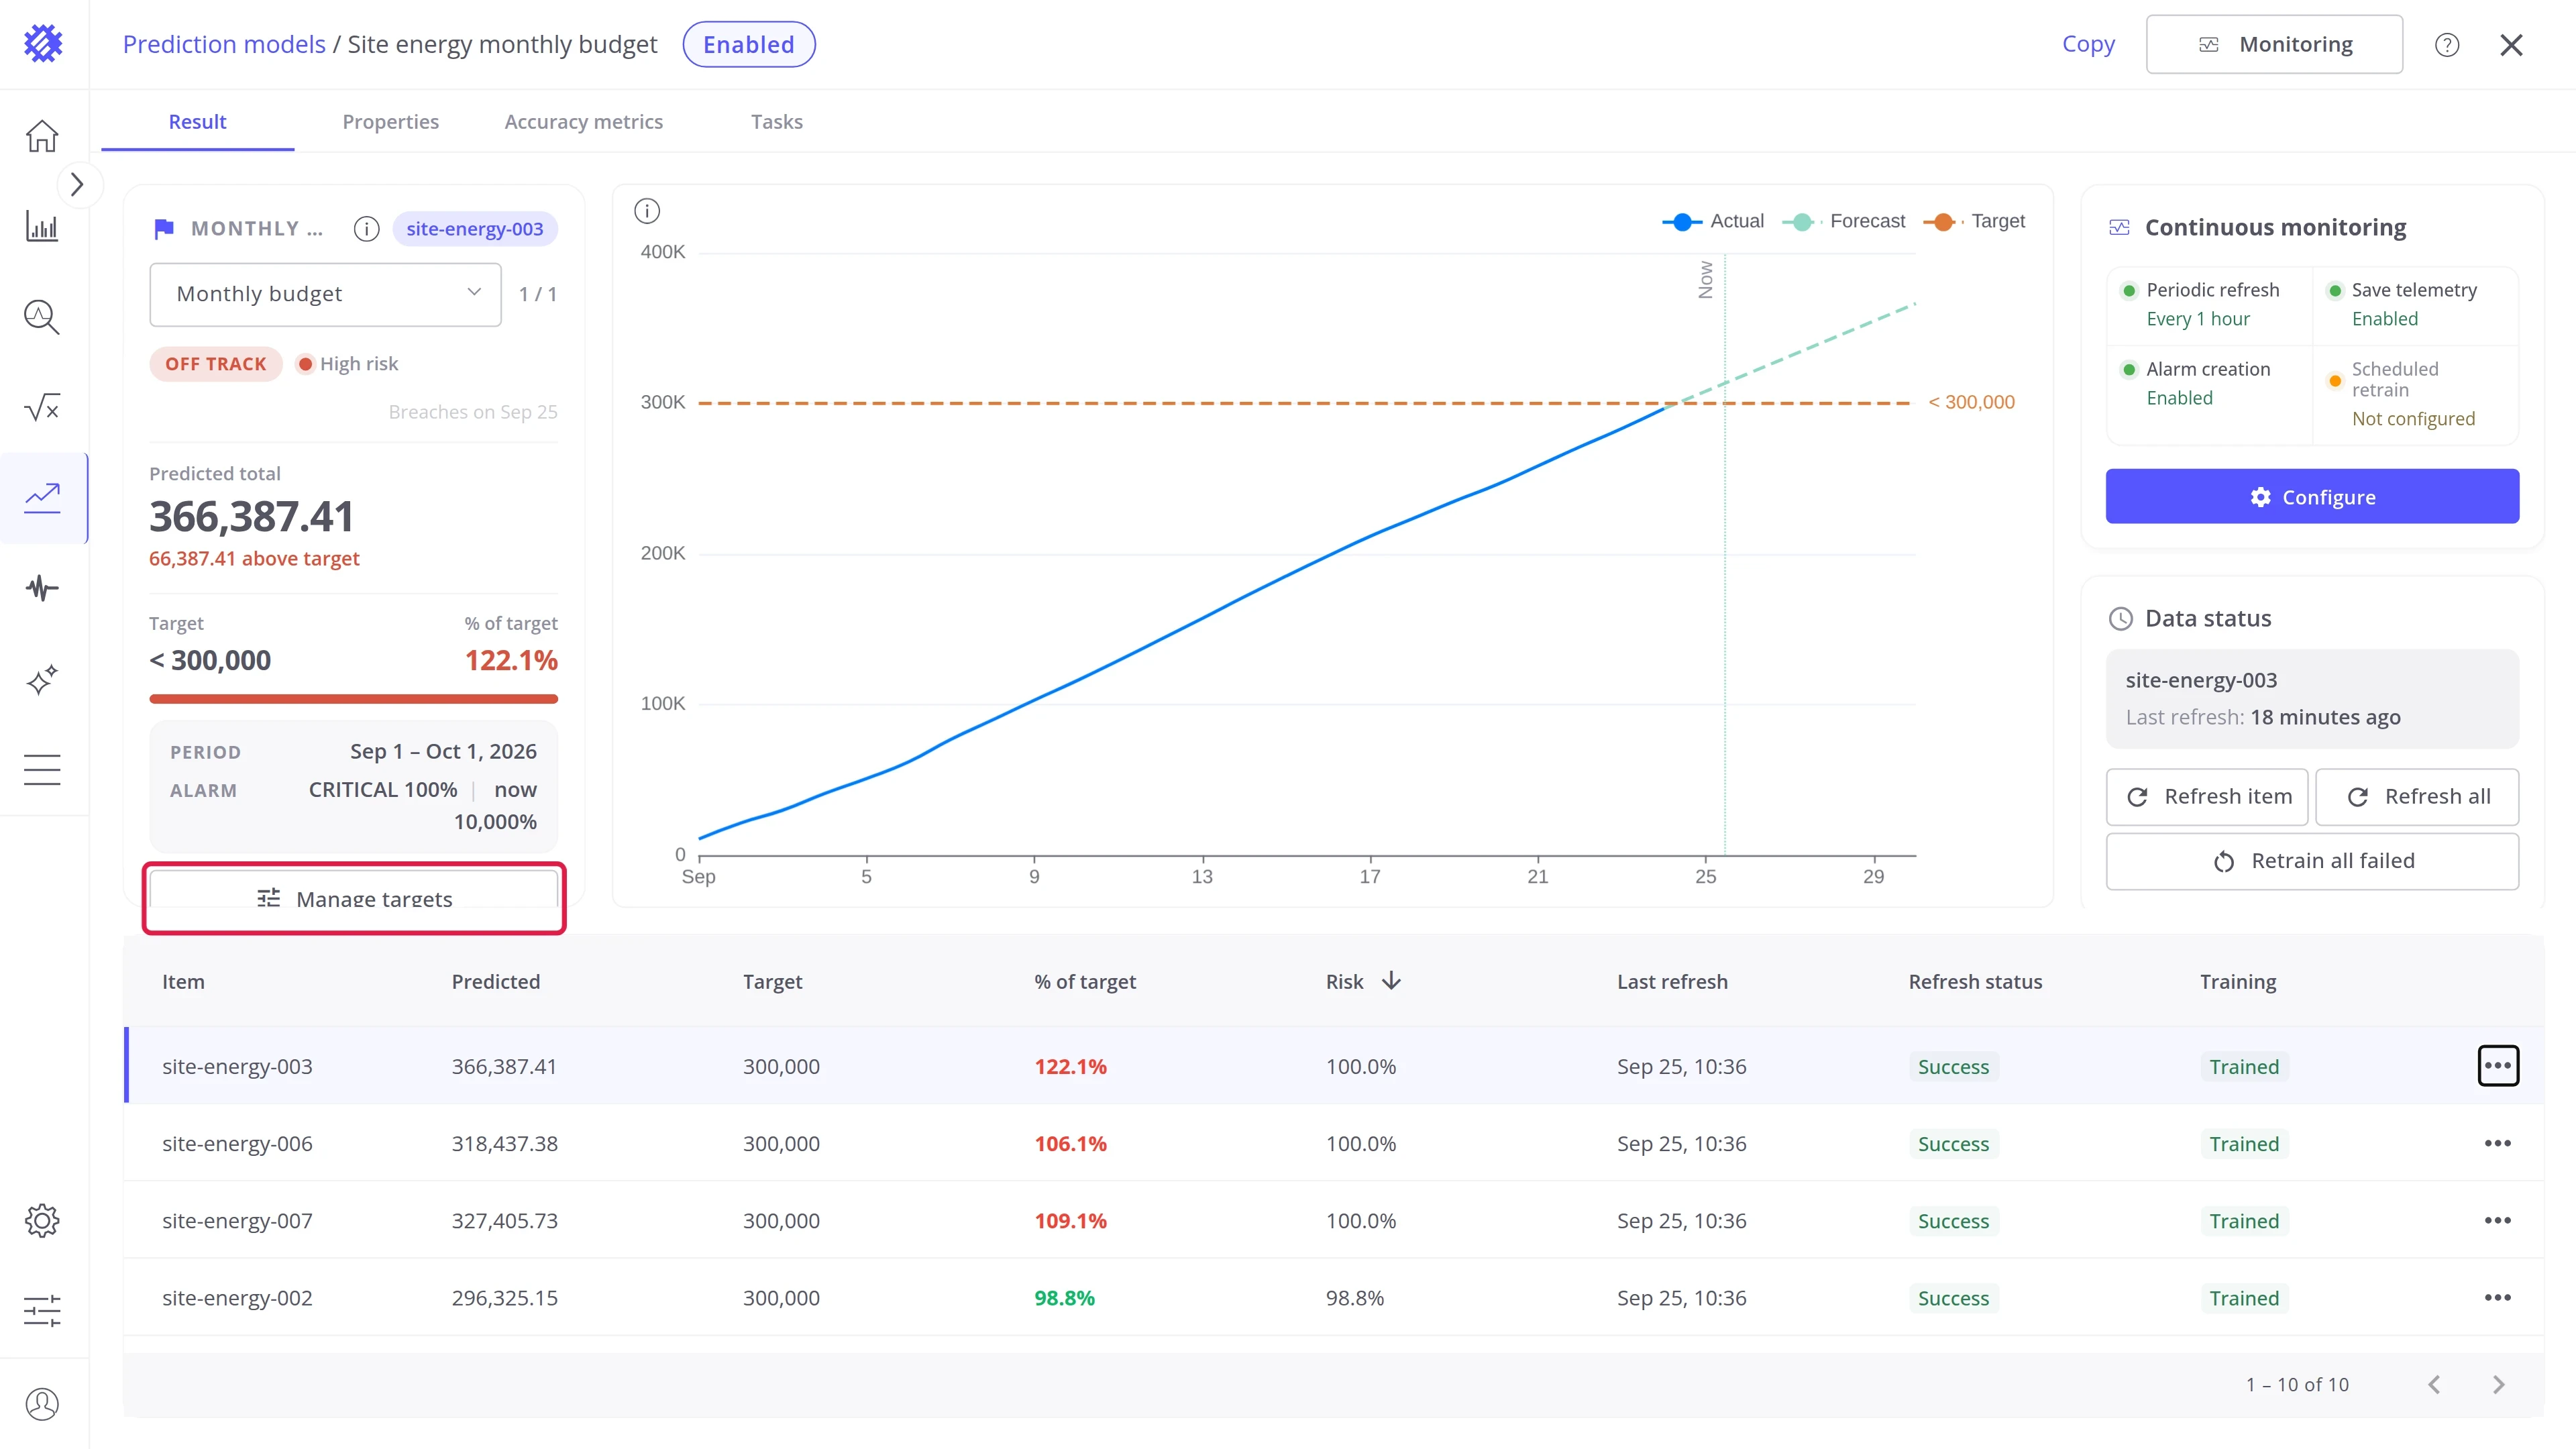
Hit Target result page
Section titled “Hit Target result page”The Result tab shows one target for one item at a time. Pick the item in the table below the chart; the cards on the right show the monitoring settings and the data status of the model.
Target card
Section titled “Target card”The card on the left shows the selected target for the selected item. The selector at its top switches targets when the model has several.
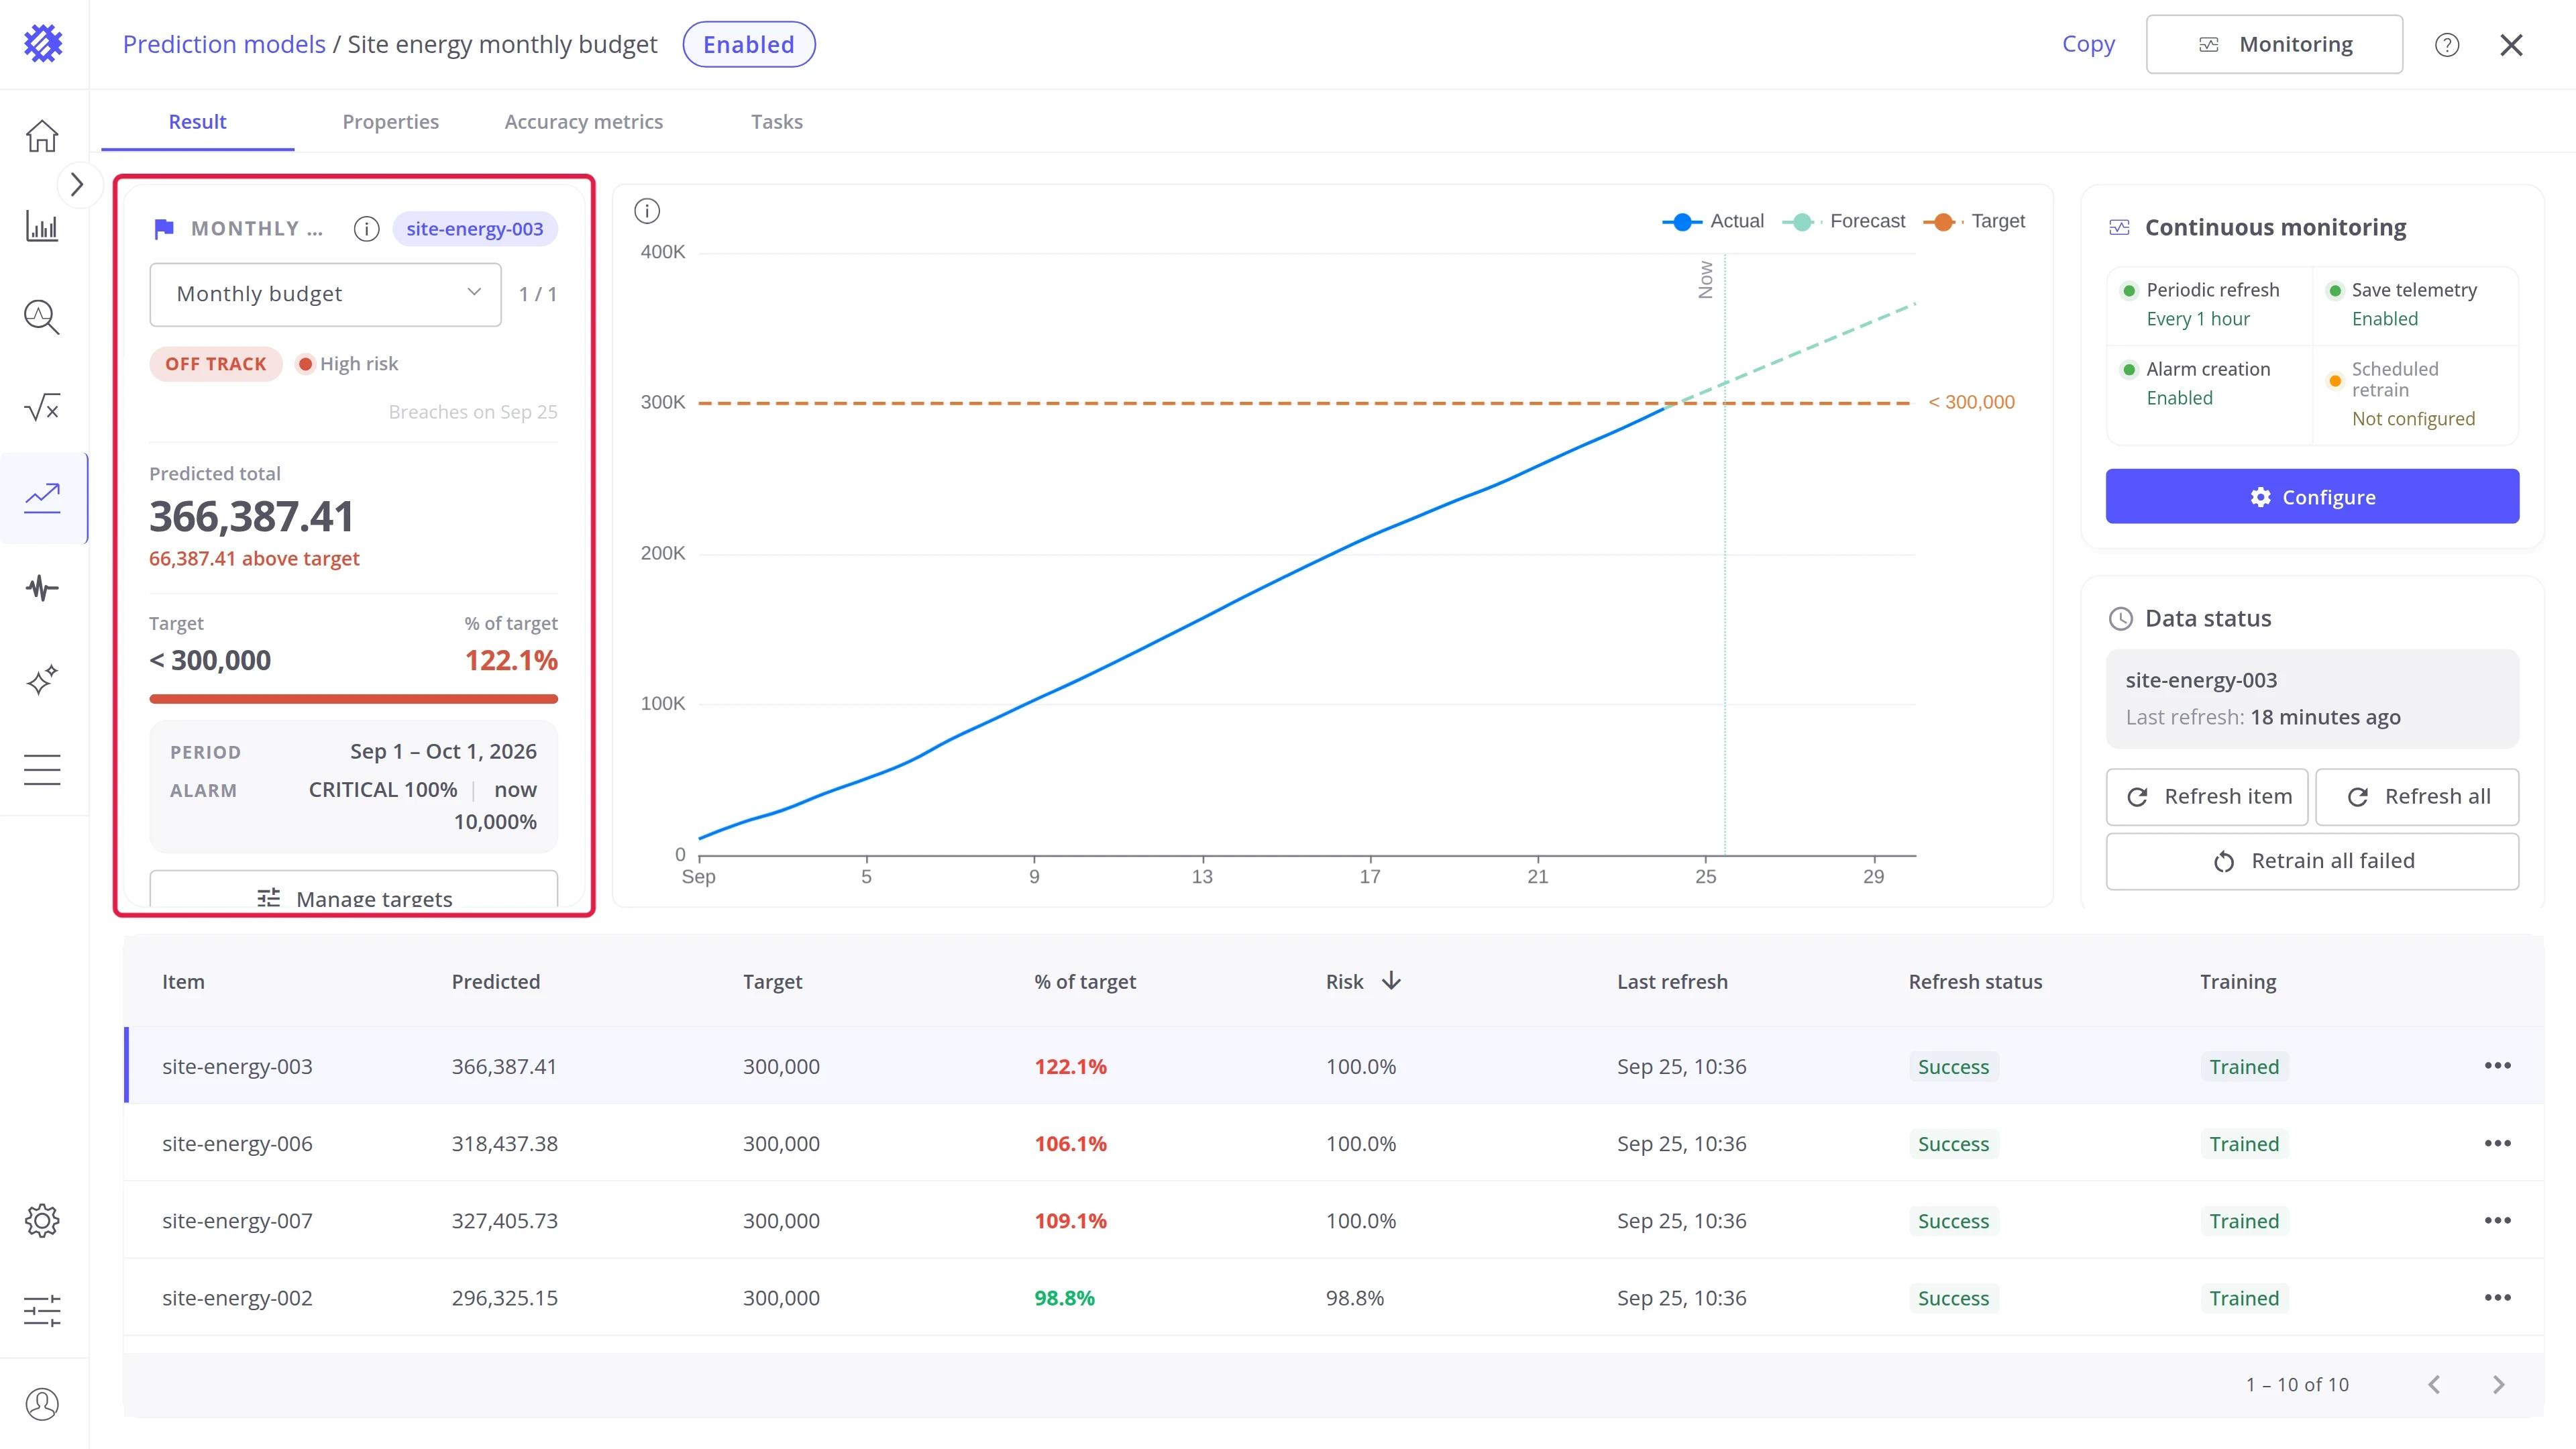
| Field | Meaning |
|---|---|
| On track or Off track | Whether the predicted total meets the target condition |
| Risk | Low, Medium, or High risk of missing the target |
| Breaches on | The day the running total is expected to cross the target, for an item that is off track |
| Predicted total | The measured part of the period plus the forecast for the rest, and its distance from the target |
| Target and % of target | The condition, and the predicted total as a share of it |
| Period | The period the target is measured over |
| Alarm | The severity of the raised alarm, or No alarm |
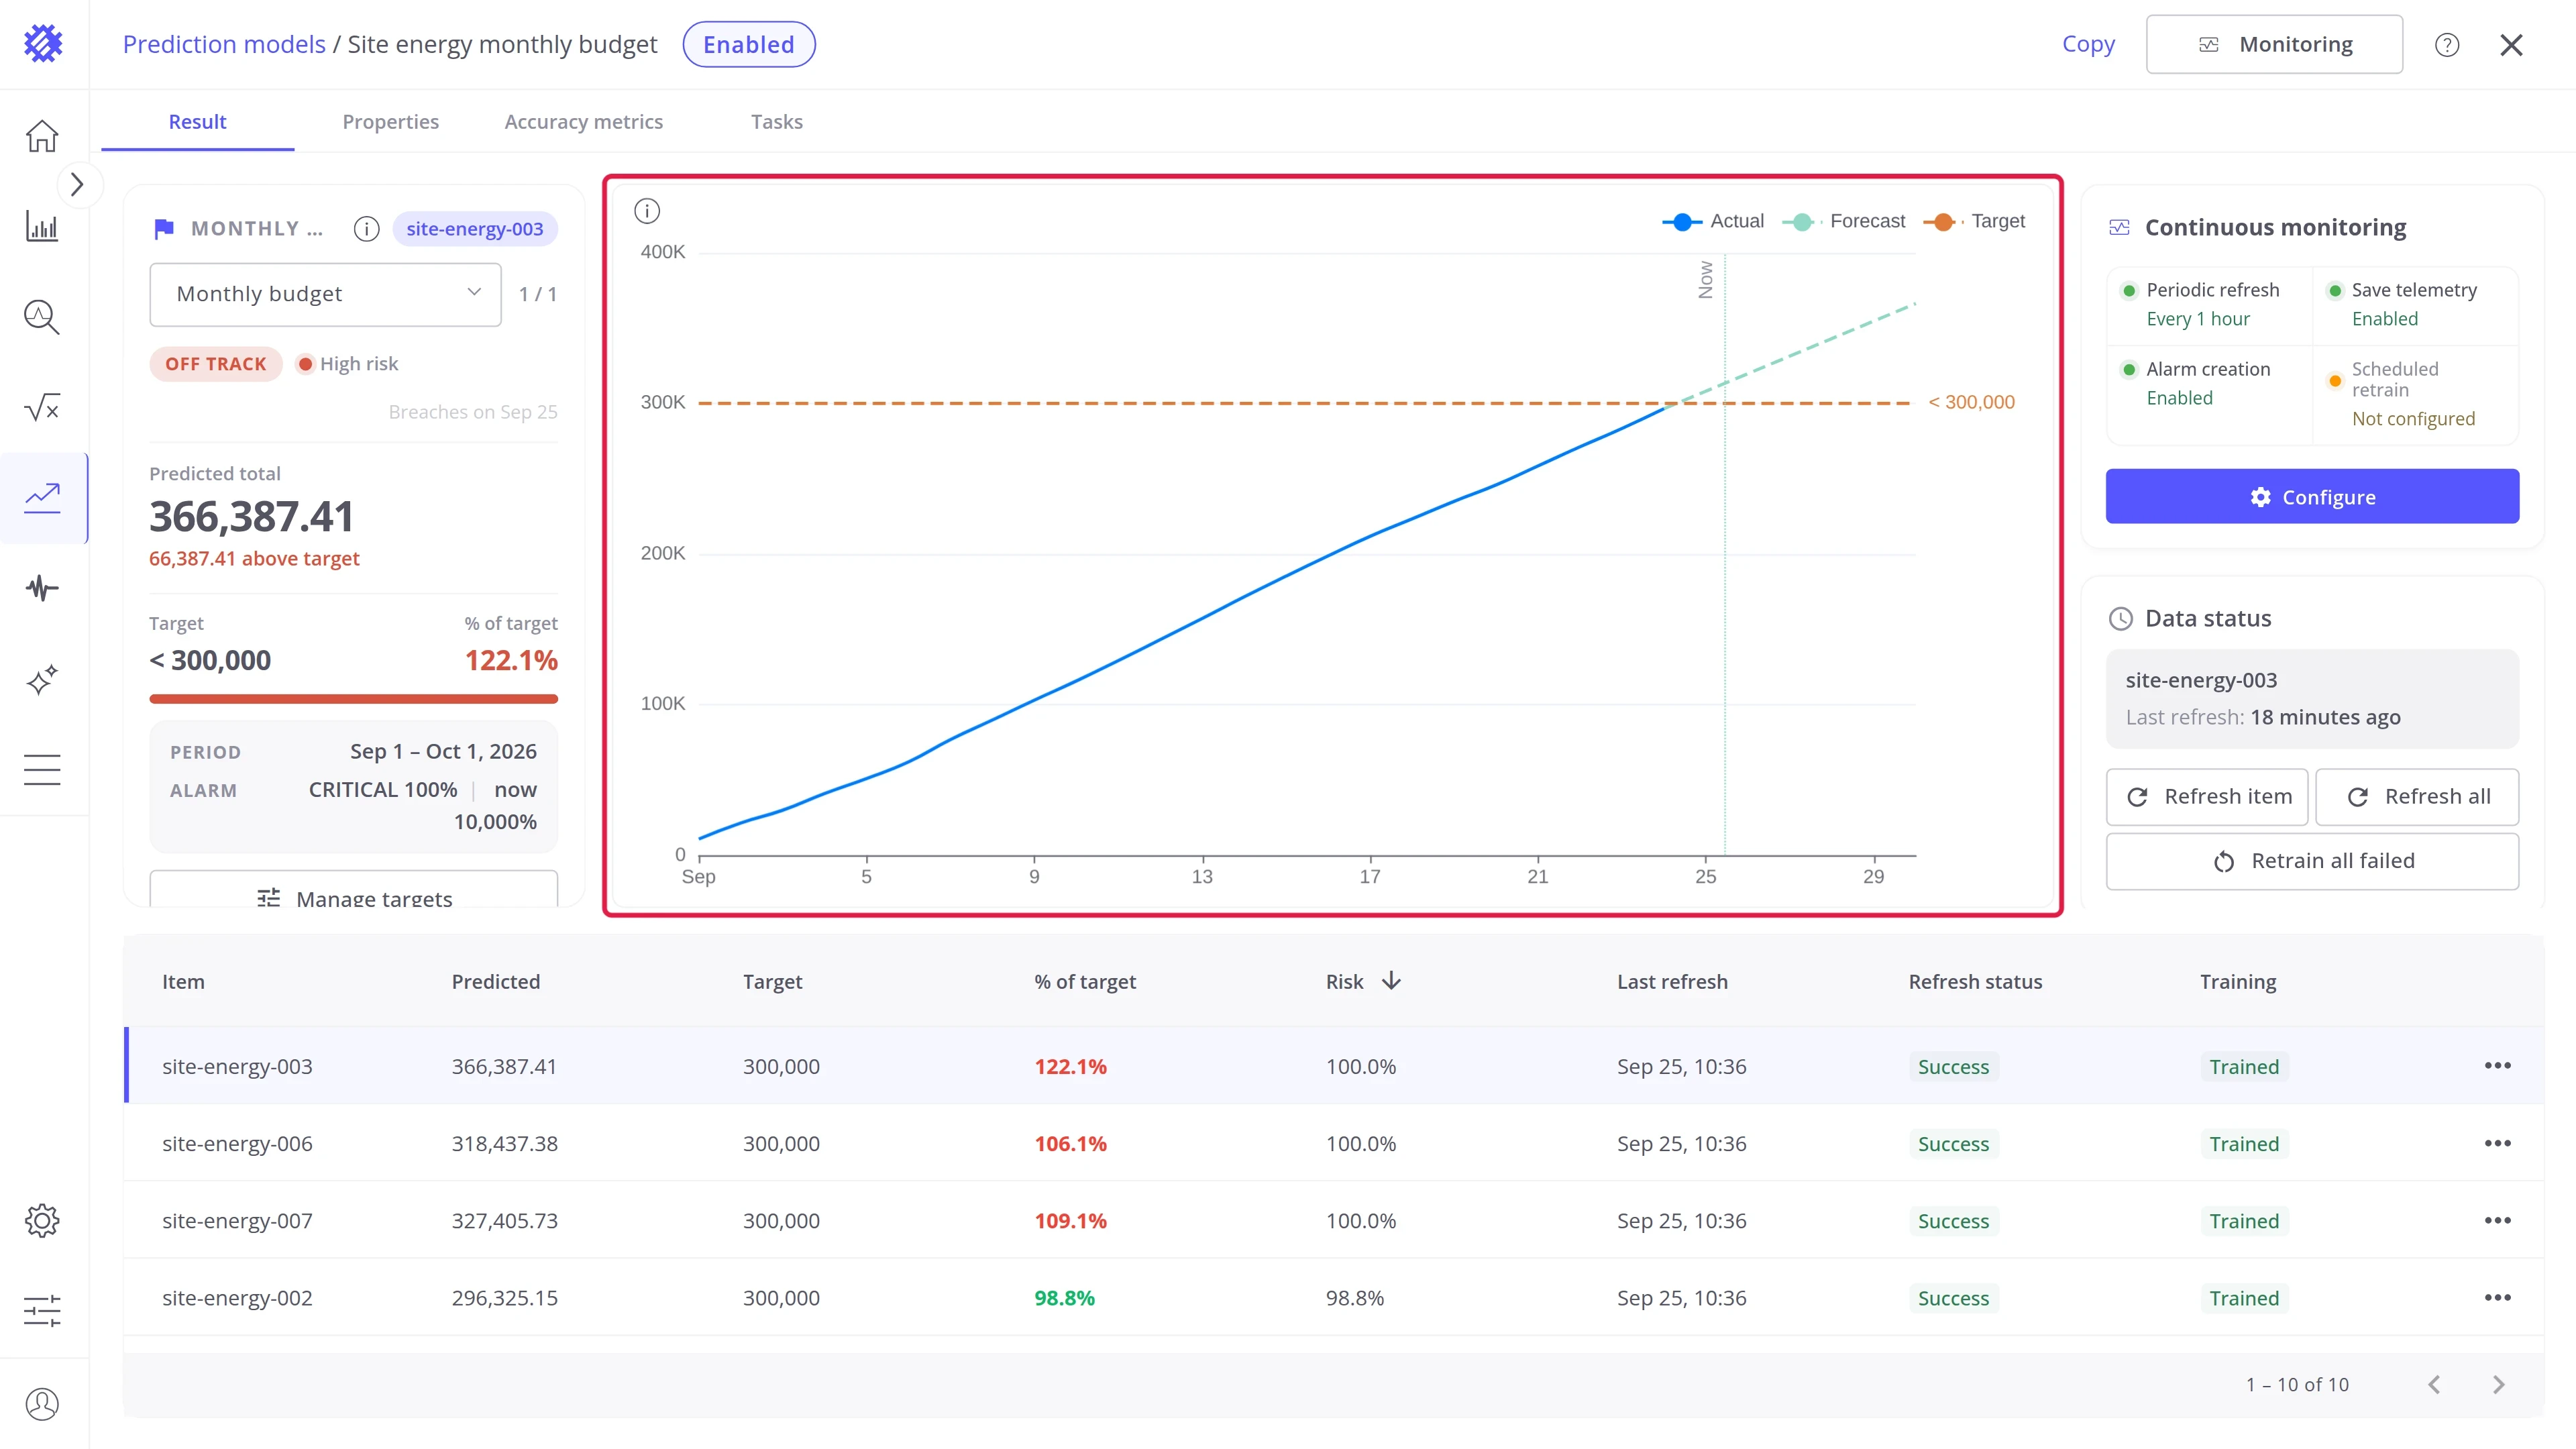
Target chart
Section titled “Target chart”The chart shows the running total of the selected item over the period: the measured part as a solid line, the forecast as a dashed line, and the Target as a horizontal line.
Items table
Section titled “Items table”The table under the chart is sorted by risk, so the items most likely to miss come first. Select a row to switch the card and the chart to that item.
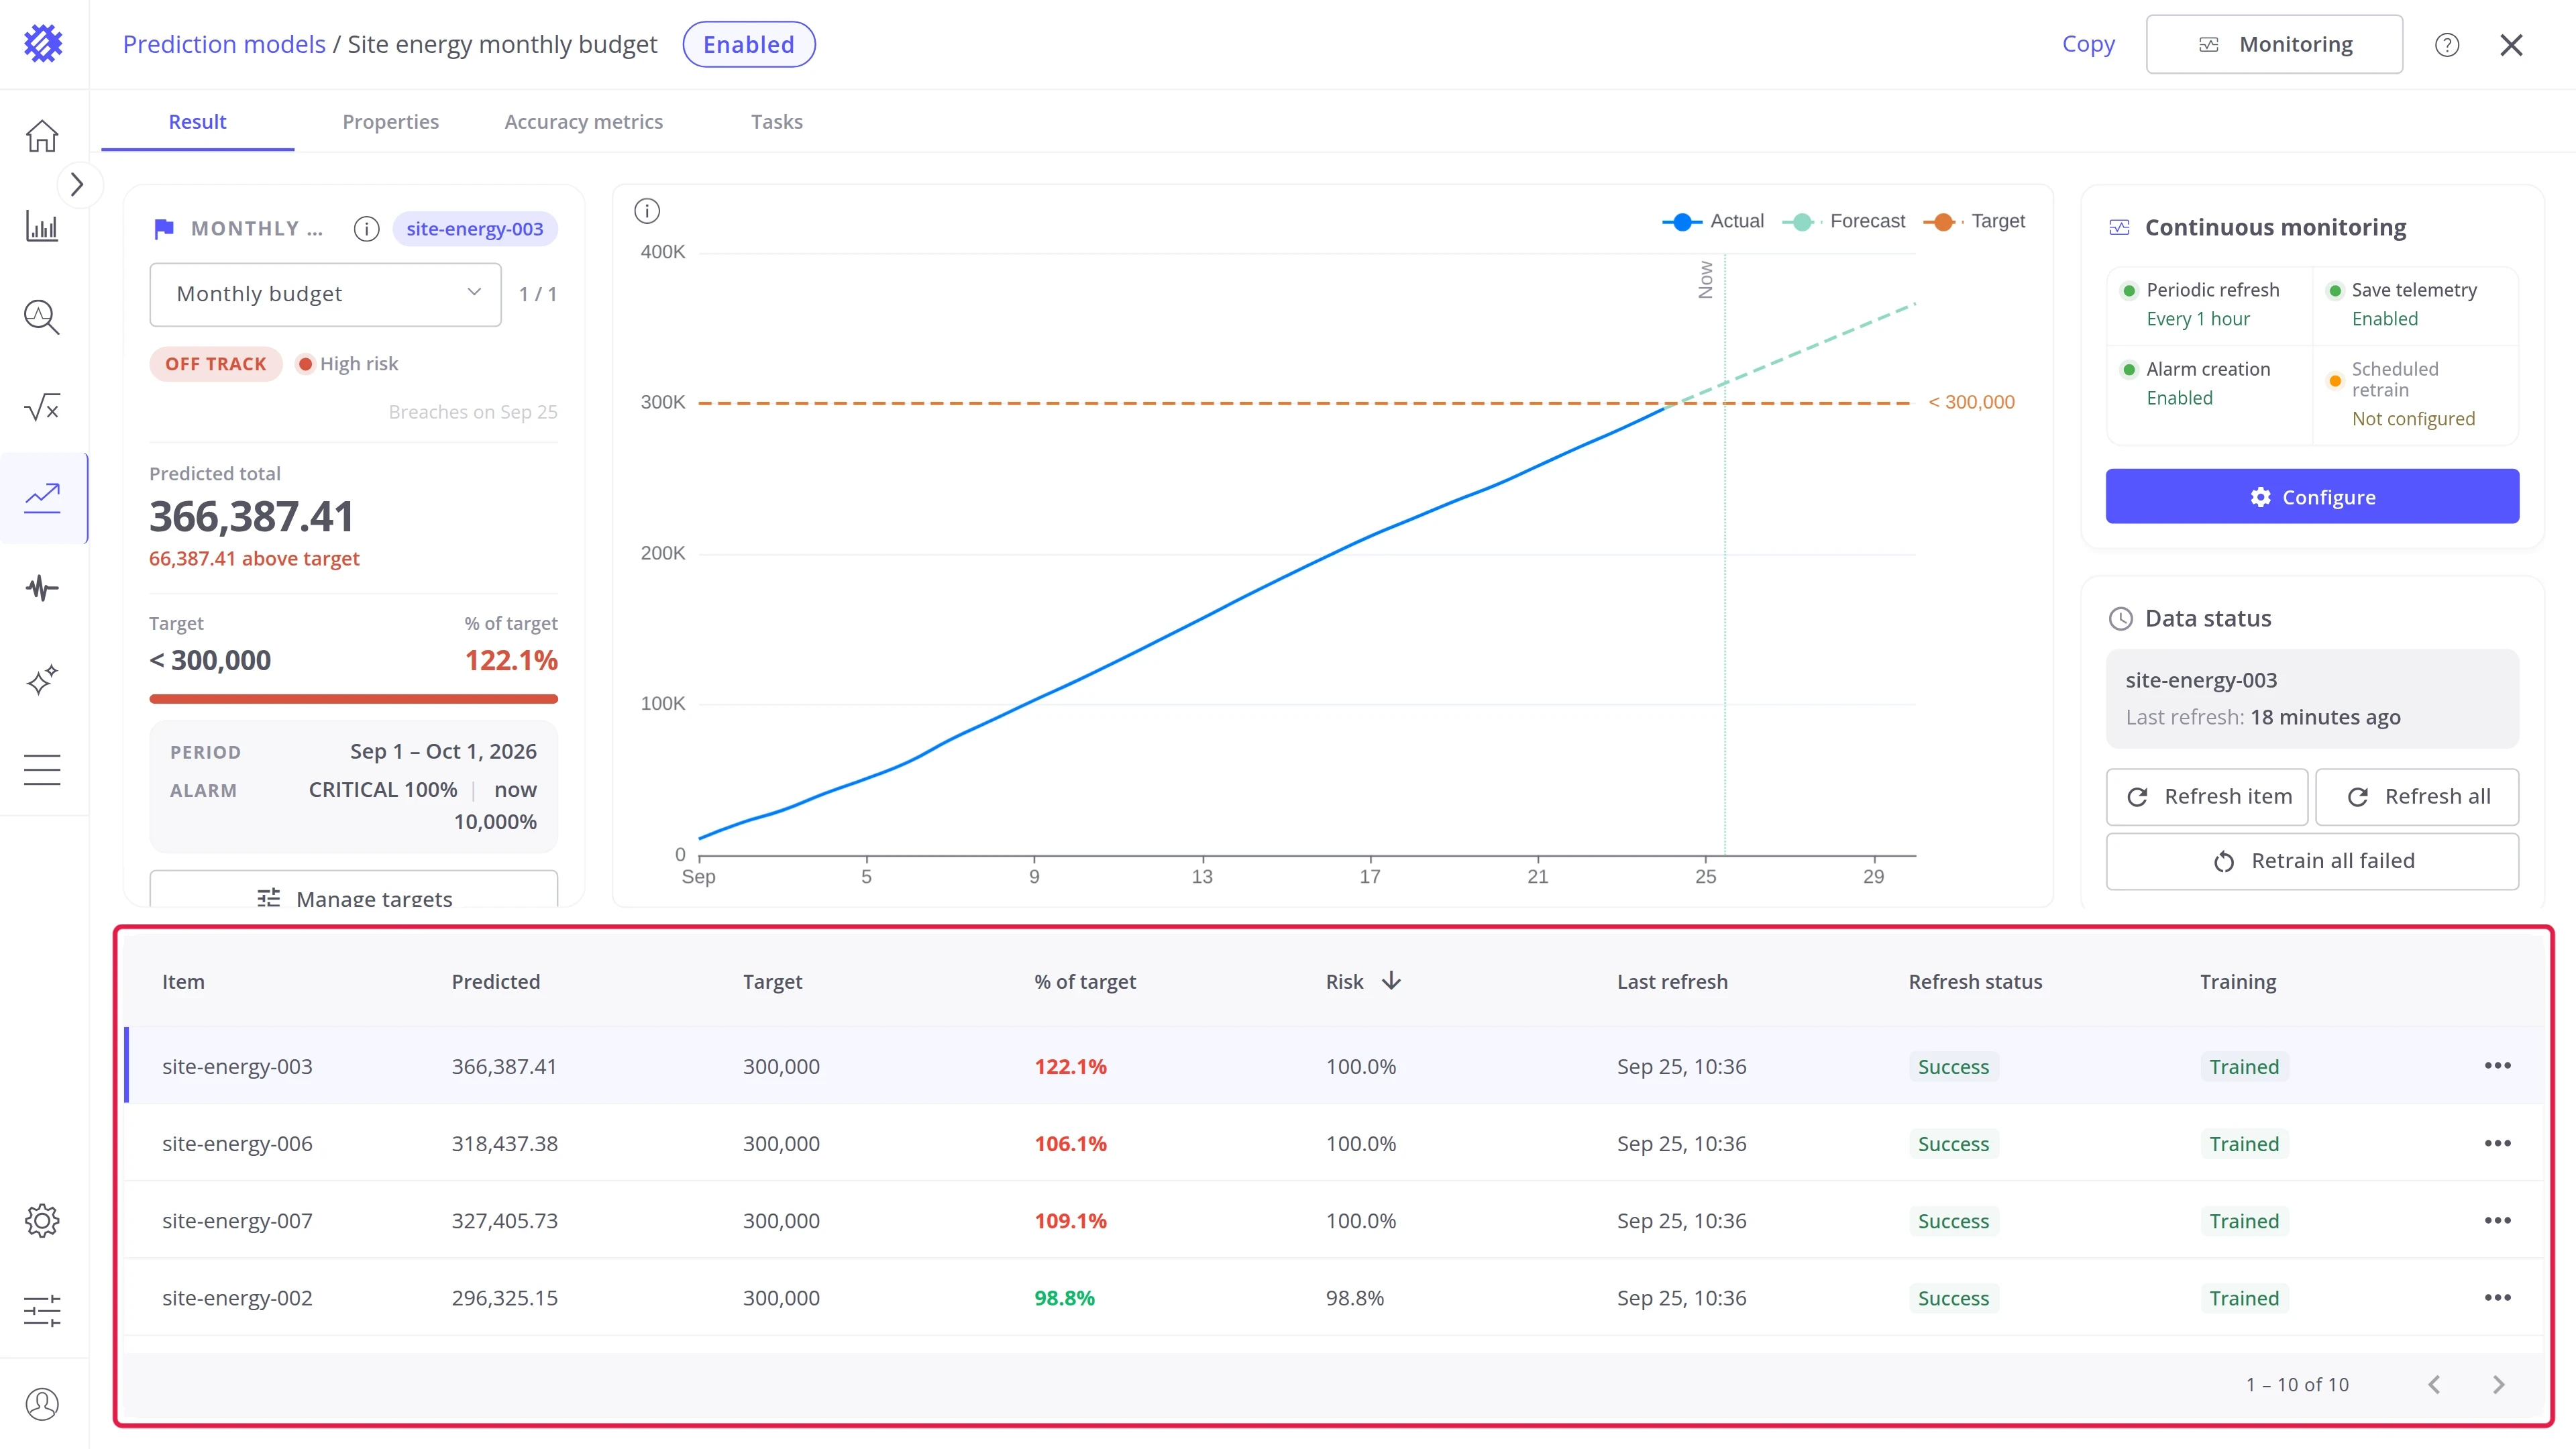
| Column | Meaning |
|---|---|
| Item | The device or asset name |
| Predicted | The predicted total at the end of the period |
| Target | The value the predicted total is compared with |
| % of target | The predicted total as a share of the target |
| Risk | The risk of missing the target, which the table is sorted by |
| Last refresh, Refresh status, Training | The item’s refresh and training state |
Item actions
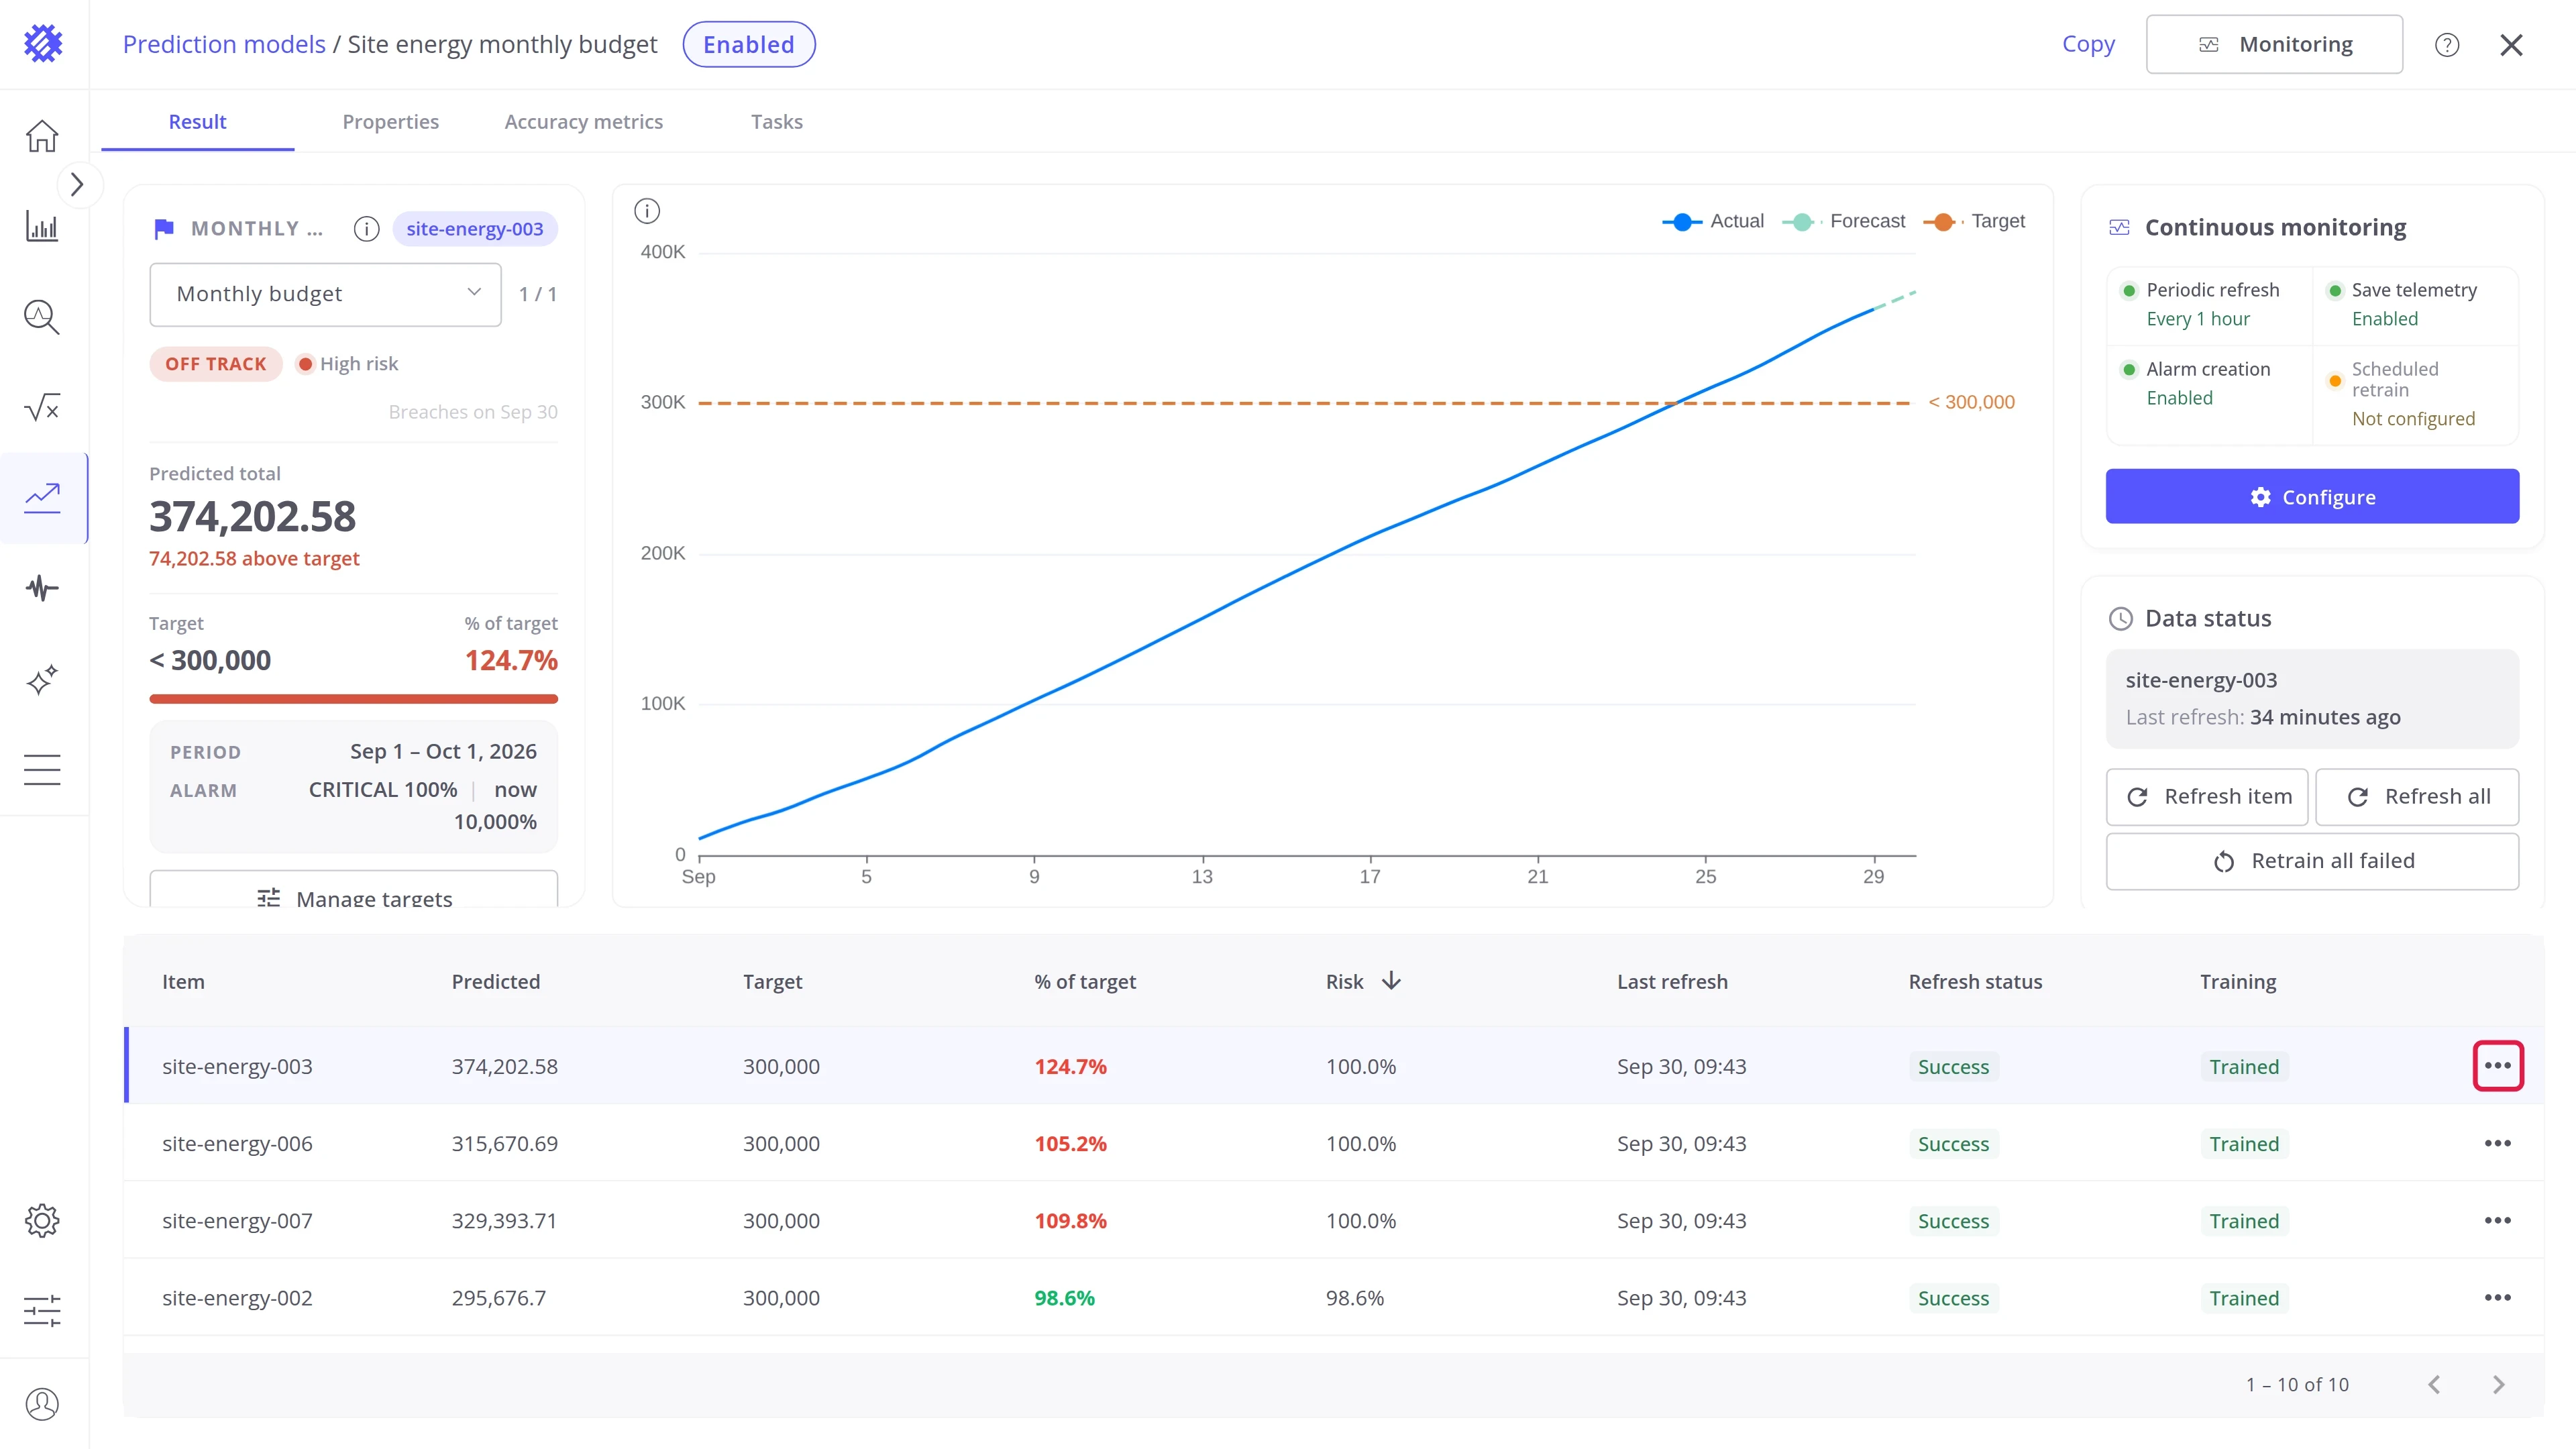
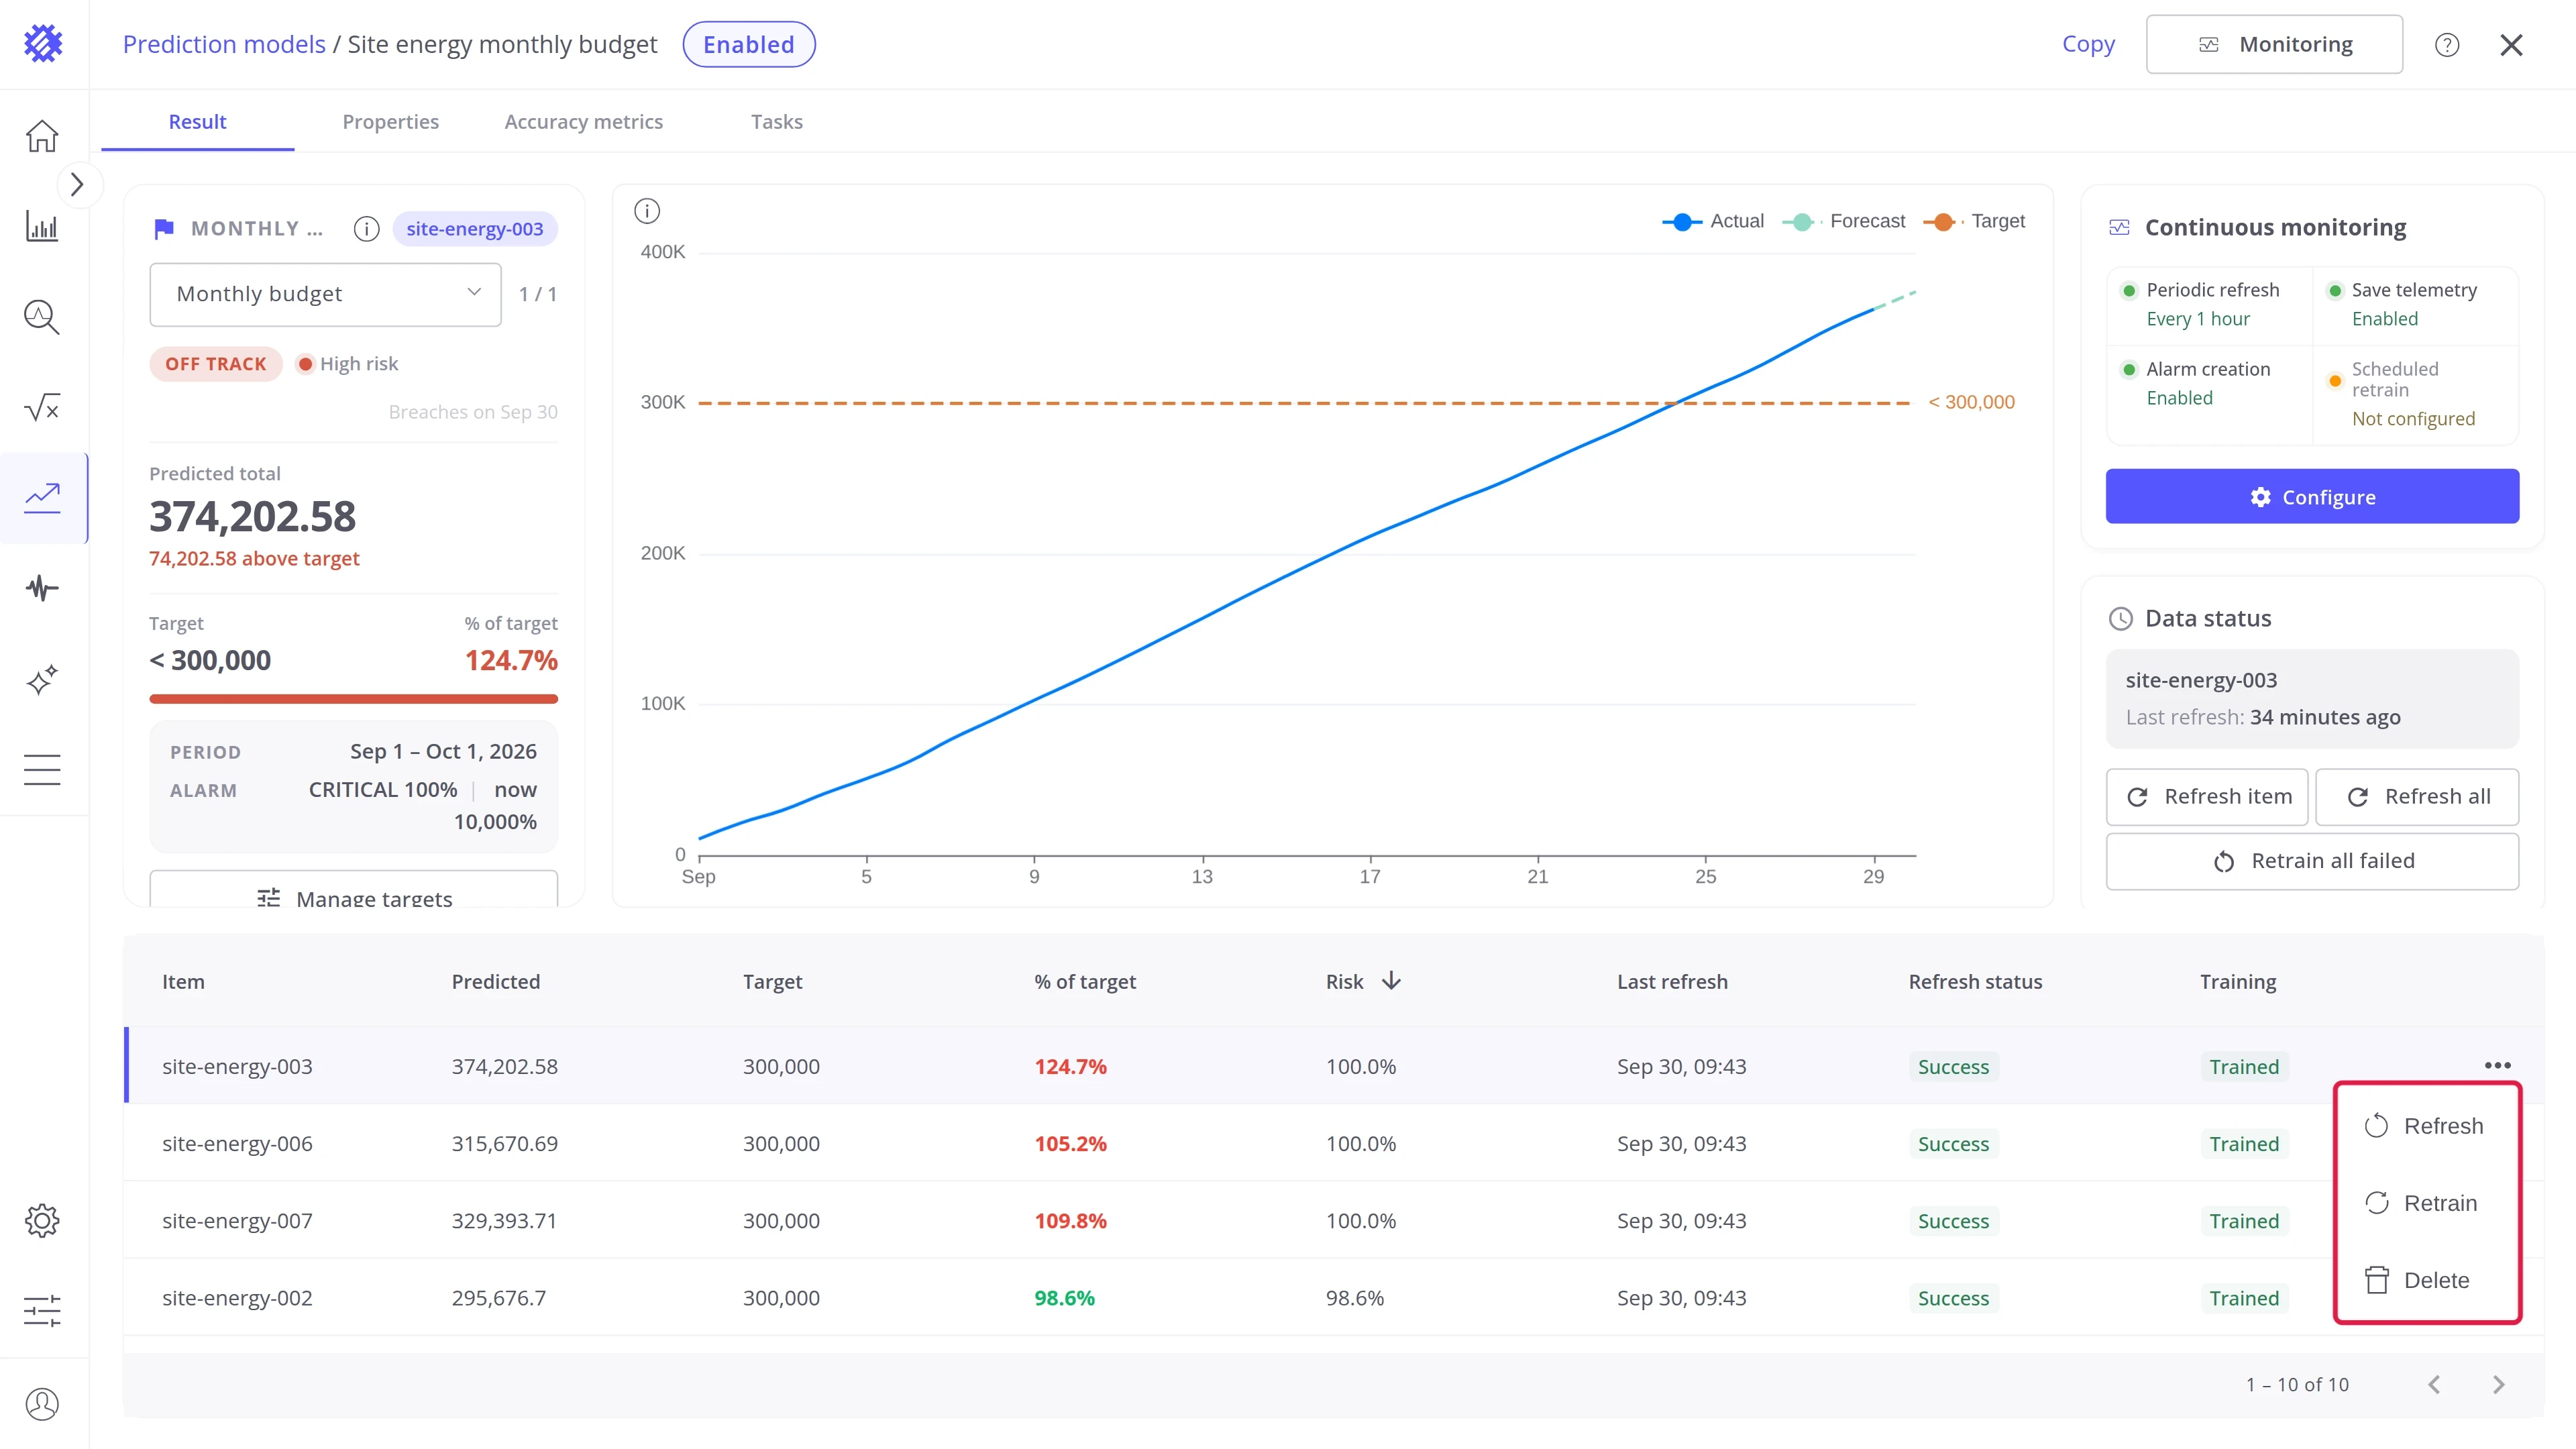
Section titled “Item actions”The ⋯ button at the end of each item row — Refresh, Retrain, and Delete for one item — works the same for every intent. See Interface Overview.
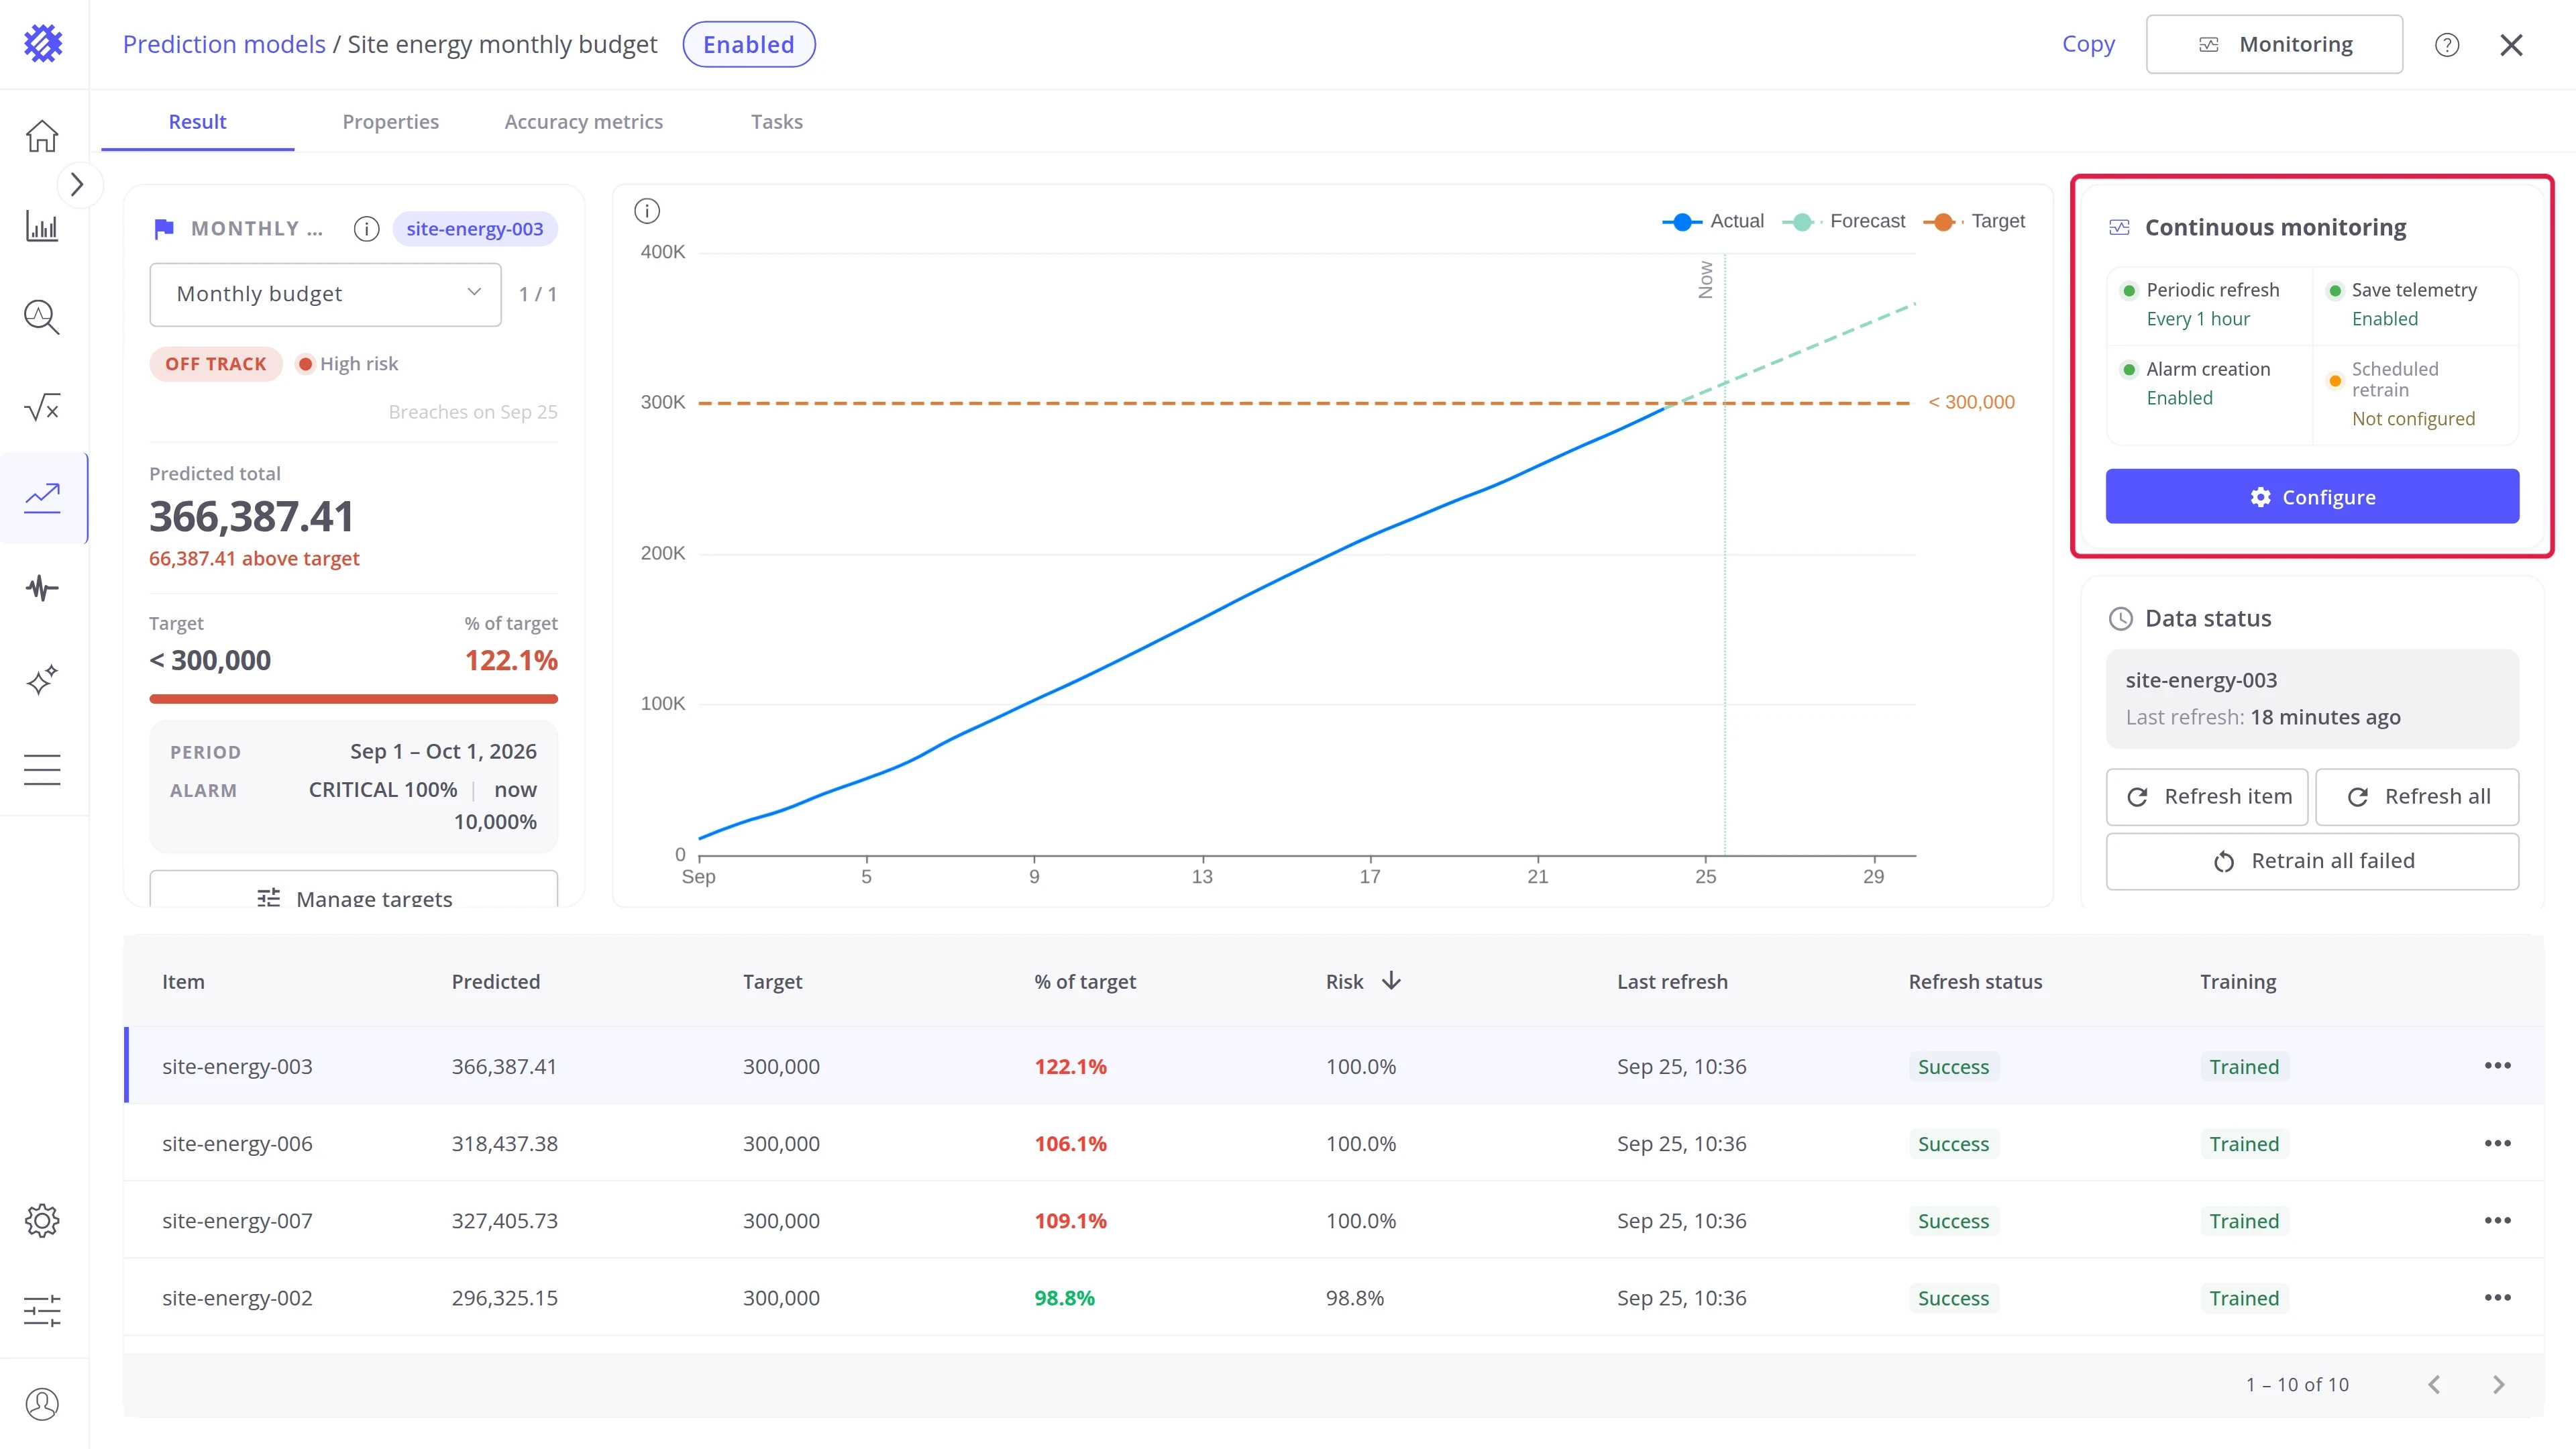
Continuous monitoring
Section titled “Continuous monitoring”The Continuous monitoring card shows the monitoring status of this model. What each setting does and how to configure it is described in Monitoring & Alarms. The risk and the alarms move only when the prediction is refreshed, so keep Periodic refresh on for a model that raises alarms.
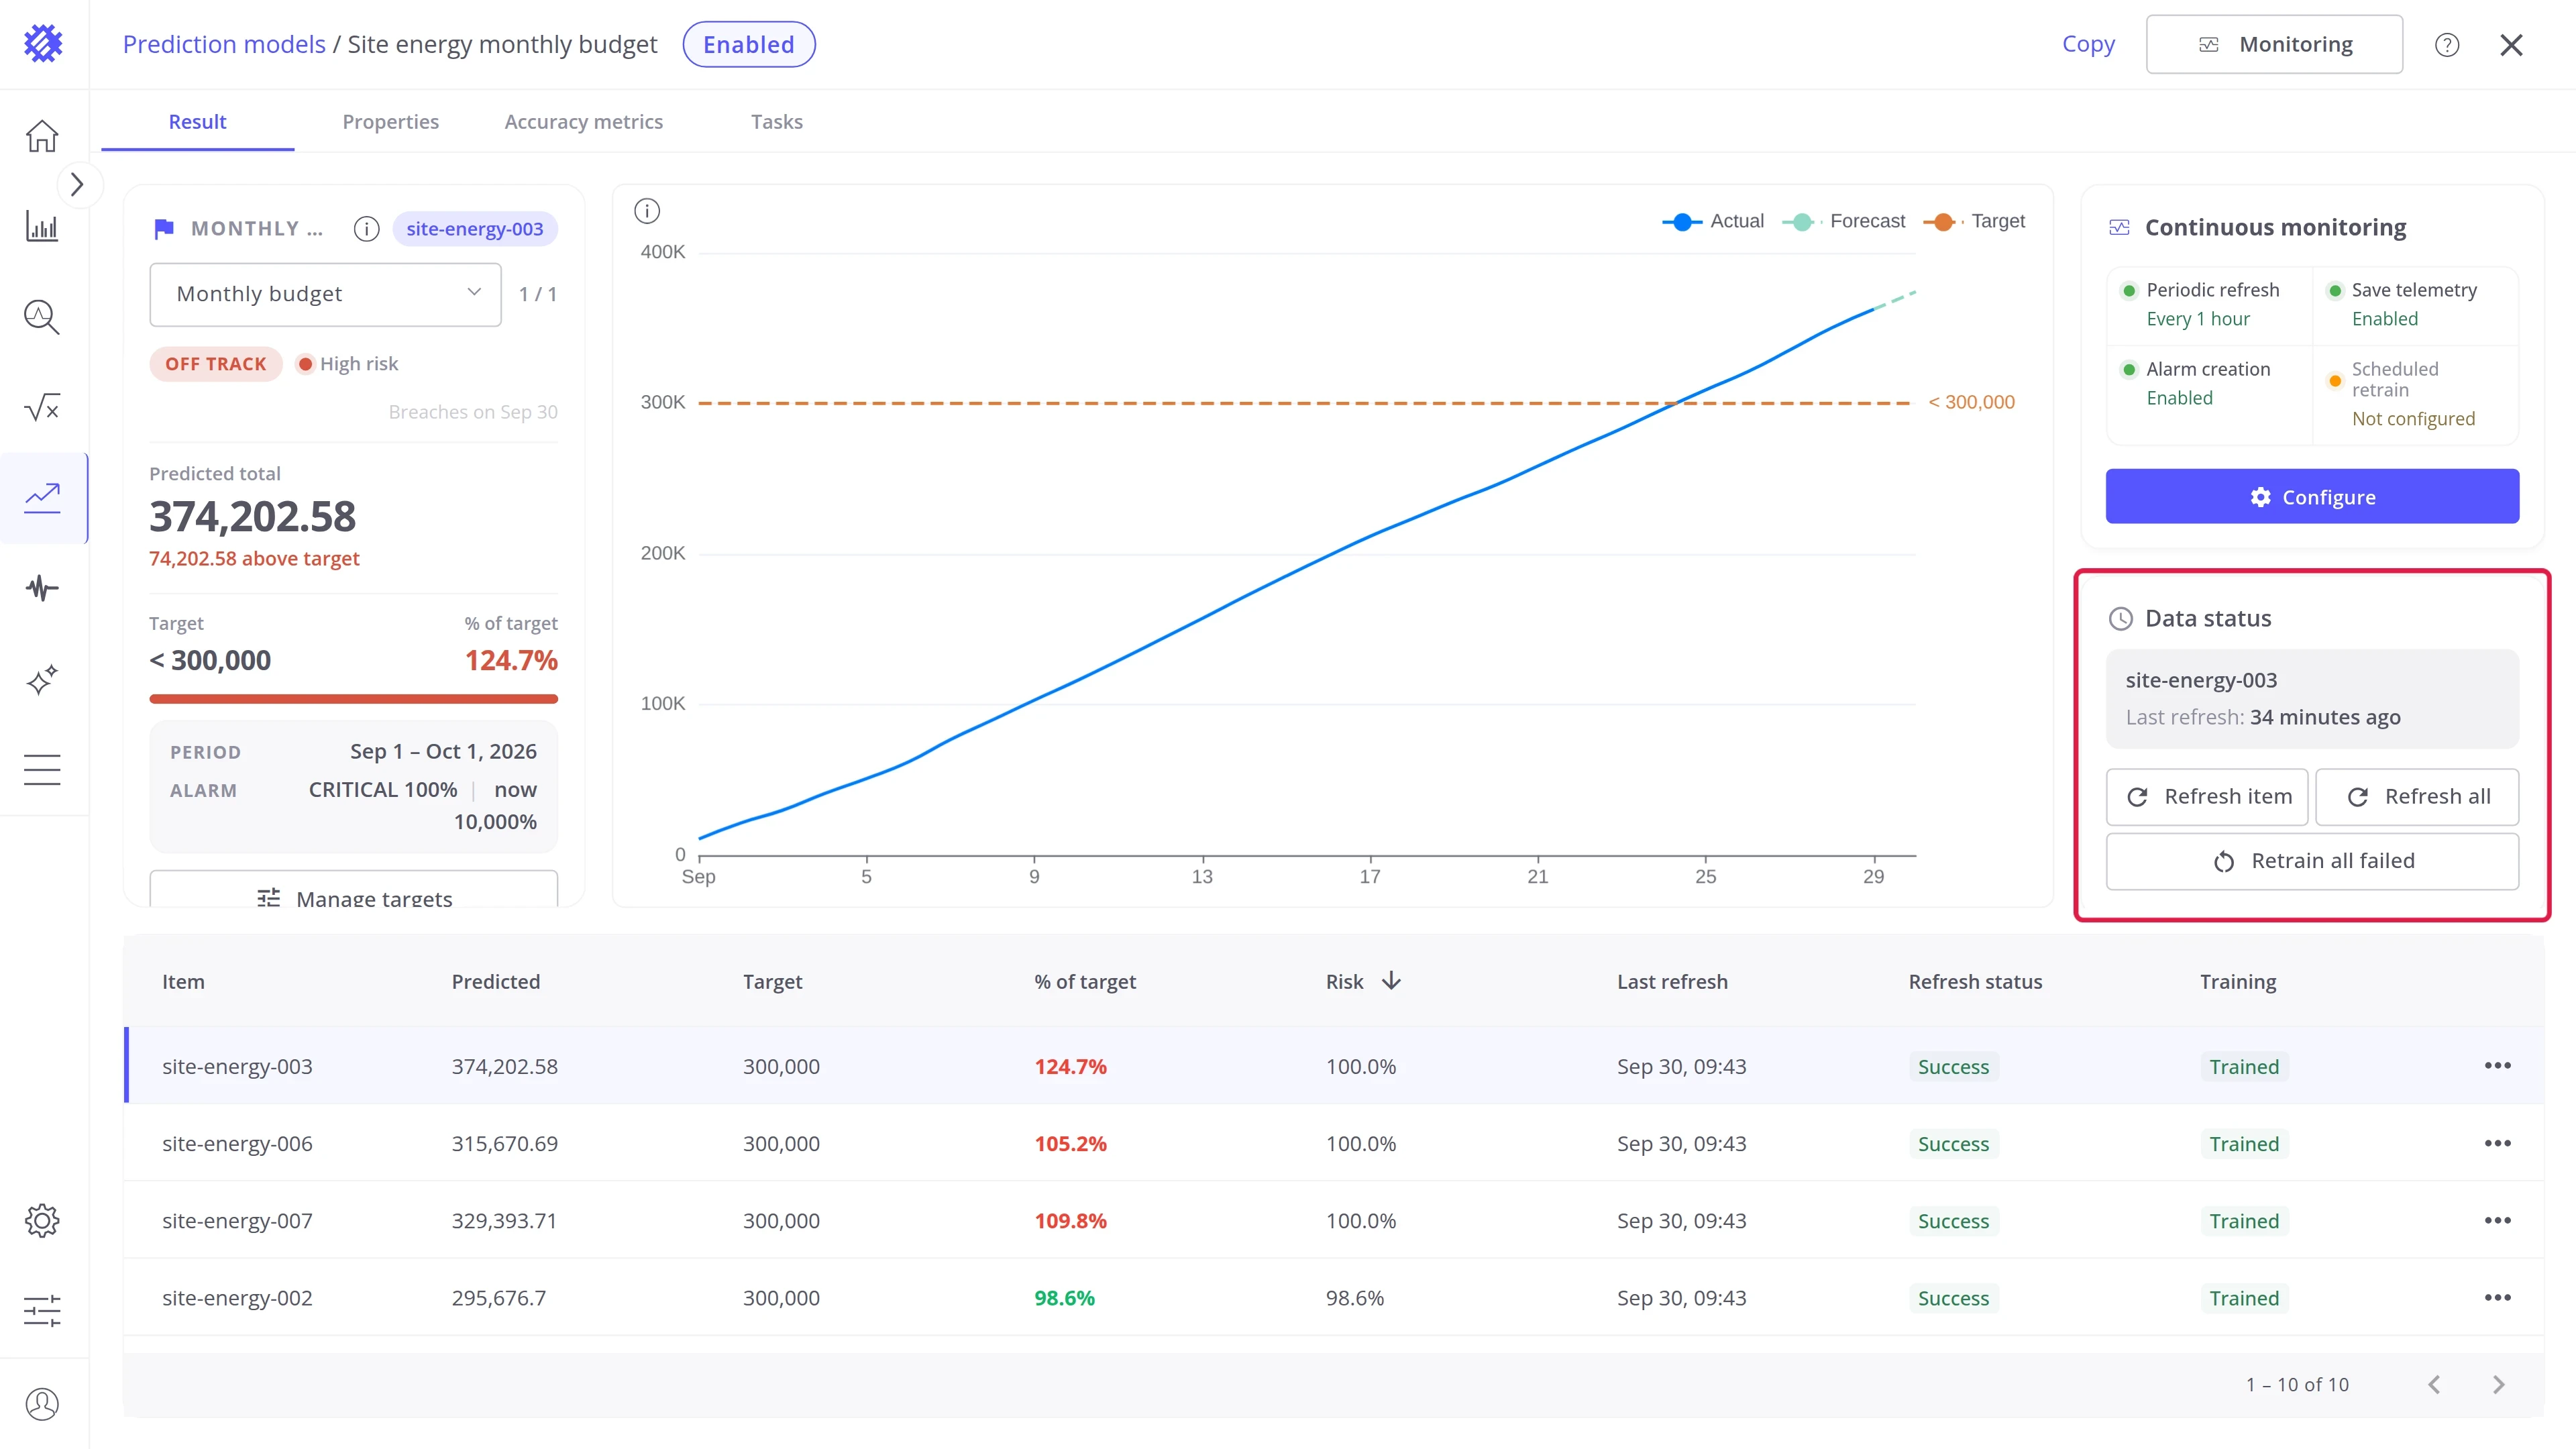
Data status
Section titled “Data status”The Data status card and its Refresh item, Refresh all, and Retrain all failed buttons work the same for every intent. See Interface Overview.
Targets
Section titled “Targets”A target turns the prediction into a yes or no answer. On every refresh, Trendz adds up what has been measured since the start of the period, adds the forecast for the rest of it, and compares this predicted total with the target.
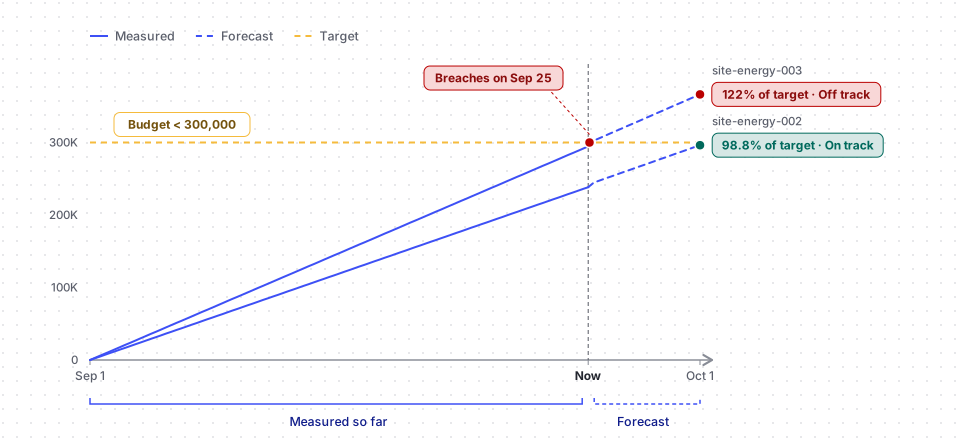
A model can have several targets, such as a budget and a stretch budget on the same metric.
Open the target editor
Section titled “Open the target editor”Click Manage targets under the target card:
The editor lists the targets on the left and the selected target on the right. A model built without a target is completed here: add the target and the next refresh checks the existing prediction against it.
Evaluation window
Section titled “Evaluation window”The evaluation window is the period the total is measured over, and Aggregation turns it into one number: Sum for consumption, Average for a level, Minimum or Maximum for an extreme.
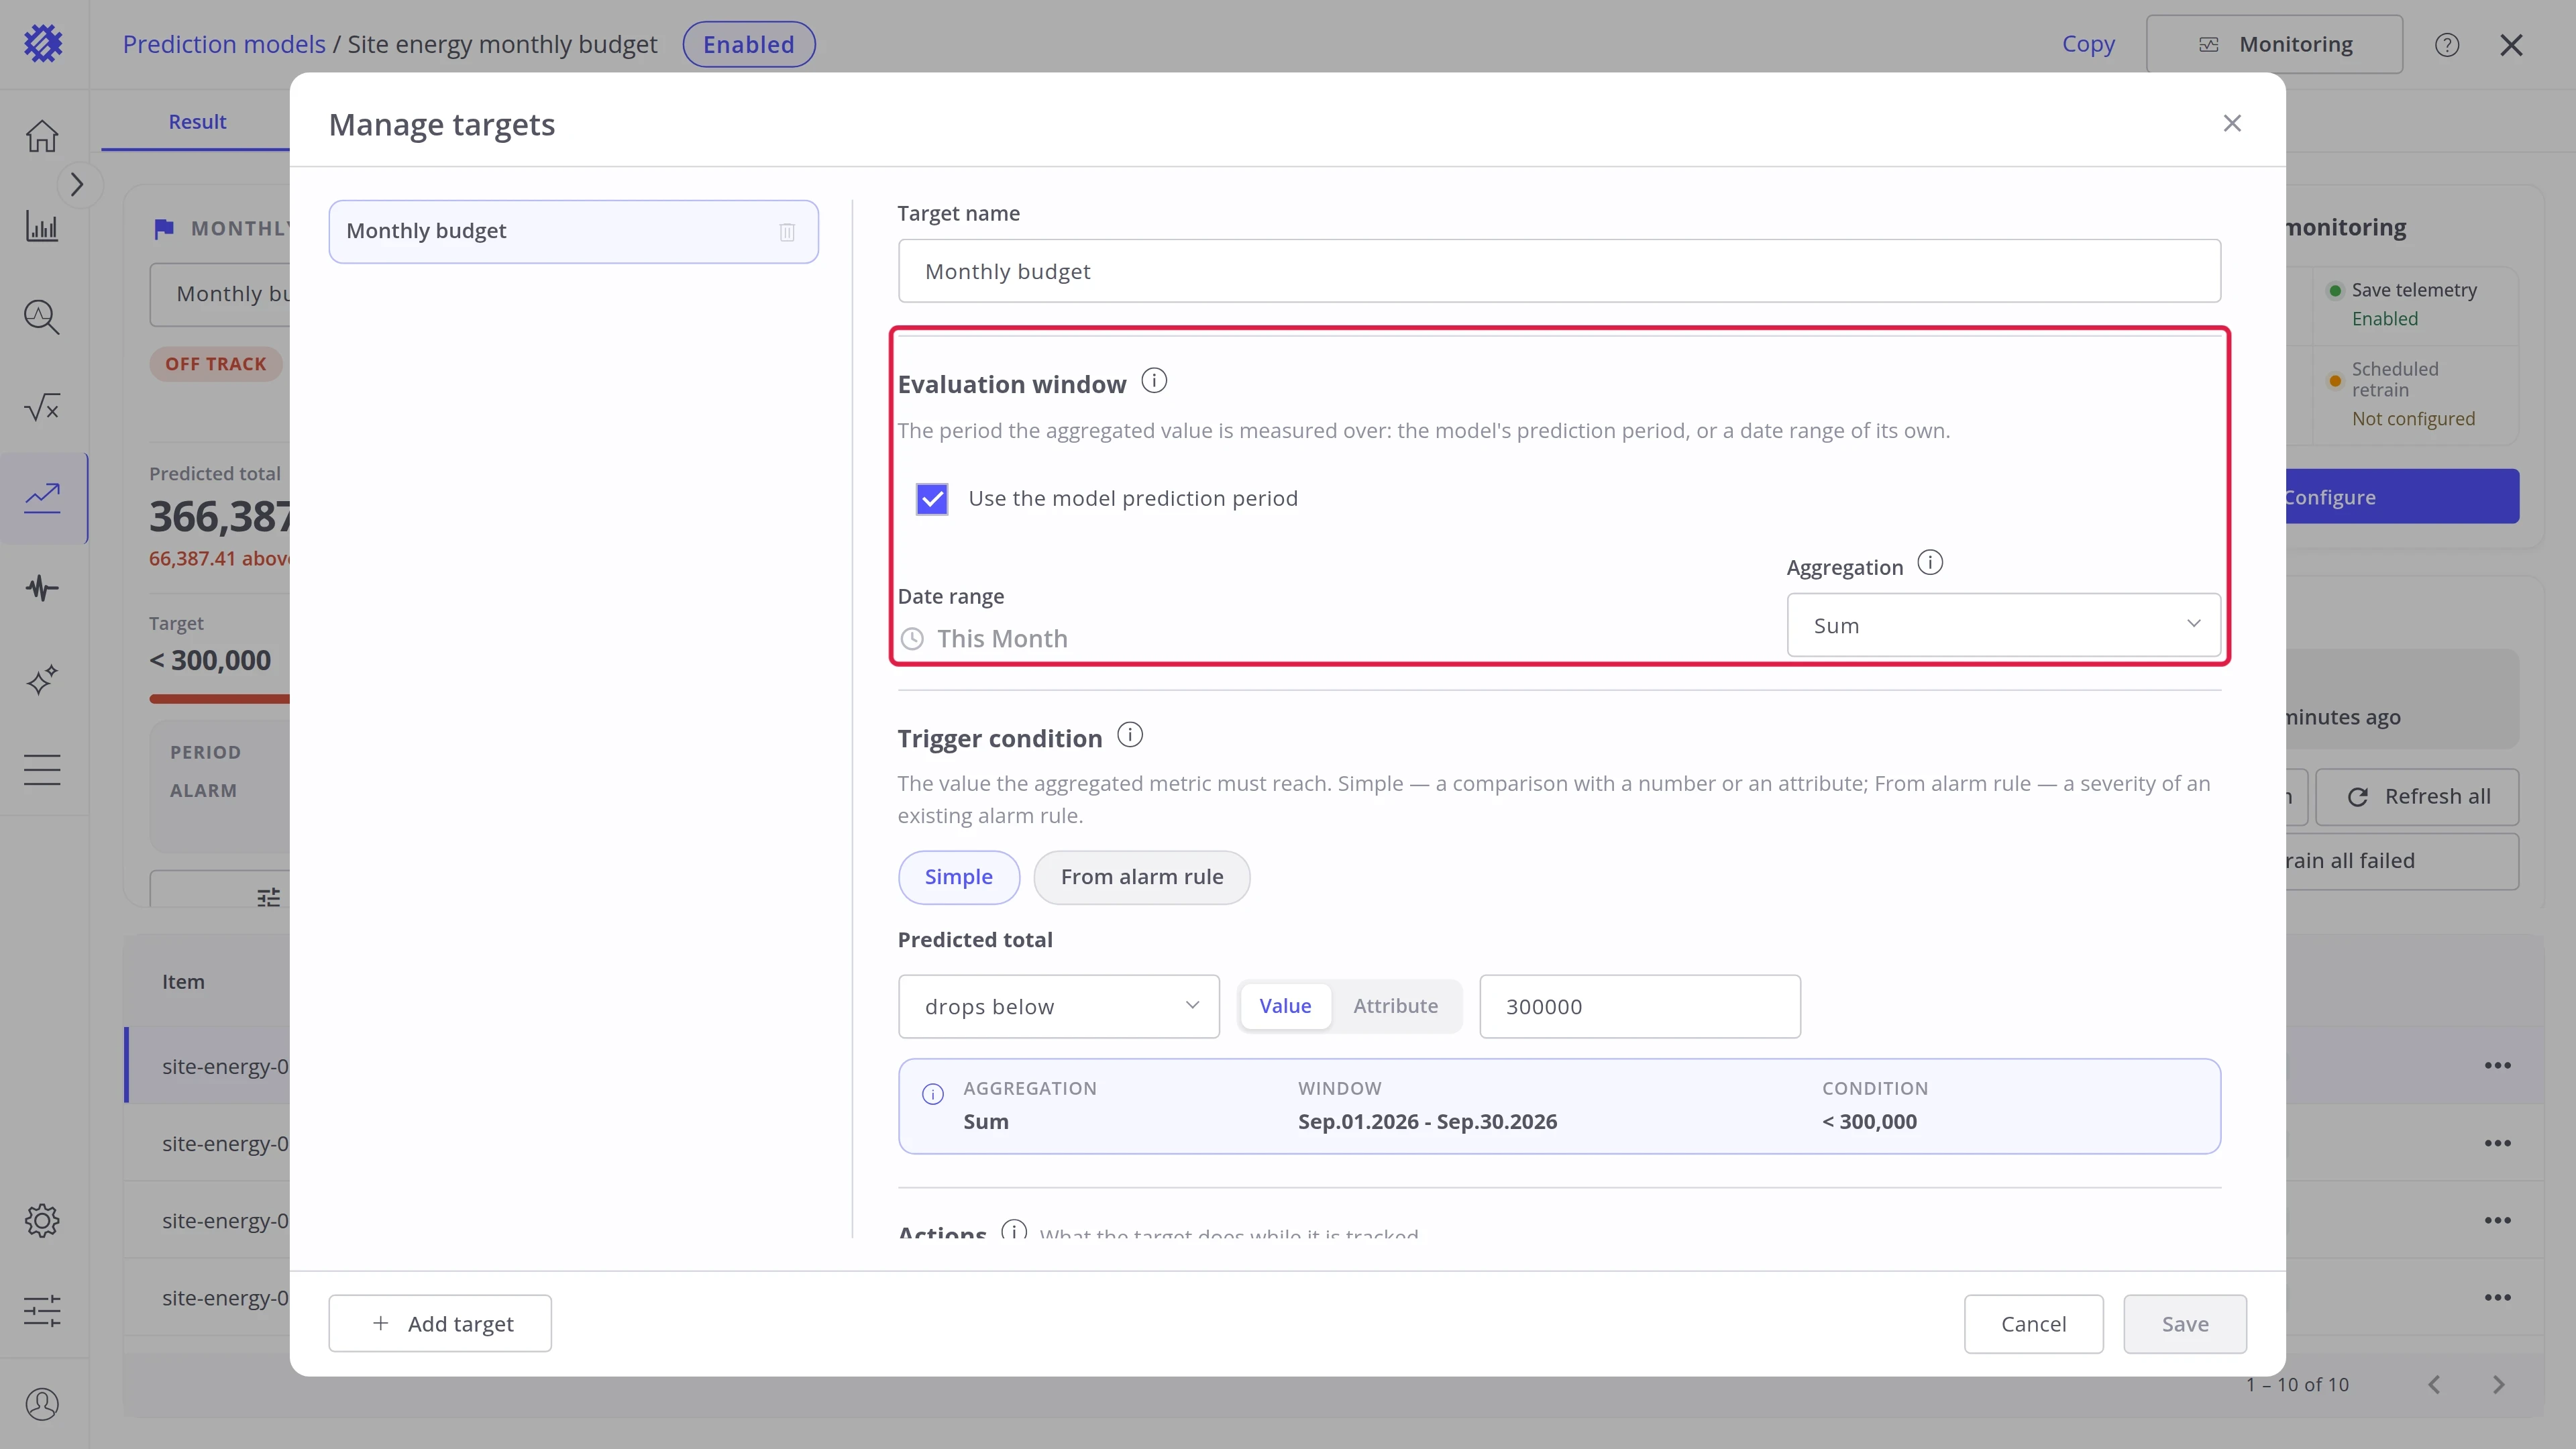
- Use the model prediction period keeps the target in step with the model.
- Clear it to give the target a date range of its own. A window spanning several calendar units adds Window type, Sliding or Fixed with an Anchor day.
Trigger condition
Section titled “Trigger condition”The trigger condition is what counts as success:
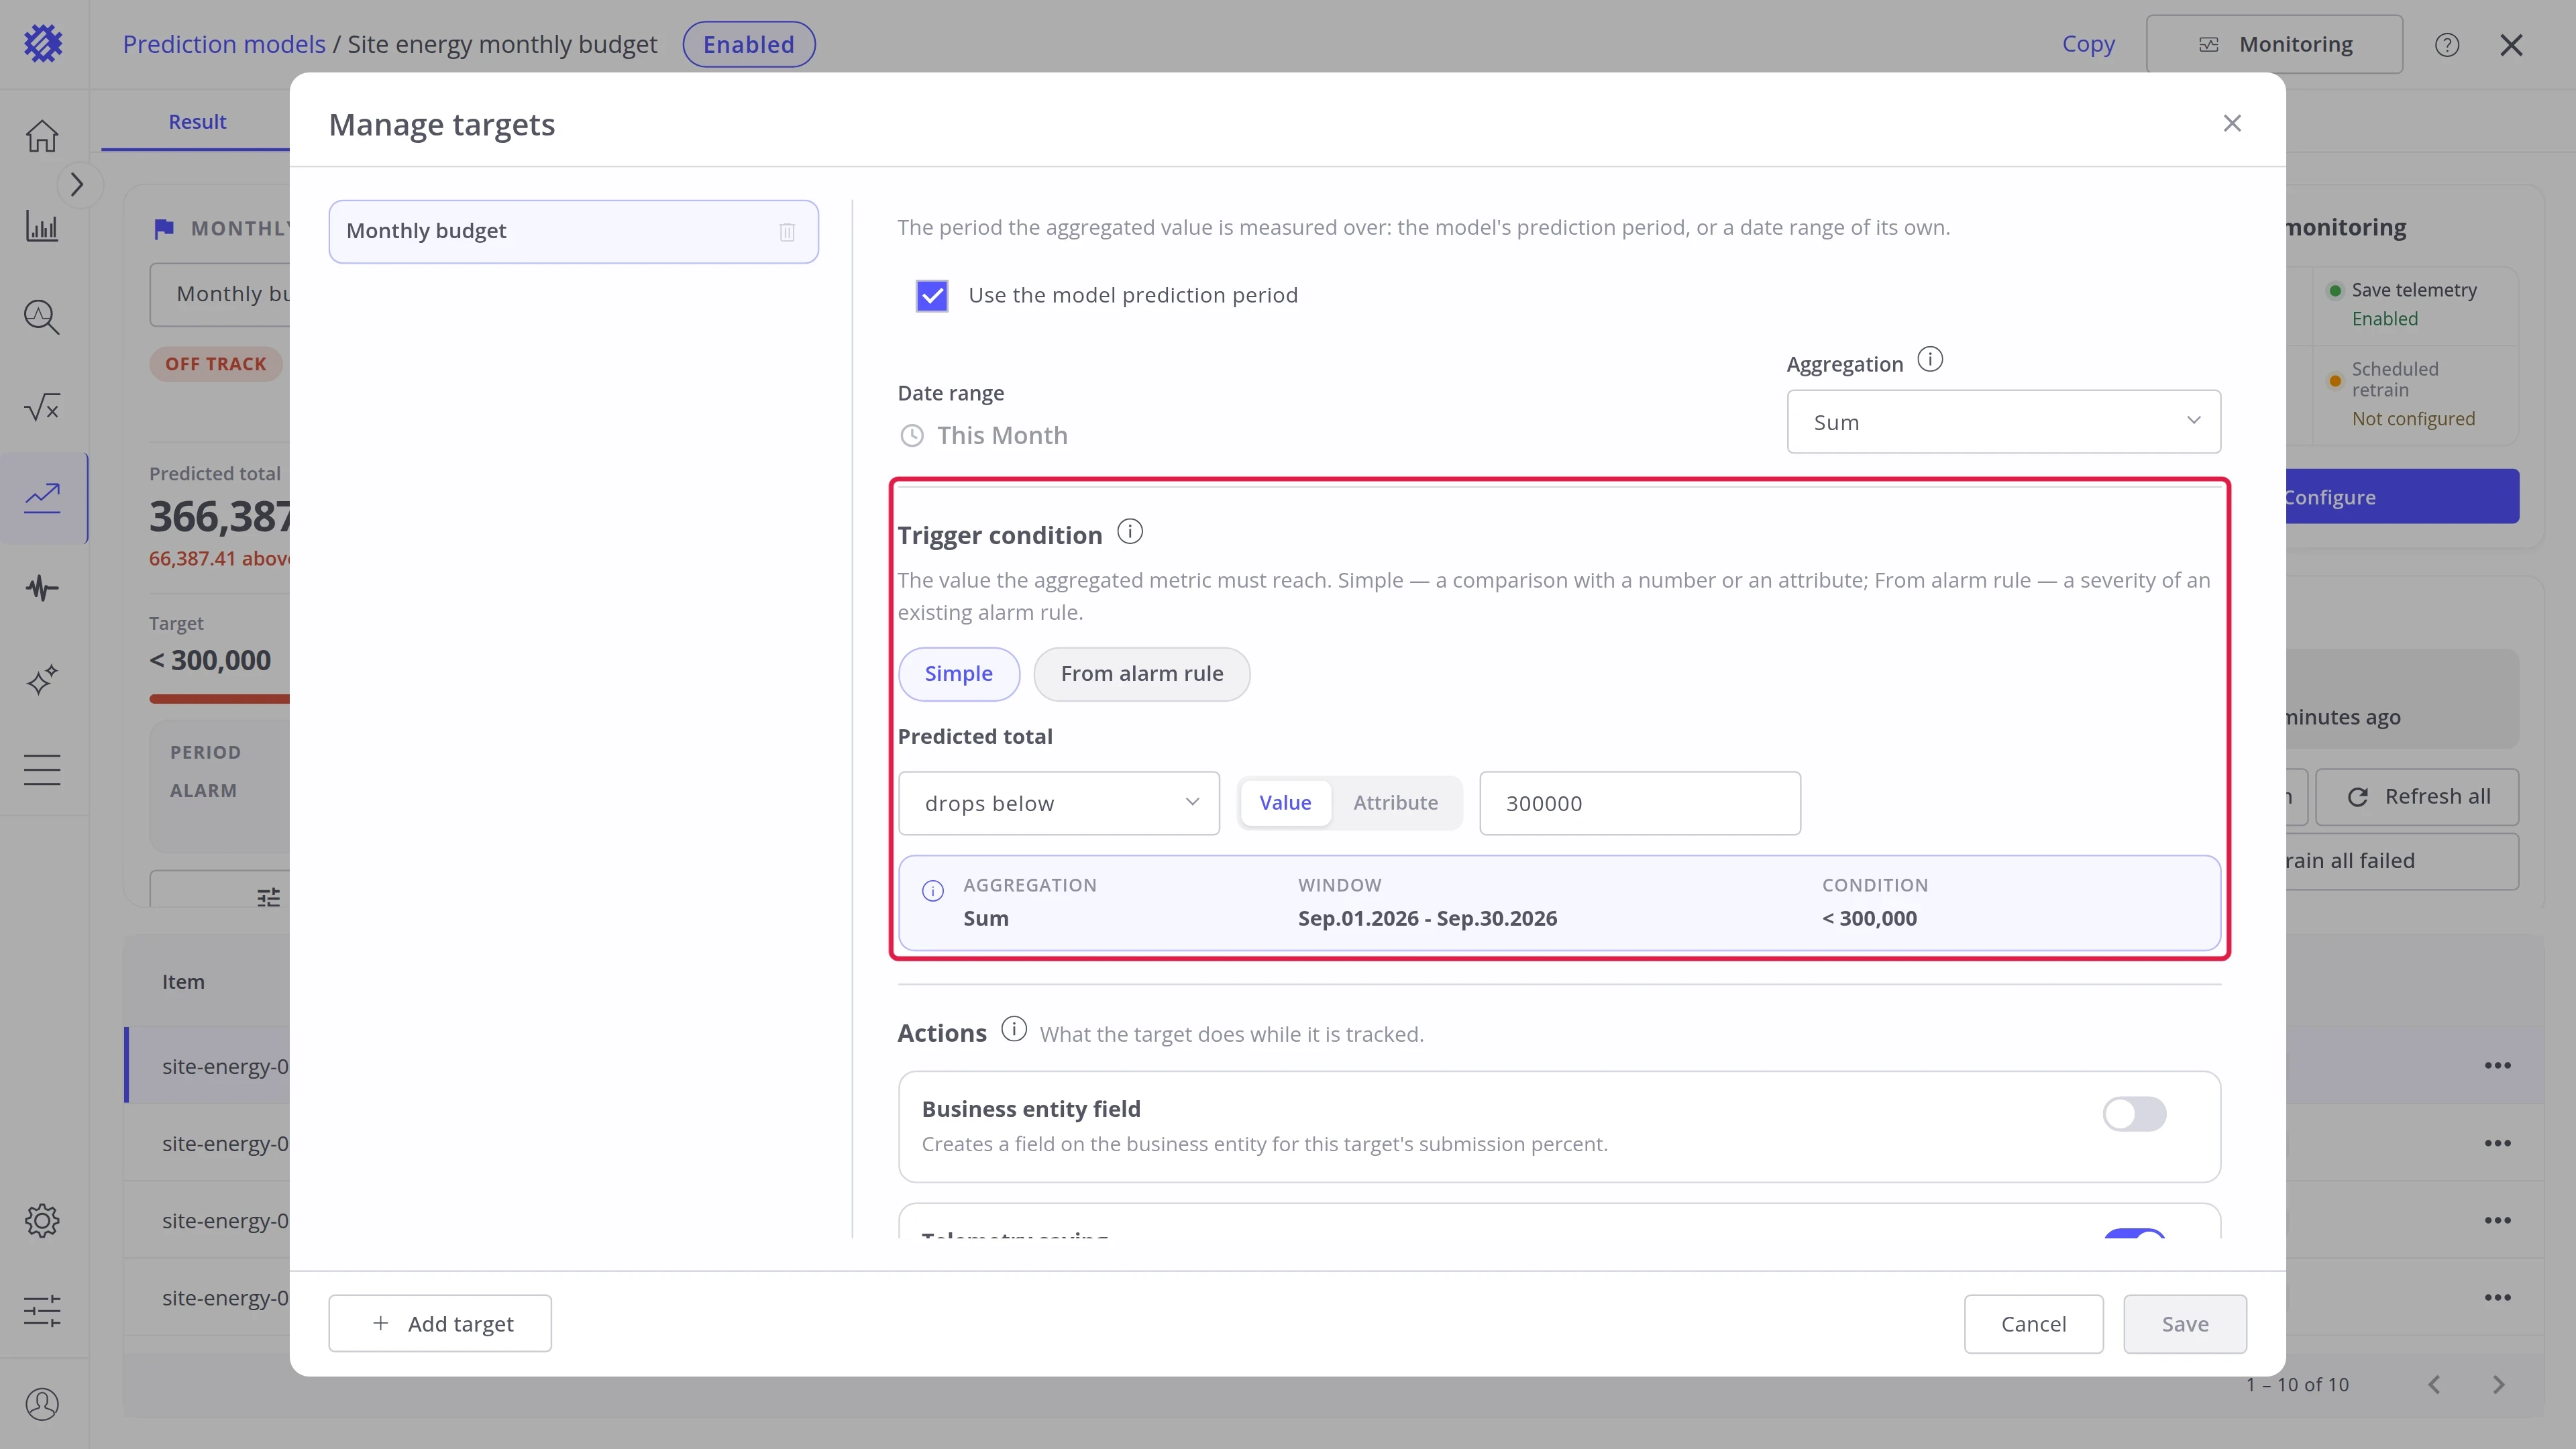
| Mode | Behavior |
|---|---|
| Simple | Compares the predicted total with a Value or an Attribute of the item: drops below for a limit to stay under, goes above for a goal to reach |
| From alarm rule | Reuses one severity of an existing ThingsBoard alarm rule |
An Attribute gives every item its own target from its own attribute, with one target in the model.
Business entity field and telemetry
Section titled “Business entity field and telemetry”Two actions make the % of target available outside the Result tab:
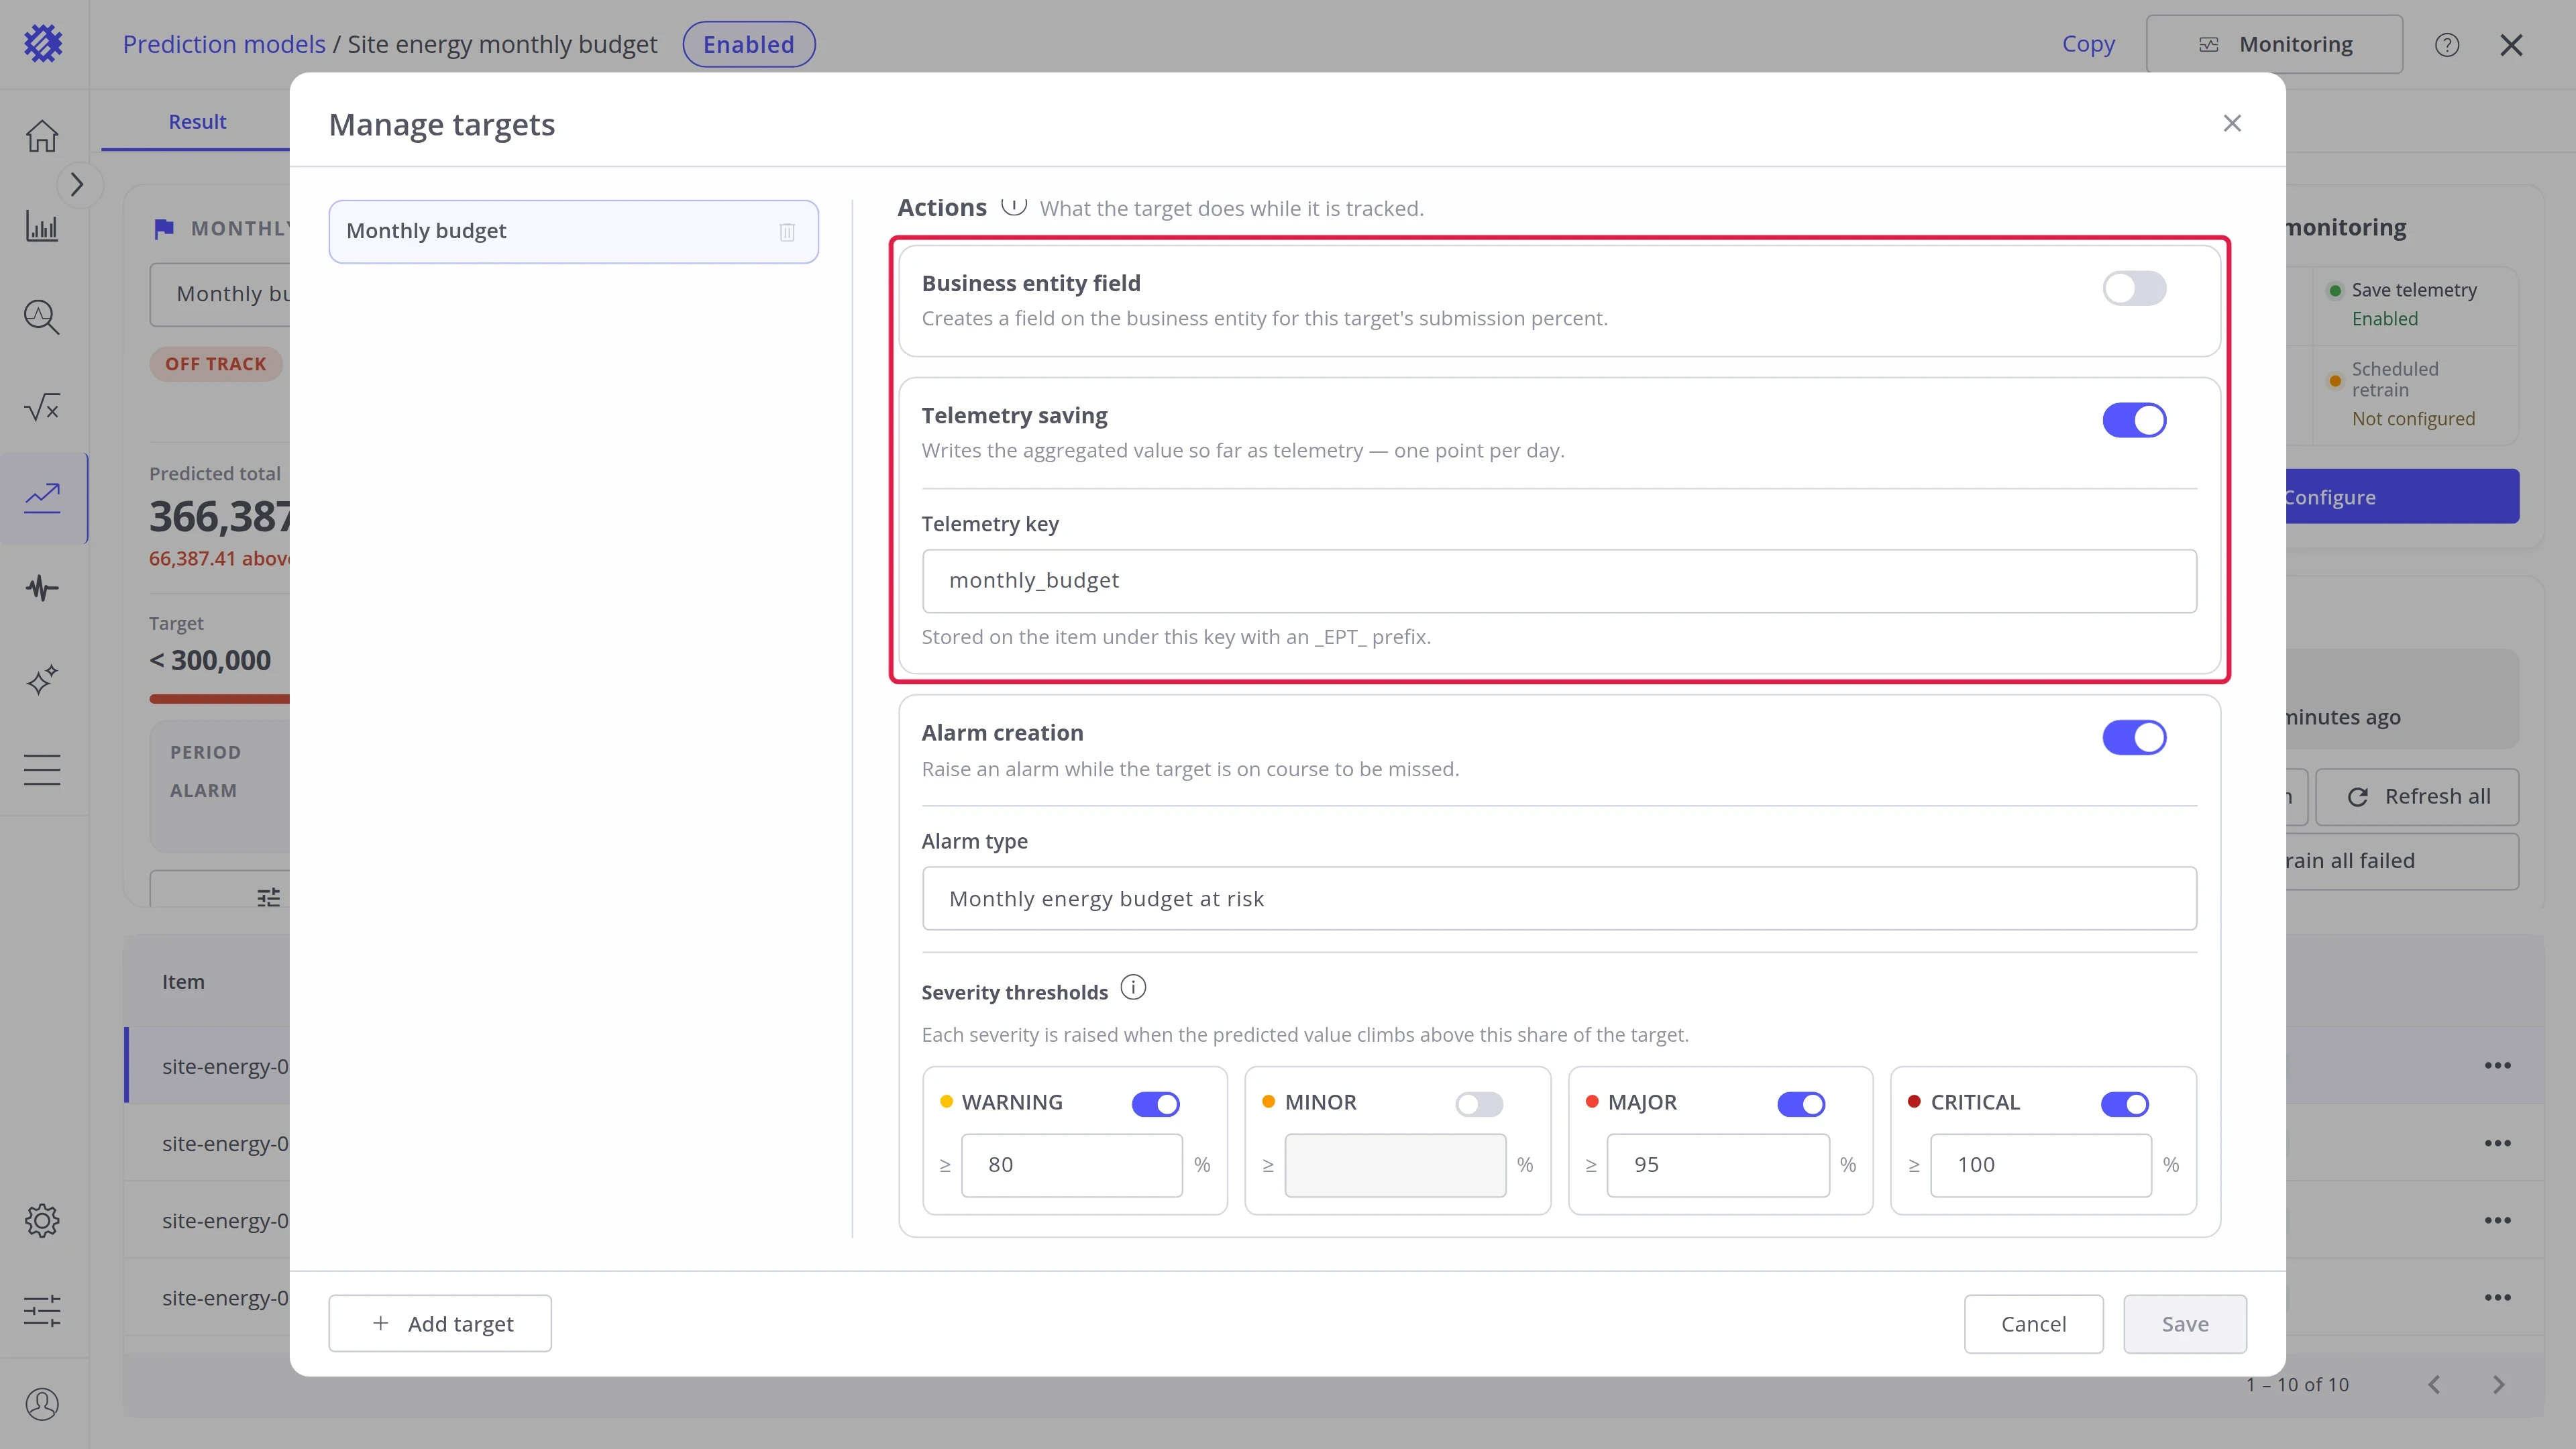
| Action | What it does |
|---|---|
| Business entity field | Creates a field on the business entity with the % of target, for Trendz views |
| Telemetry saving | Writes the % of target to each item under the Telemetry key with the _EPT_ prefix, one point per refresh. Save telemetry in the model’s monitoring settings must be on as well |
A target whose value is zero writes nothing, because its share is undefined.
Alarm creation
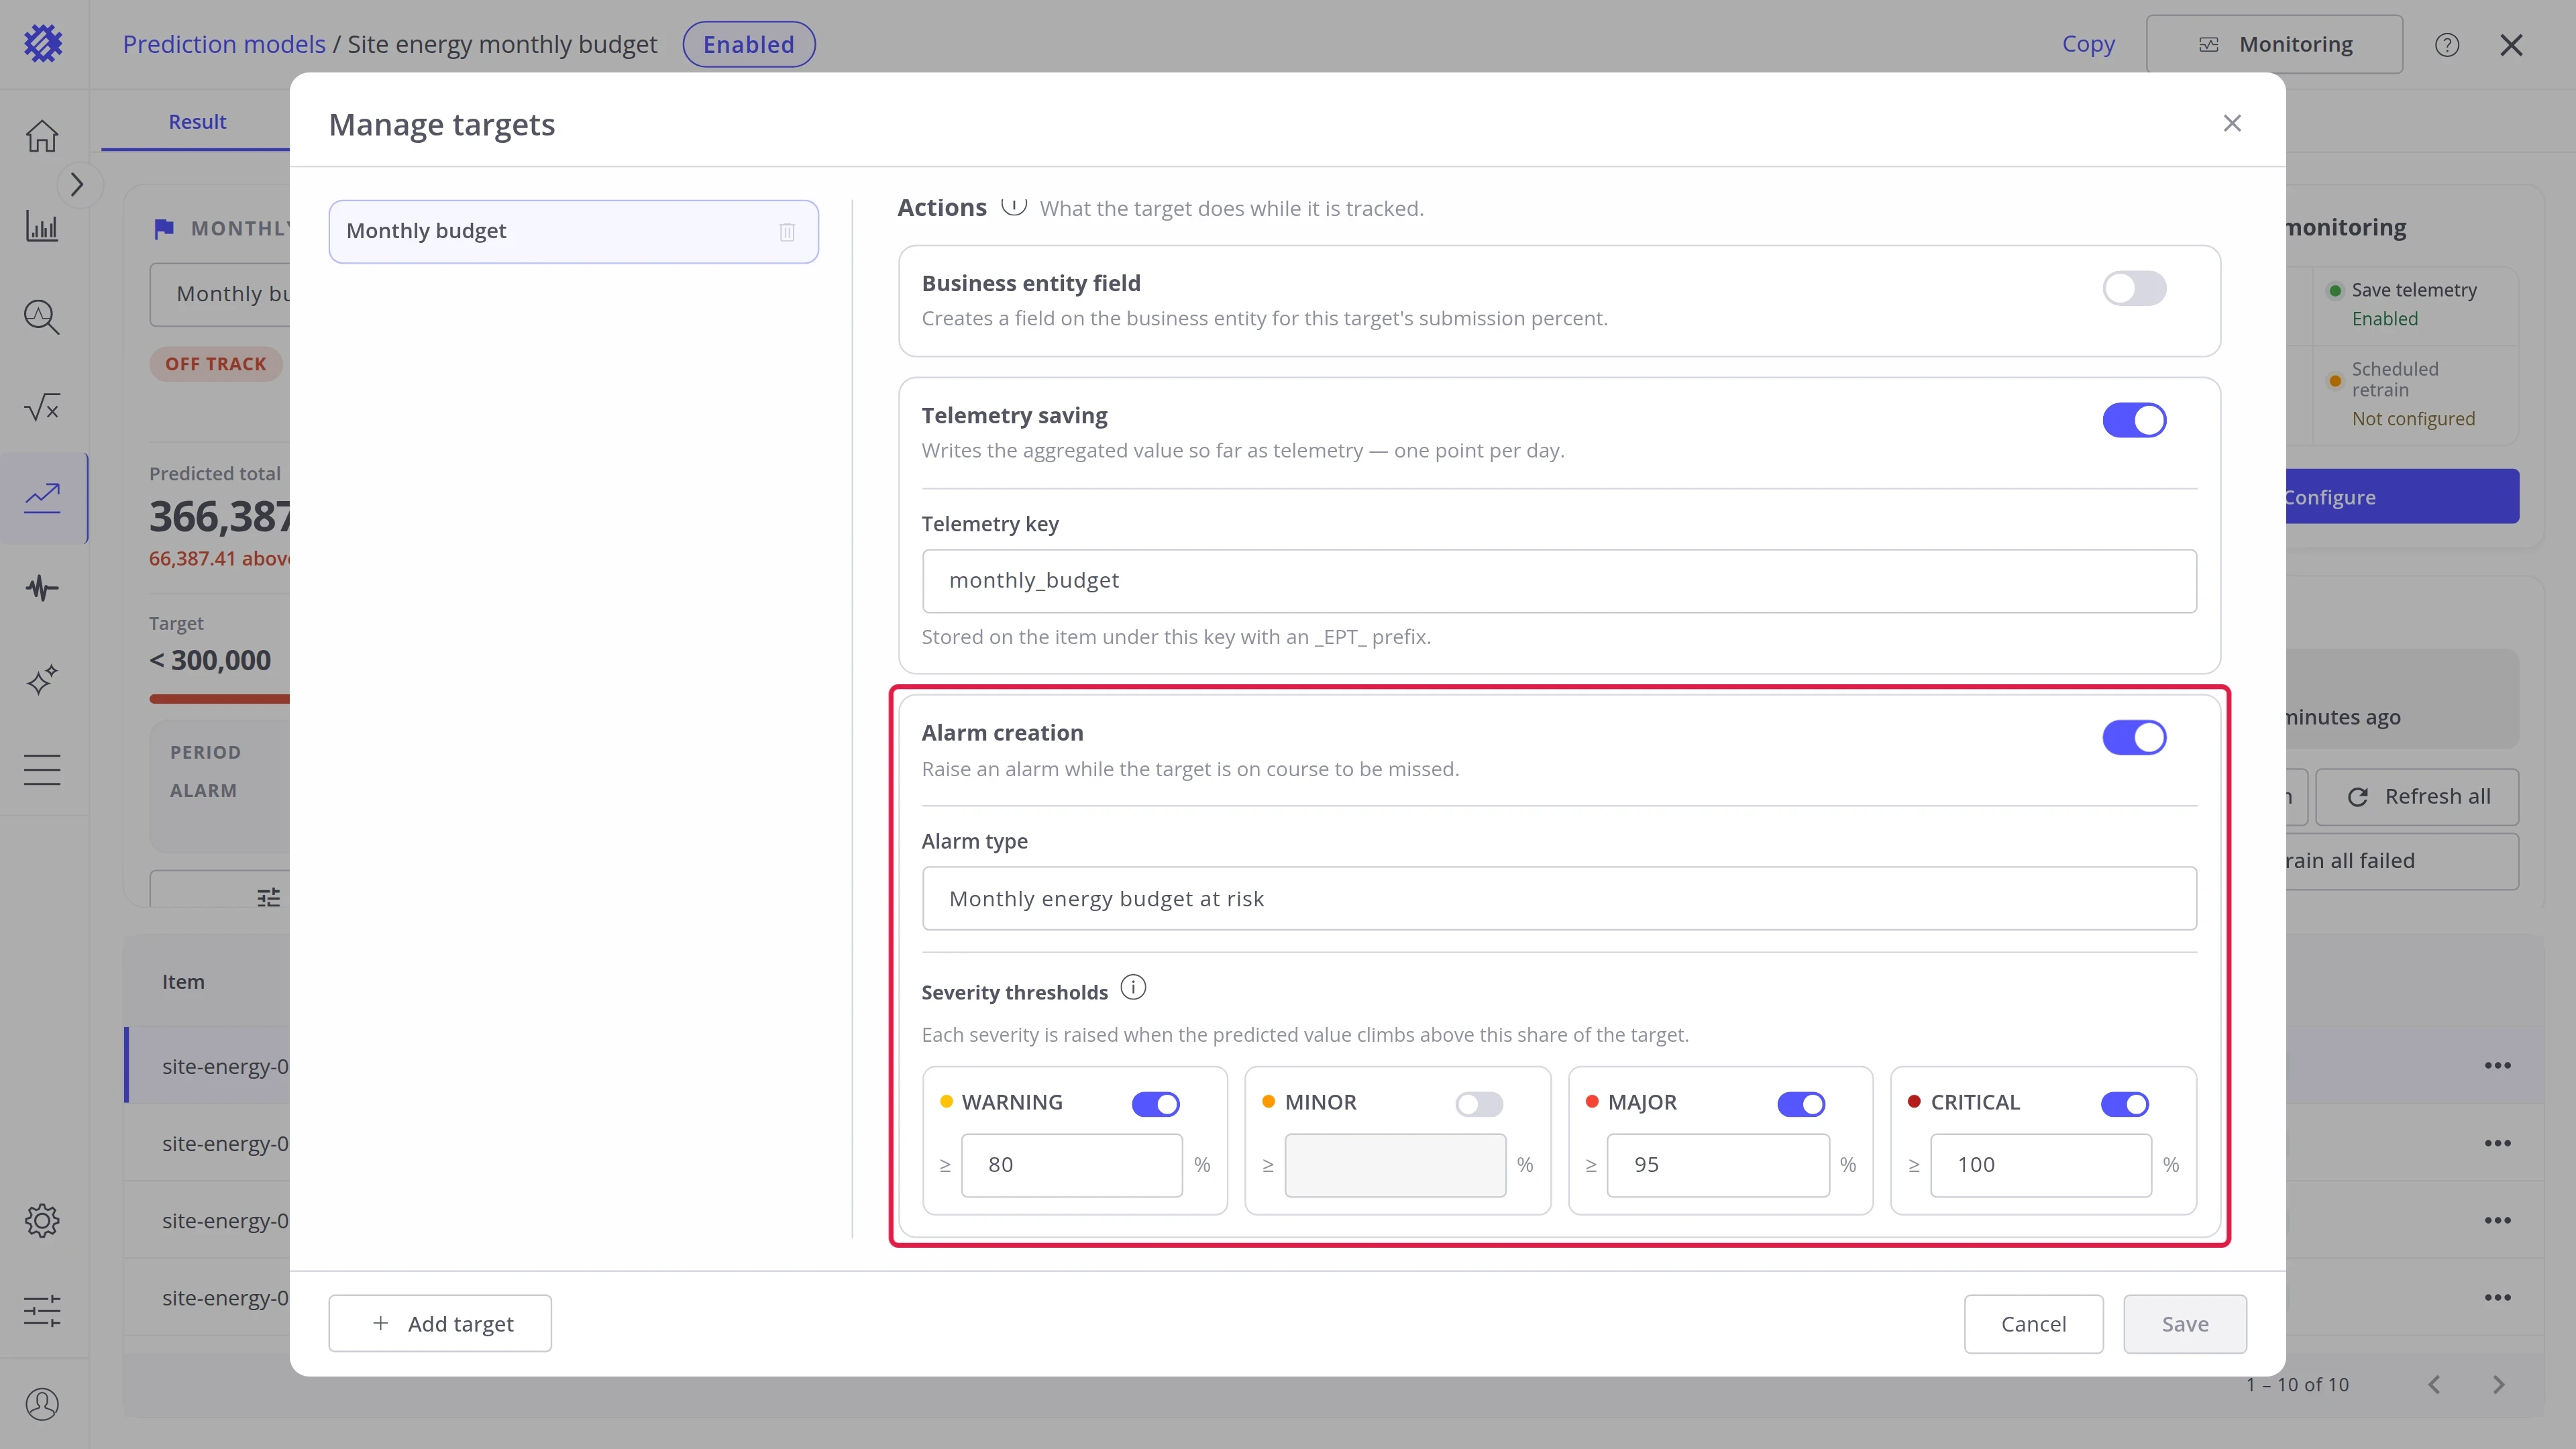
Section titled “Alarm creation”Alarm creation raises a ThingsBoard alarm of the Alarm type while the target is at risk. The type must be unique among the rules and targets of the profile.
Severity thresholds — you define what counts as each severity: how much risk is a Warning, a Major, or a Critical. They are off by default, so turn on the ones you need:
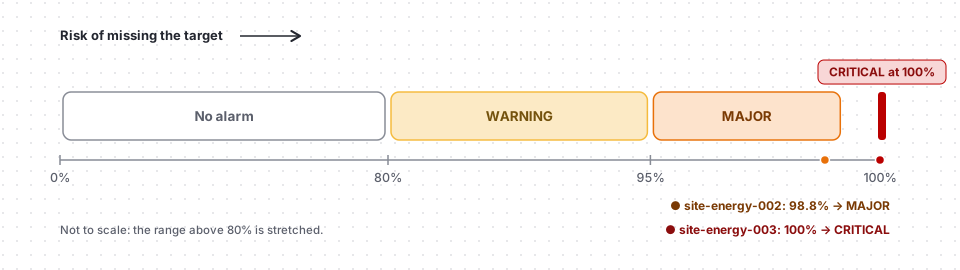
Risk reads the same way for both kinds of target, and higher always means more at risk:
- For a limit to stay under, risk is the % of target.
- For a goal to reach, risk is 100 minus the % of target.
- Risk stays between 0% and 100%.
The alarm takes the most severe level whose threshold the risk has reached, and clears when the risk falls below every enabled threshold:
Where to go next
Section titled “Where to go next”Explore other intents
Section titled “Explore other intents”-
Forecast
Predict the next values of a metric, like the energy of the next 7 days.
-
Time to Threshold
Predict when a metric crosses a limit, and raise an alarm before it happens.
-
Period Total
Predict the total, peak, or average of a period, such as the energy of this month.
Explore more
Section titled “Explore more”-
Explore Interface
Find your way around the models list, the model page, and its tabs.
-
Monitoring & alarms
Refresh and retrain on a schedule, save forecasts to ThingsBoard, and raise alarms.
-
Show on dashboards
Chart history and forecast together in Trendz views and ThingsBoard dashboards.
-
Models & accuracy
How a model learns, its settings, and how accurate its forecasts are.
Was this helpful?