Connect a Vibration Sensor & Build a Model
In this guide you create your first vibration model. It checks the health of the machines you pick from one device profile, using the vibration samples your sensors already send to ThingsBoard. Setup takes a few minutes and needs no code.
By the end of this guide, you will have this model:
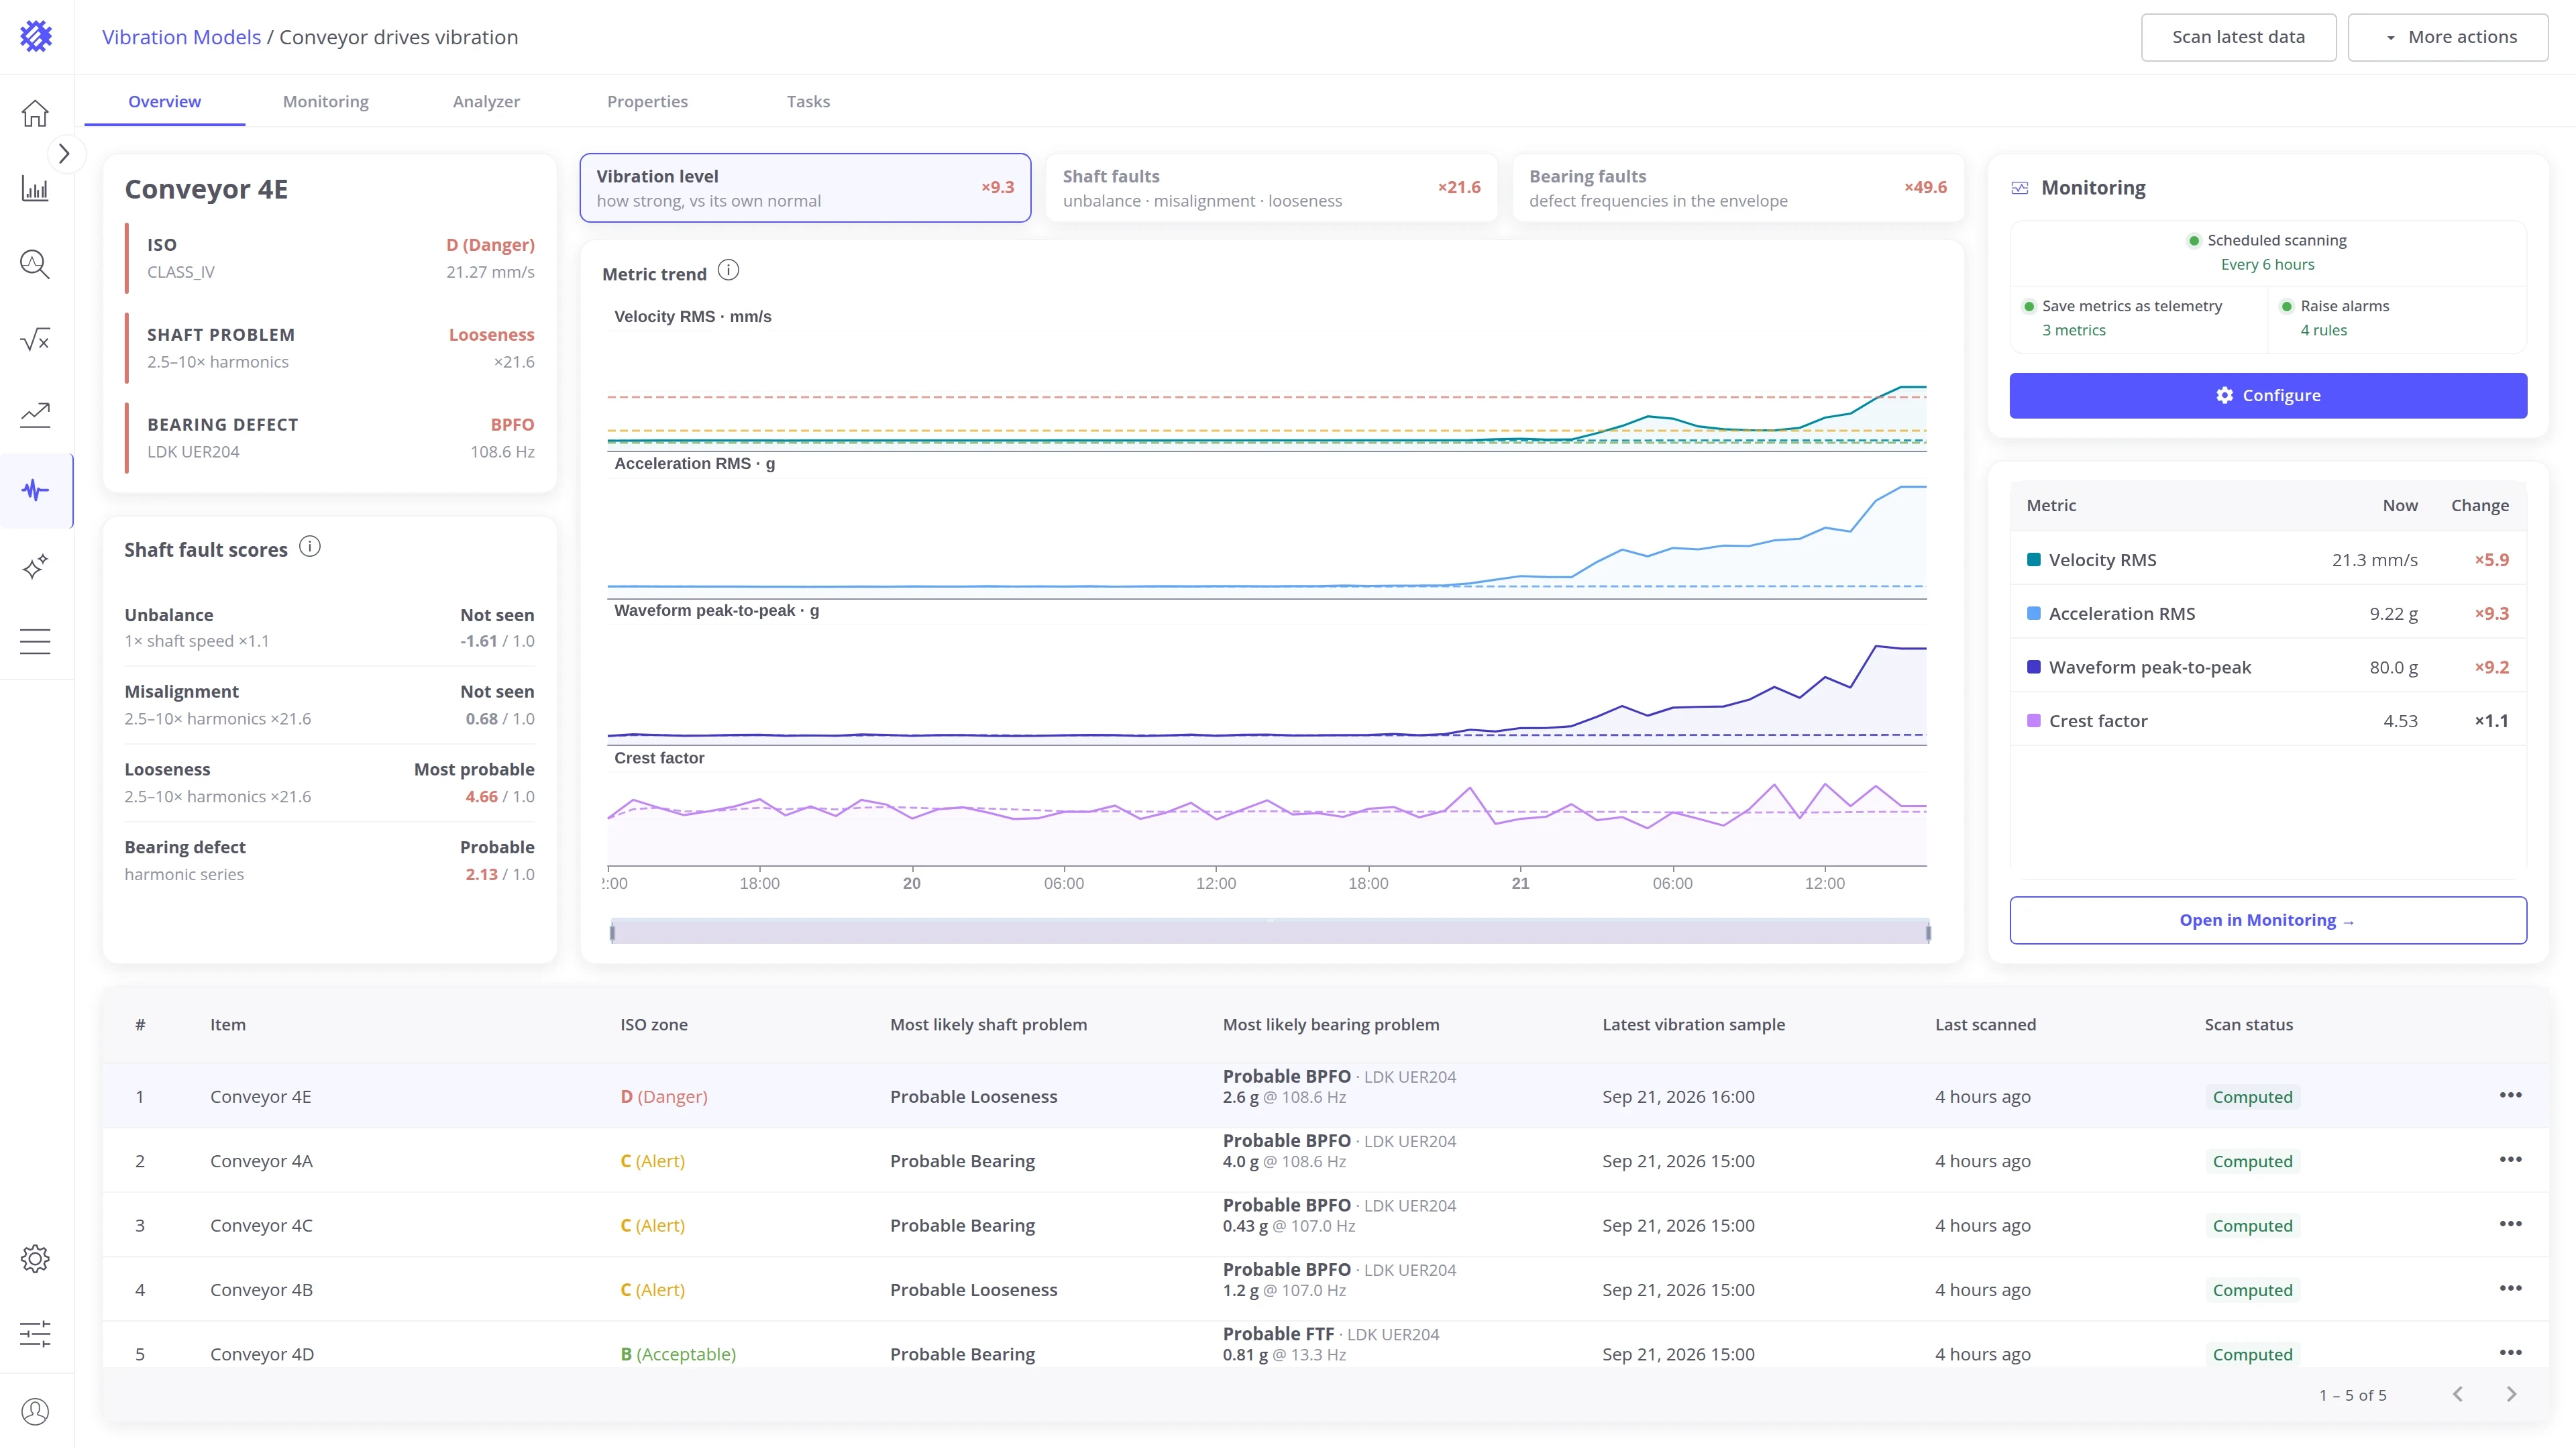
Before you start: you need devices of one profile in ThingsBoard whose sensors send raw vibration samples in the Trendz format. If they do not yet, start with Prepare your data.
Prepare your data
Section titled “Prepare your data”Install the sensor
Section titled “Install the sensor”Use a vibration sensor that records the raw signal, not only a summary value like RMS. Many wireless IIoT vibration sensors and vibration gateways can do this when set to send the raw time waveform. A sensor that reports only RMS, peak, or temperature cannot be analyzed. Mount it on the bearing housing and set it to record a sample at a fixed interval, for example once an hour: about 3 seconds of acceleration readings, sent to ThingsBoard as one telemetry value.
Pick a sample rate of at least twice the highest frequency you want to analyze. Bearing faults and envelope analysis need high frequencies, so choose a rate in the kHz range. The 25,600 points per second used in Step 4 covers frequencies up to 12.8 kHz. For a sensor with a ready-made ThingsBoard integration, see the NCD vibration and temperature sensor in IoT Hub.
How sensors and samples work is described in Vibration Analysis Basics. If you need help with a sensor or gateway setup, contact us.
Trendz Vibration Data Input Formats
Section titled “Trendz Vibration Data Input Formats”Save each sample as one string telemetry value: all readings of the sample in recording order, separated by spaces.
0.012 -0.034 0.051 0.007 -0.019 0.023 0.041 -0.008 …A sensor with several axes sends them in the same value: first all readings of axis 1, then axis 2, and so on, with a comma between the axes. Every axis must hold the same number of readings.
0.12 -0.03 0.45 0.11 …, 0.02 -0.07 0.30 0.01 …, 0.20 0.04 -0.12 0.09 …If the sensor sends another shape, such as a JSON array or one reading per message, convert it in the device’s rule chain before it is saved, for example with a script transformation node that joins the array into one space-separated string.
Create your first model
Section titled “Create your first model”Step 1. Open the wizard
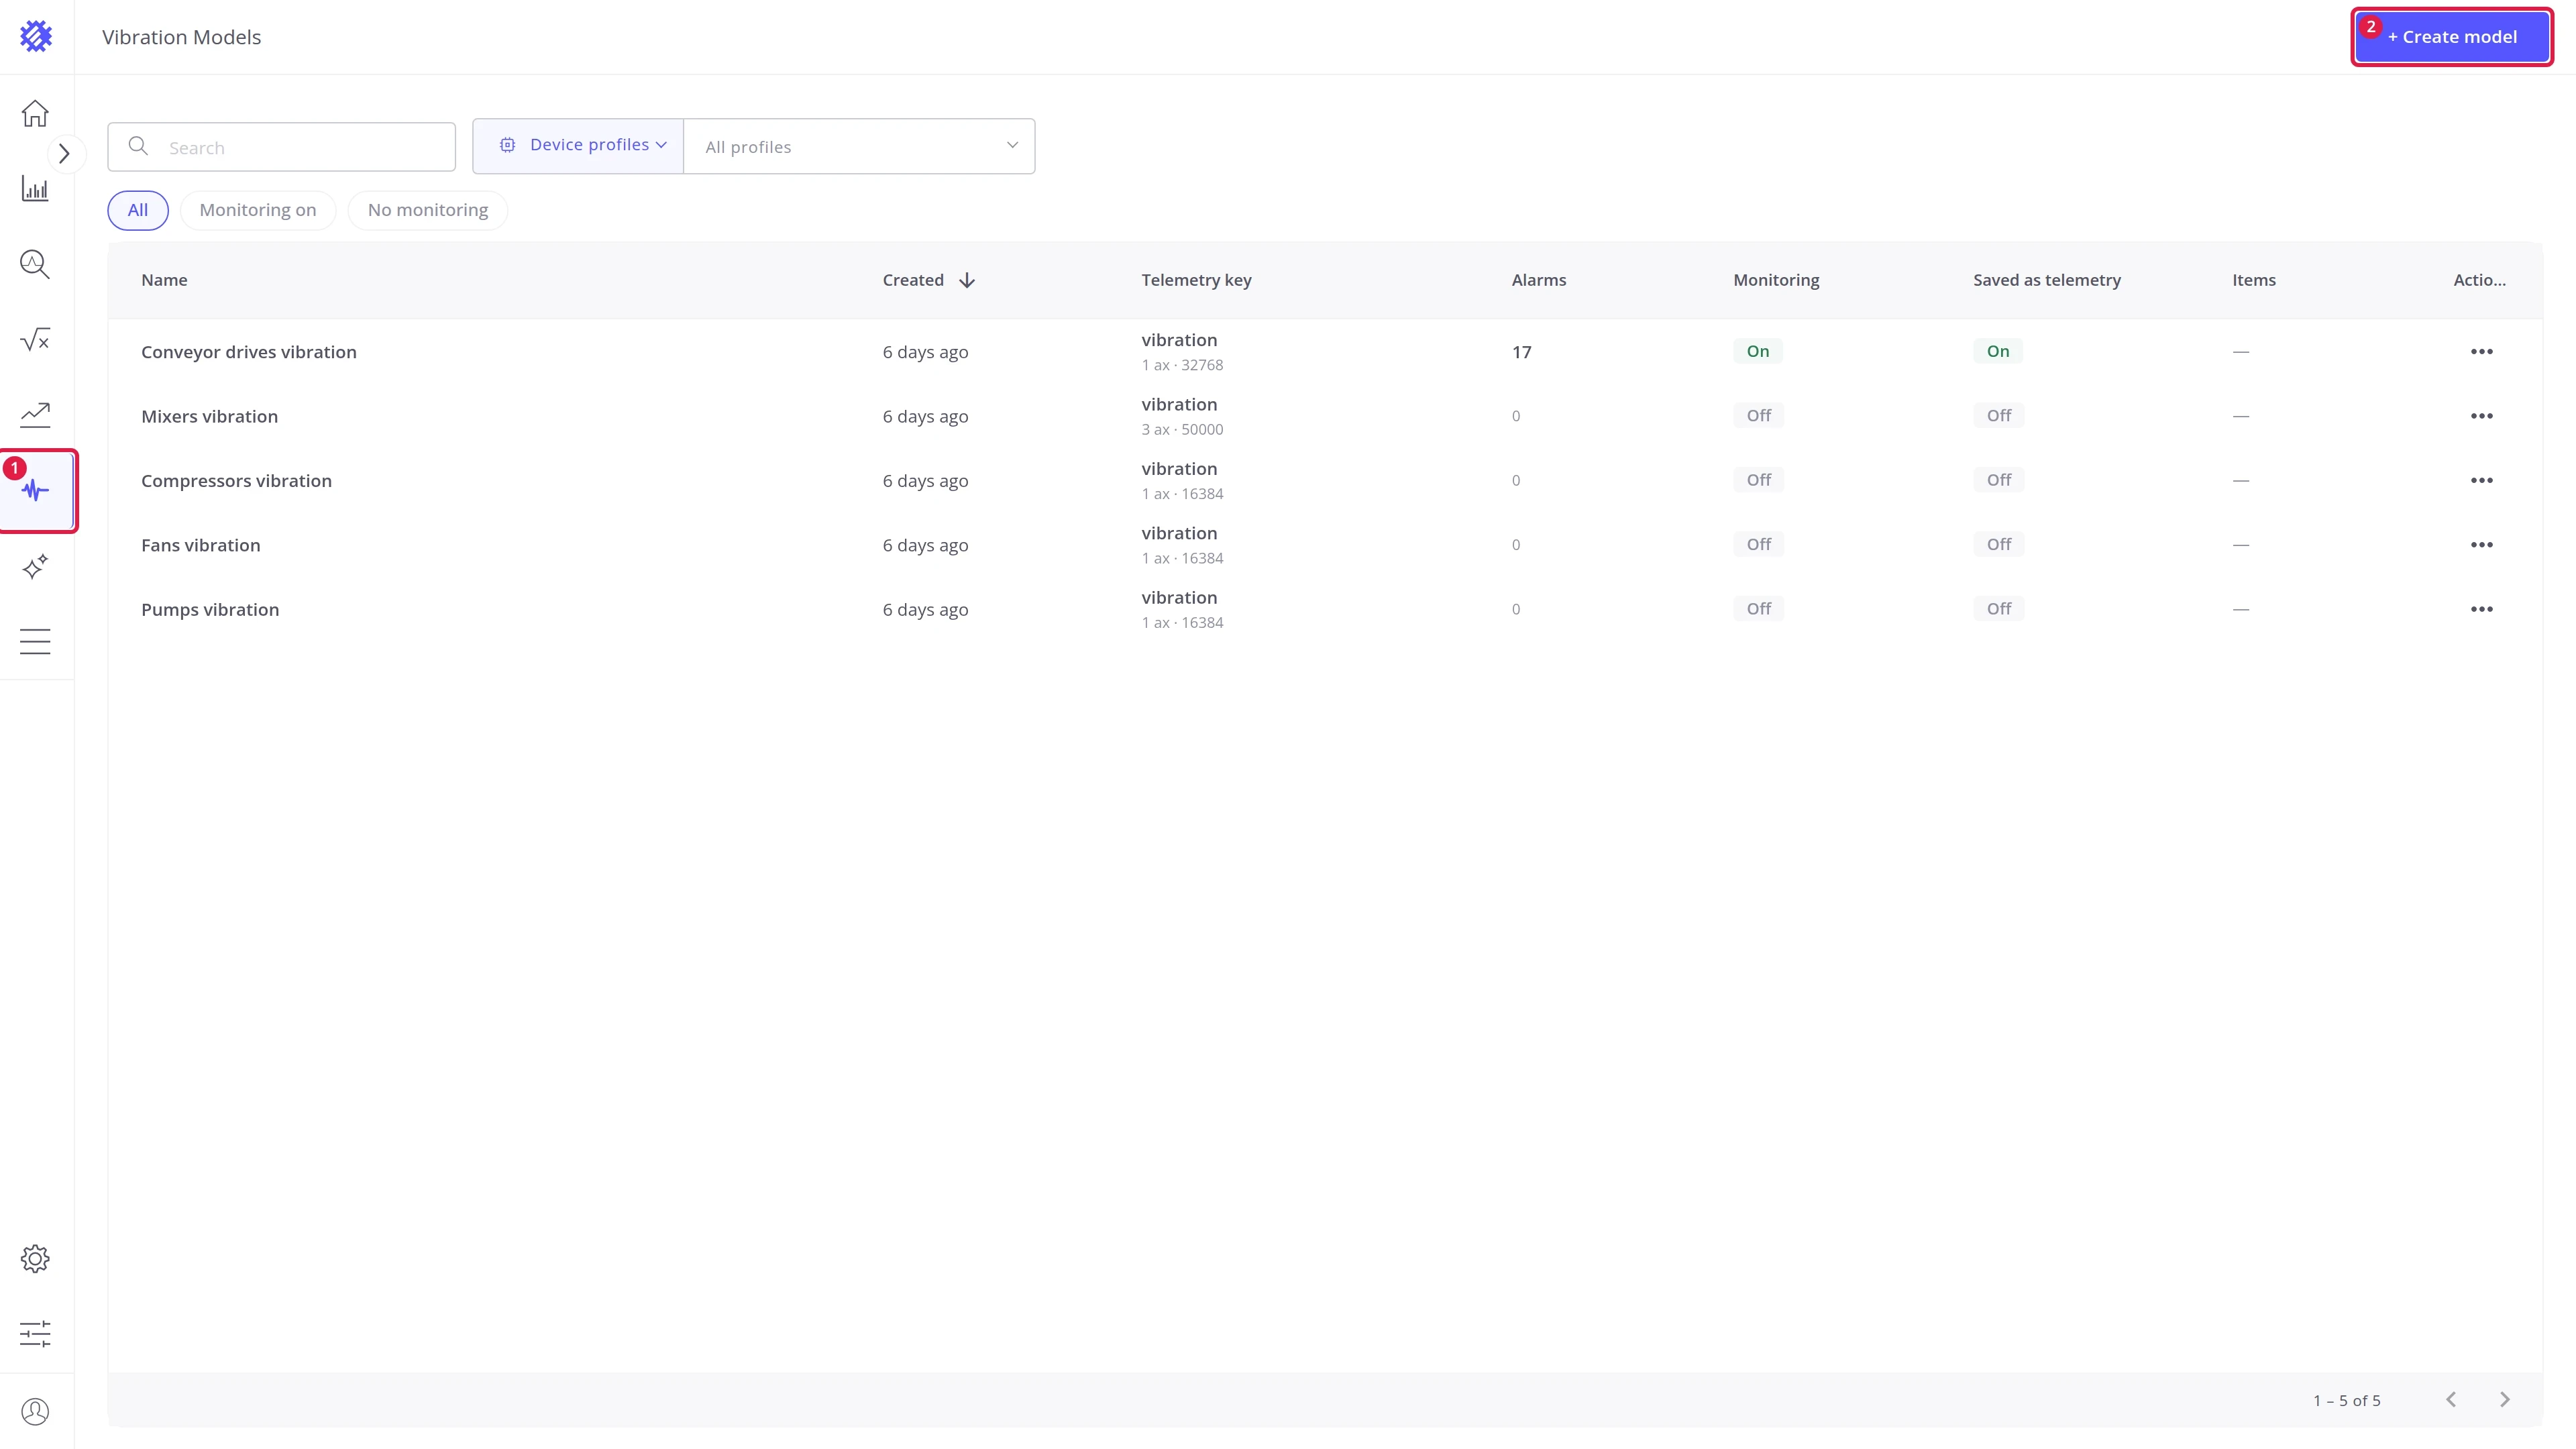
Section titled “Step 1. Open the wizard”Go to Vibration Models in the left menu (1) and click Create model (2).
Step 2. Choose the machines
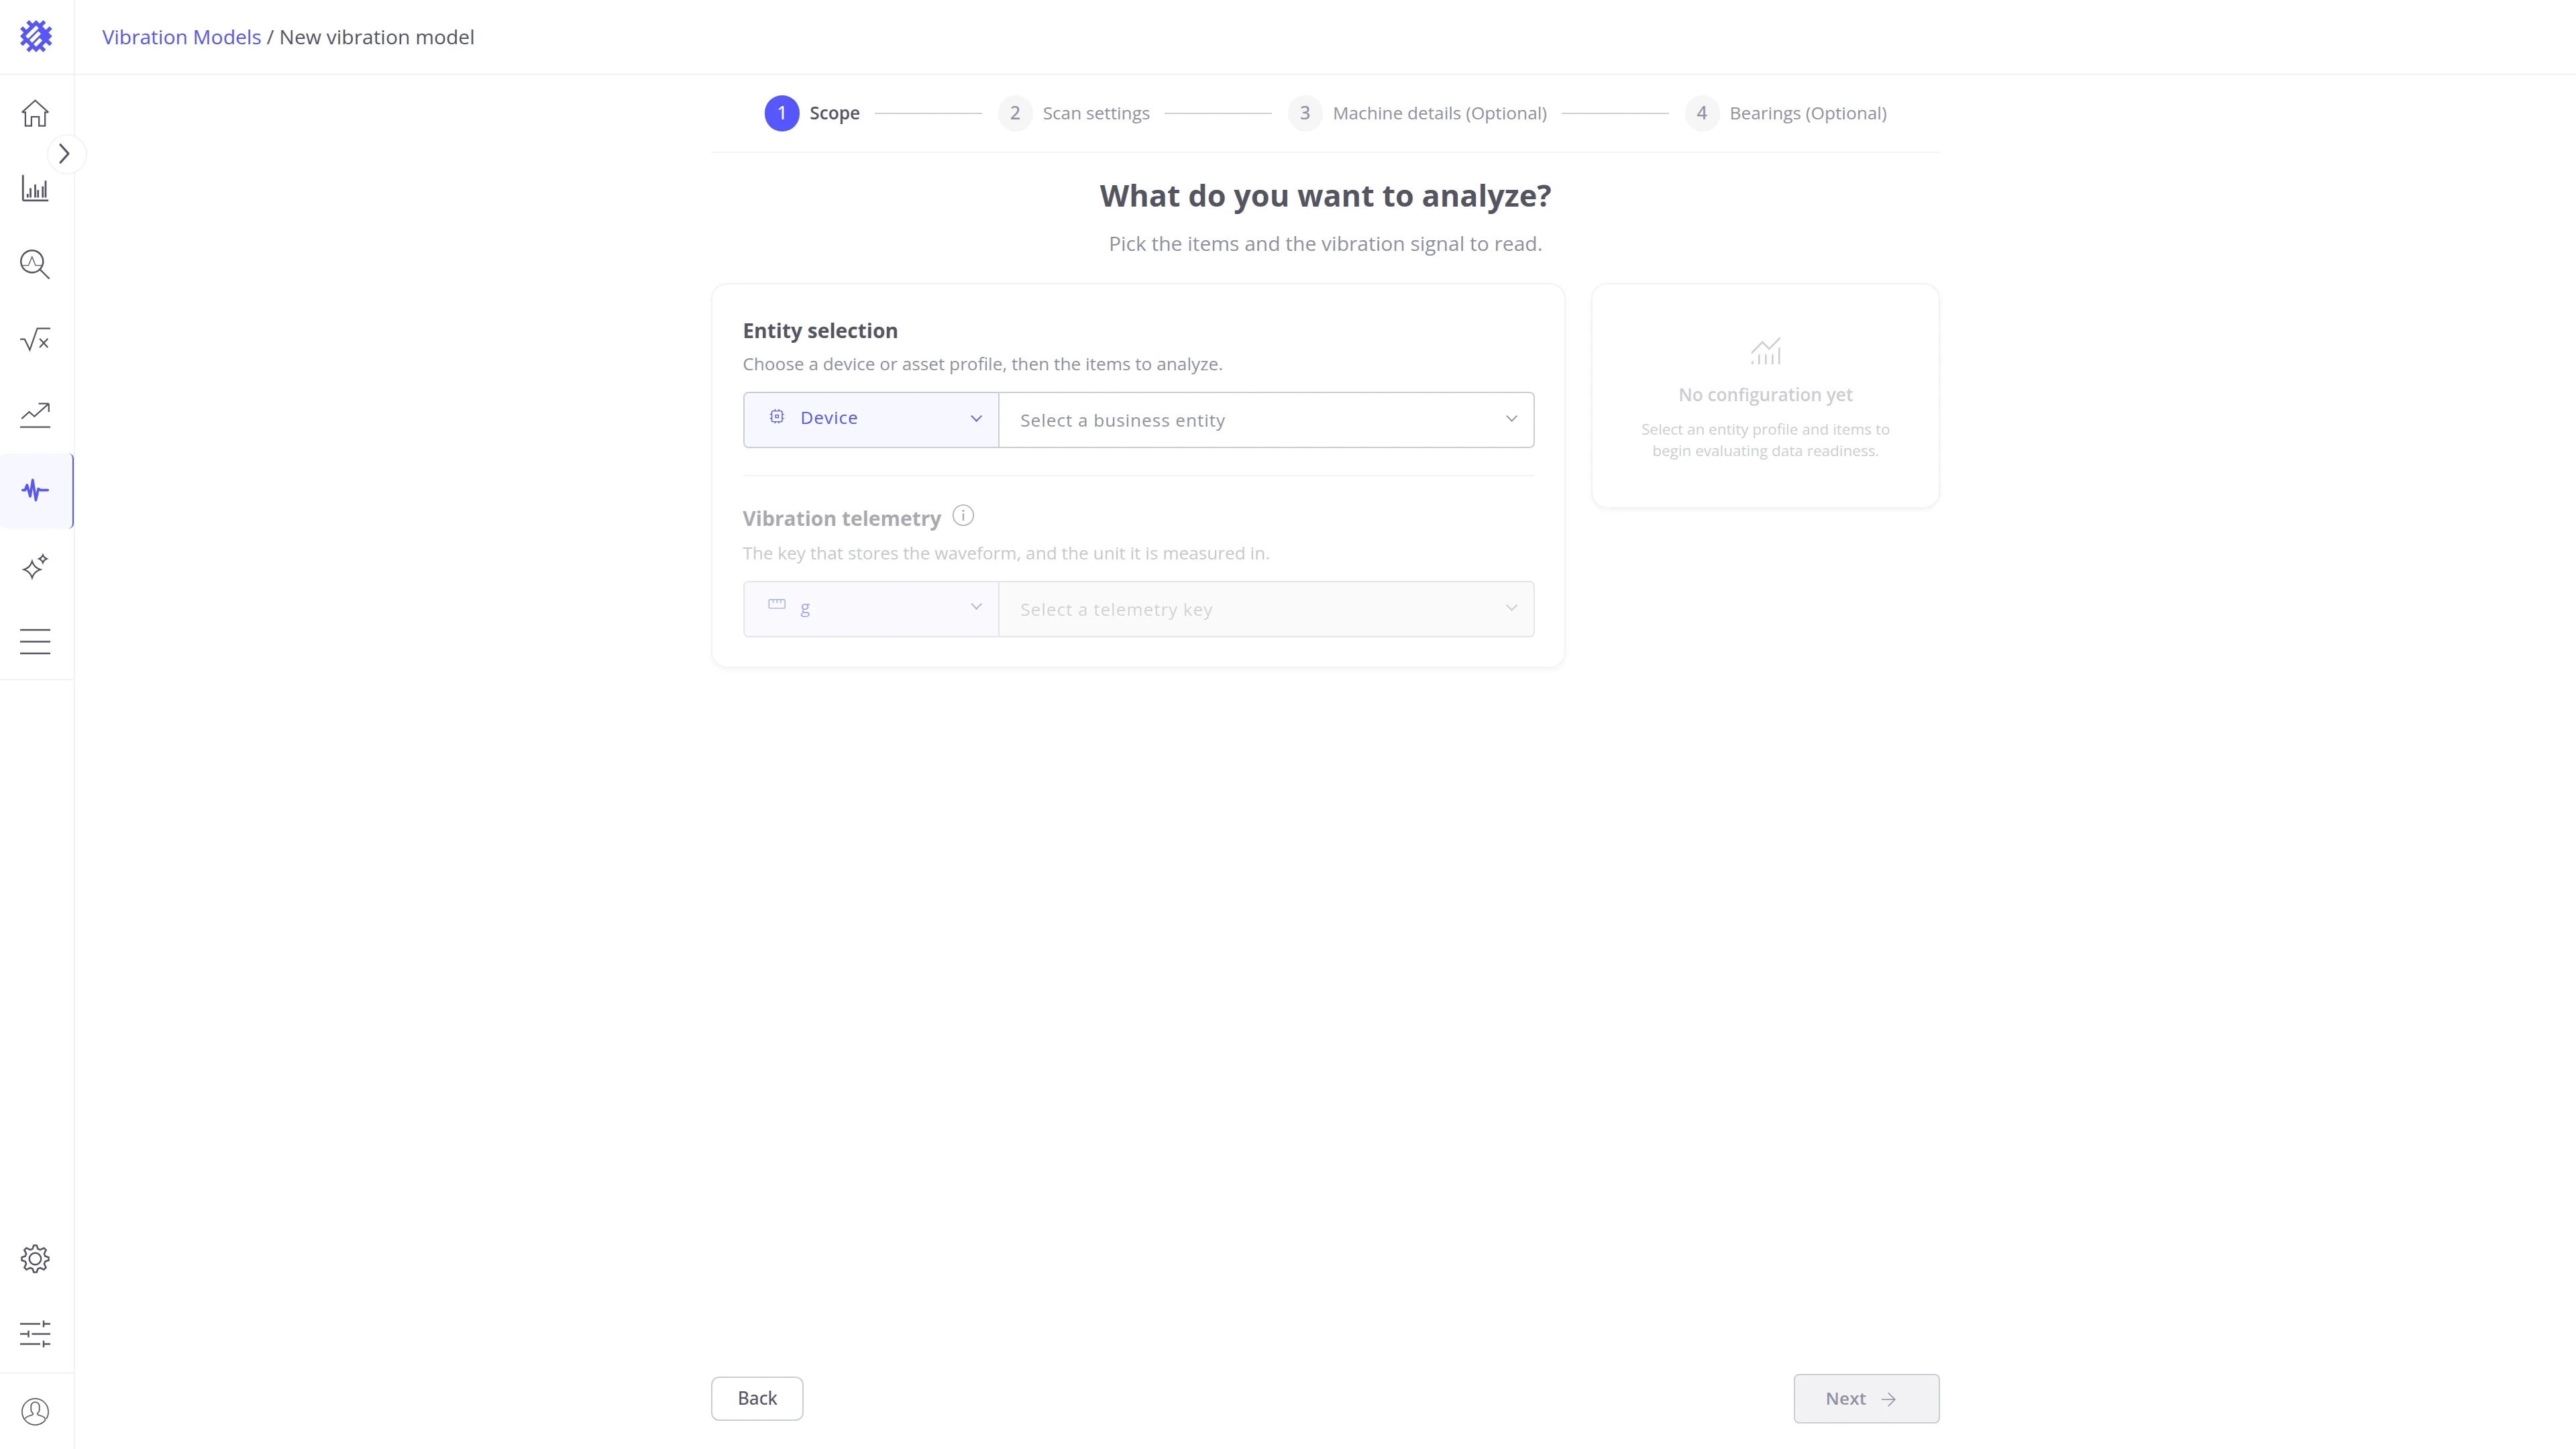
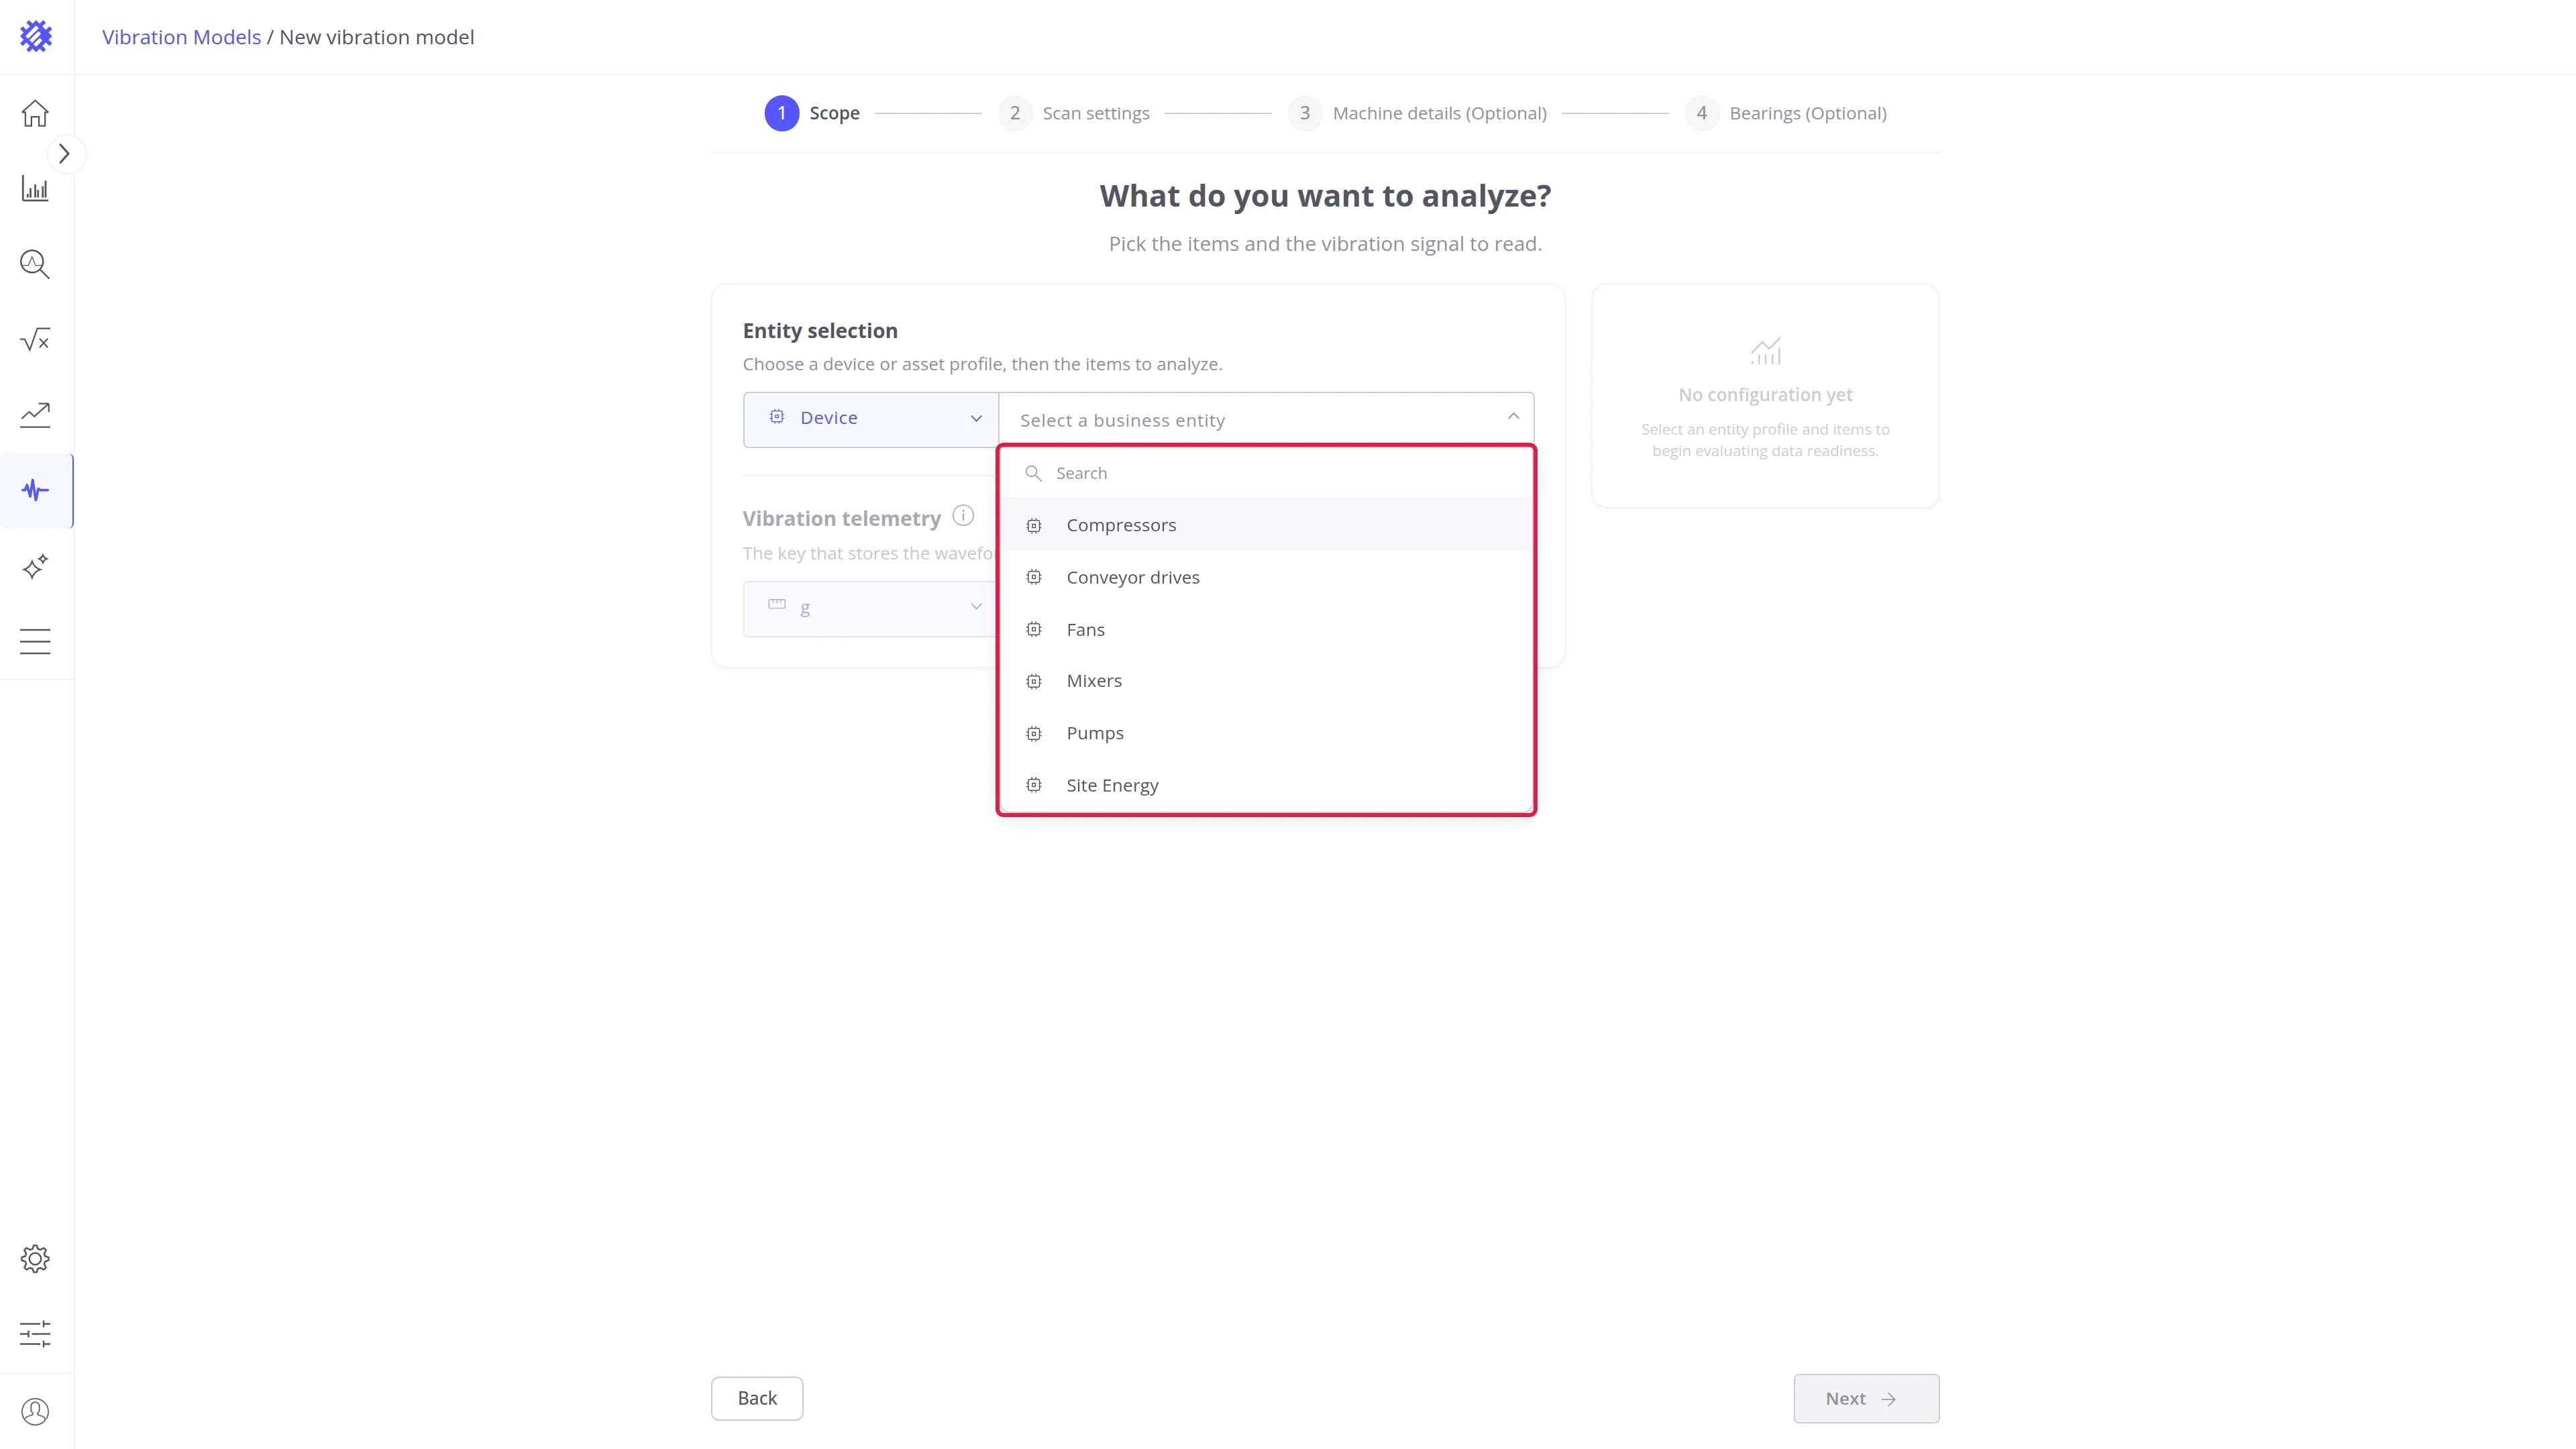
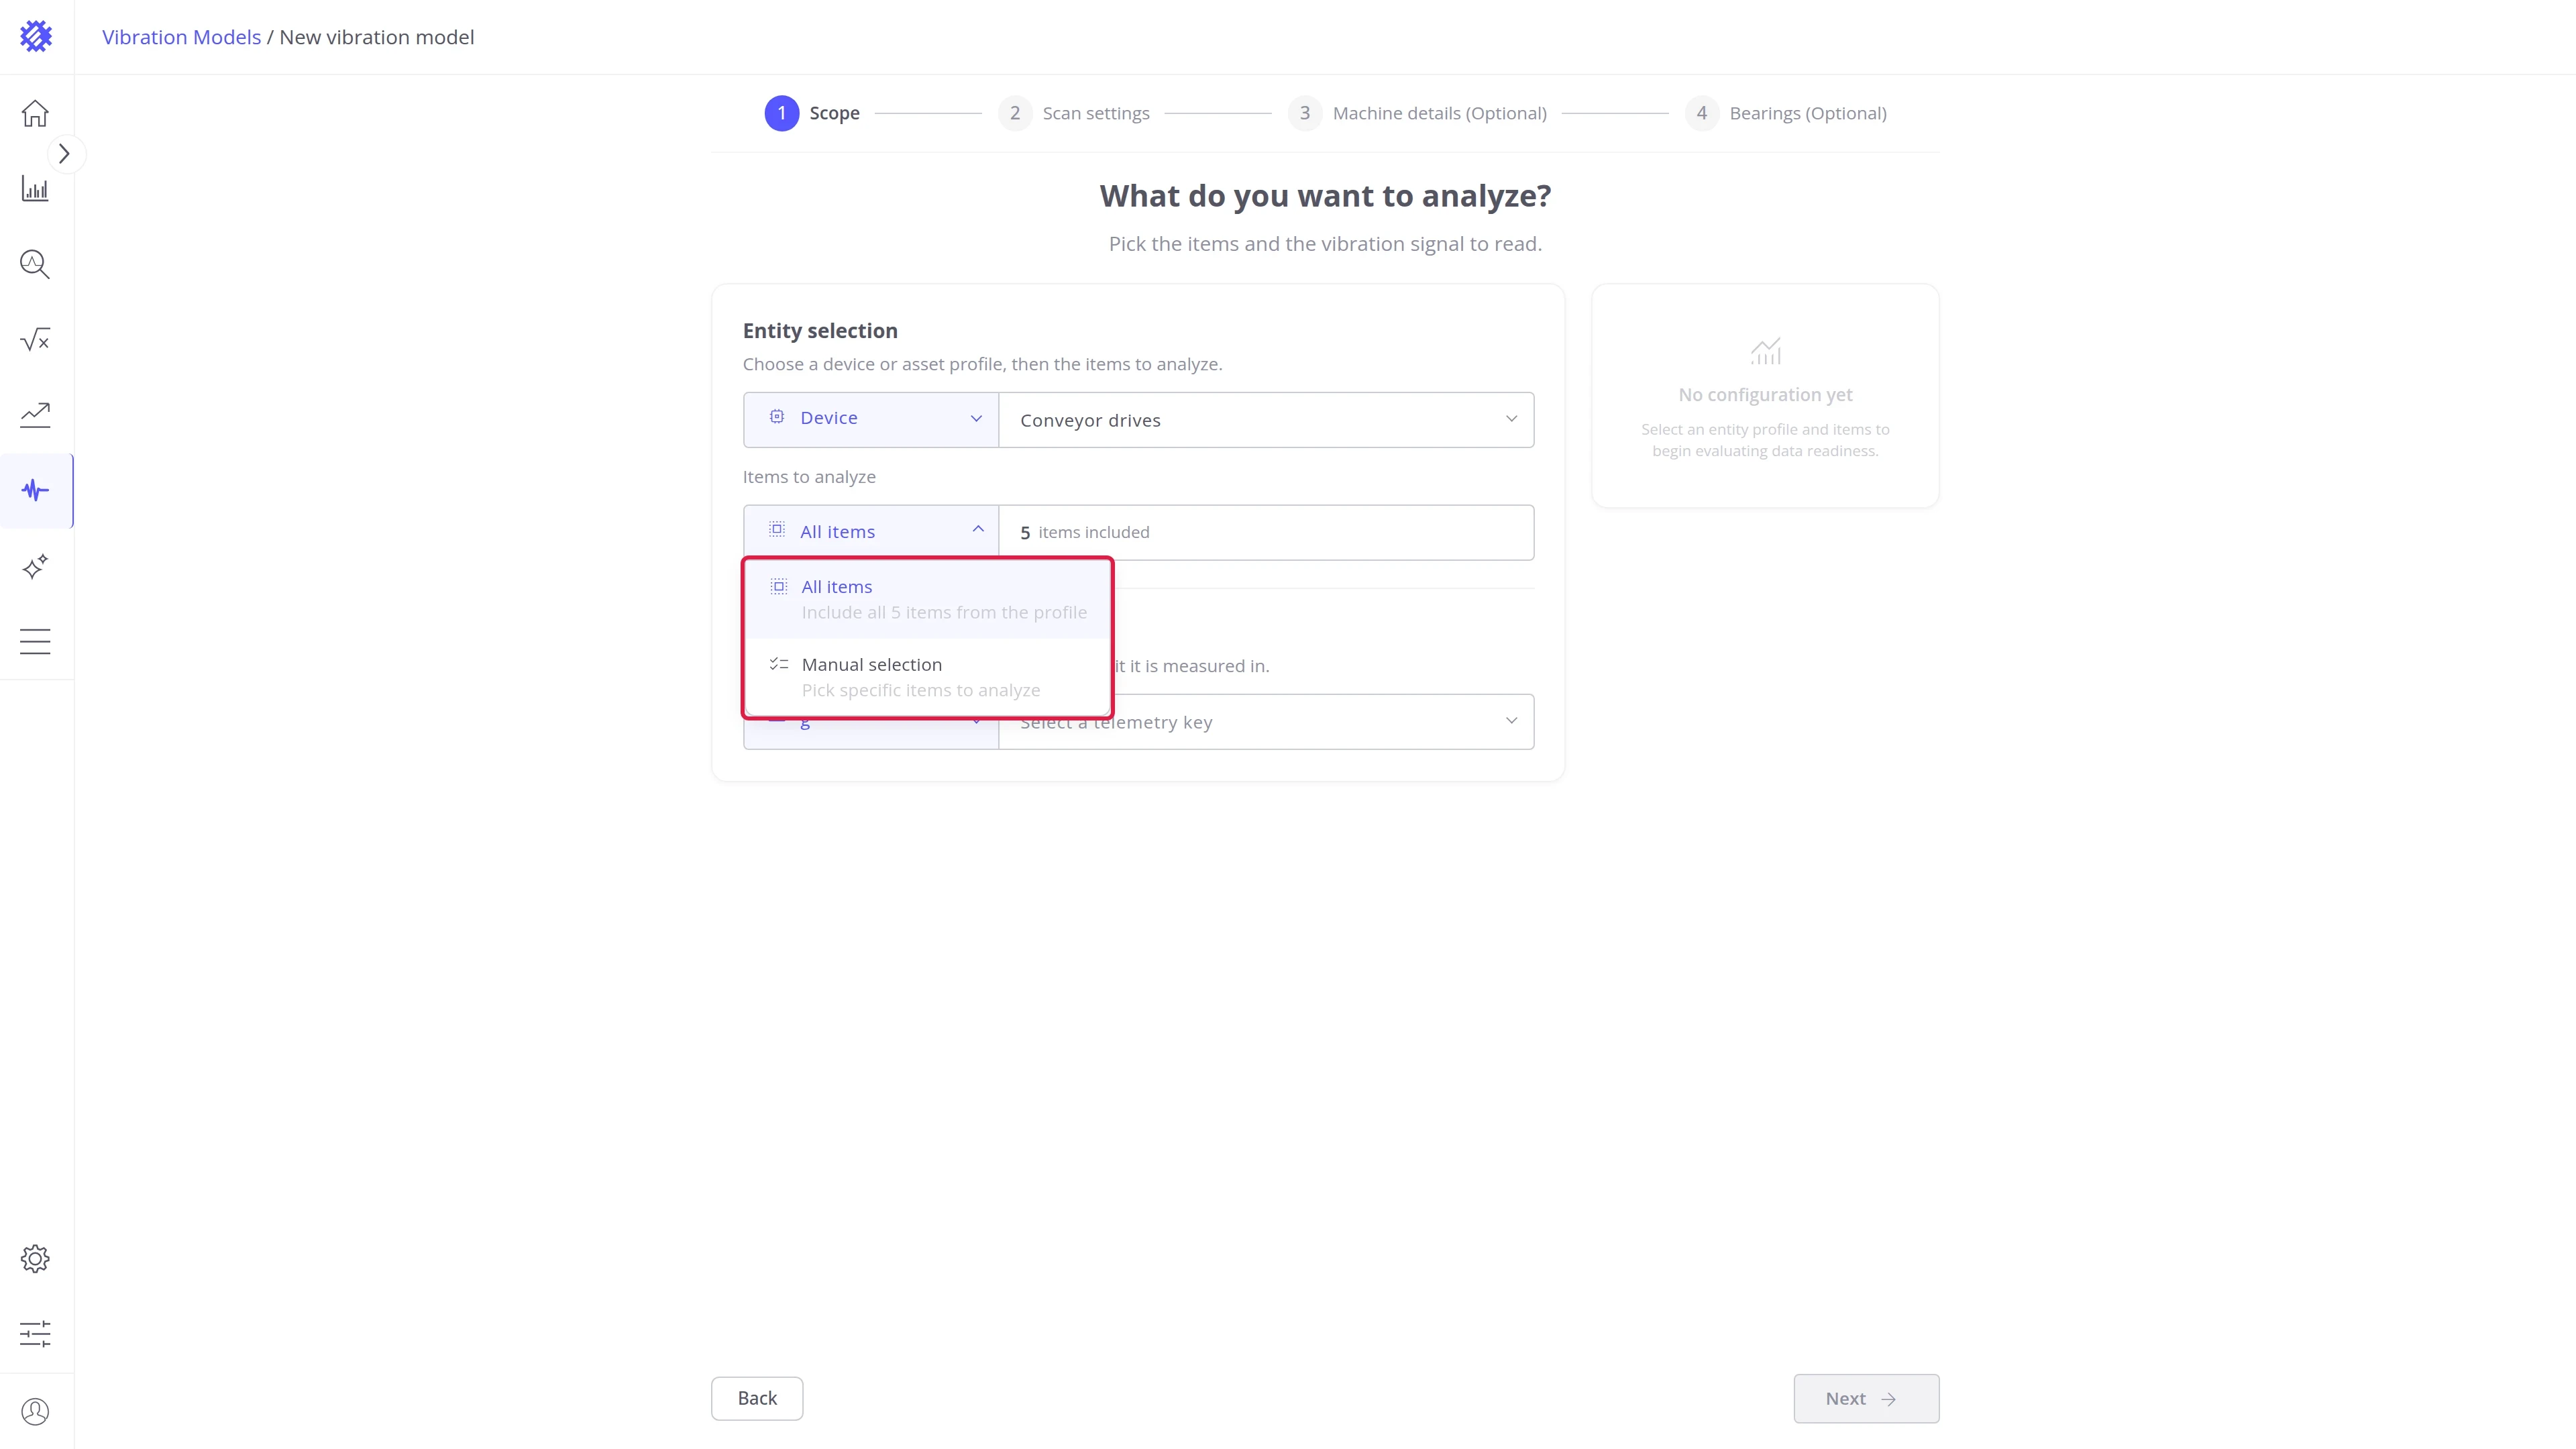
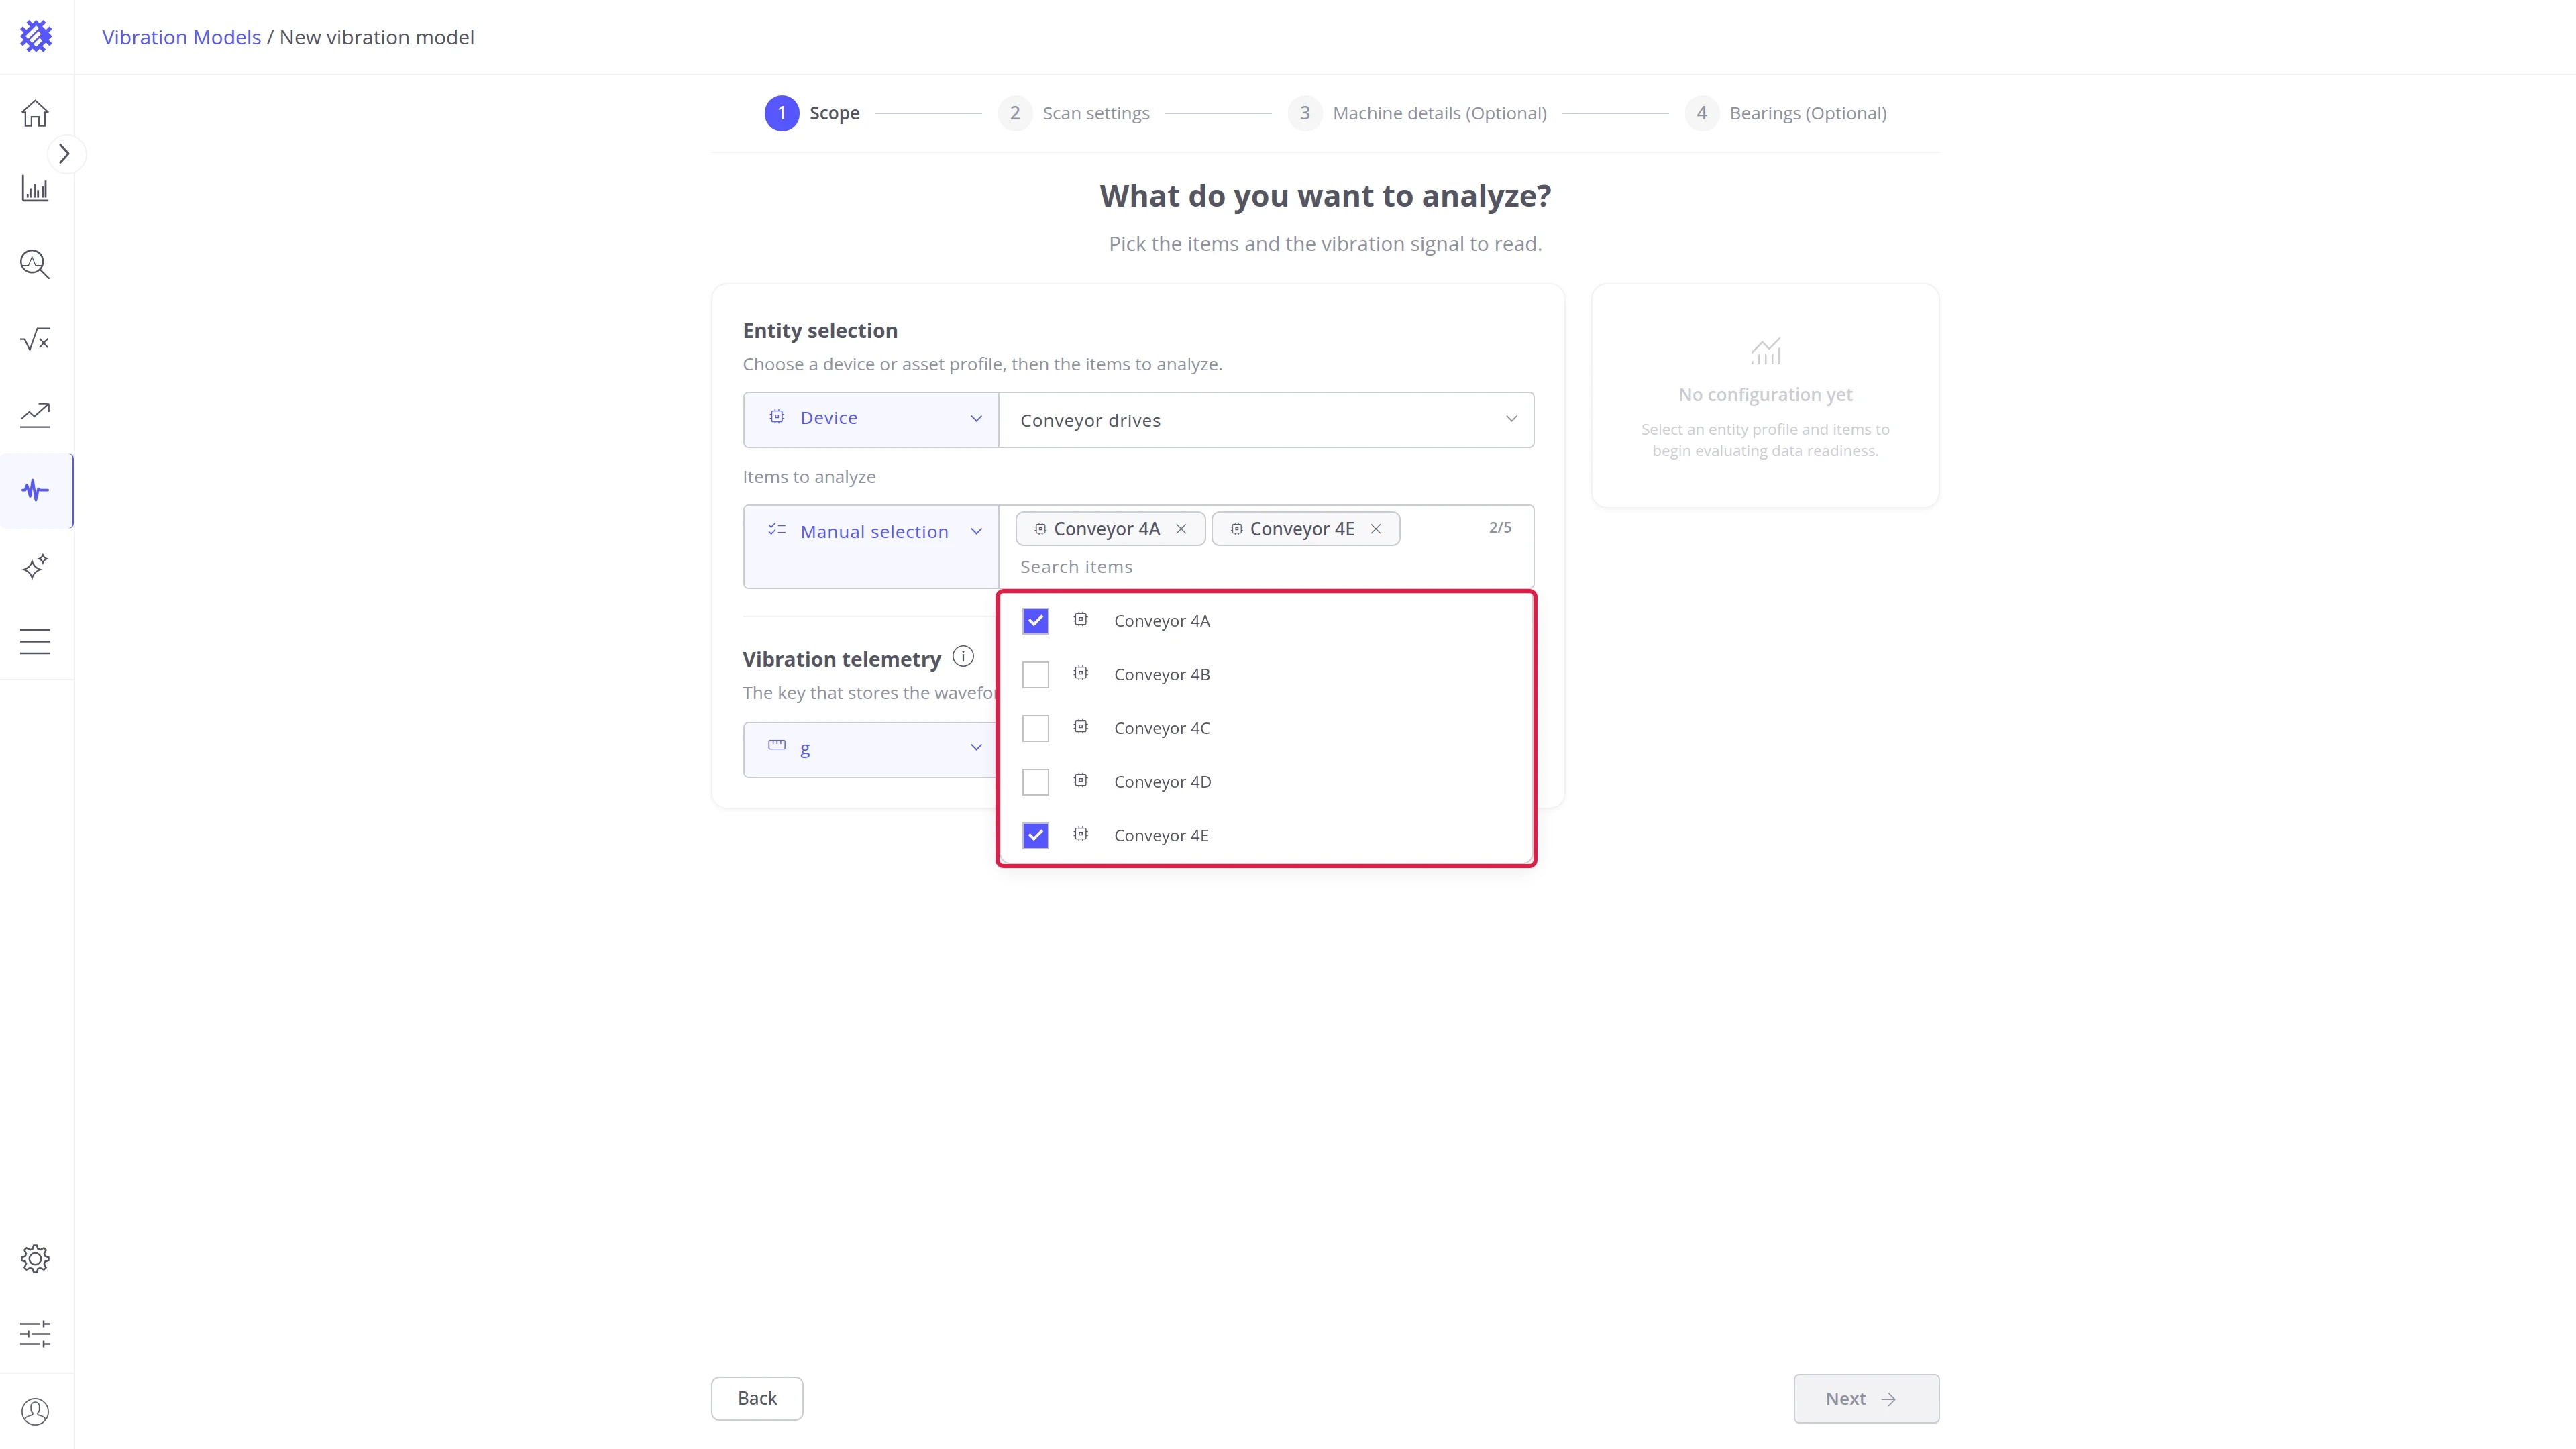
Section titled “Step 2. Choose the machines”Pick the Entity type, Device or Asset, and the profile of your machines. Then choose the Items to analyze:
- All items covers every machine of the profile, including machines added to it later. Use it for a fleet.
- Manual selection covers only the machines you check in the list. Use it to start with a few machines, or to leave out the ones without a sensor.
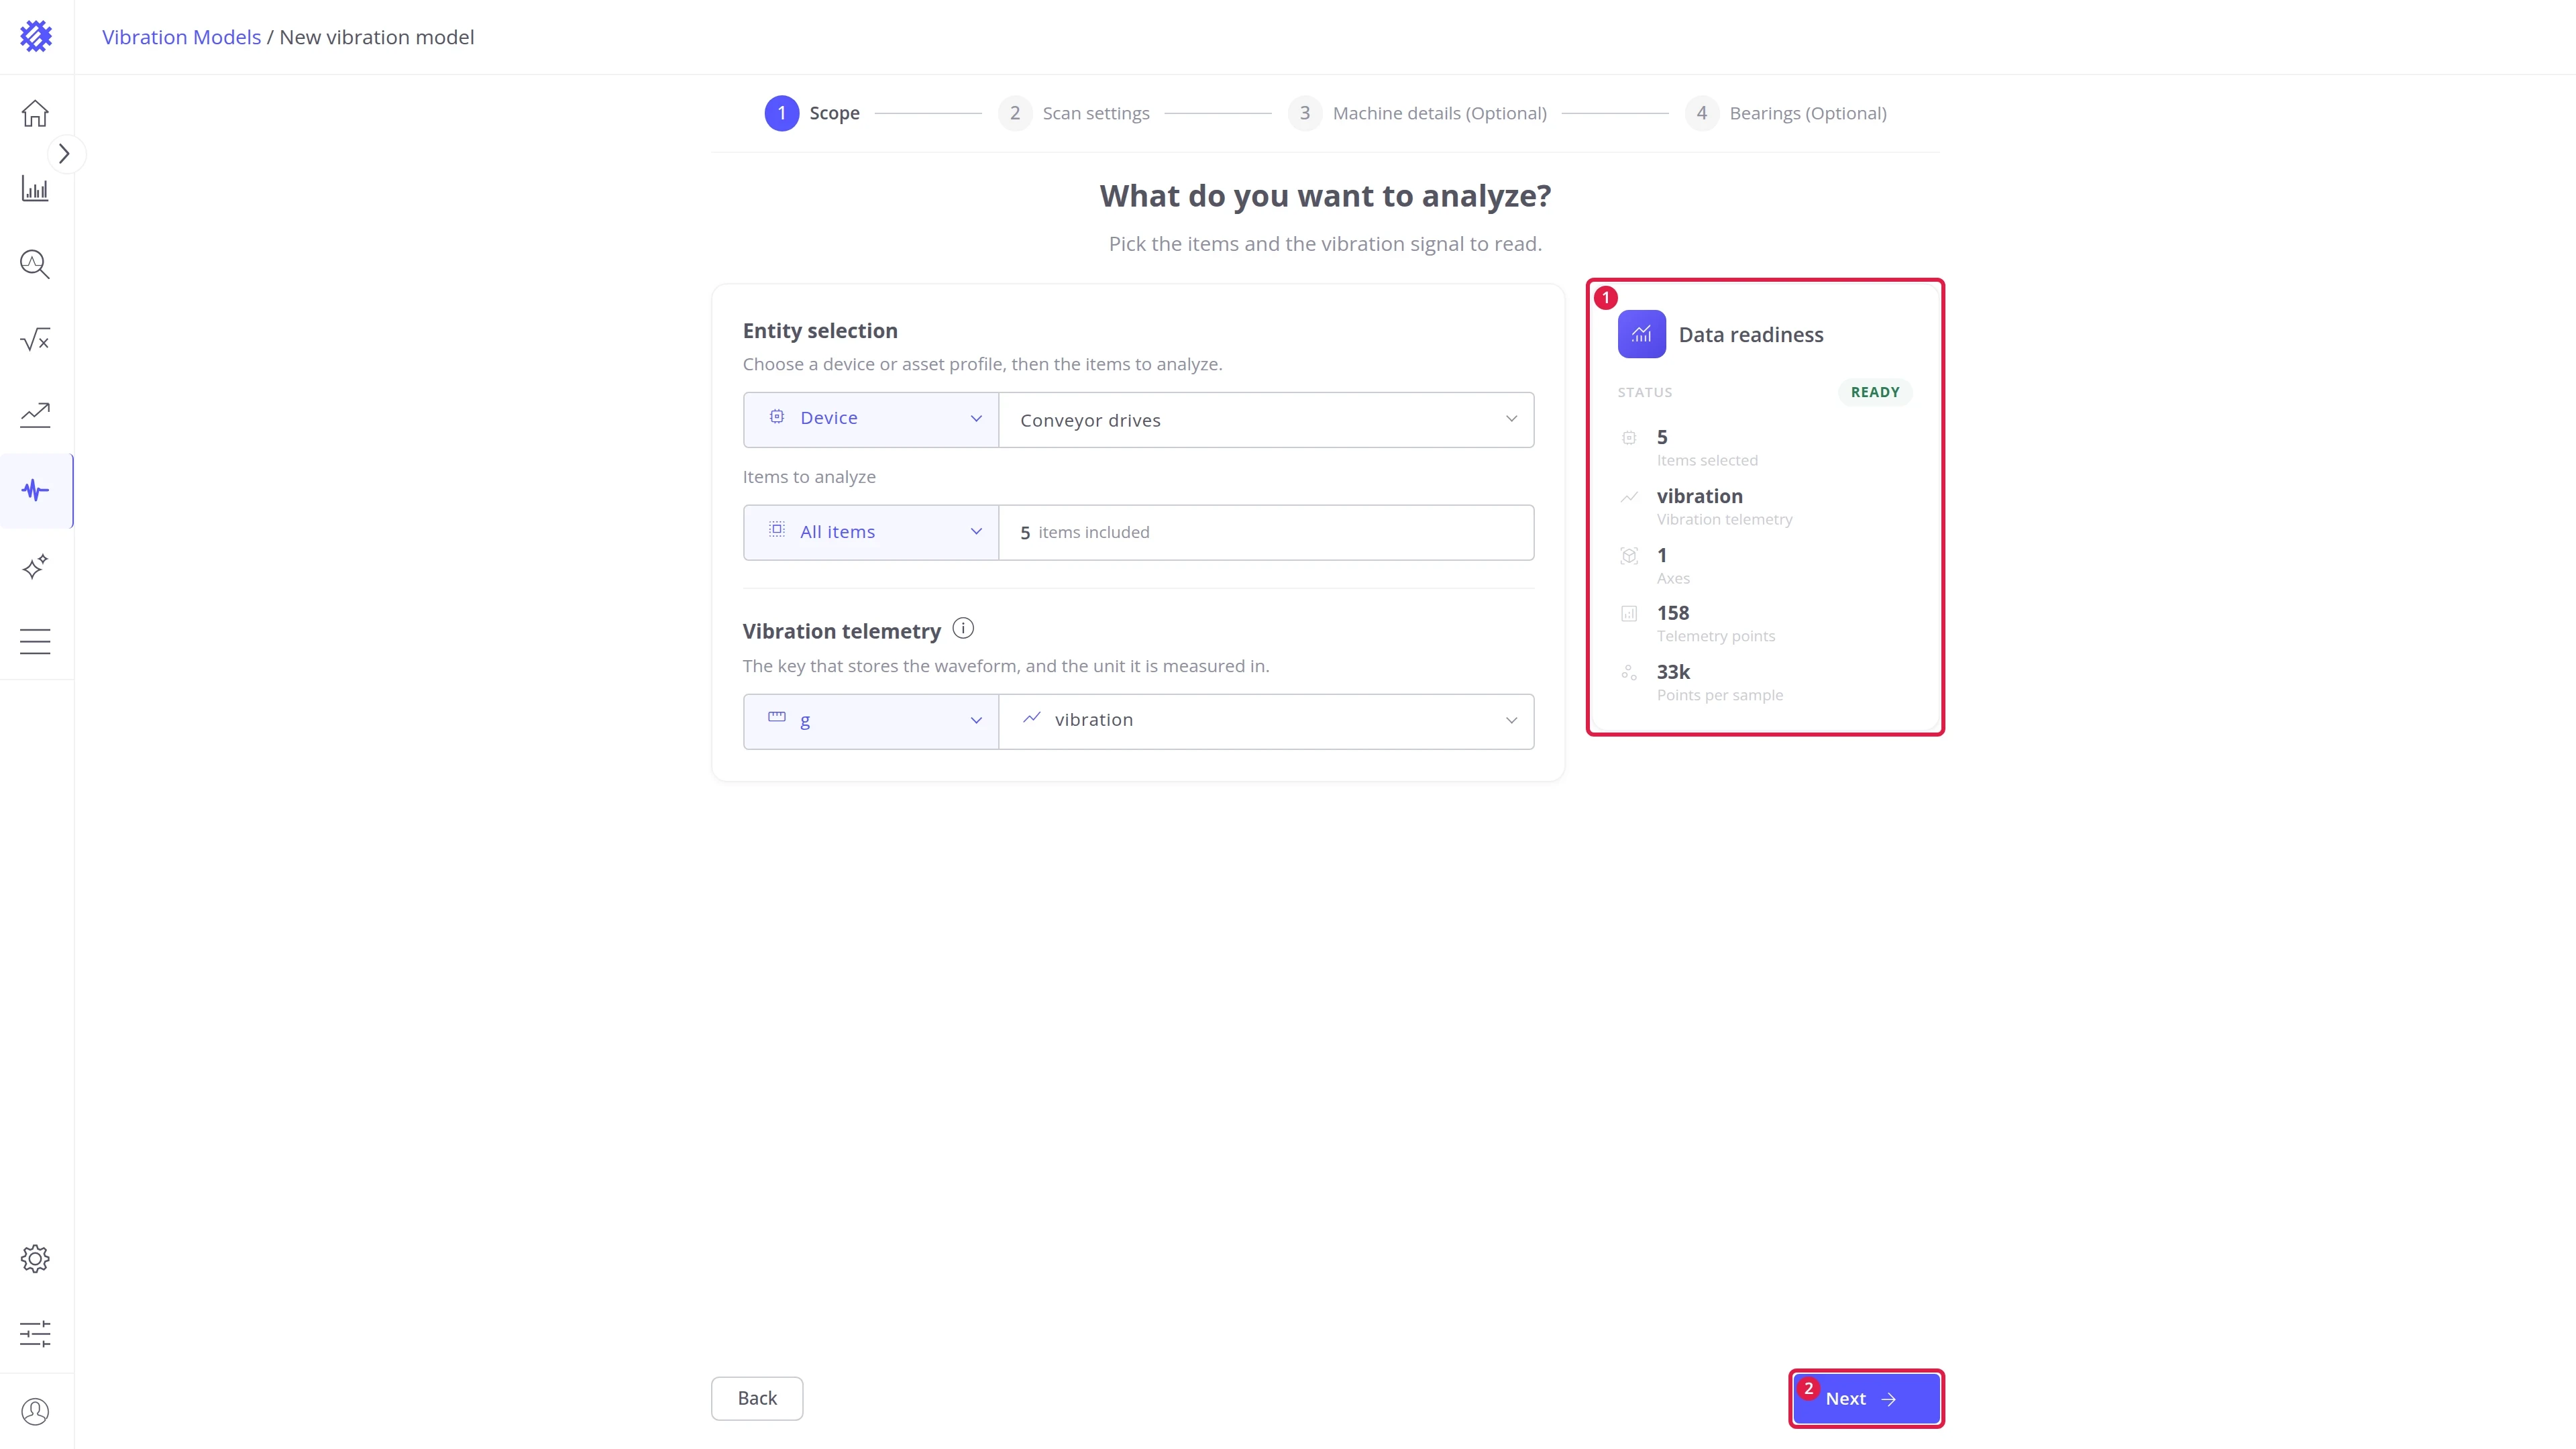
Step 3. Choose the signal
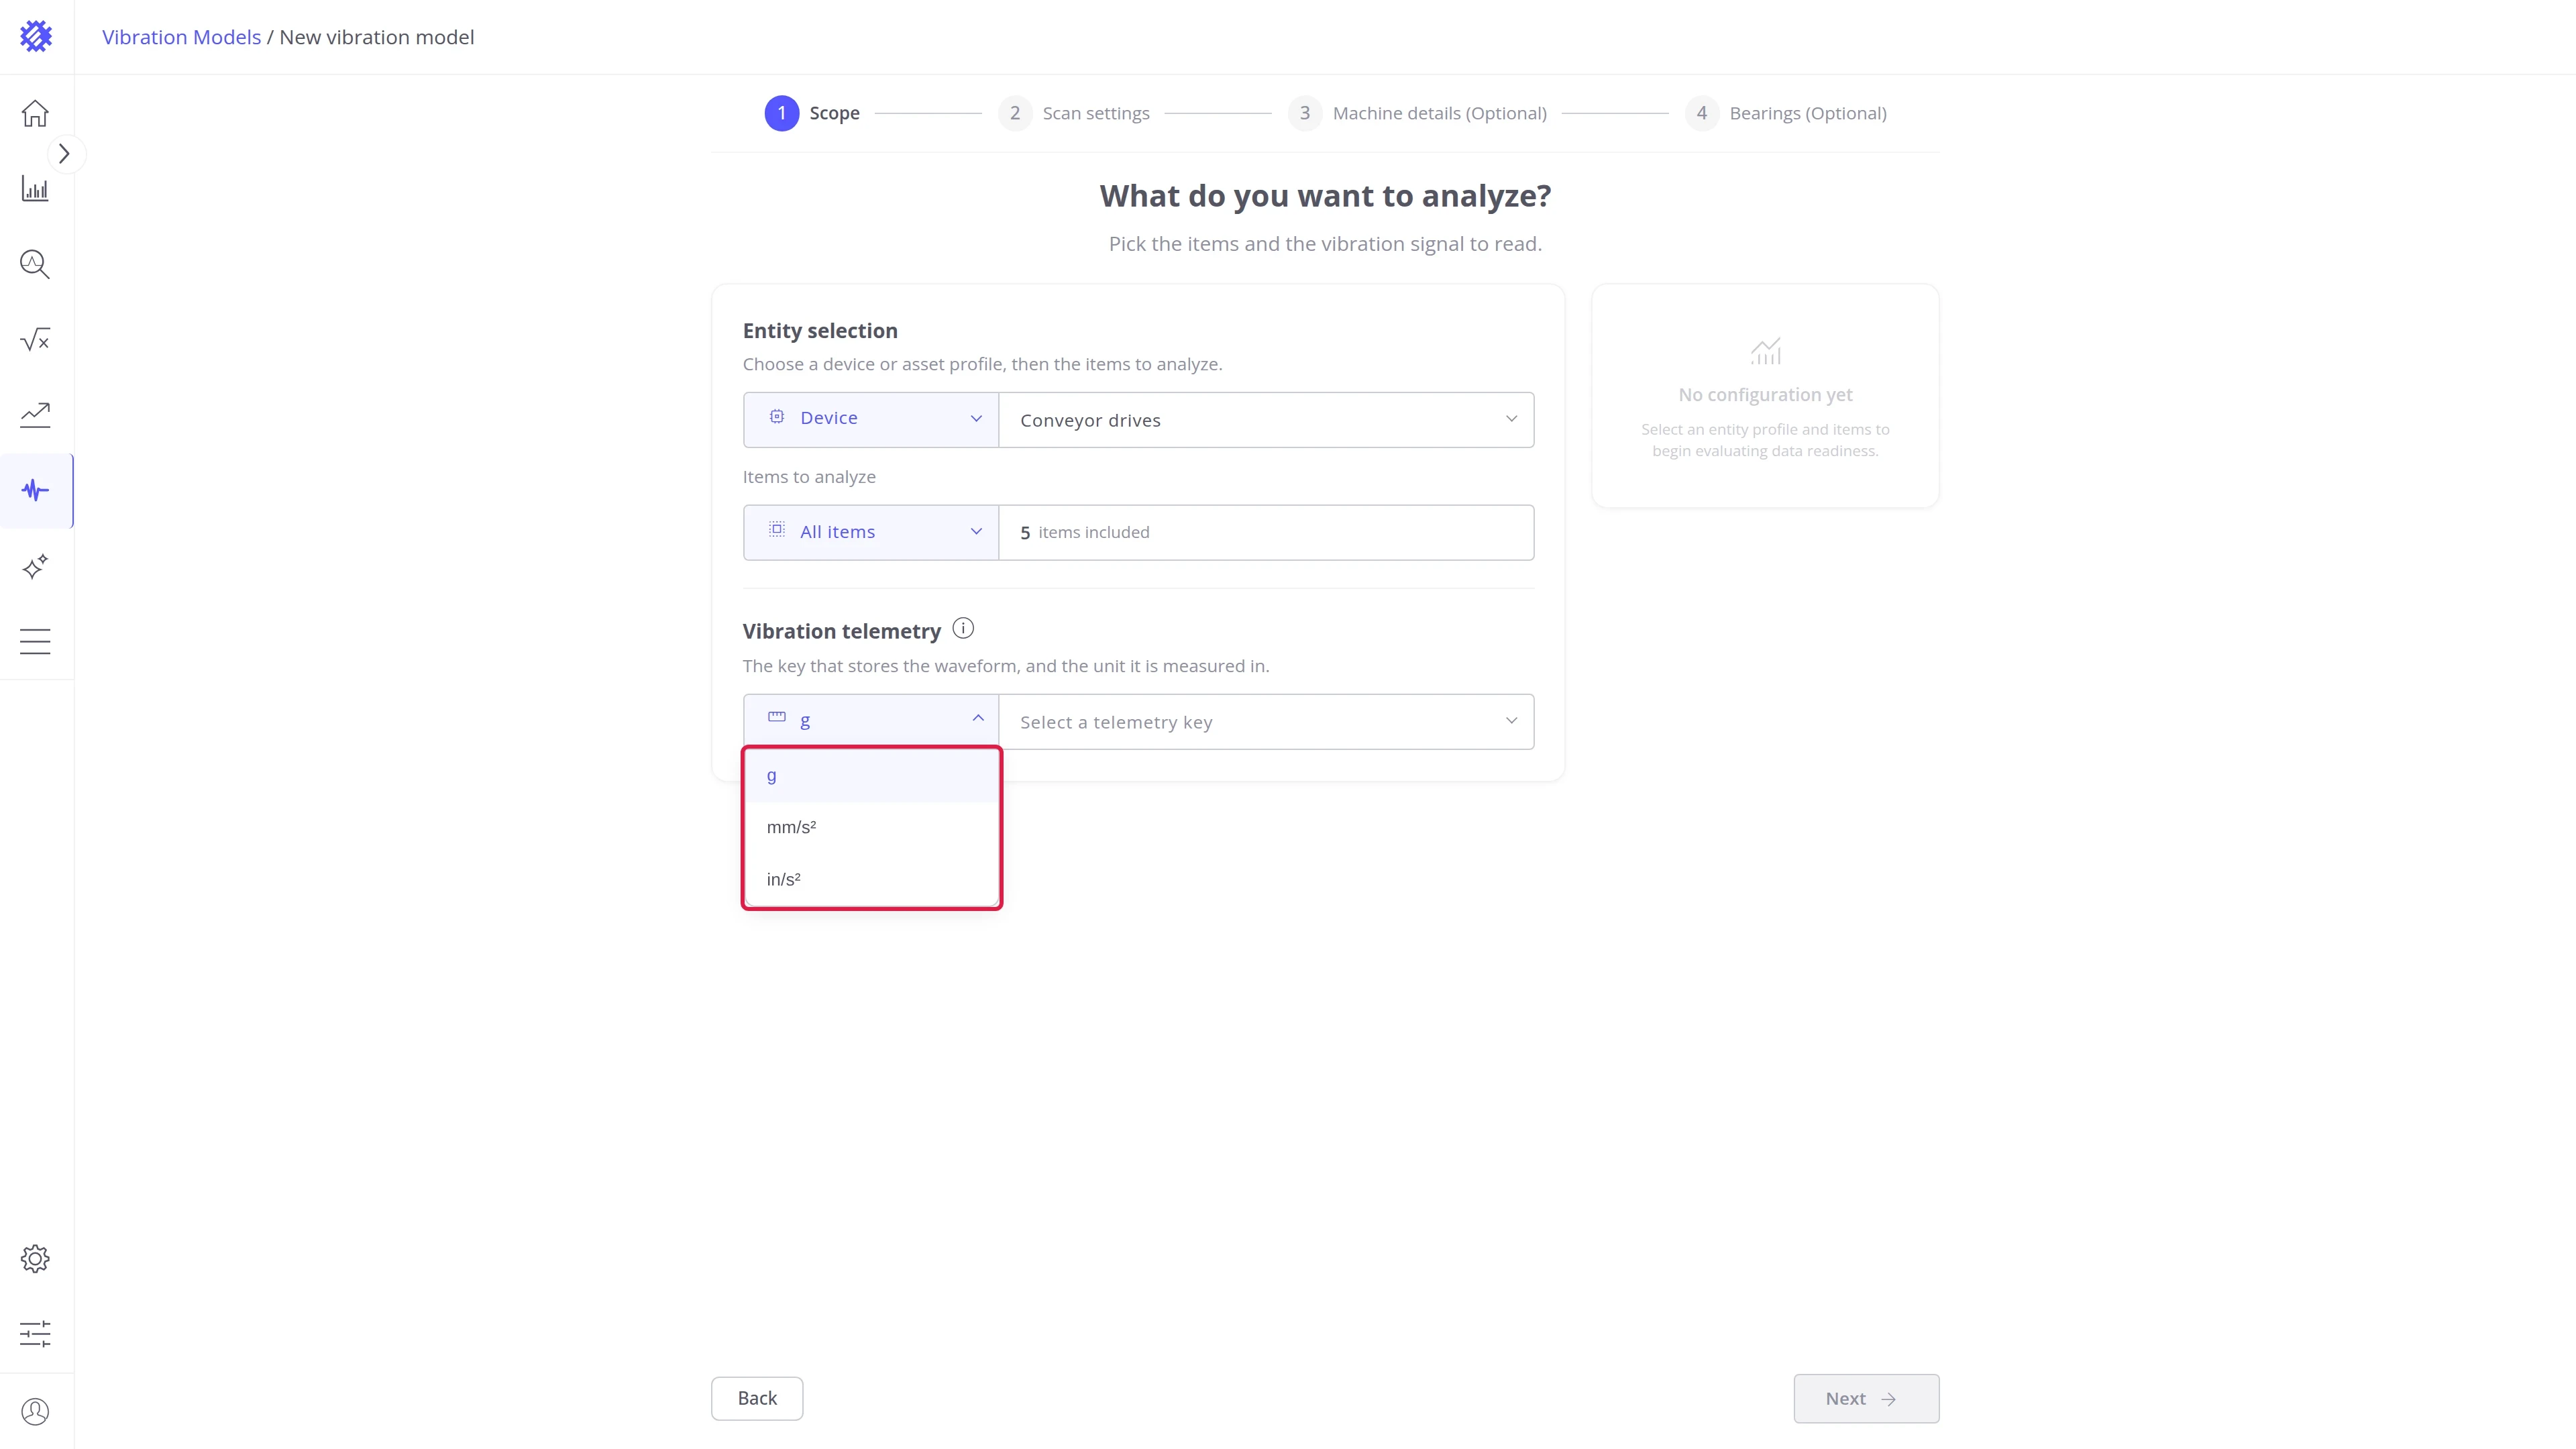
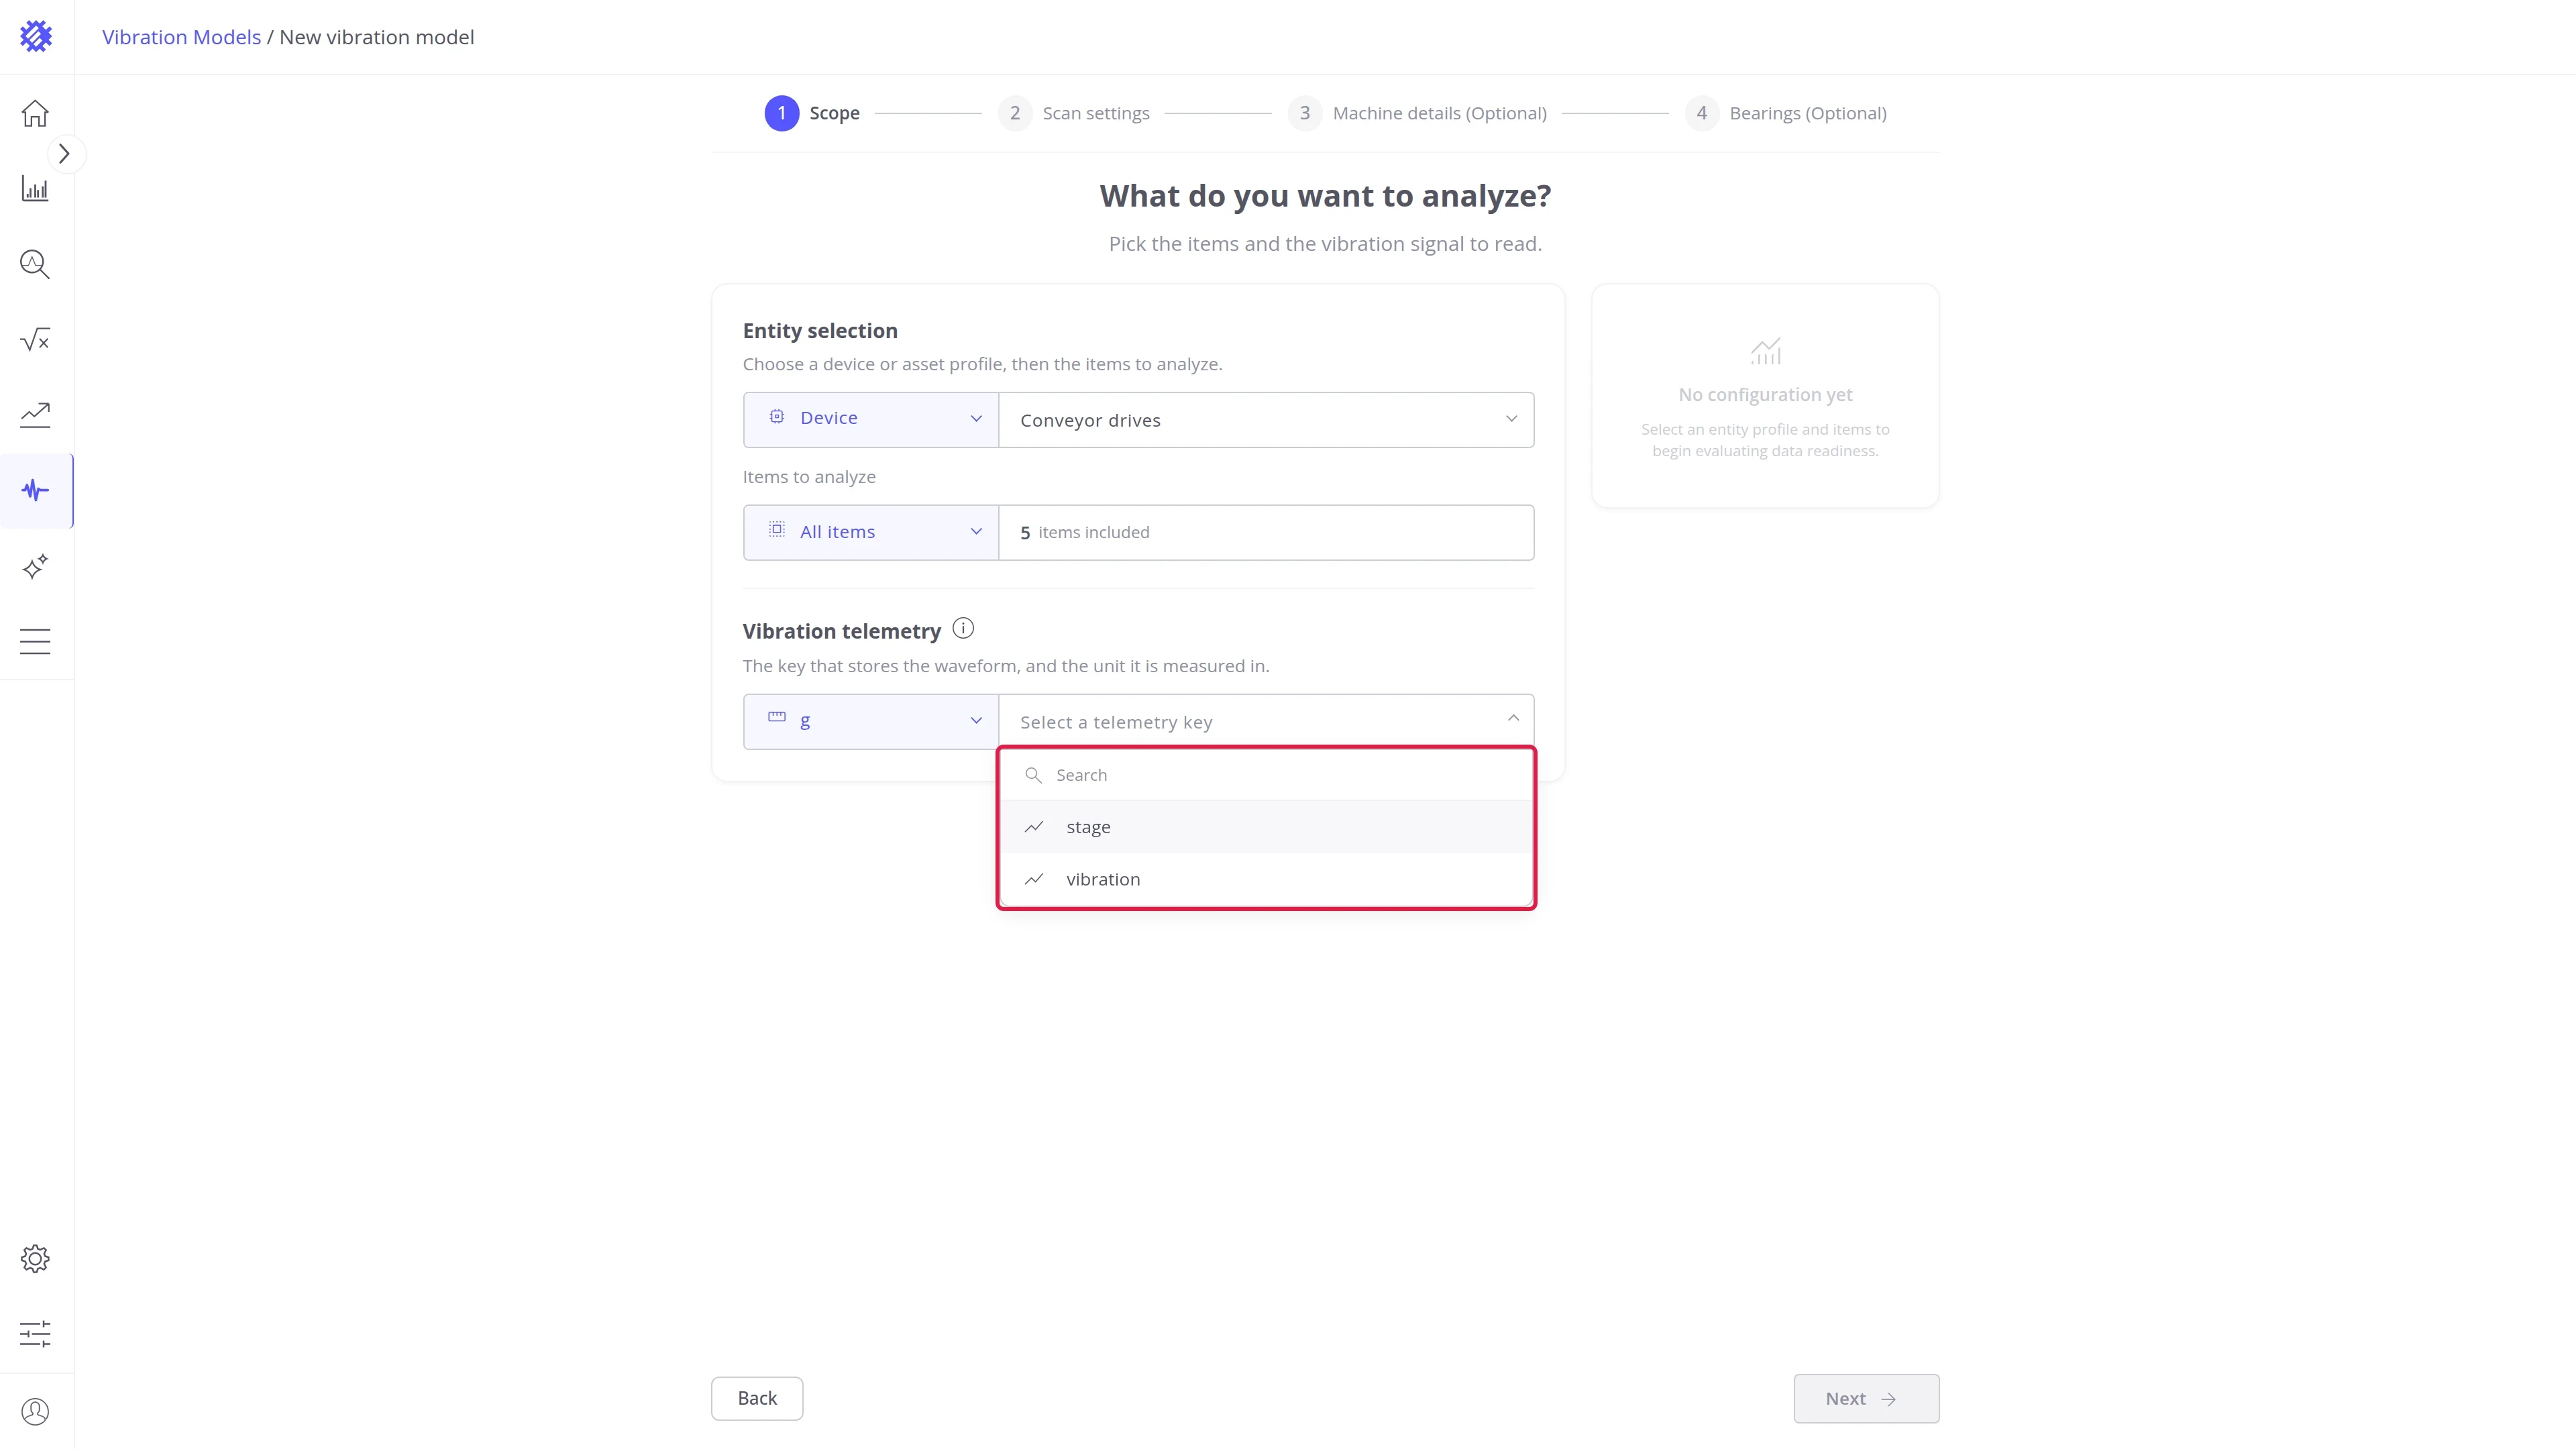
Section titled “Step 3. Choose the signal”Tell Trendz where the samples are and what they measure:
- Pick the Signal unit: the unit the sensor records acceleration in, g, mm/s², or in/s². Every metric is computed from the raw values, so pick the unit the sensor really writes. How acceleration relates to velocity and displacement is described in Vibration Analysis Basics.
- Pick the Telemetry key that holds the samples. The list shows the telemetry keys of the profile. The key must hold samples in the Trendz format.
- Check the Data readiness panel on the right (1). Ready means Trendz found samples it can analyze. The panel also shows how many axes and points per sample it read.
Then click Next (2).
Step 4. Set the sample rate
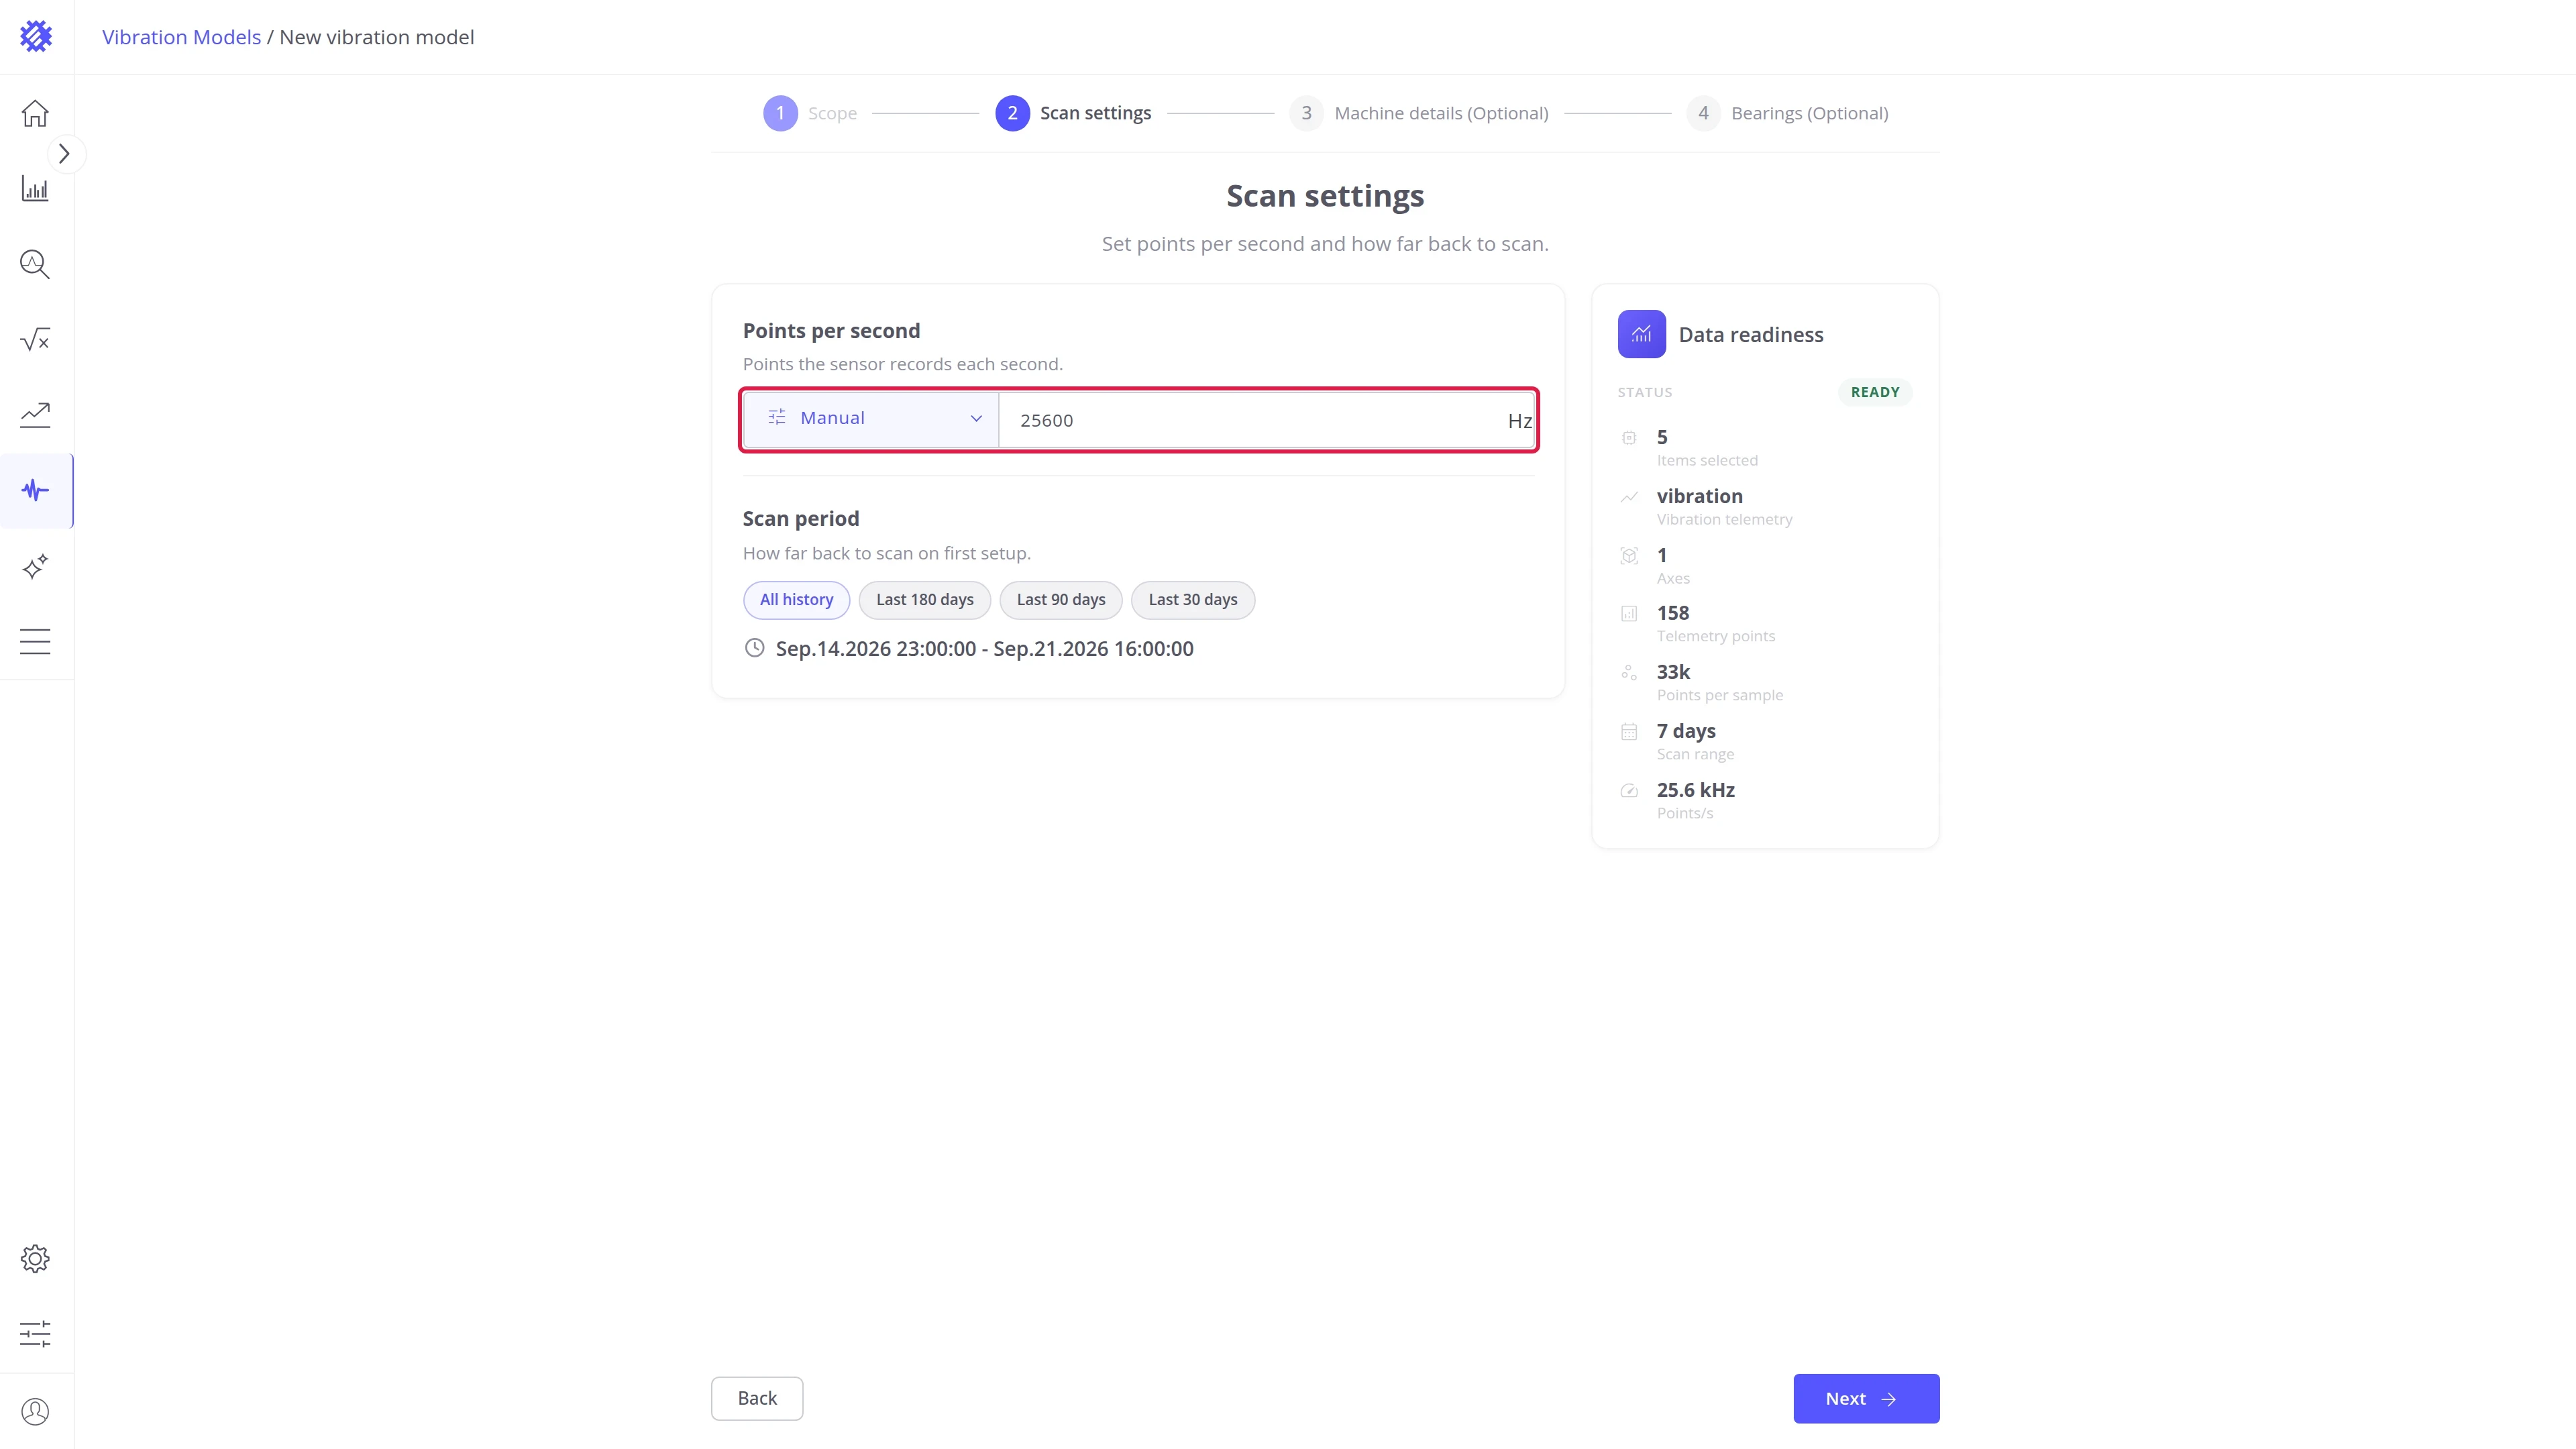
Section titled “Step 4. Set the sample rate”Tell Trendz how fast the sensor records, and how much history the first scan reads.
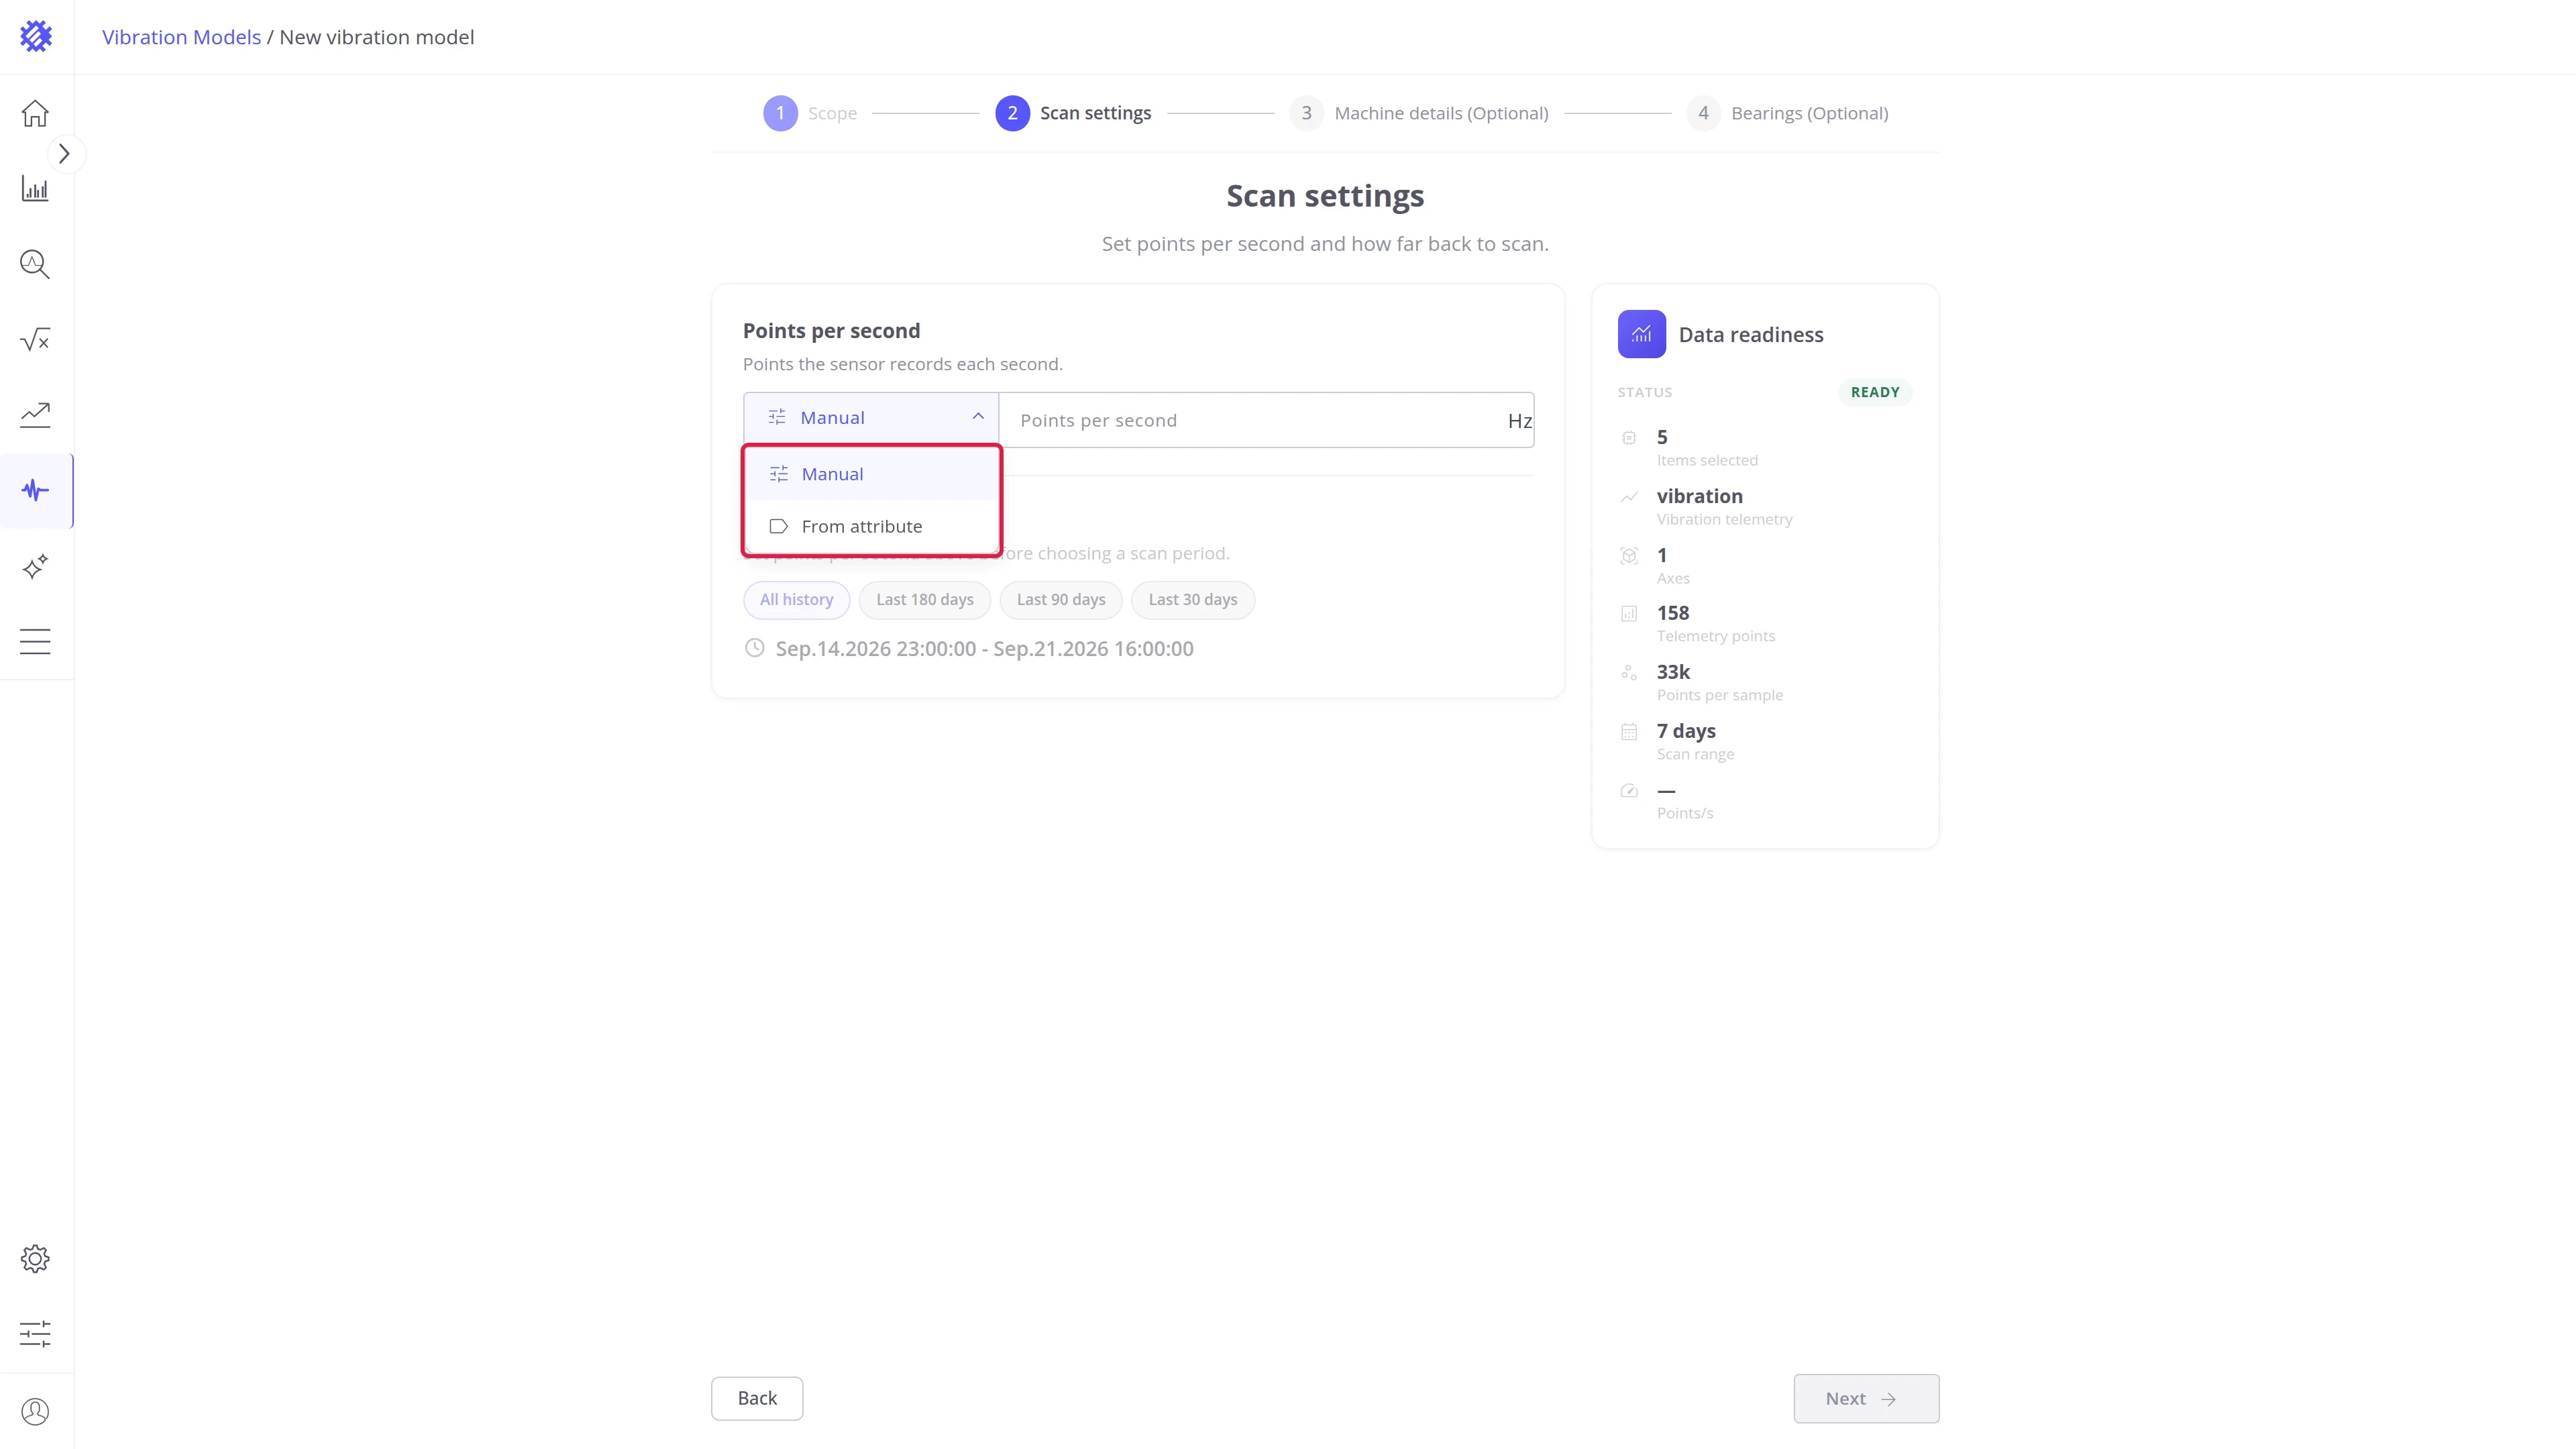
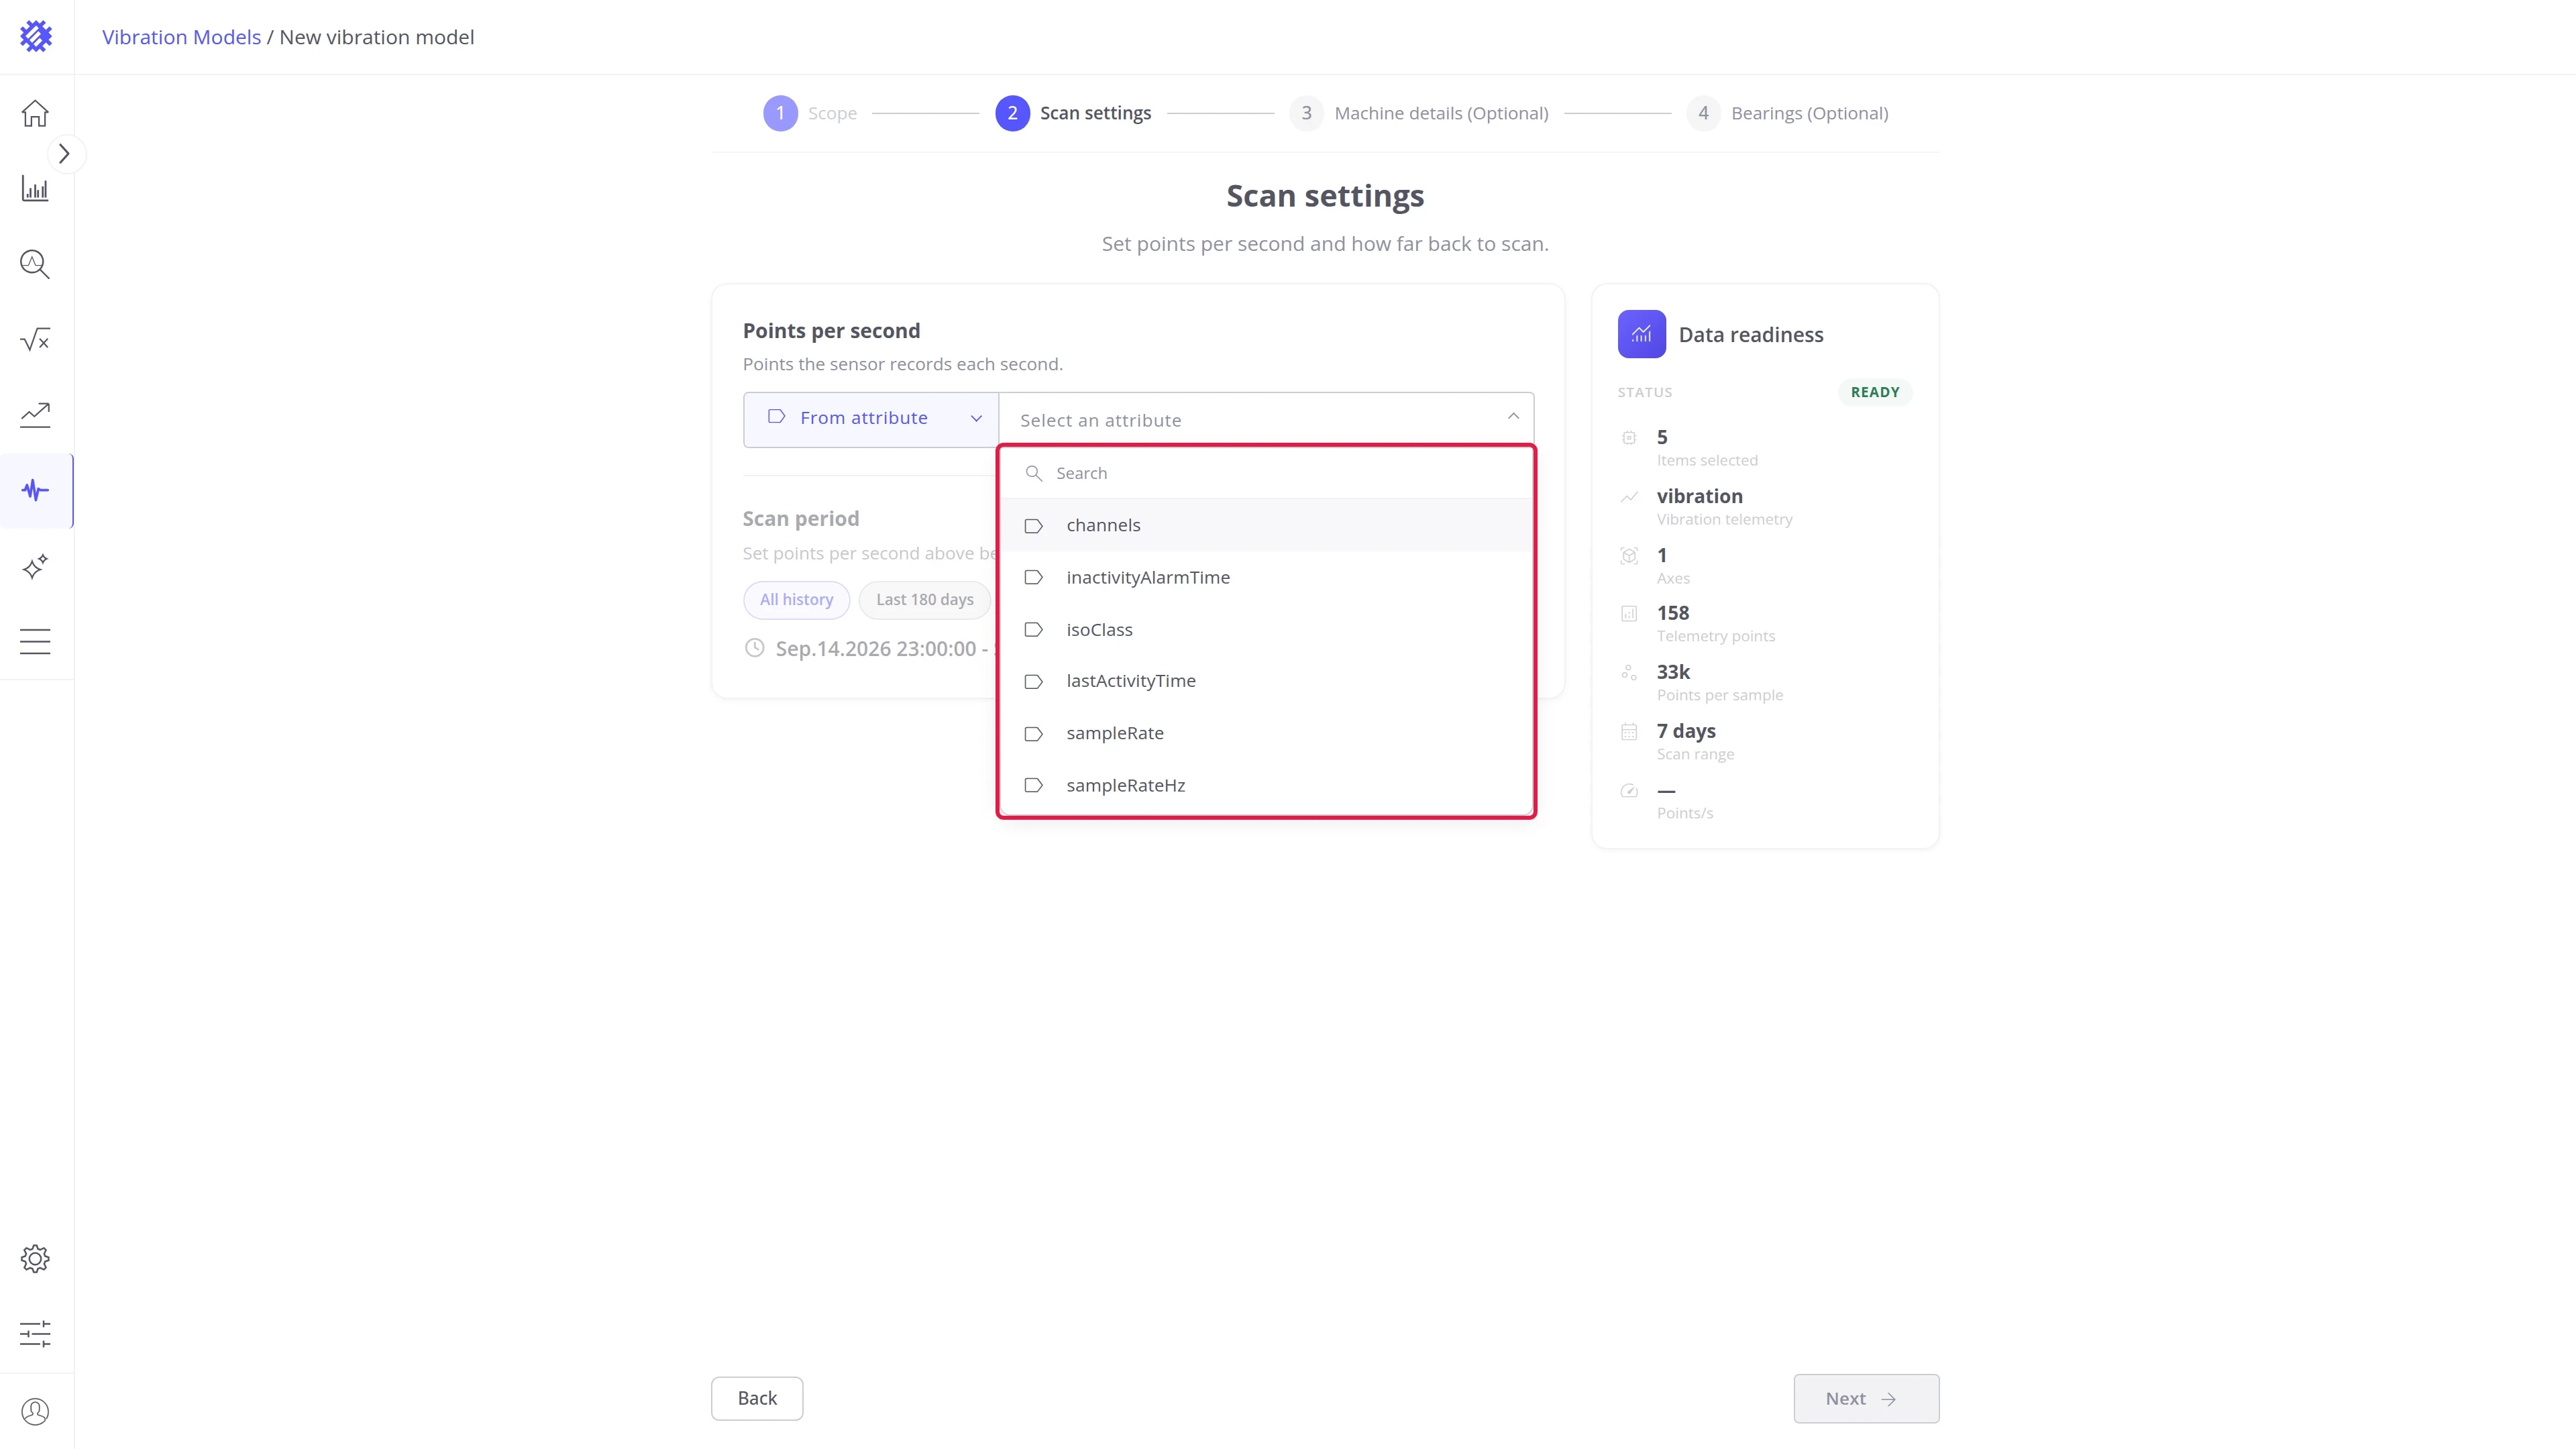
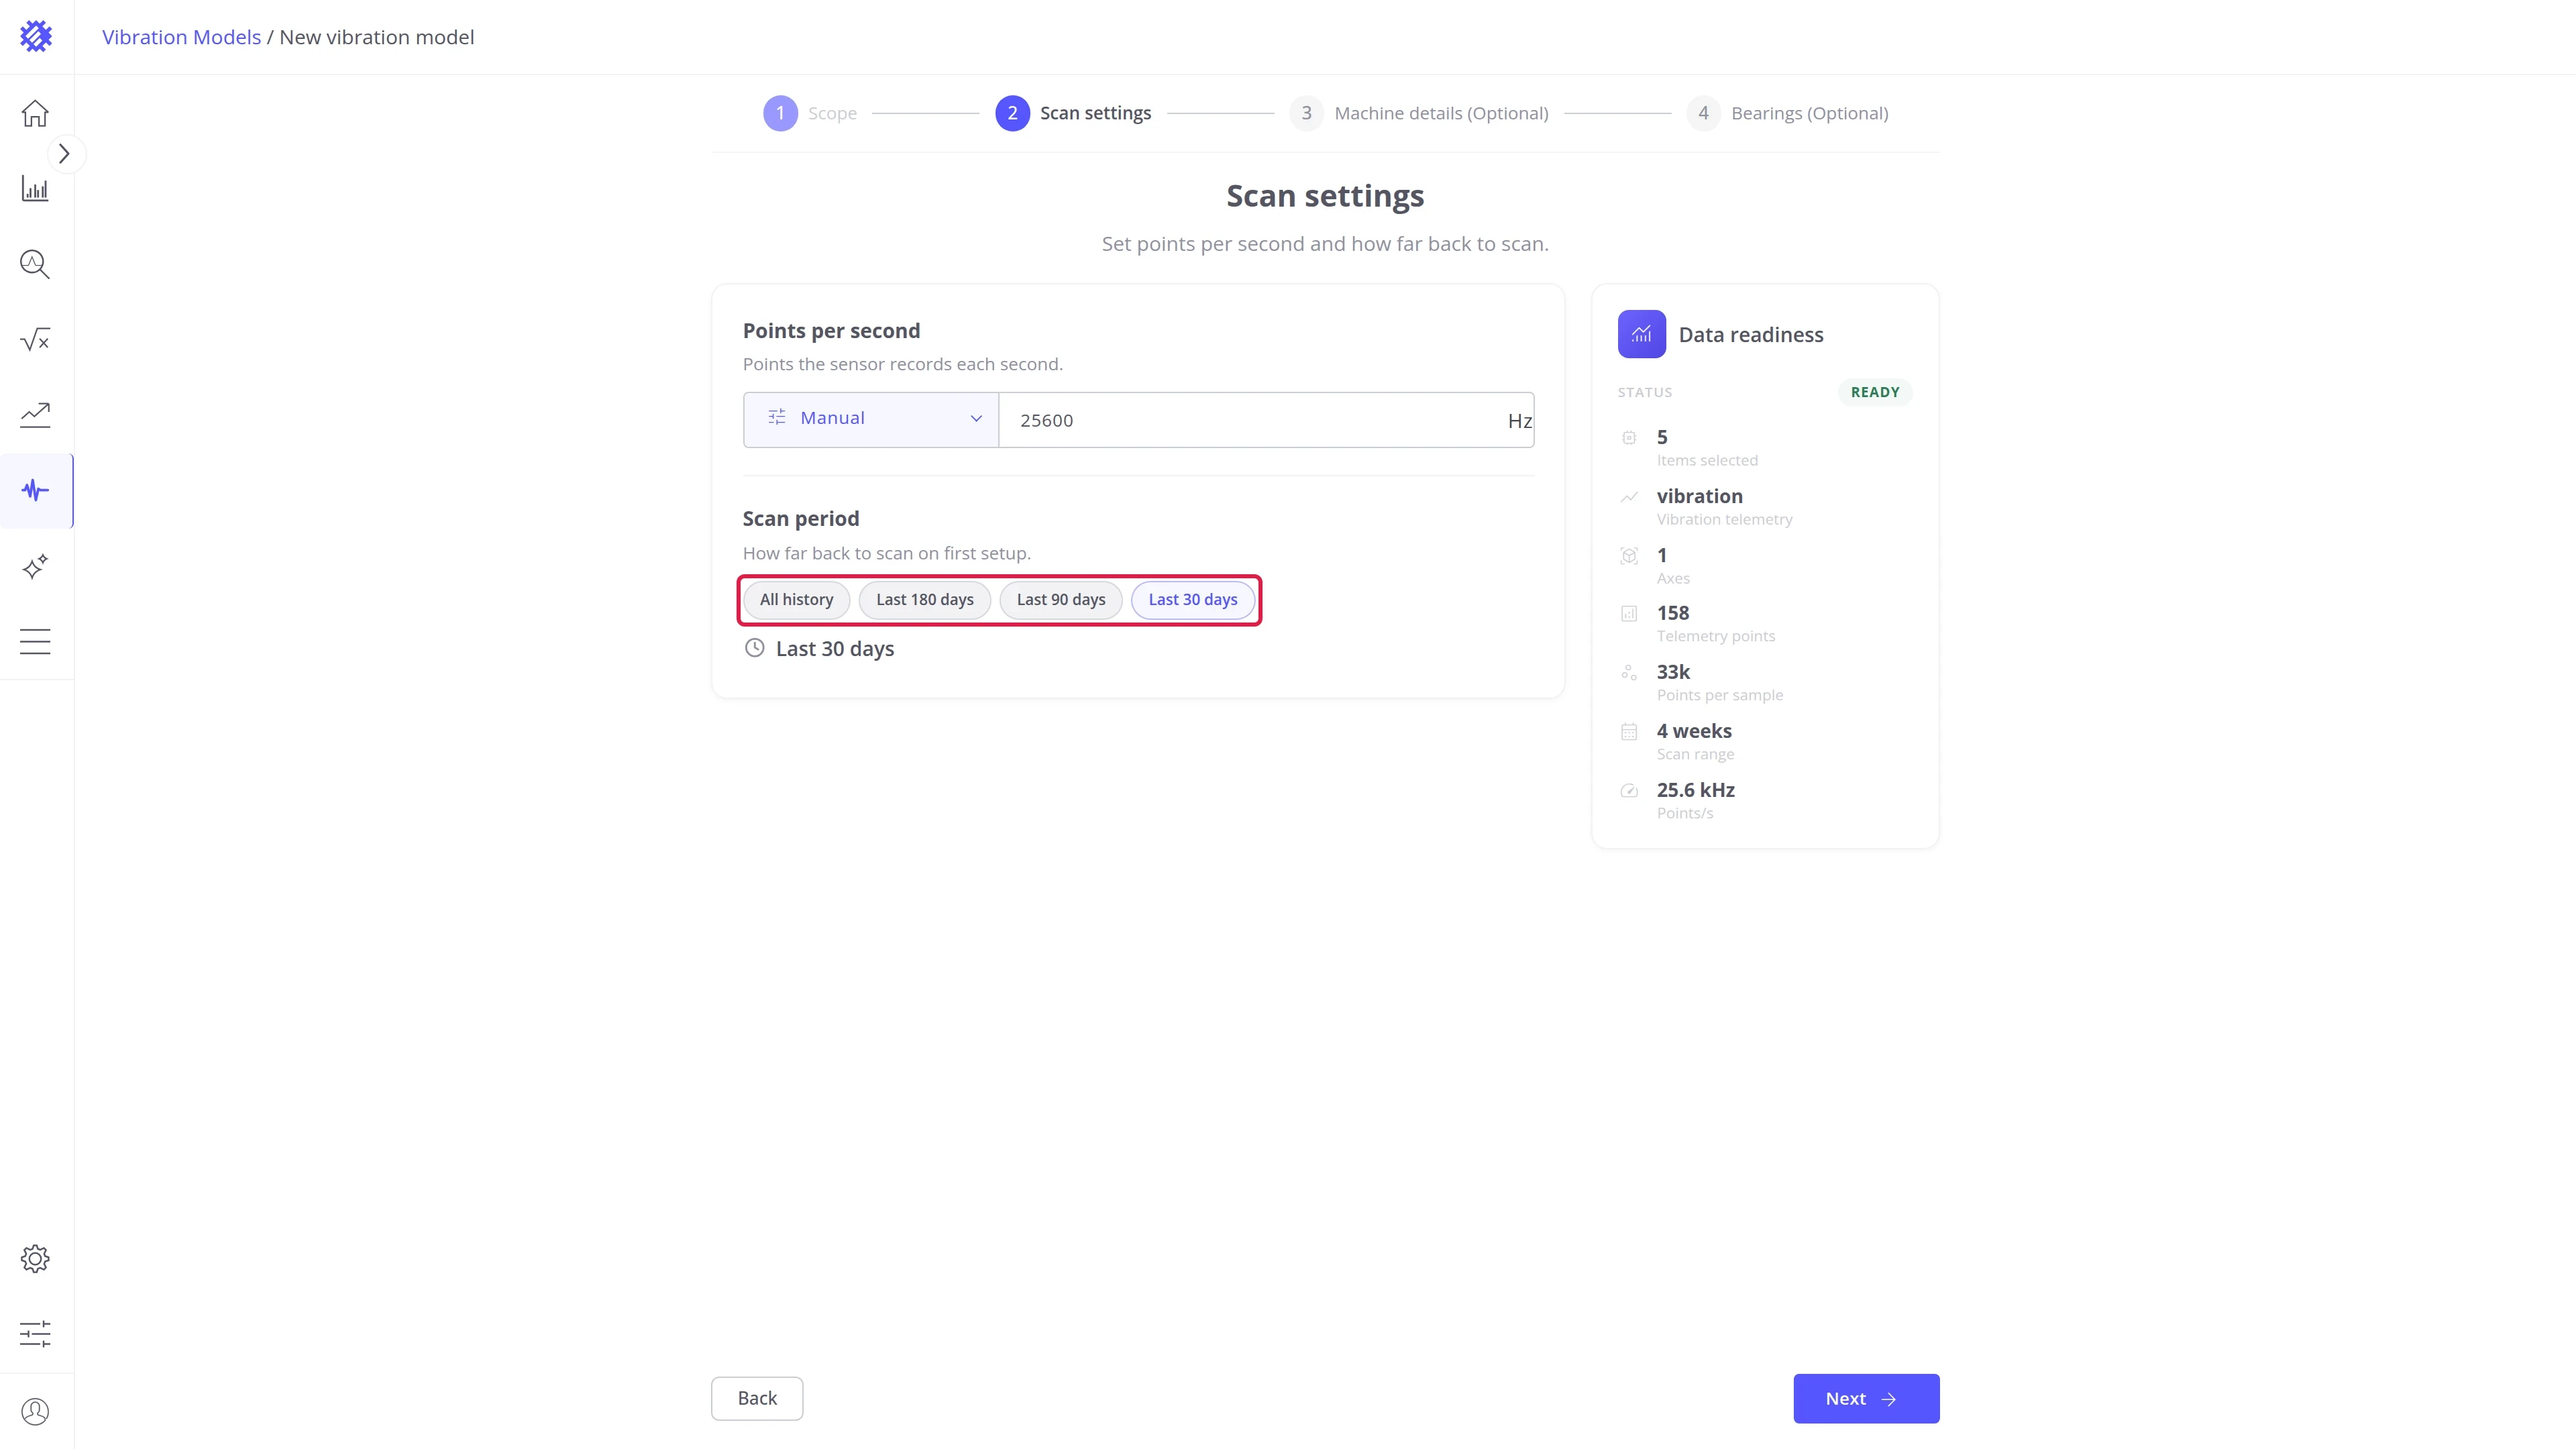
Points per second is the sample rate: how many readings the sensor records each second. Type it in, for example 25600. If it differs between machines, switch Manual to From attribute and pick the attribute that holds it on each machine. Why the sample rate matters is explained in Vibration Analysis Basics.
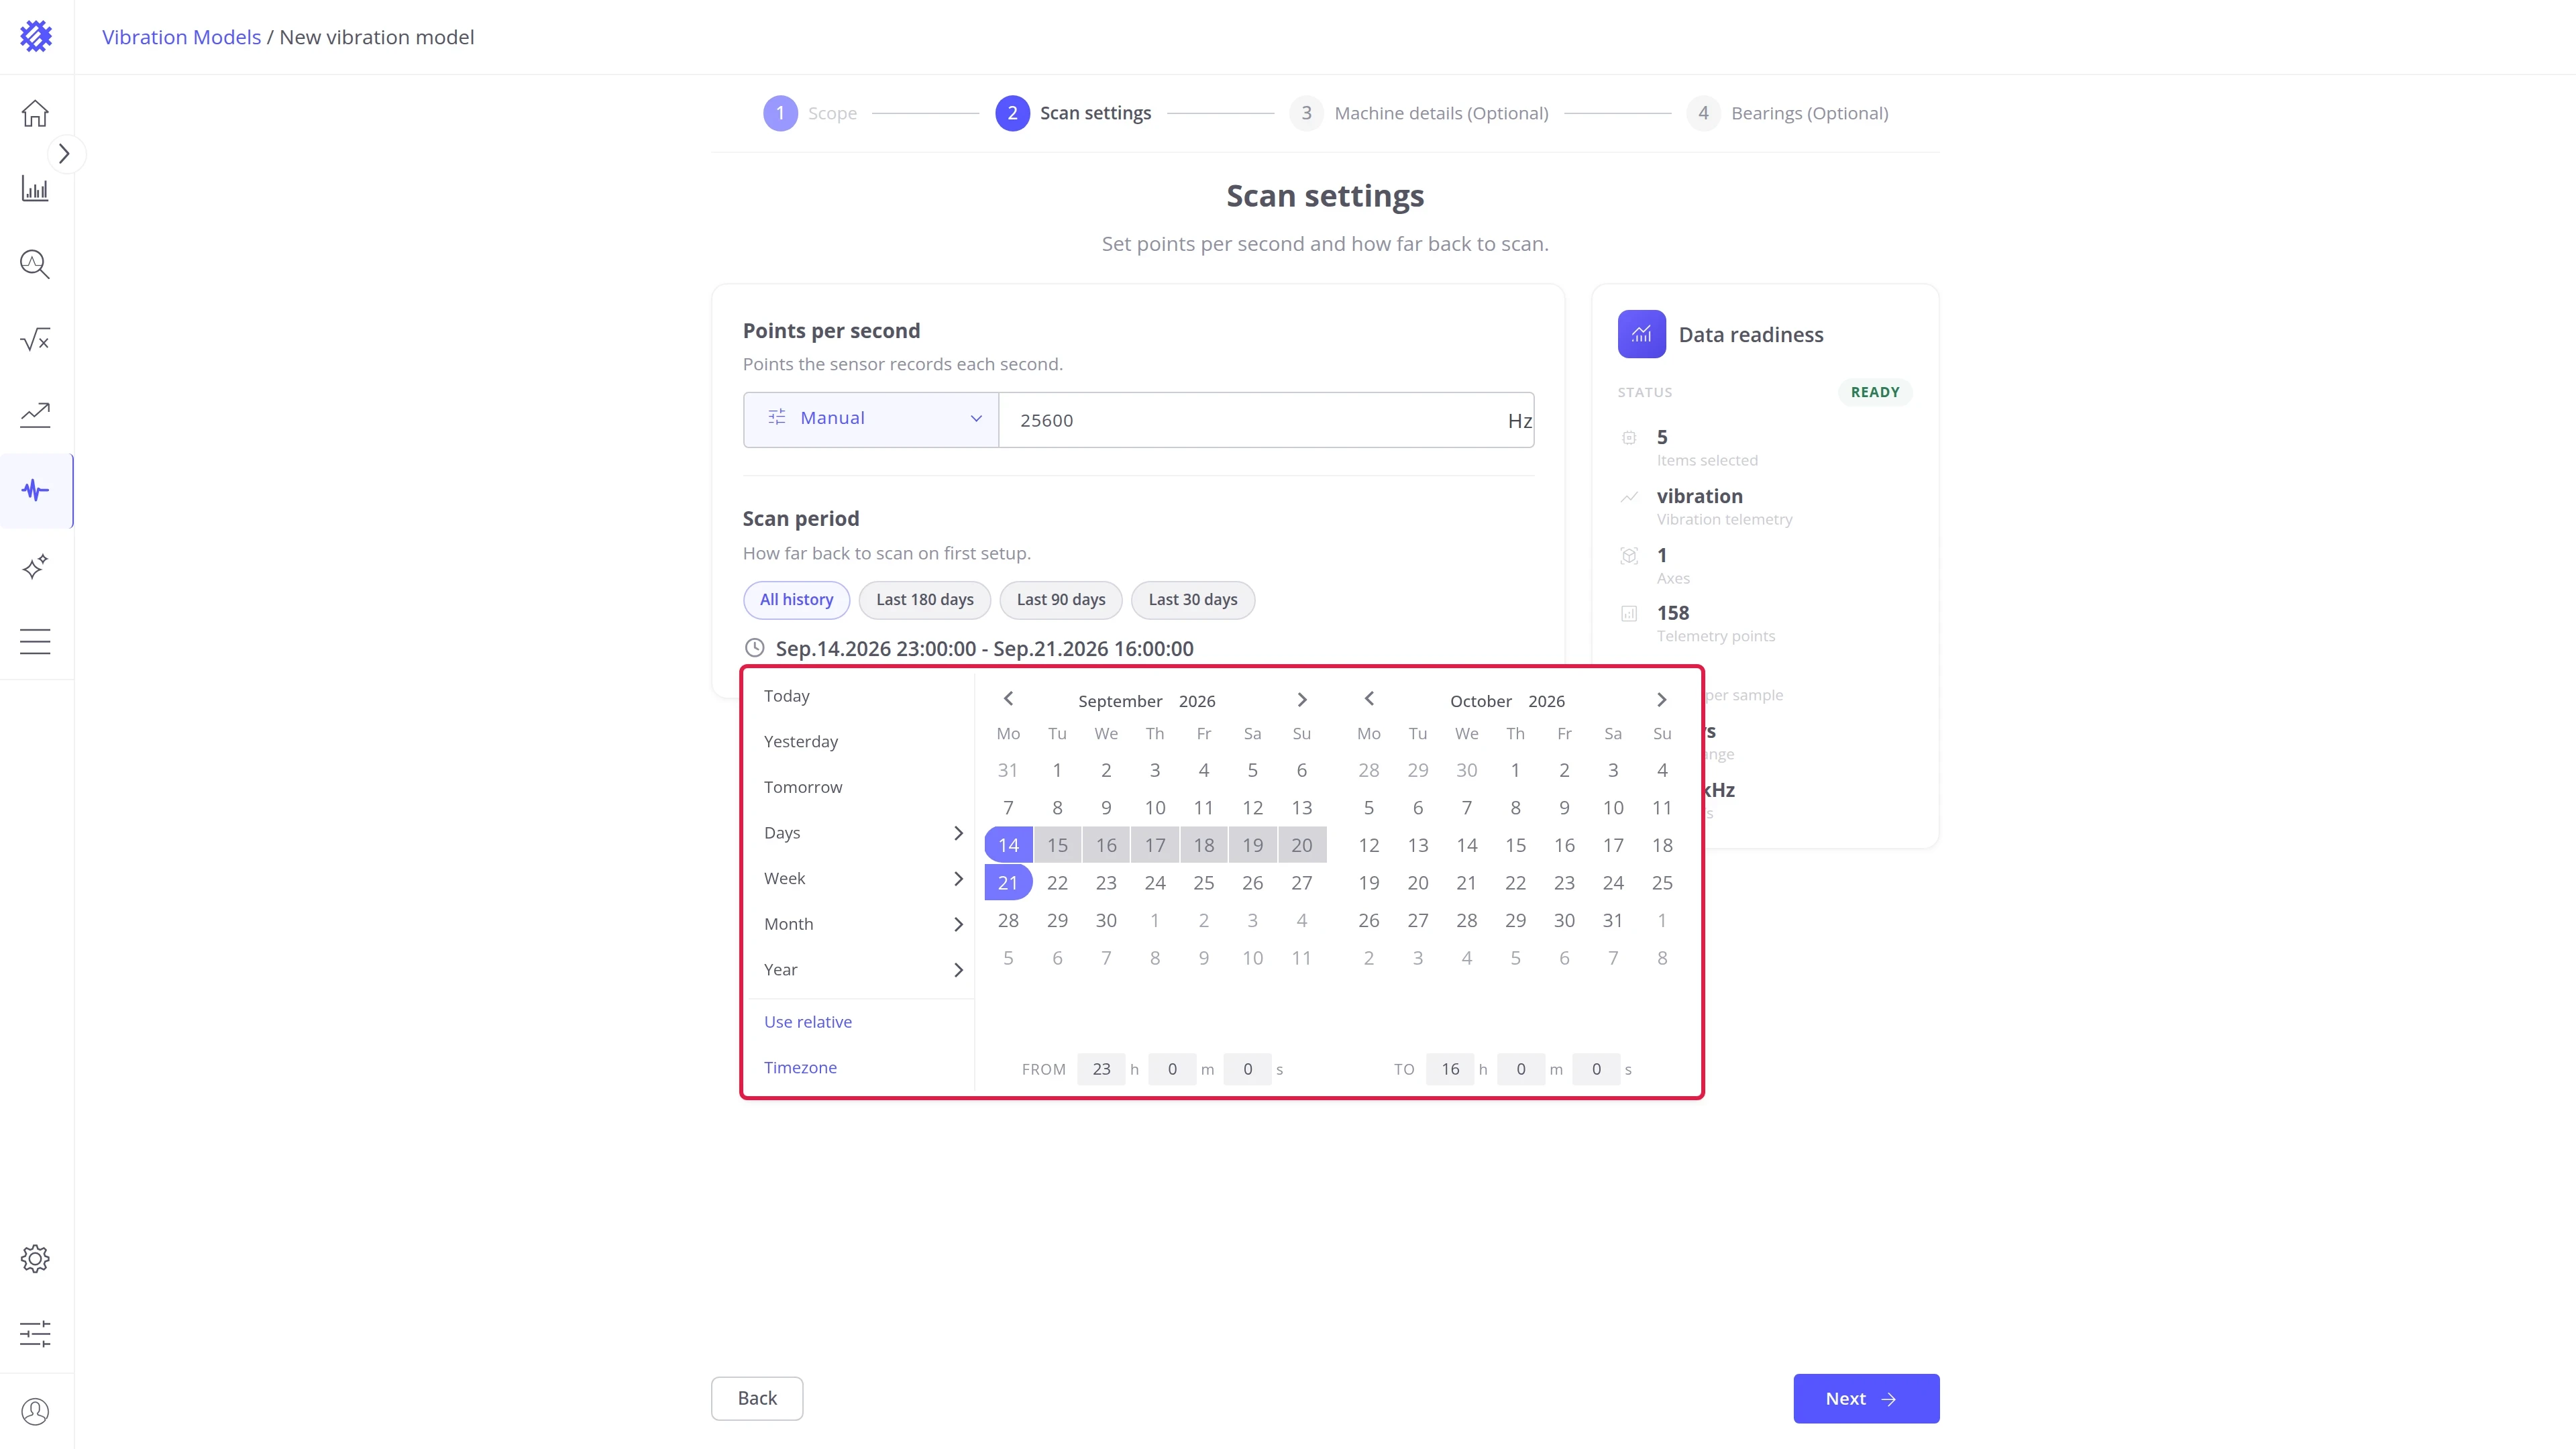
Scan period is how far back the first scan reads: All history, Last 180 days, Last 90 days, or Last 30 days. To pick your own range, click the dates below the buttons.
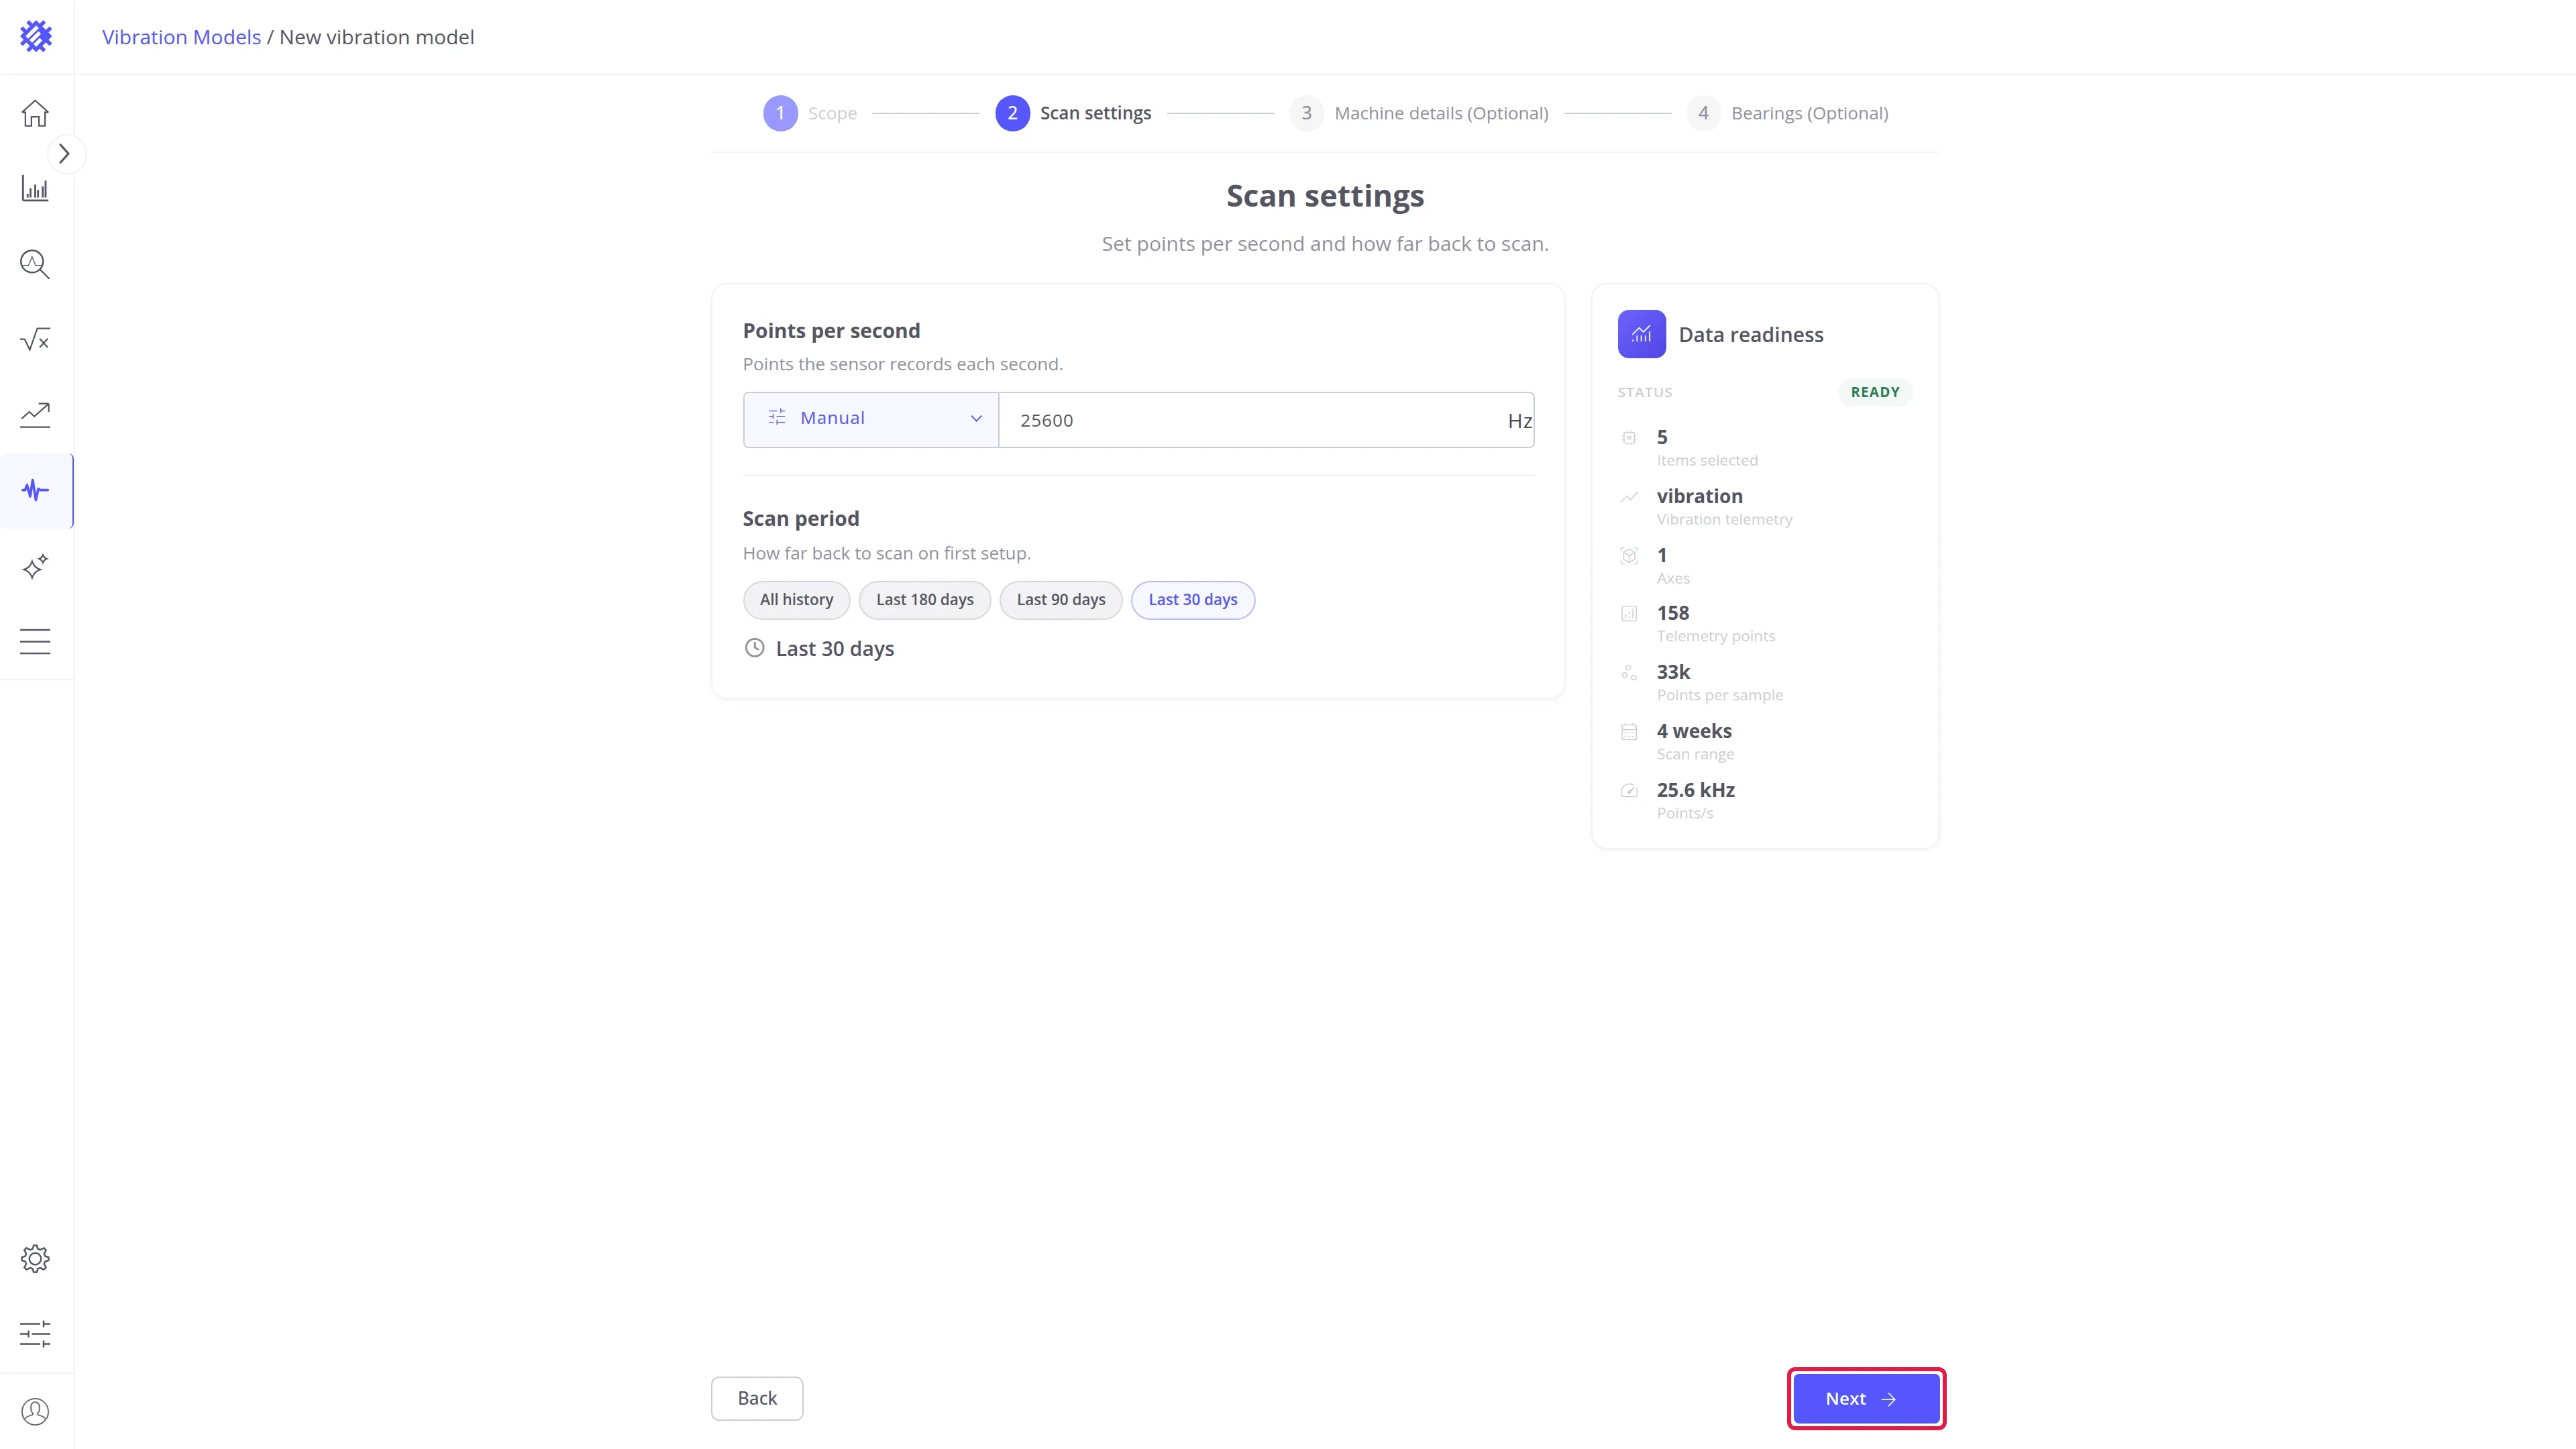
Click Next.
Step 5. Add machine details (optional)
Section titled “Step 5. Add machine details (optional)”Machine details turn readings into verdicts.
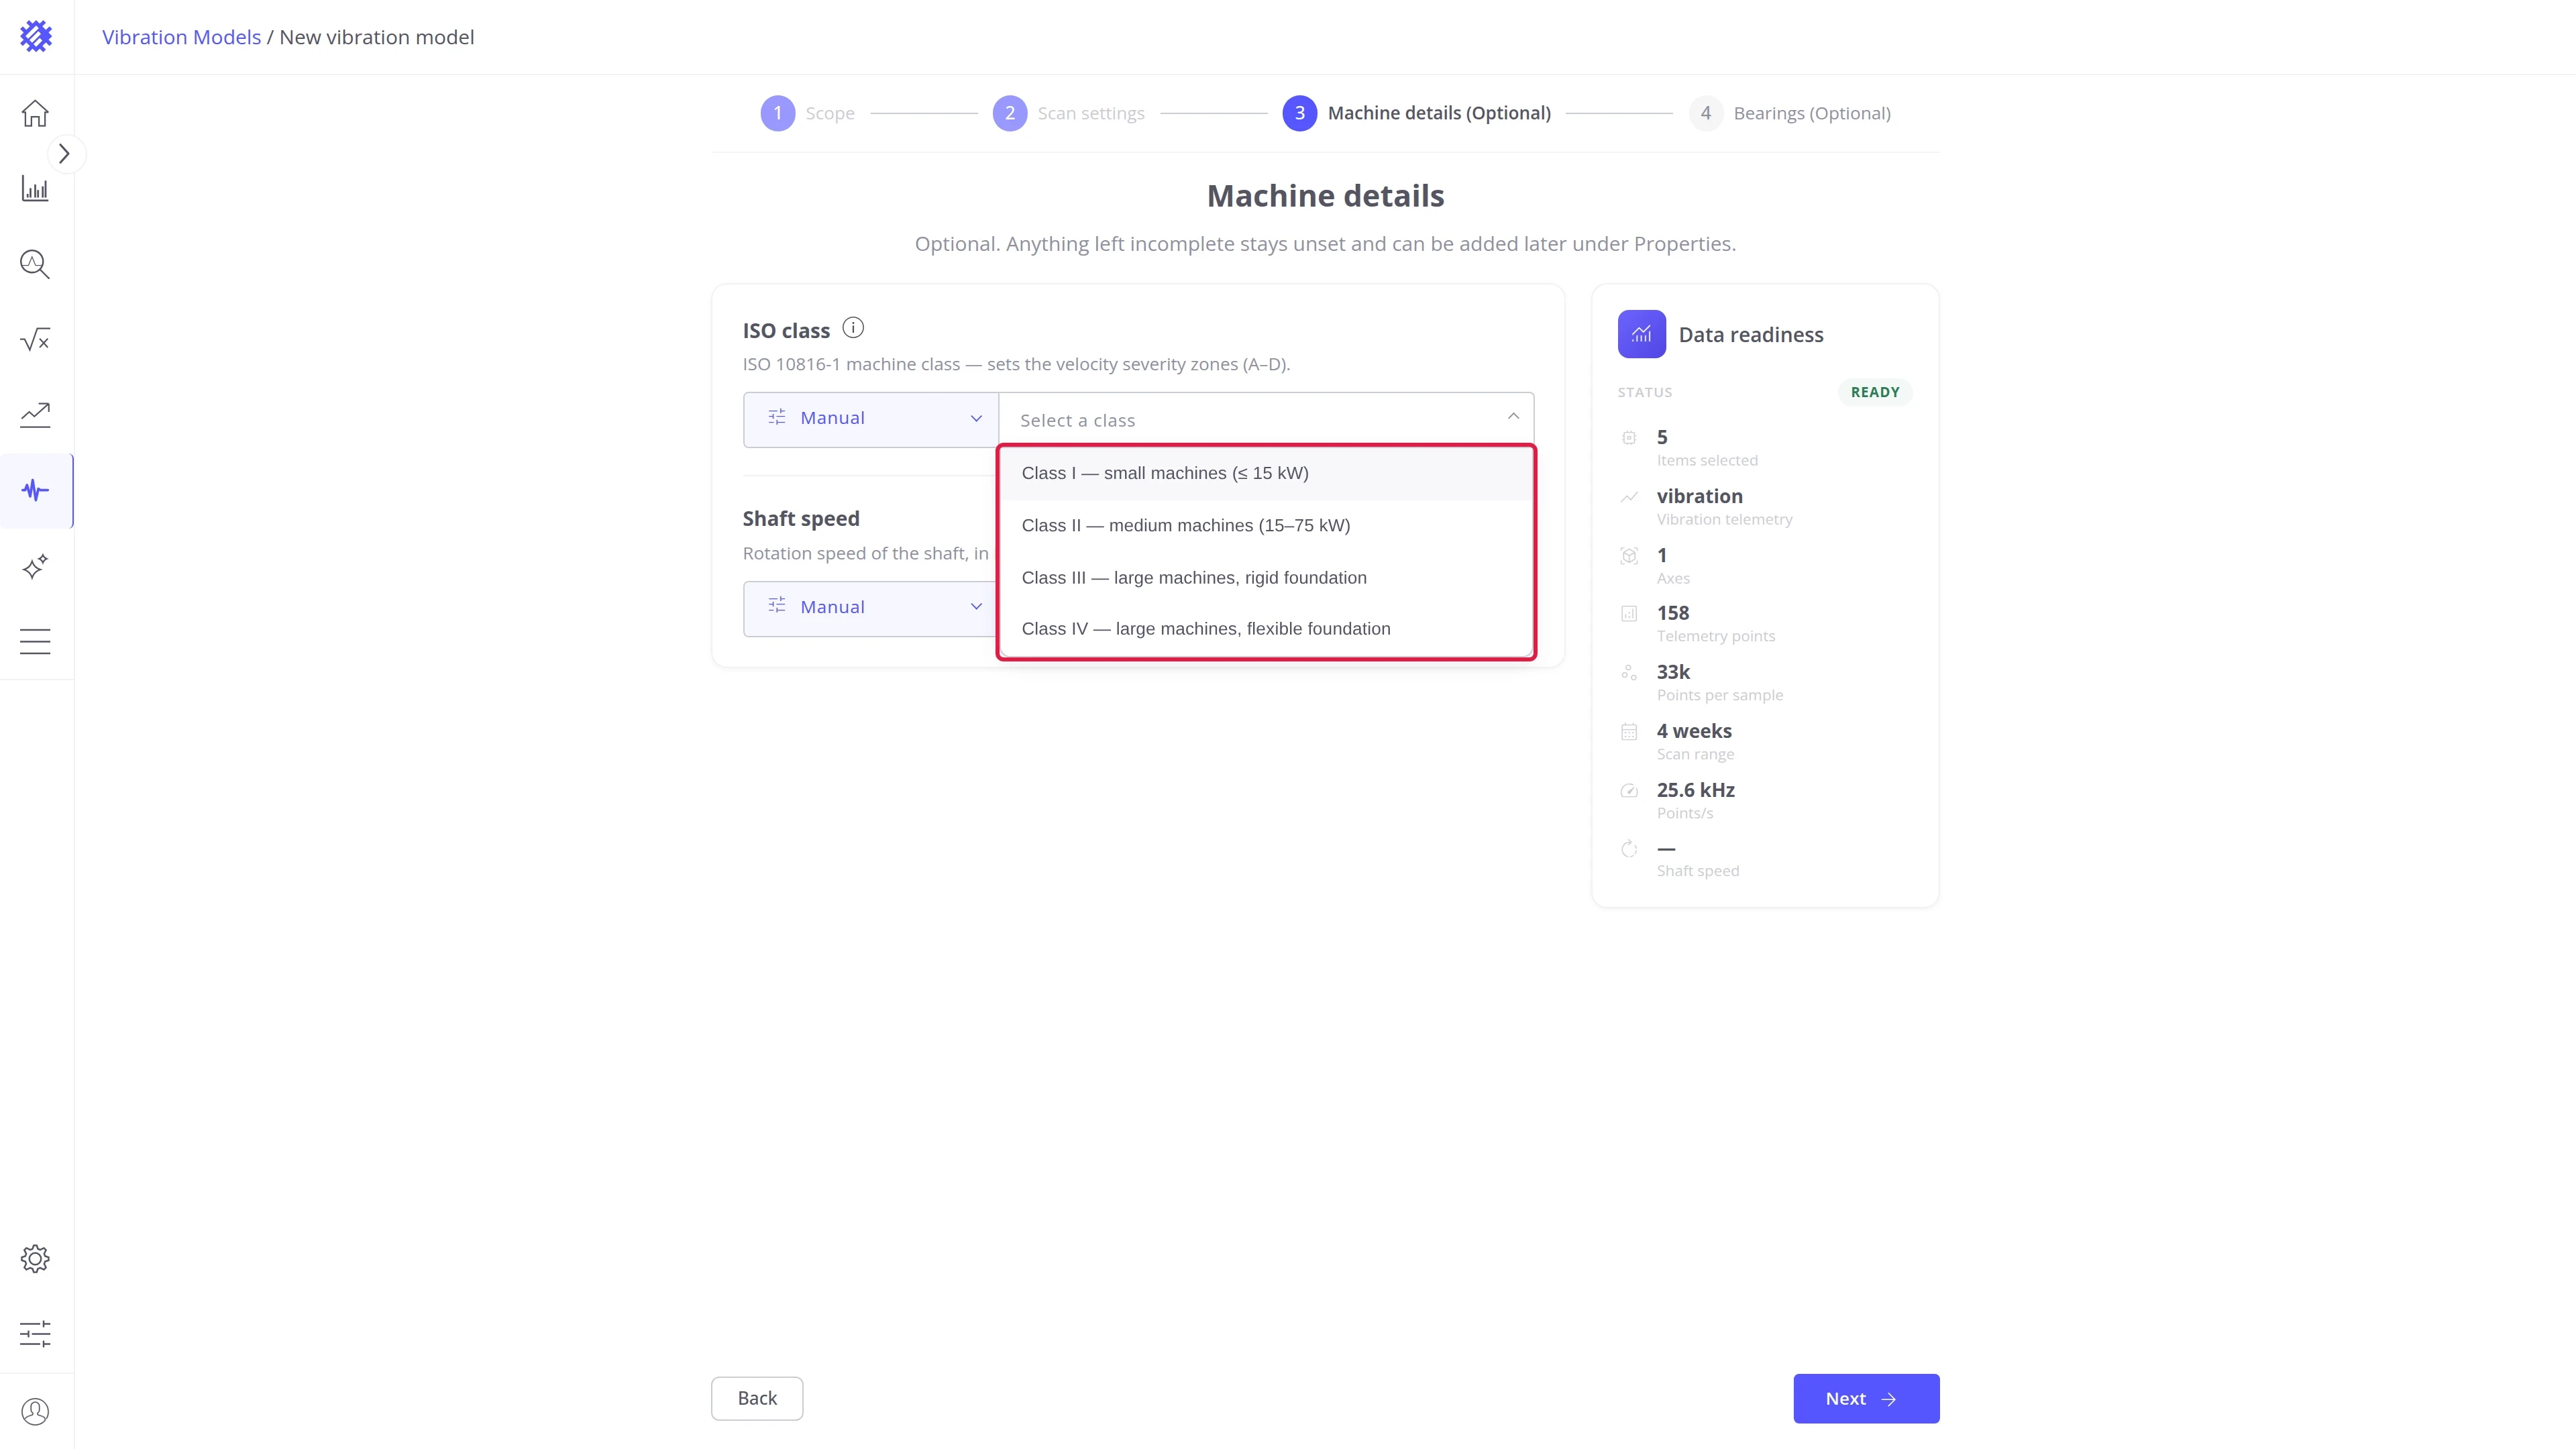
ISO class grades velocity RMS into the ISO zones A to D. Manual applies one class to every machine, From attribute reads it per machine. The zones and classes are described in Vibration Analysis Basics.
Shaft speed is the rotation speed in RPM, entered by hand or read from an attribute or a telemetry key. Without it, Trendz tracks vibration levels but cannot name shaft or bearing faults. Why the speed matters is described in Vibration Analysis Basics.
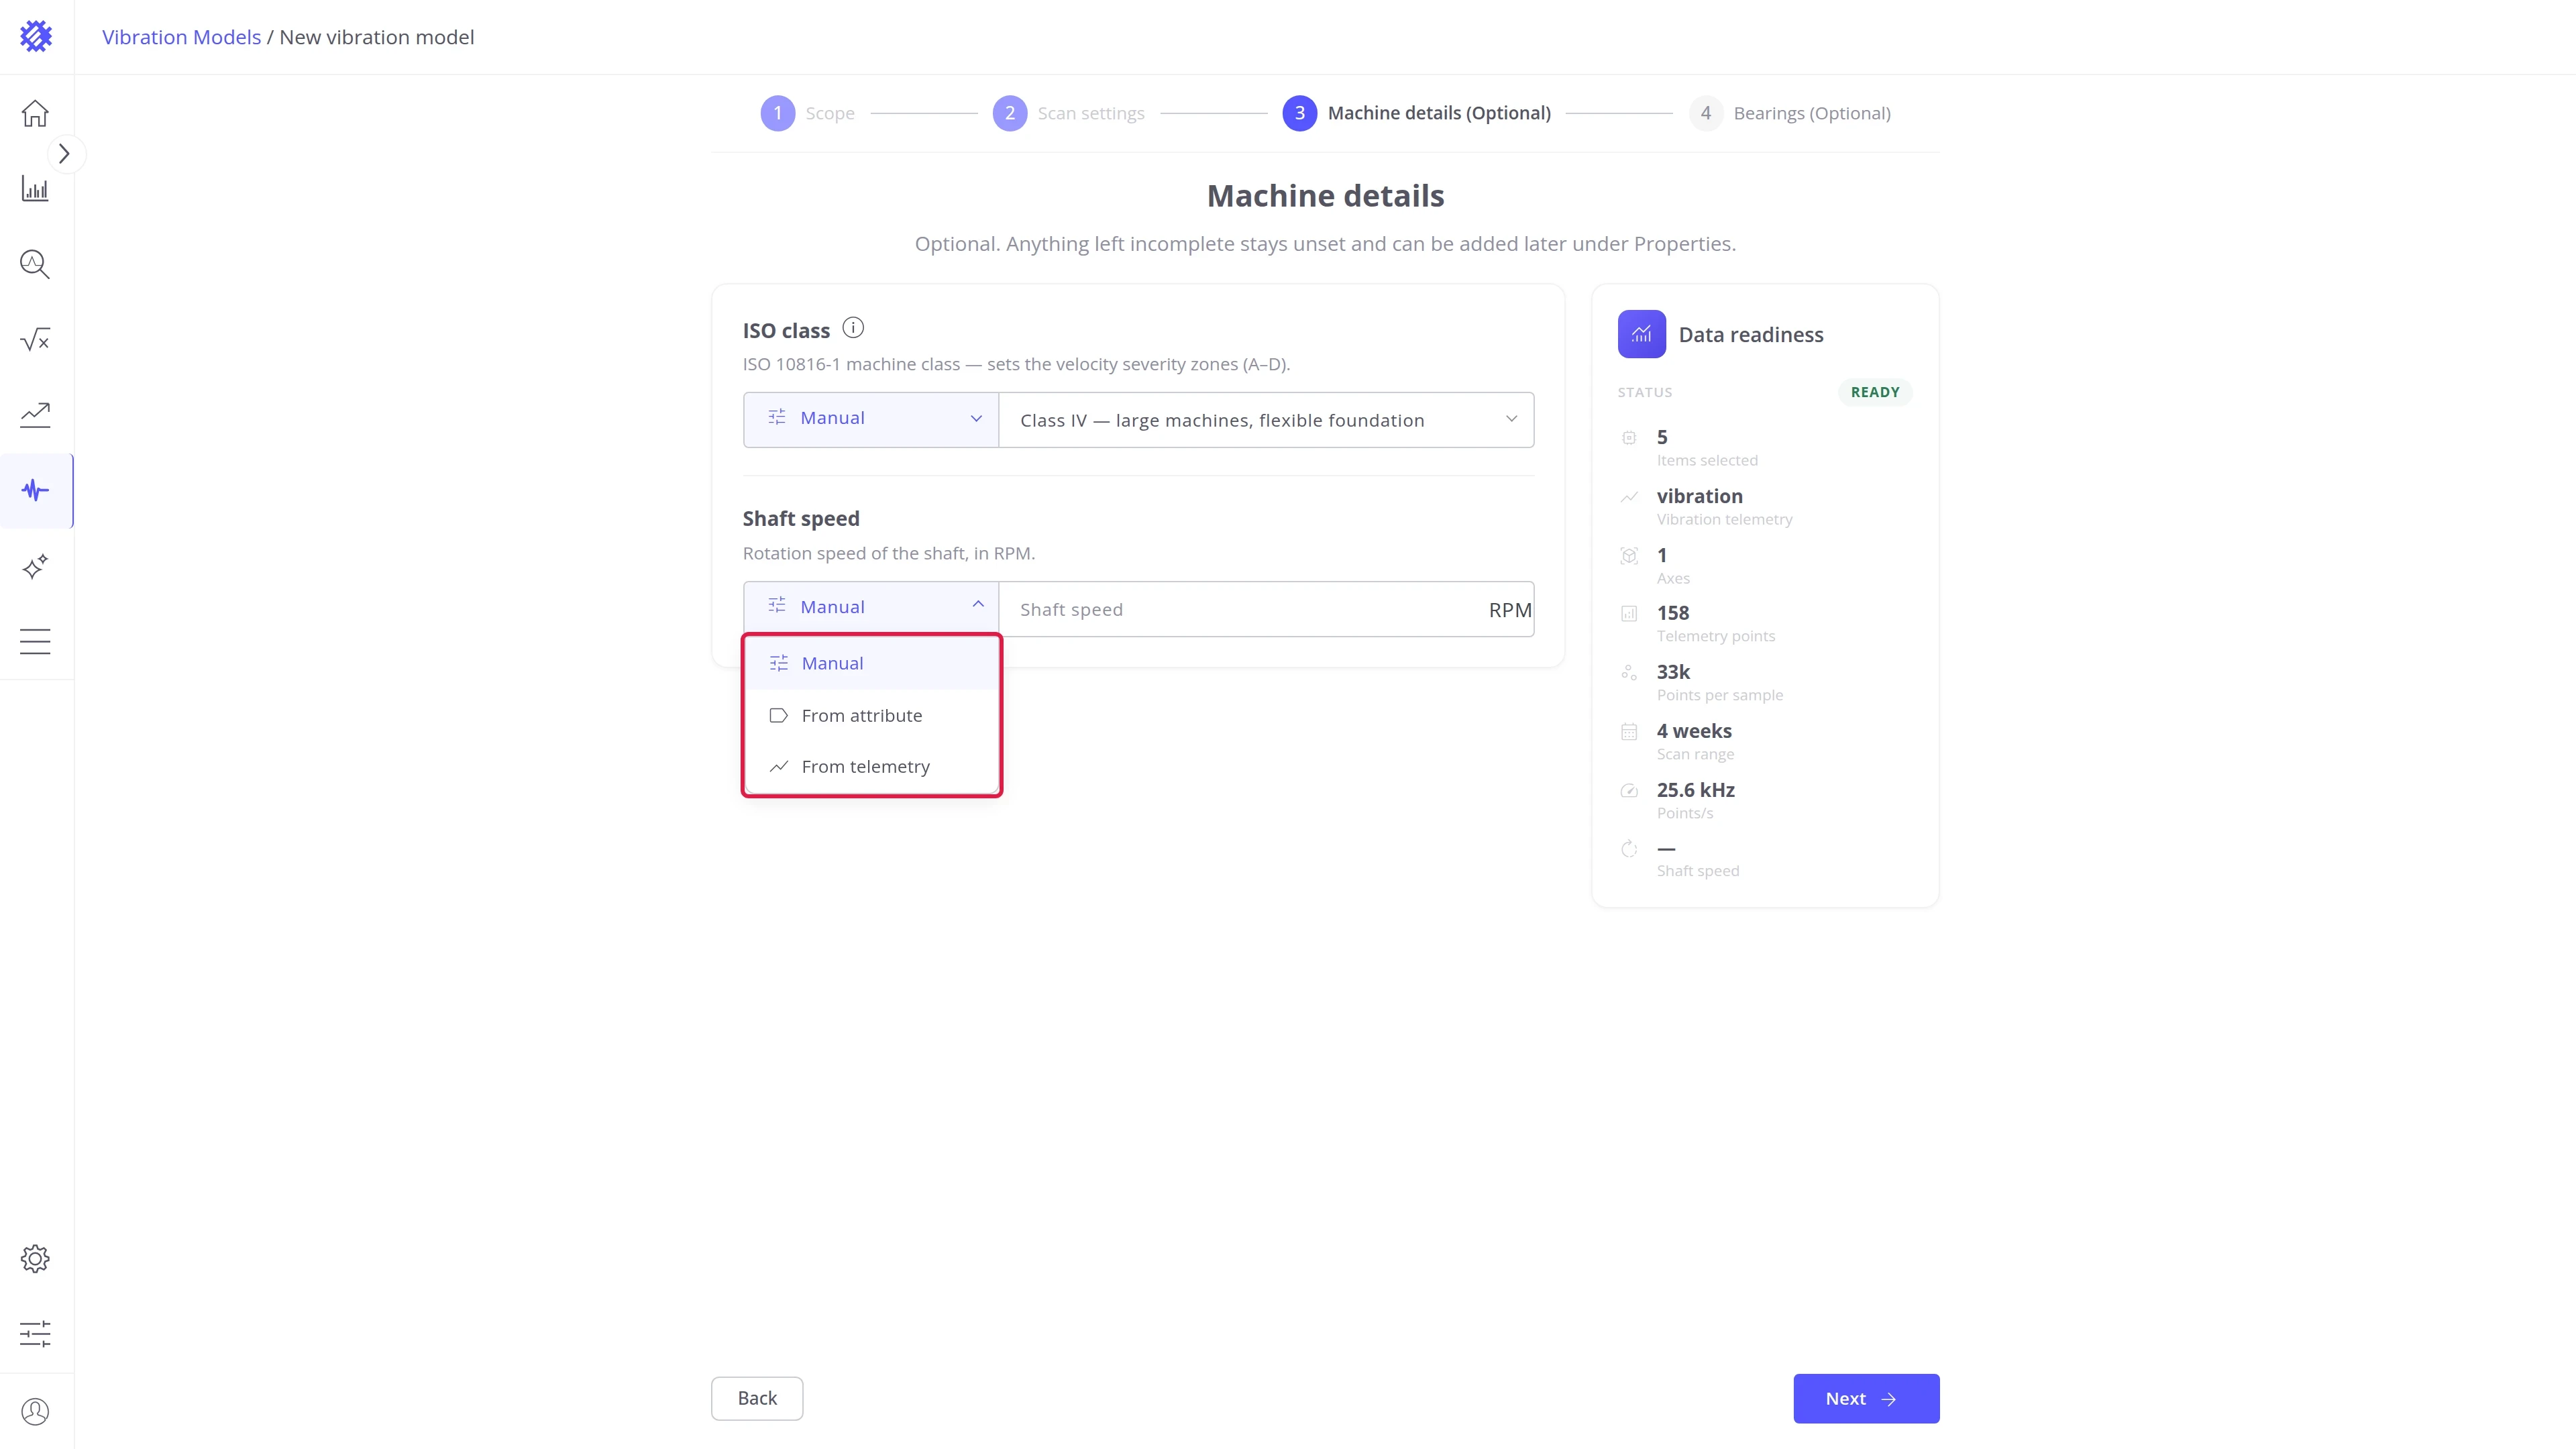
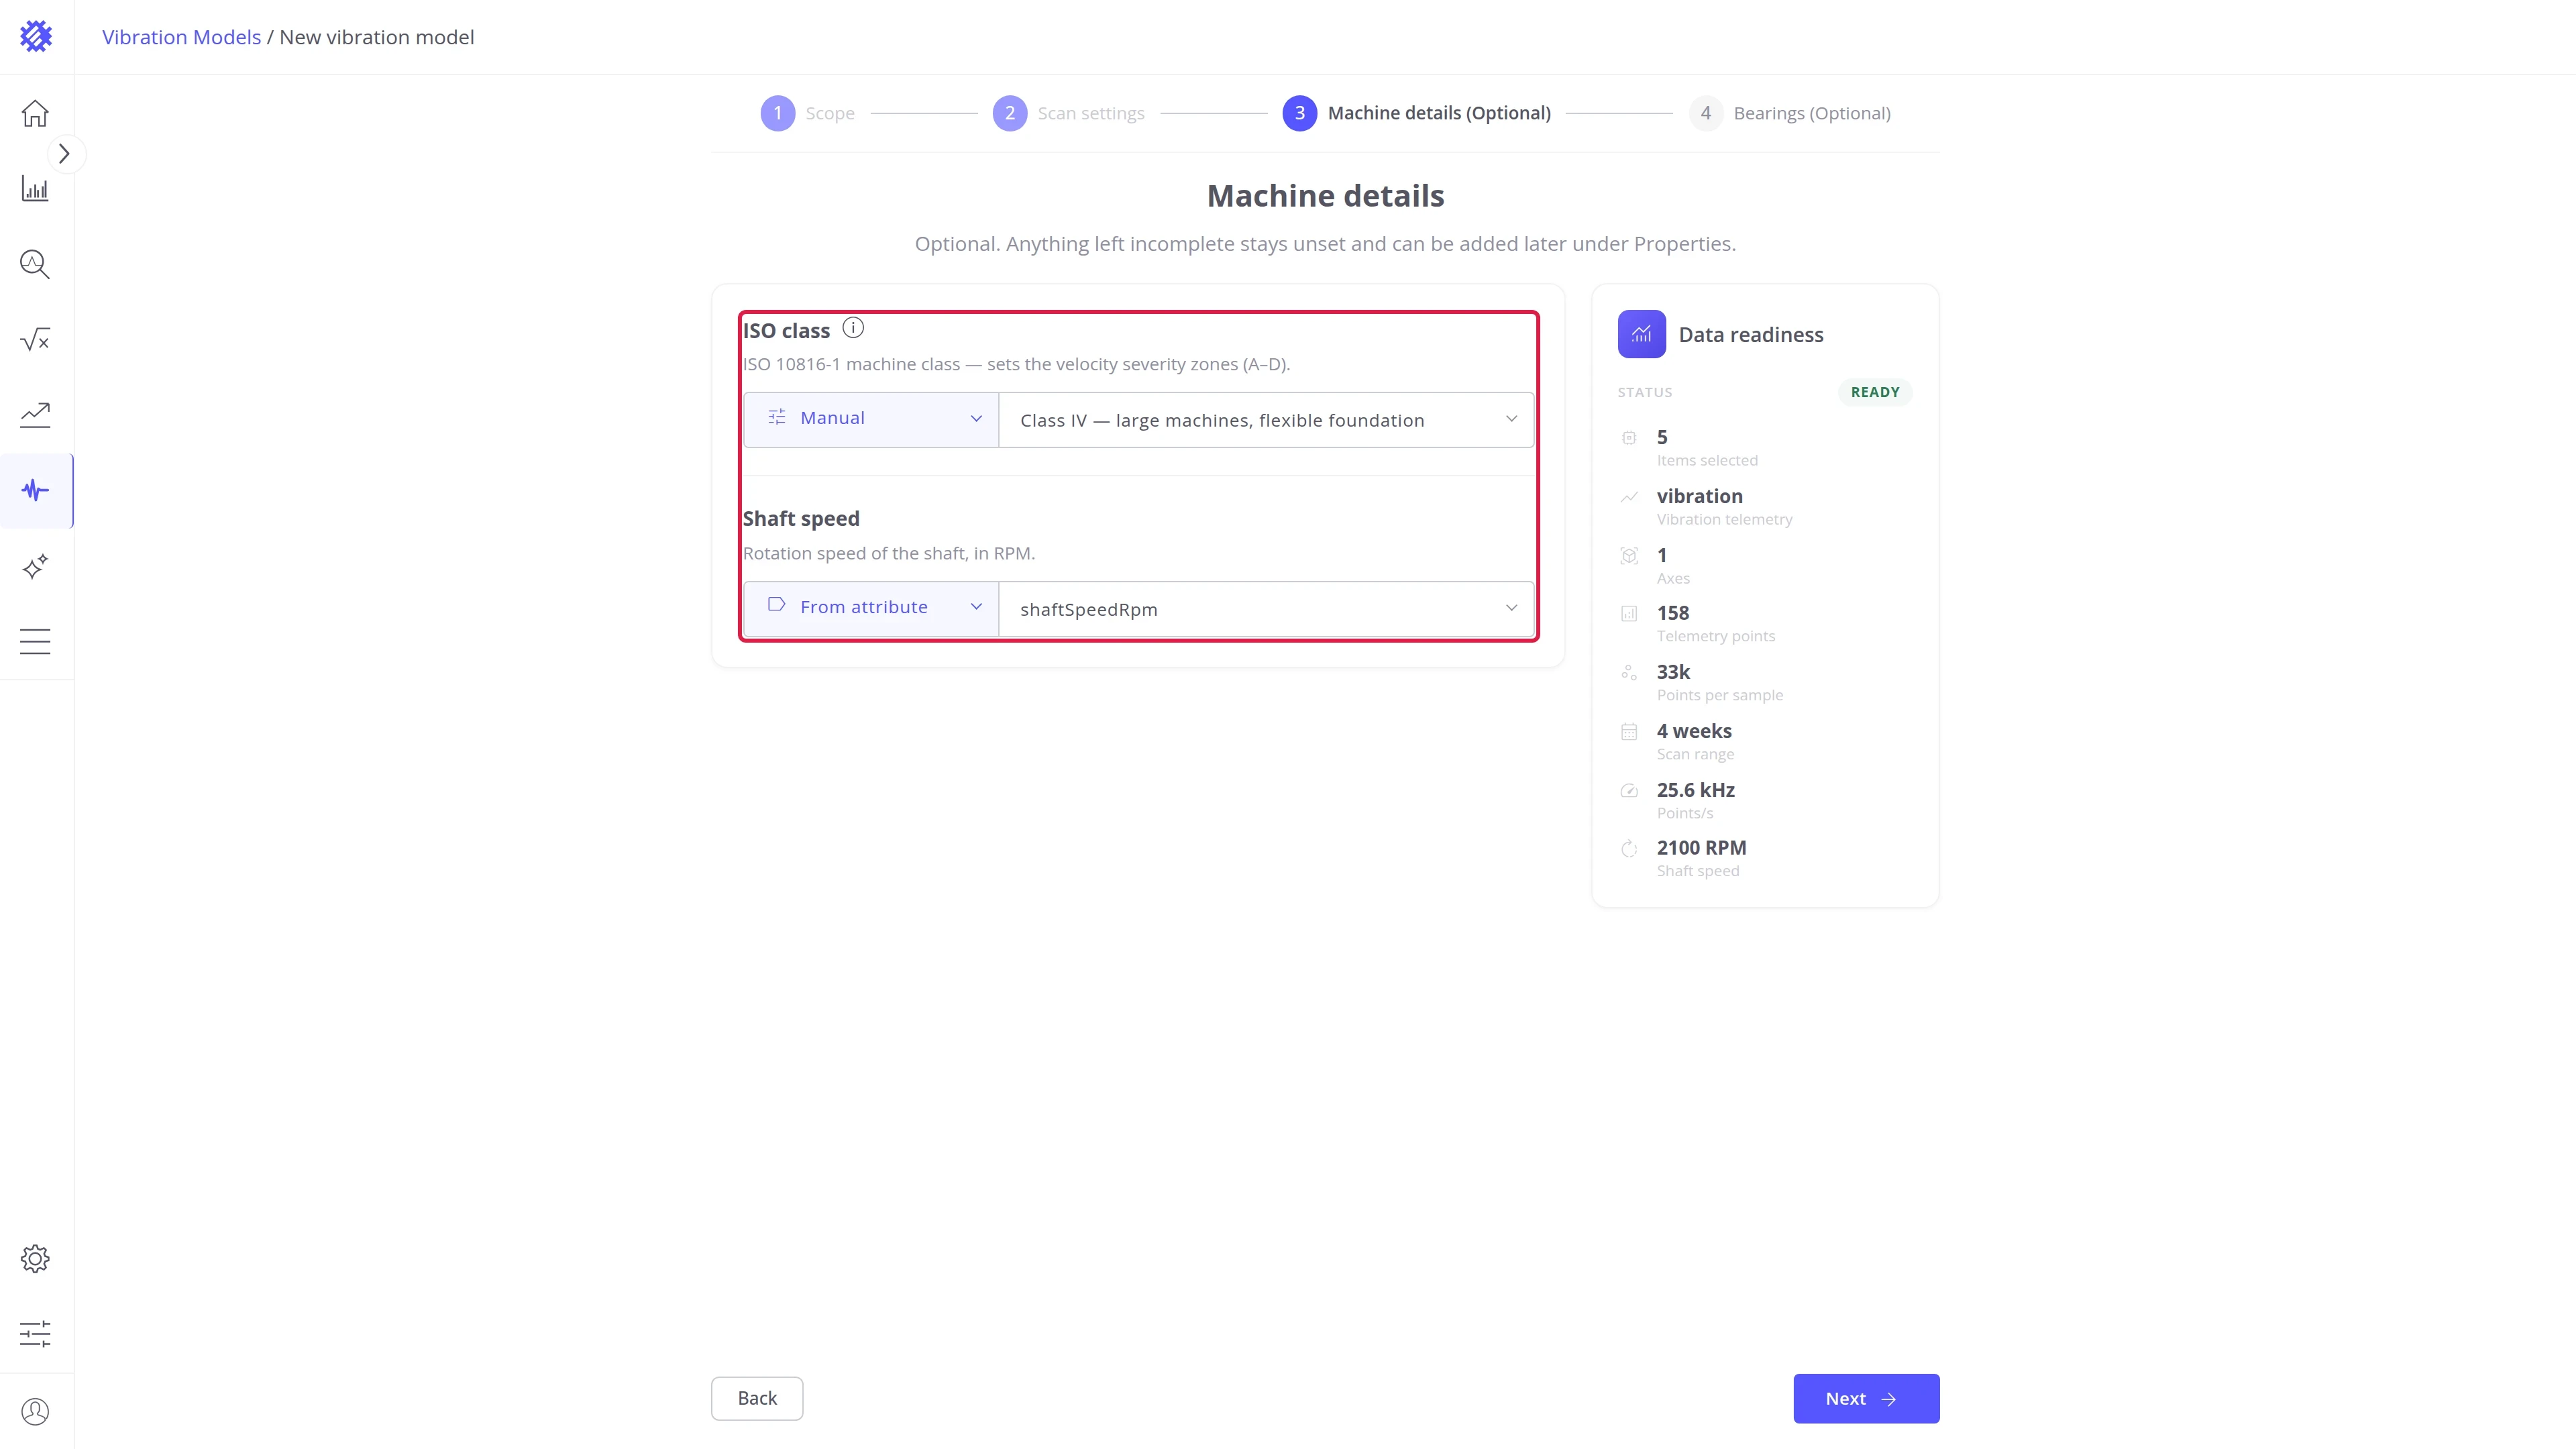
Once the details are set, click Next.
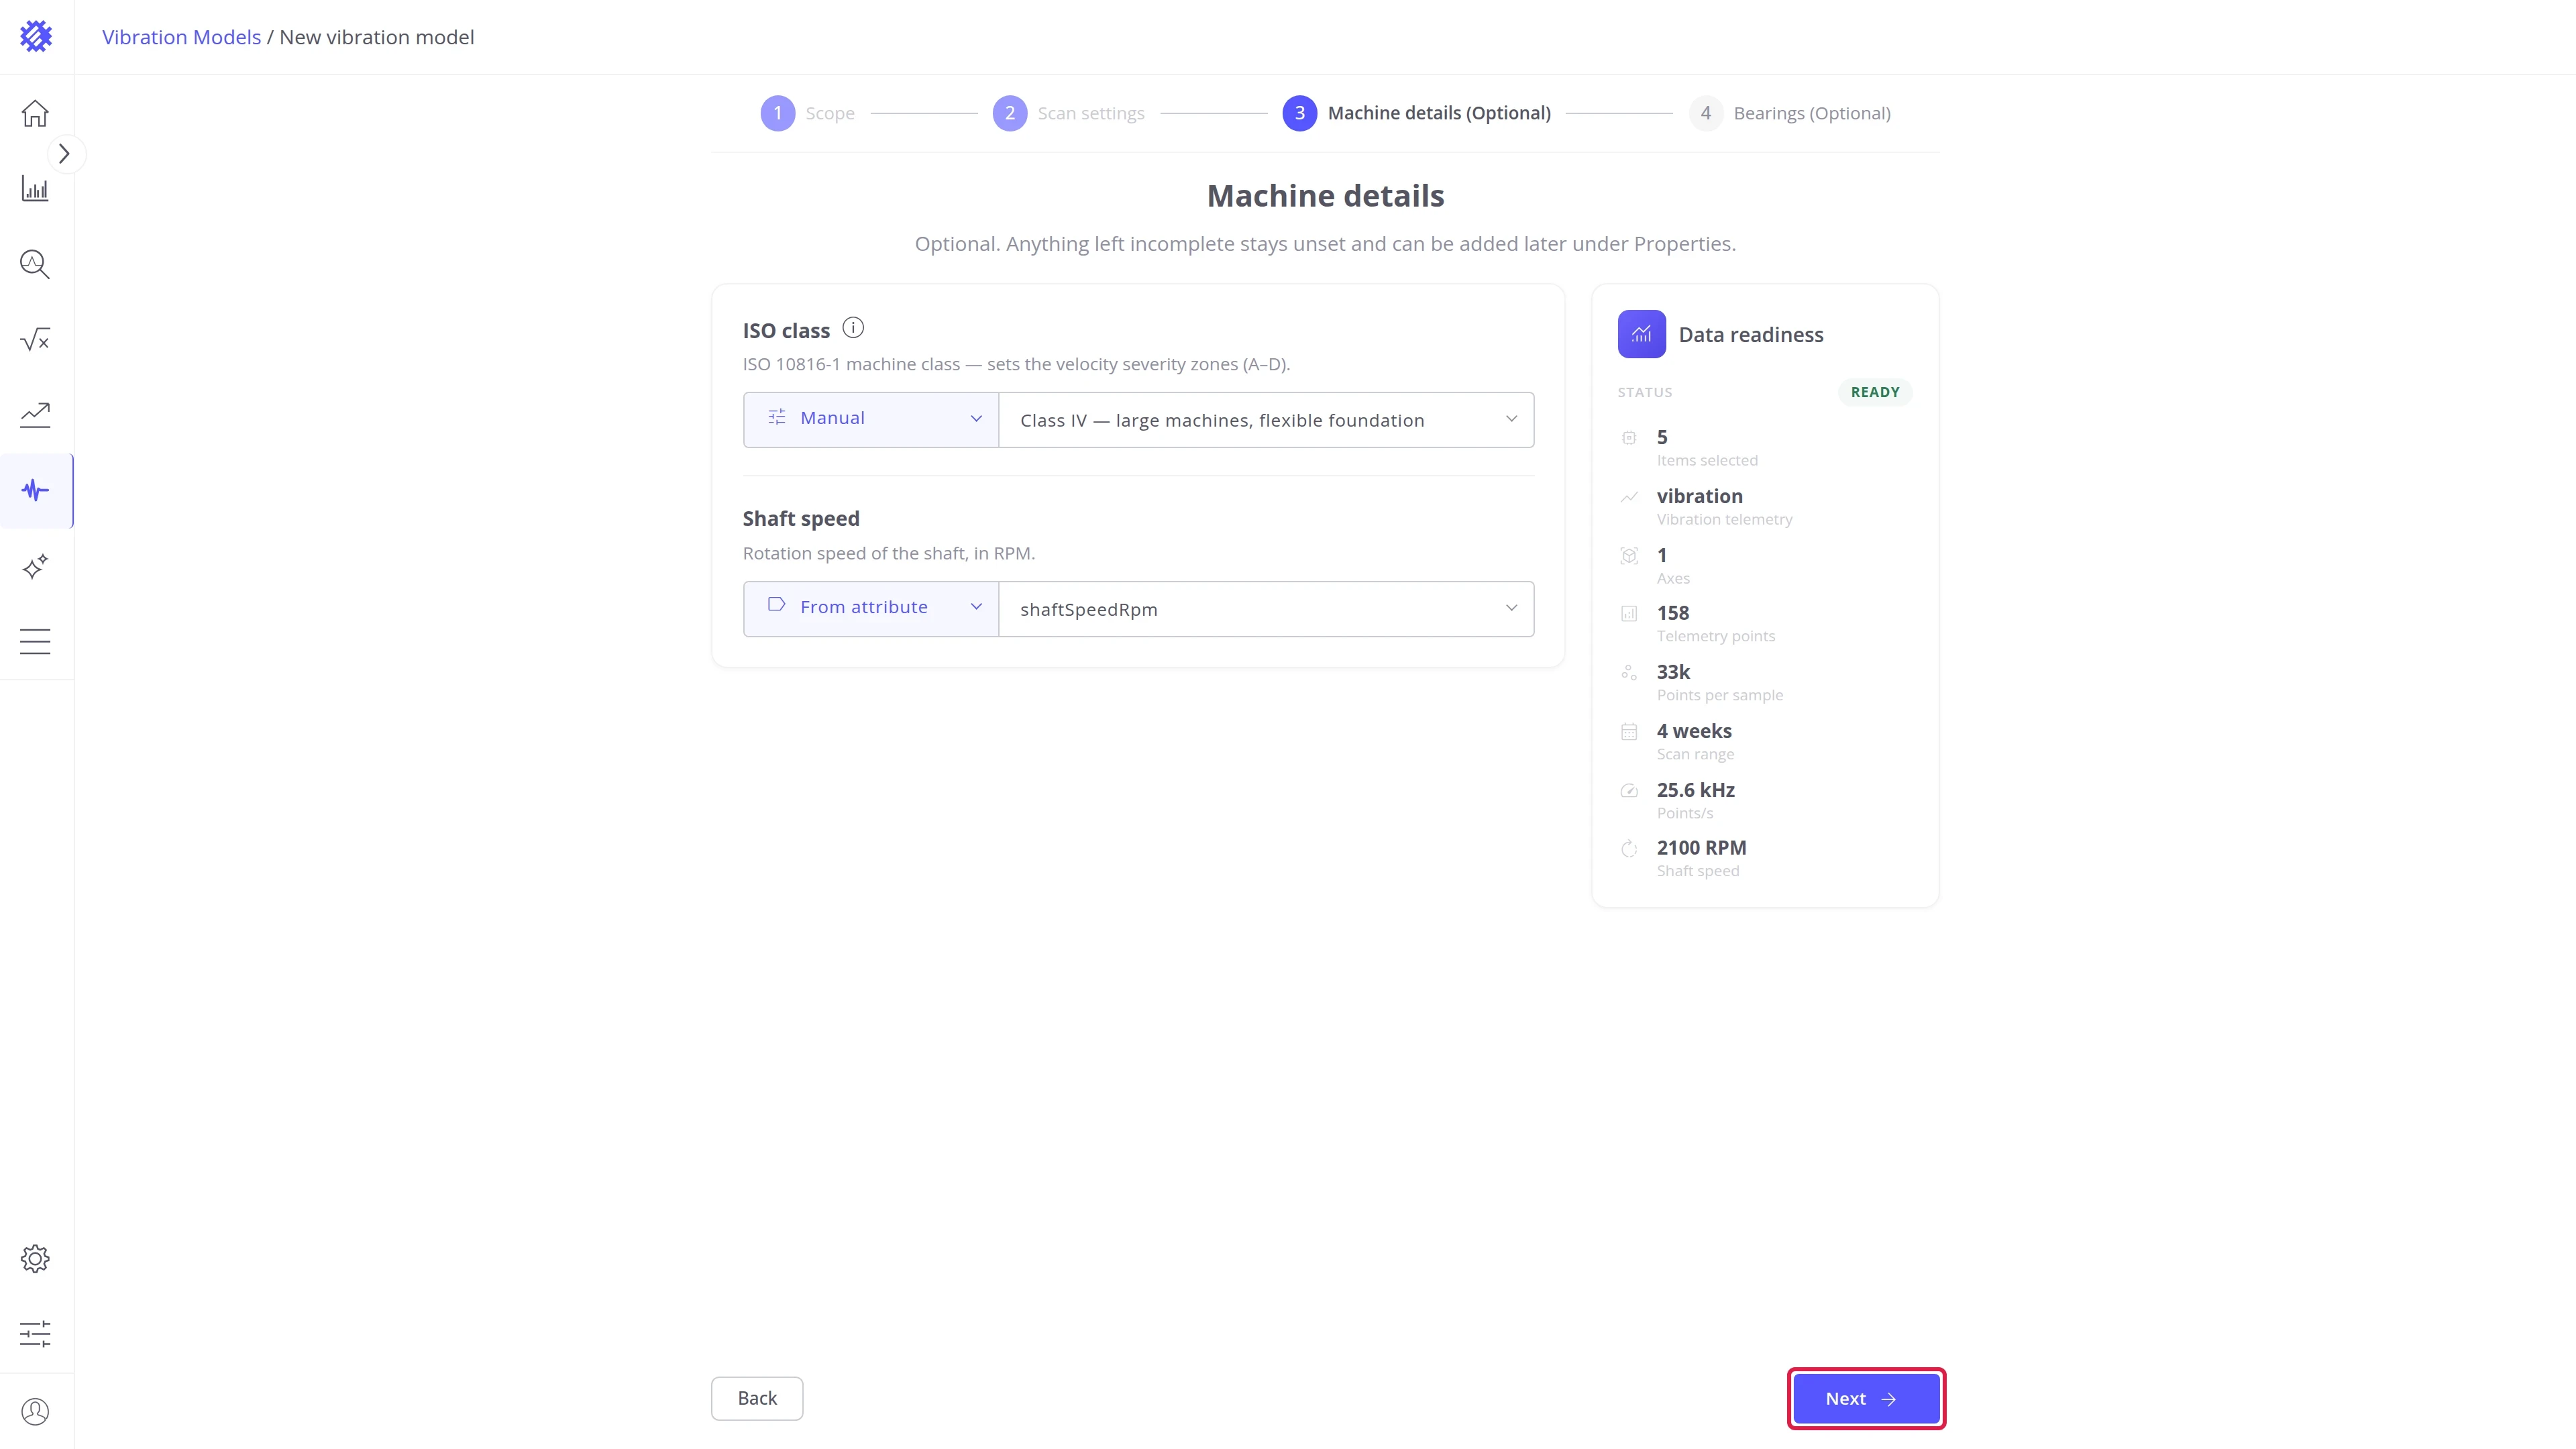
Step 6. Add bearings (optional)
Section titled “Step 6. Add bearings (optional)”Bearings let Trendz mark their fault frequencies, BPFO, BPFI, BSF, and FTF, on the spectra and name the defect. What the four frequencies mean is explained in Vibration Analysis Basics. The fault frequencies turn into hertz only with a shaft speed, so set it in Step 5.
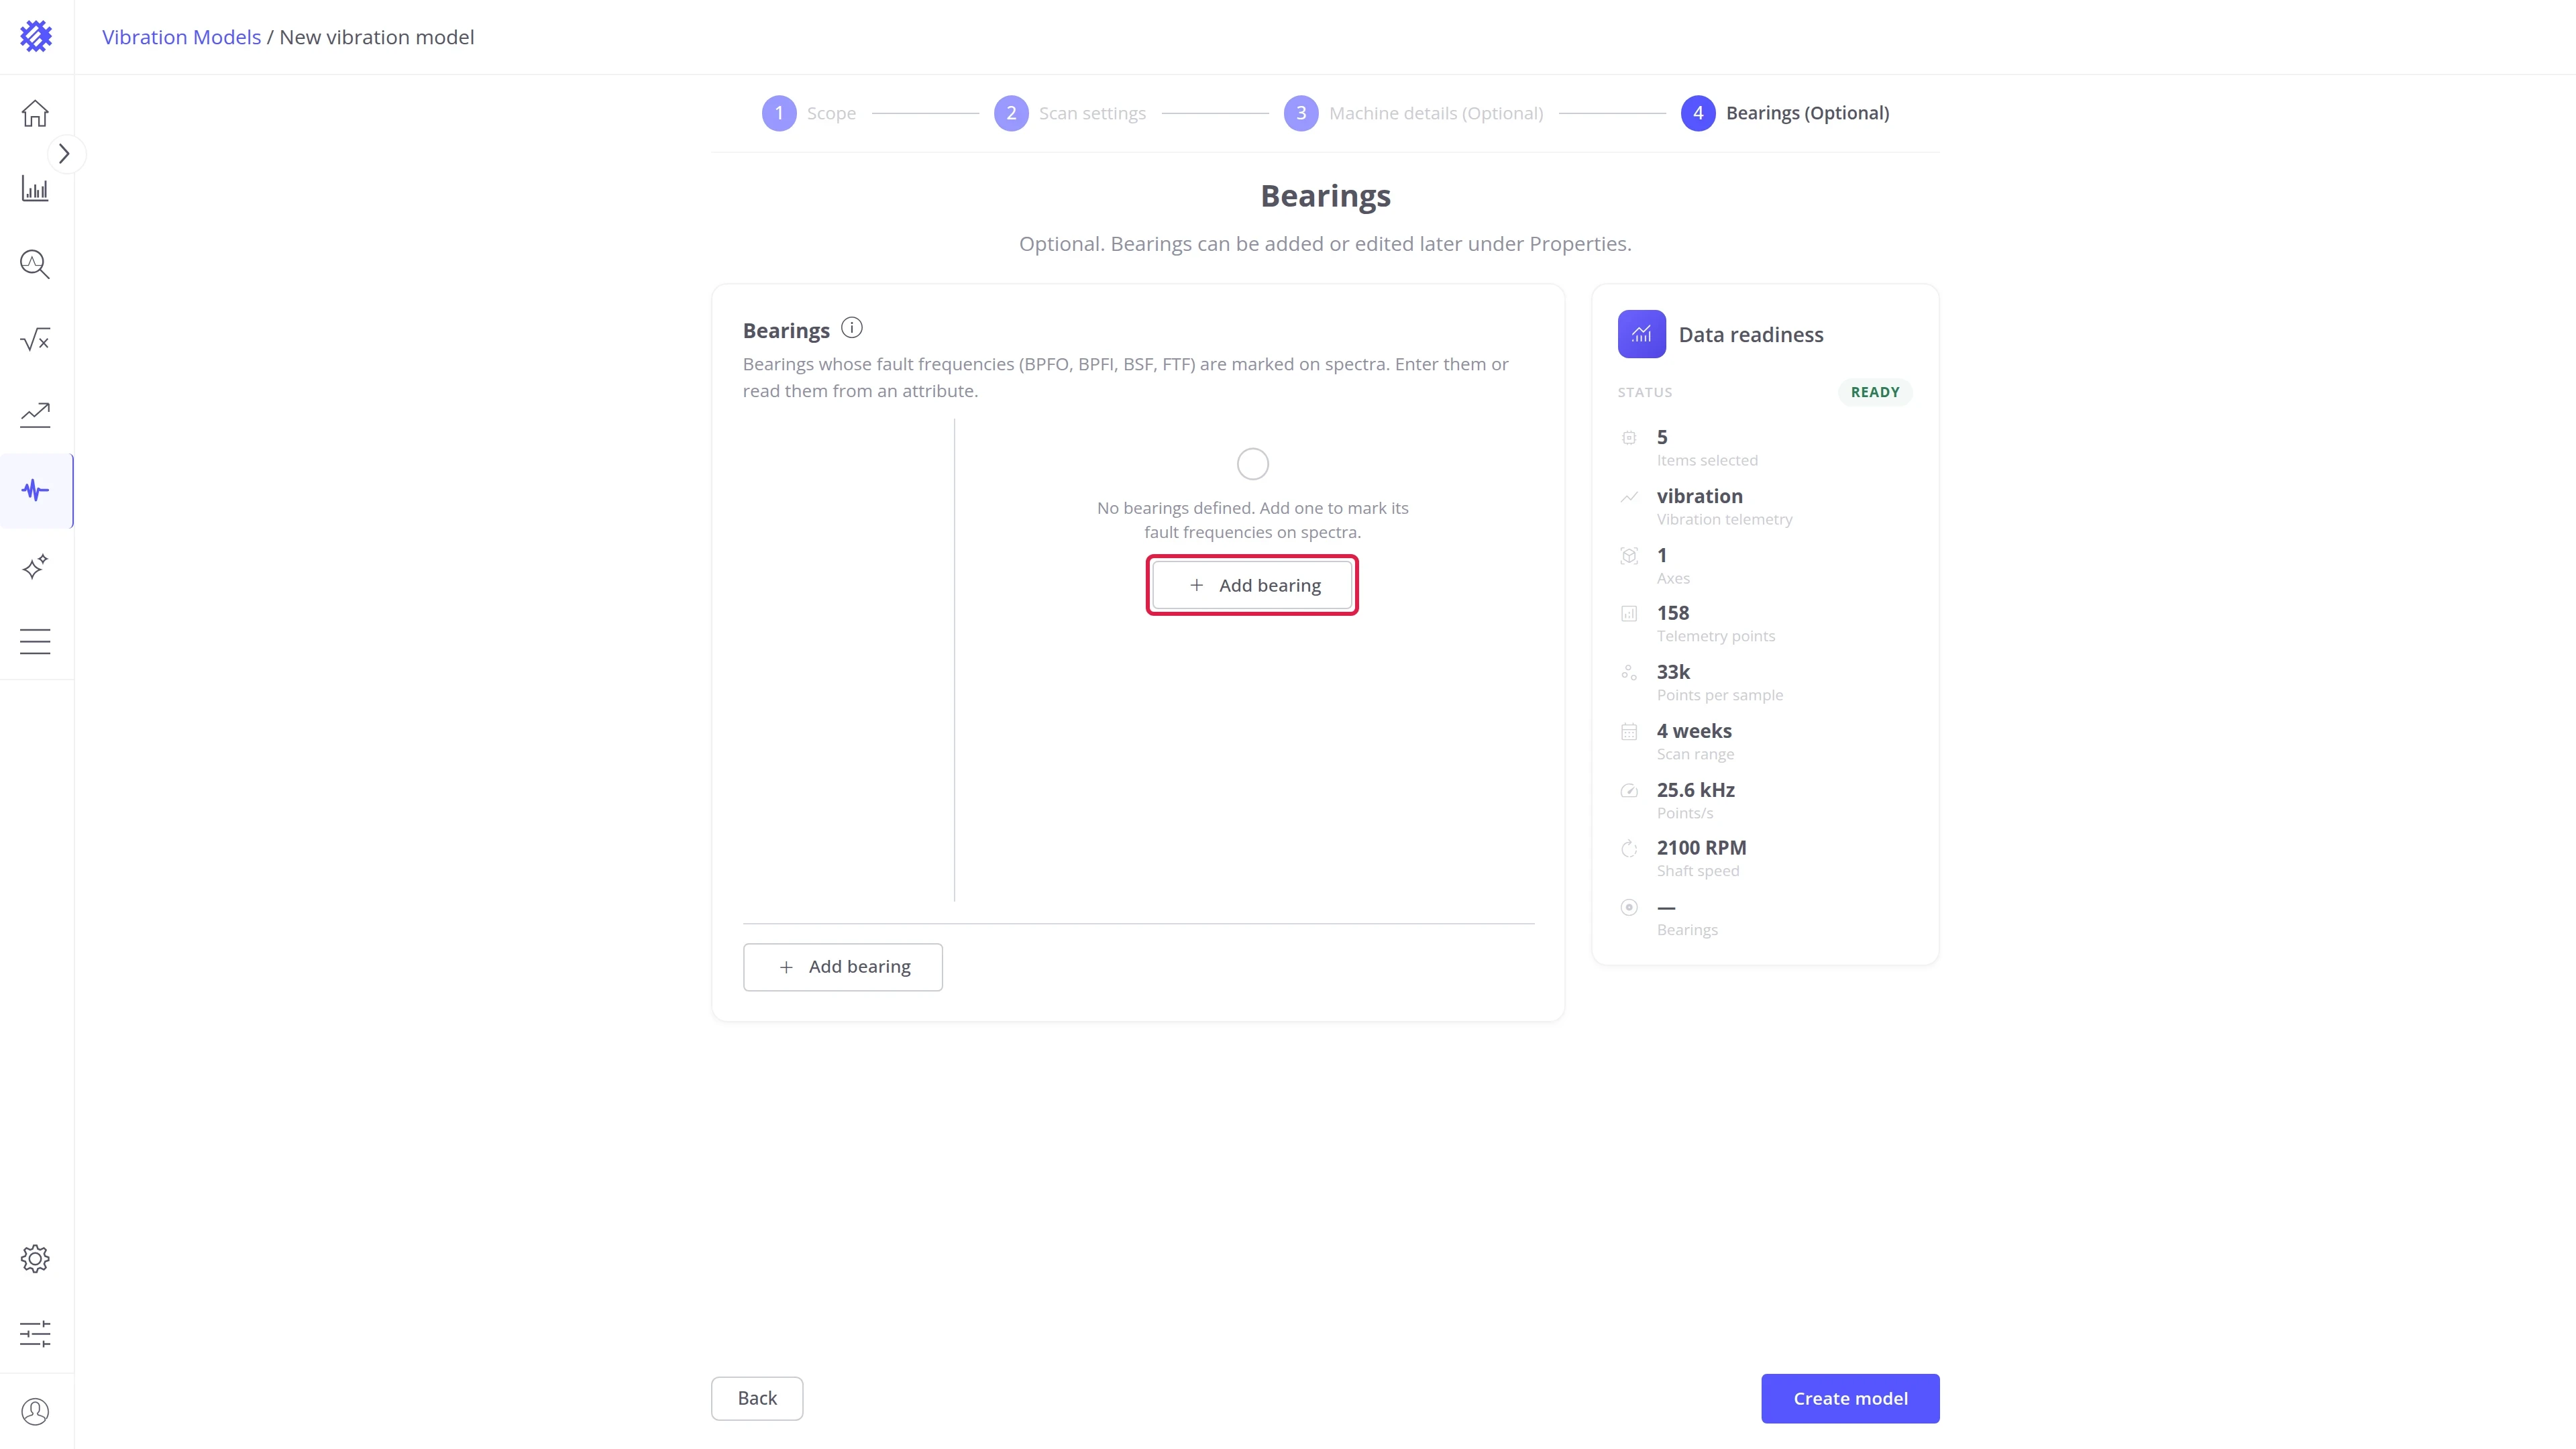
Add a bearing.
- Click Add bearing.
- A new row, such as Bearing 1, appears in the list and opens on the right. A warning icon stays on it until the bearing is complete: hover it to read Complete this bearing or remove it.
- Enter the bearing as described below.
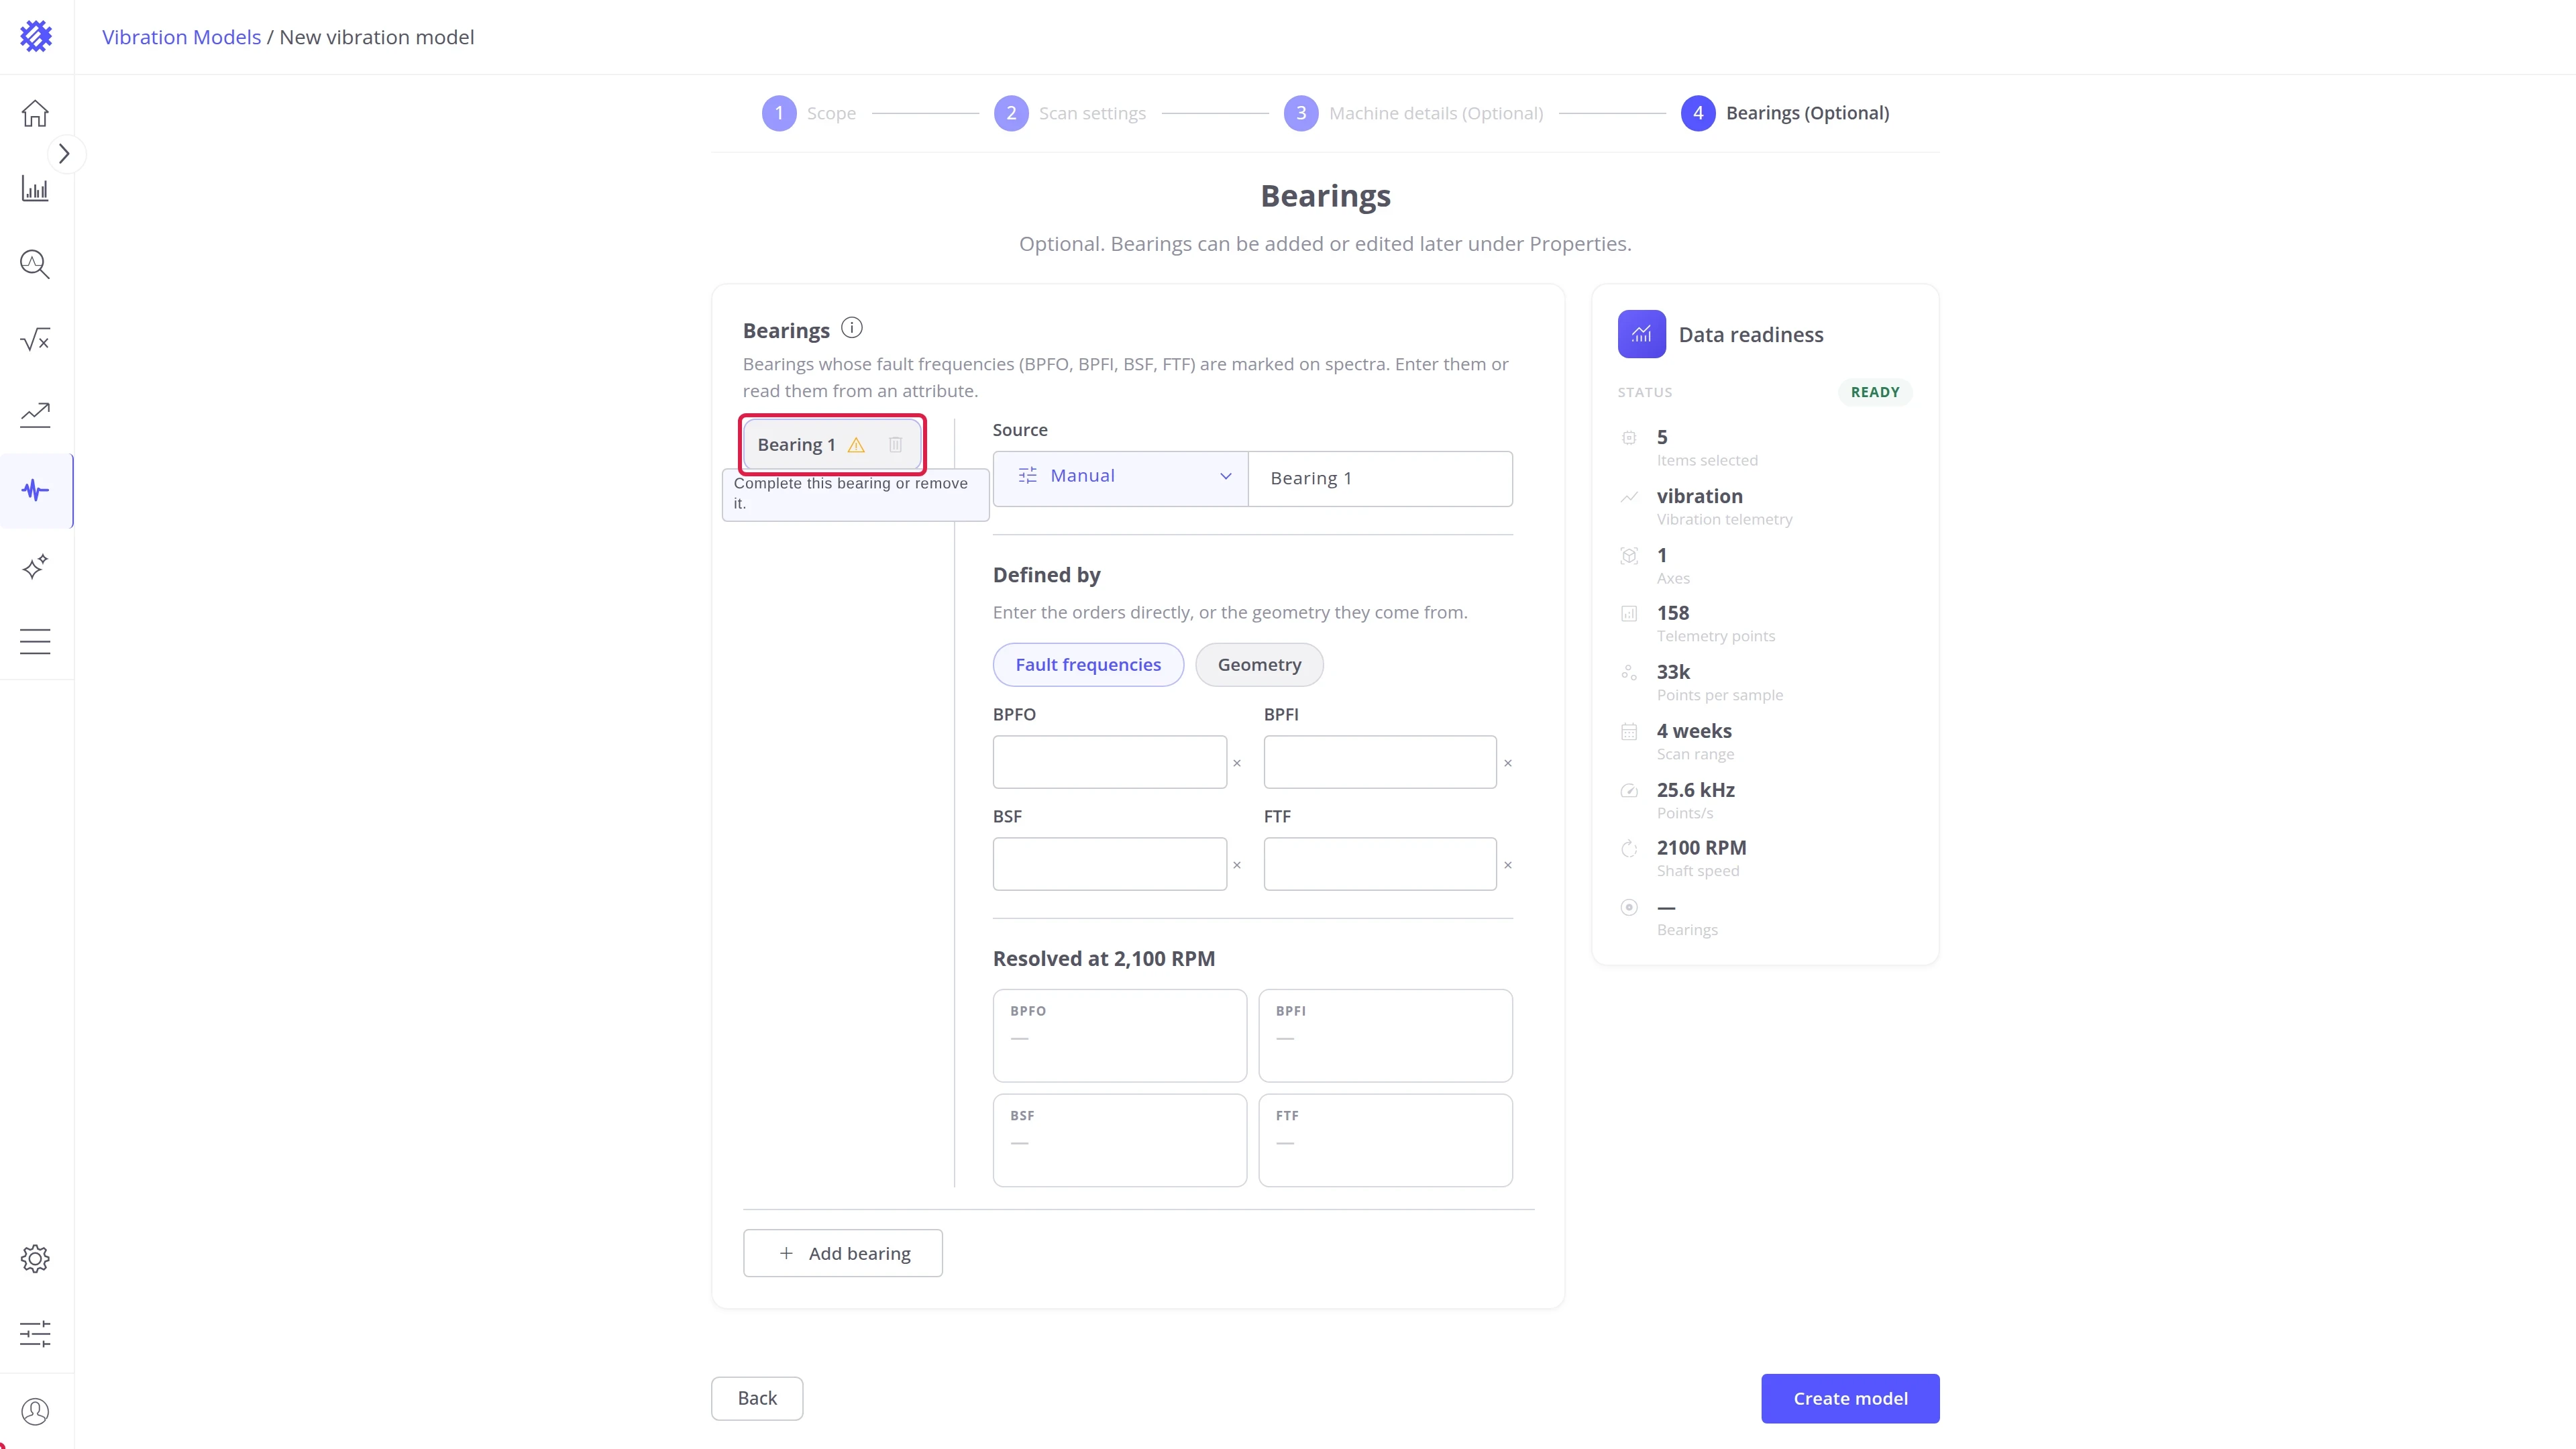
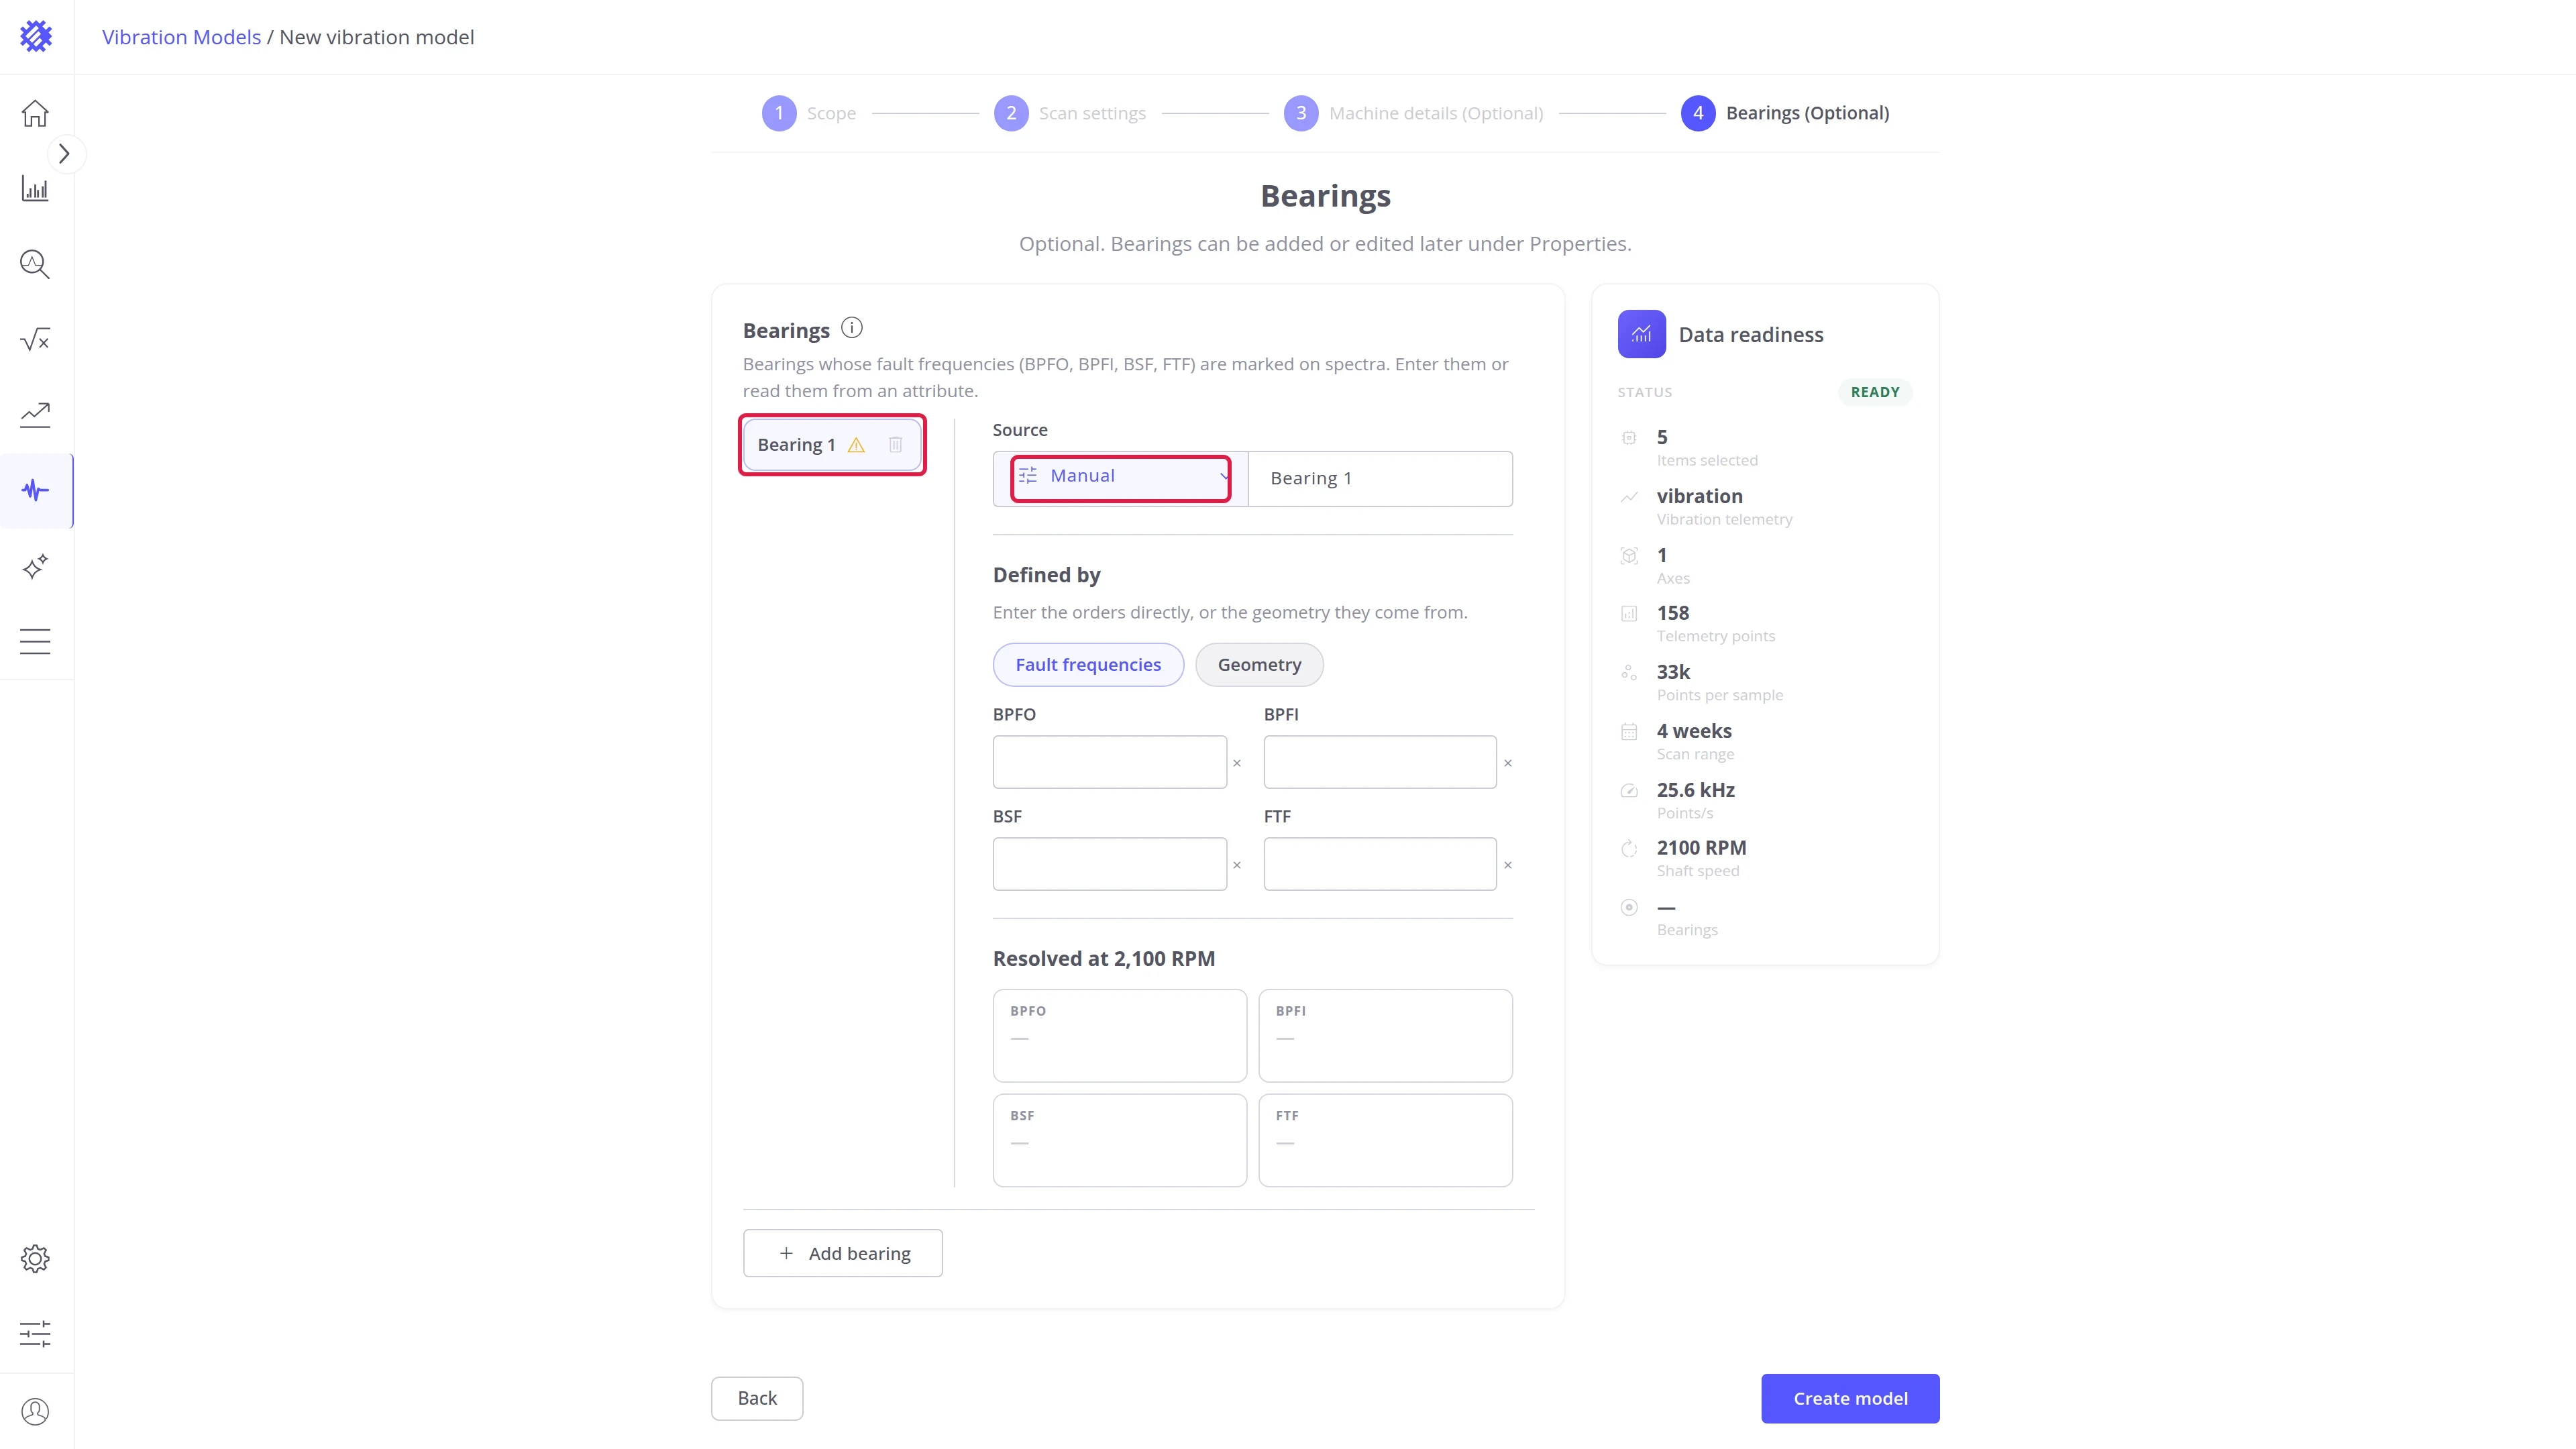
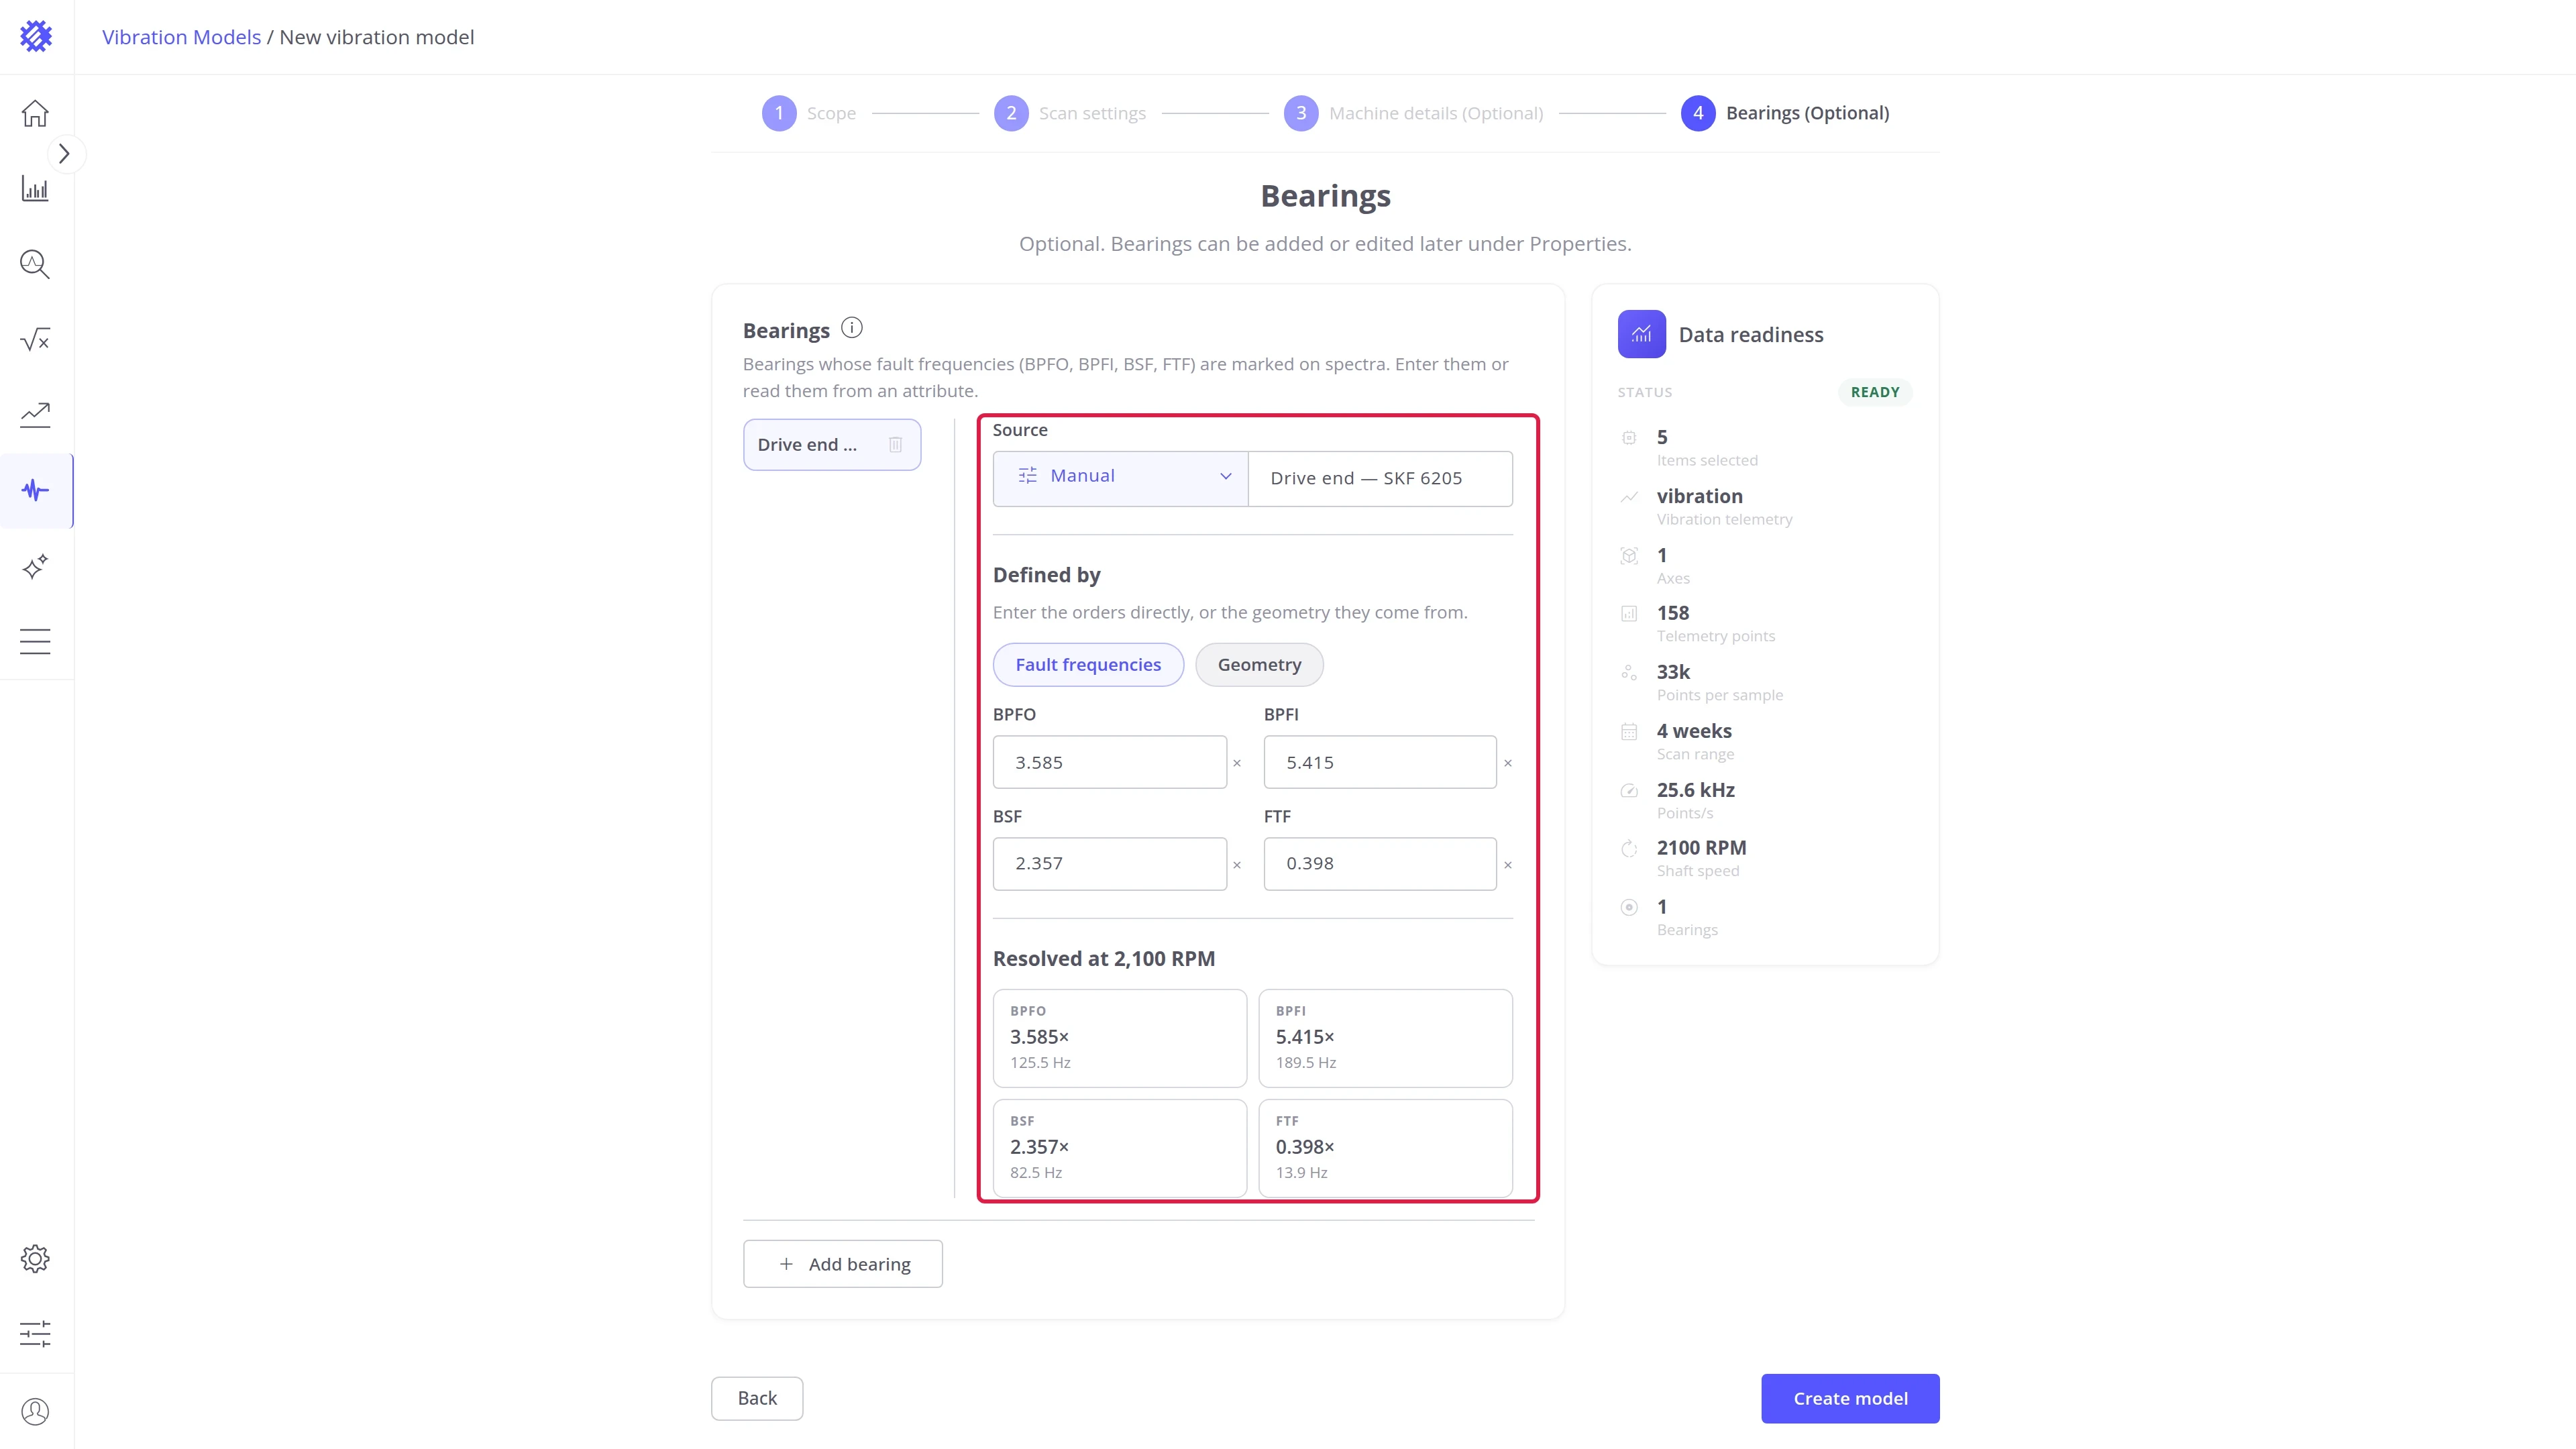
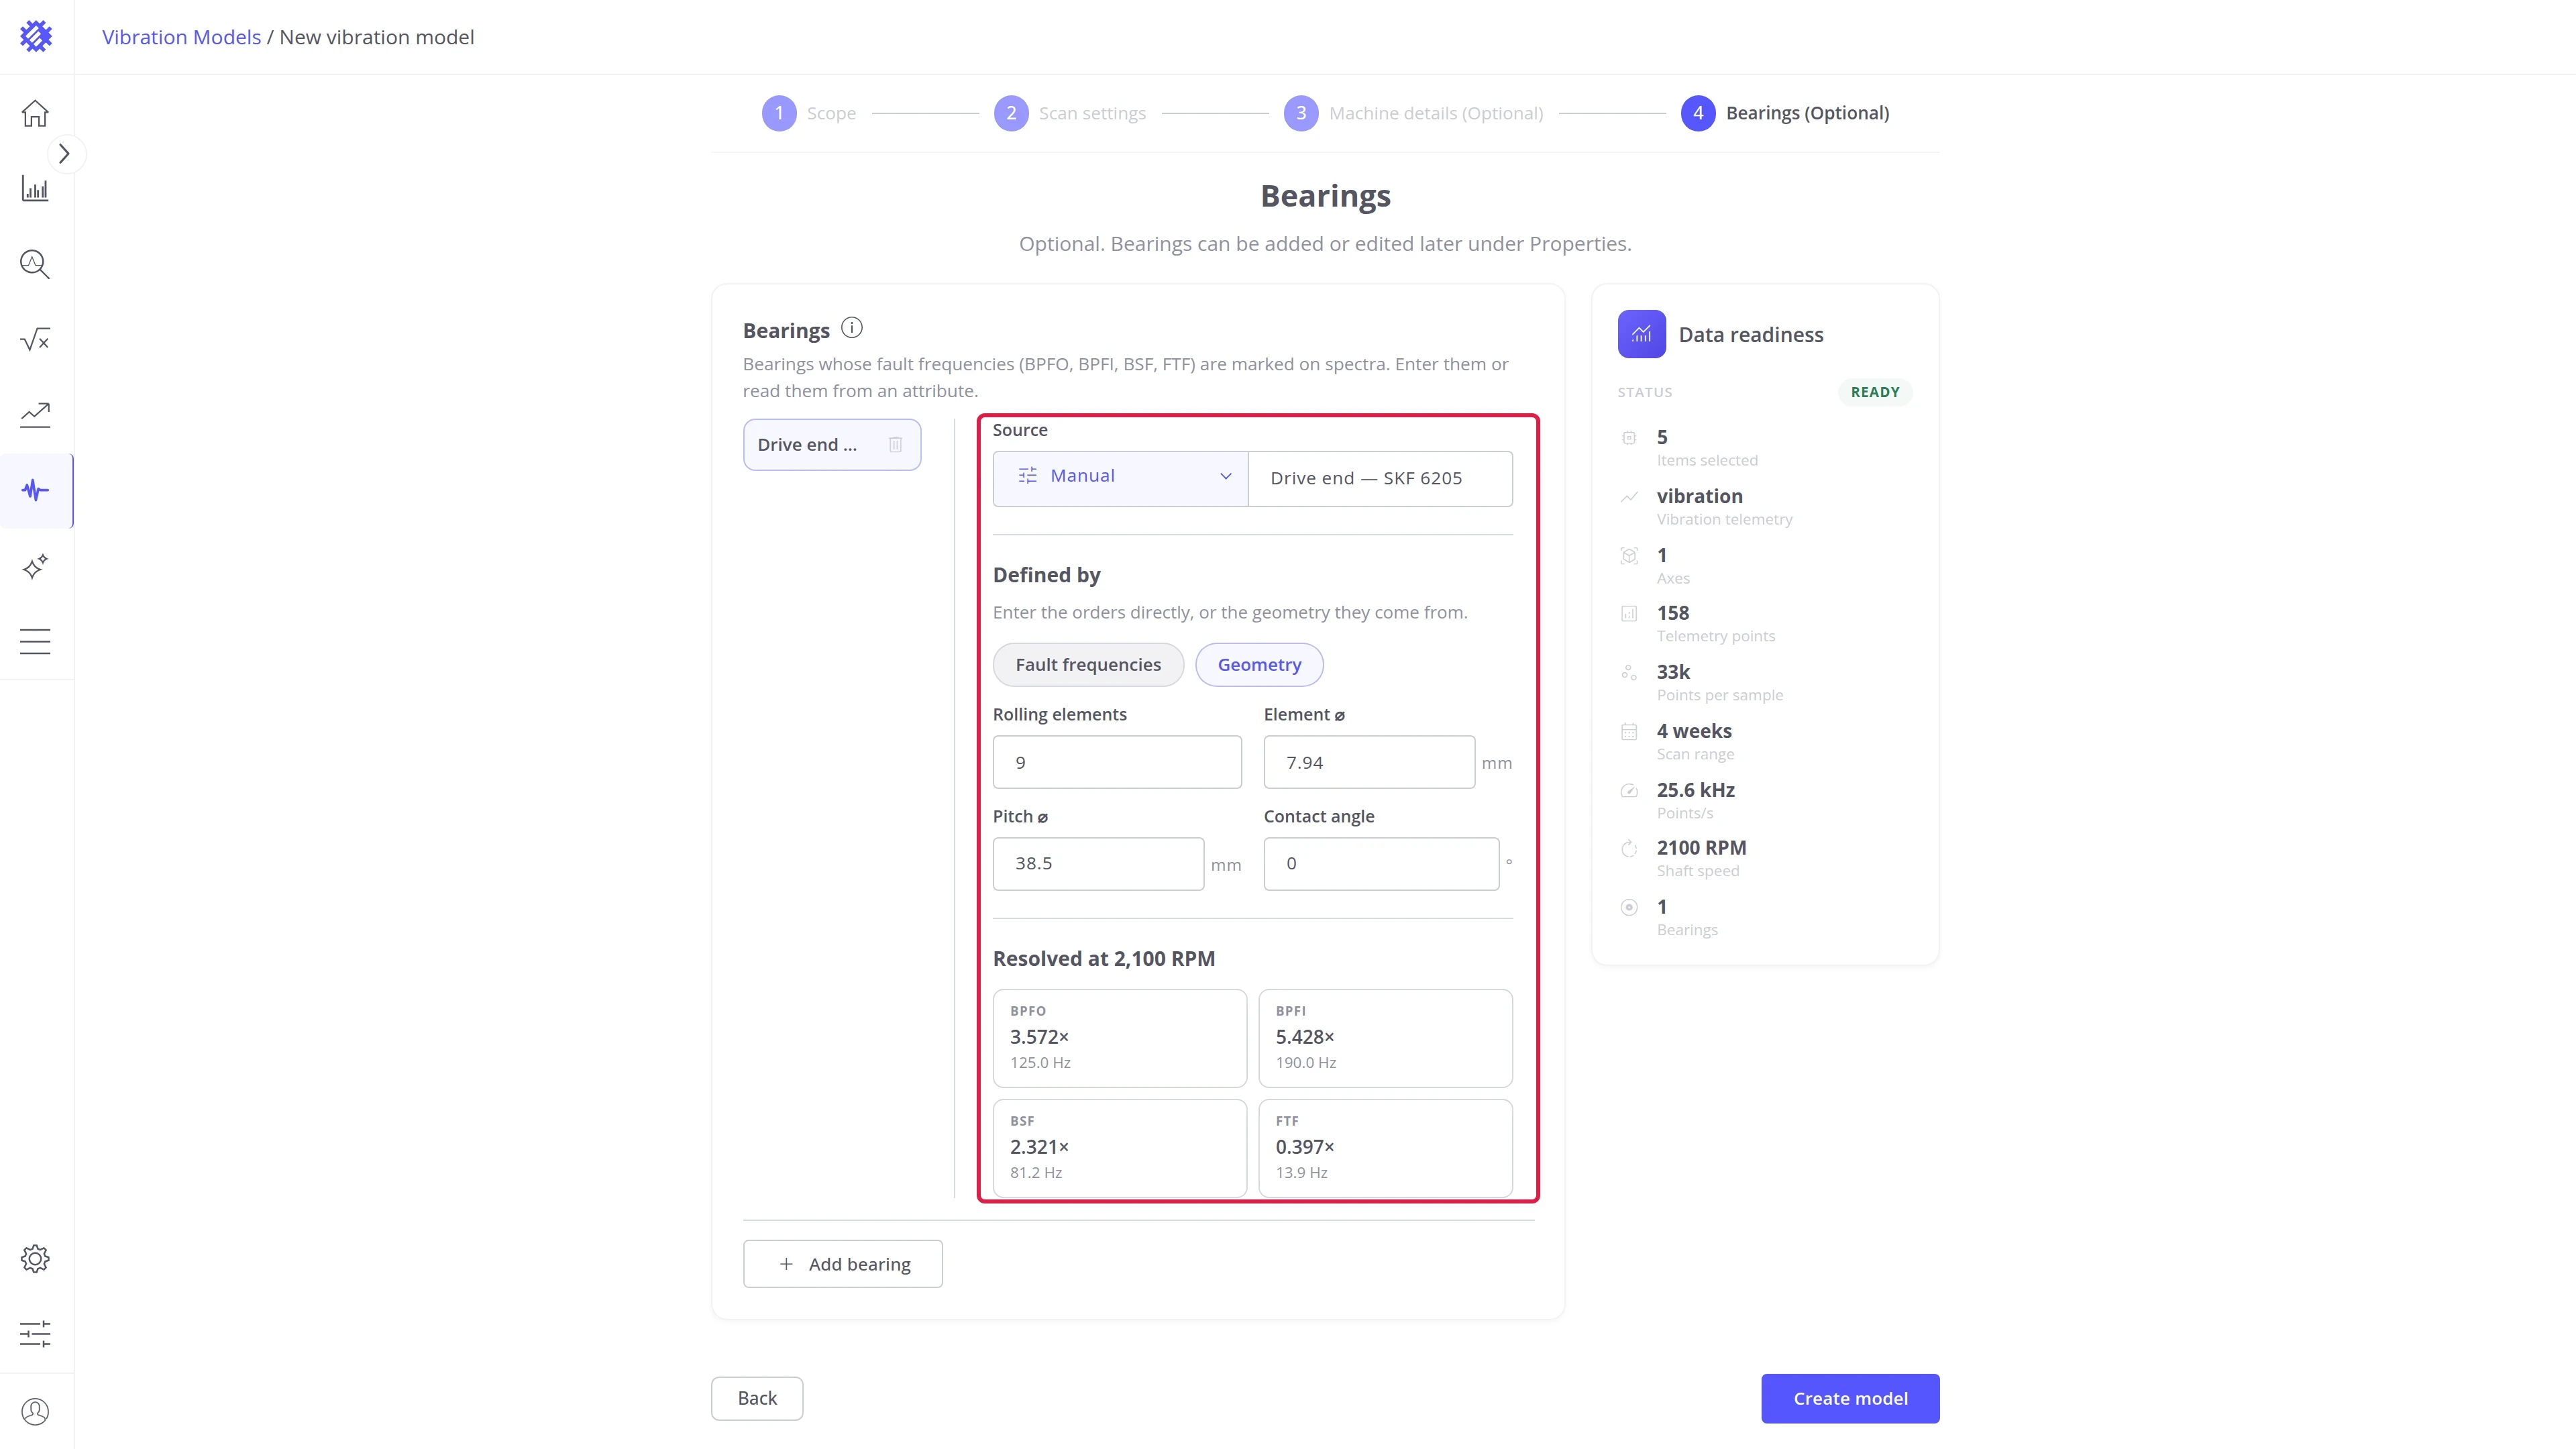
Enter the bearing. It applies to every machine of the model:
- Type a name, for example Drive end — SKF 6205.
- Under Defined by, choose Fault frequencies or Geometry, and fill in the fields. Both are described in the table below.
- Check Resolved at … RPM below the fields: it shows each fault frequency in hertz at the shaft speed.
| Defined by | What you enter |
|---|---|
| Fault frequencies | BPFO, BPFI, BSF, and FTF as orders, multiples of the shaft speed. They are usually in the bearing maker’s catalog |
| Geometry | Rolling elements, Element ⌀ and Pitch ⌀ in mm, and Contact angle in degrees. Trendz calculates the orders from them |
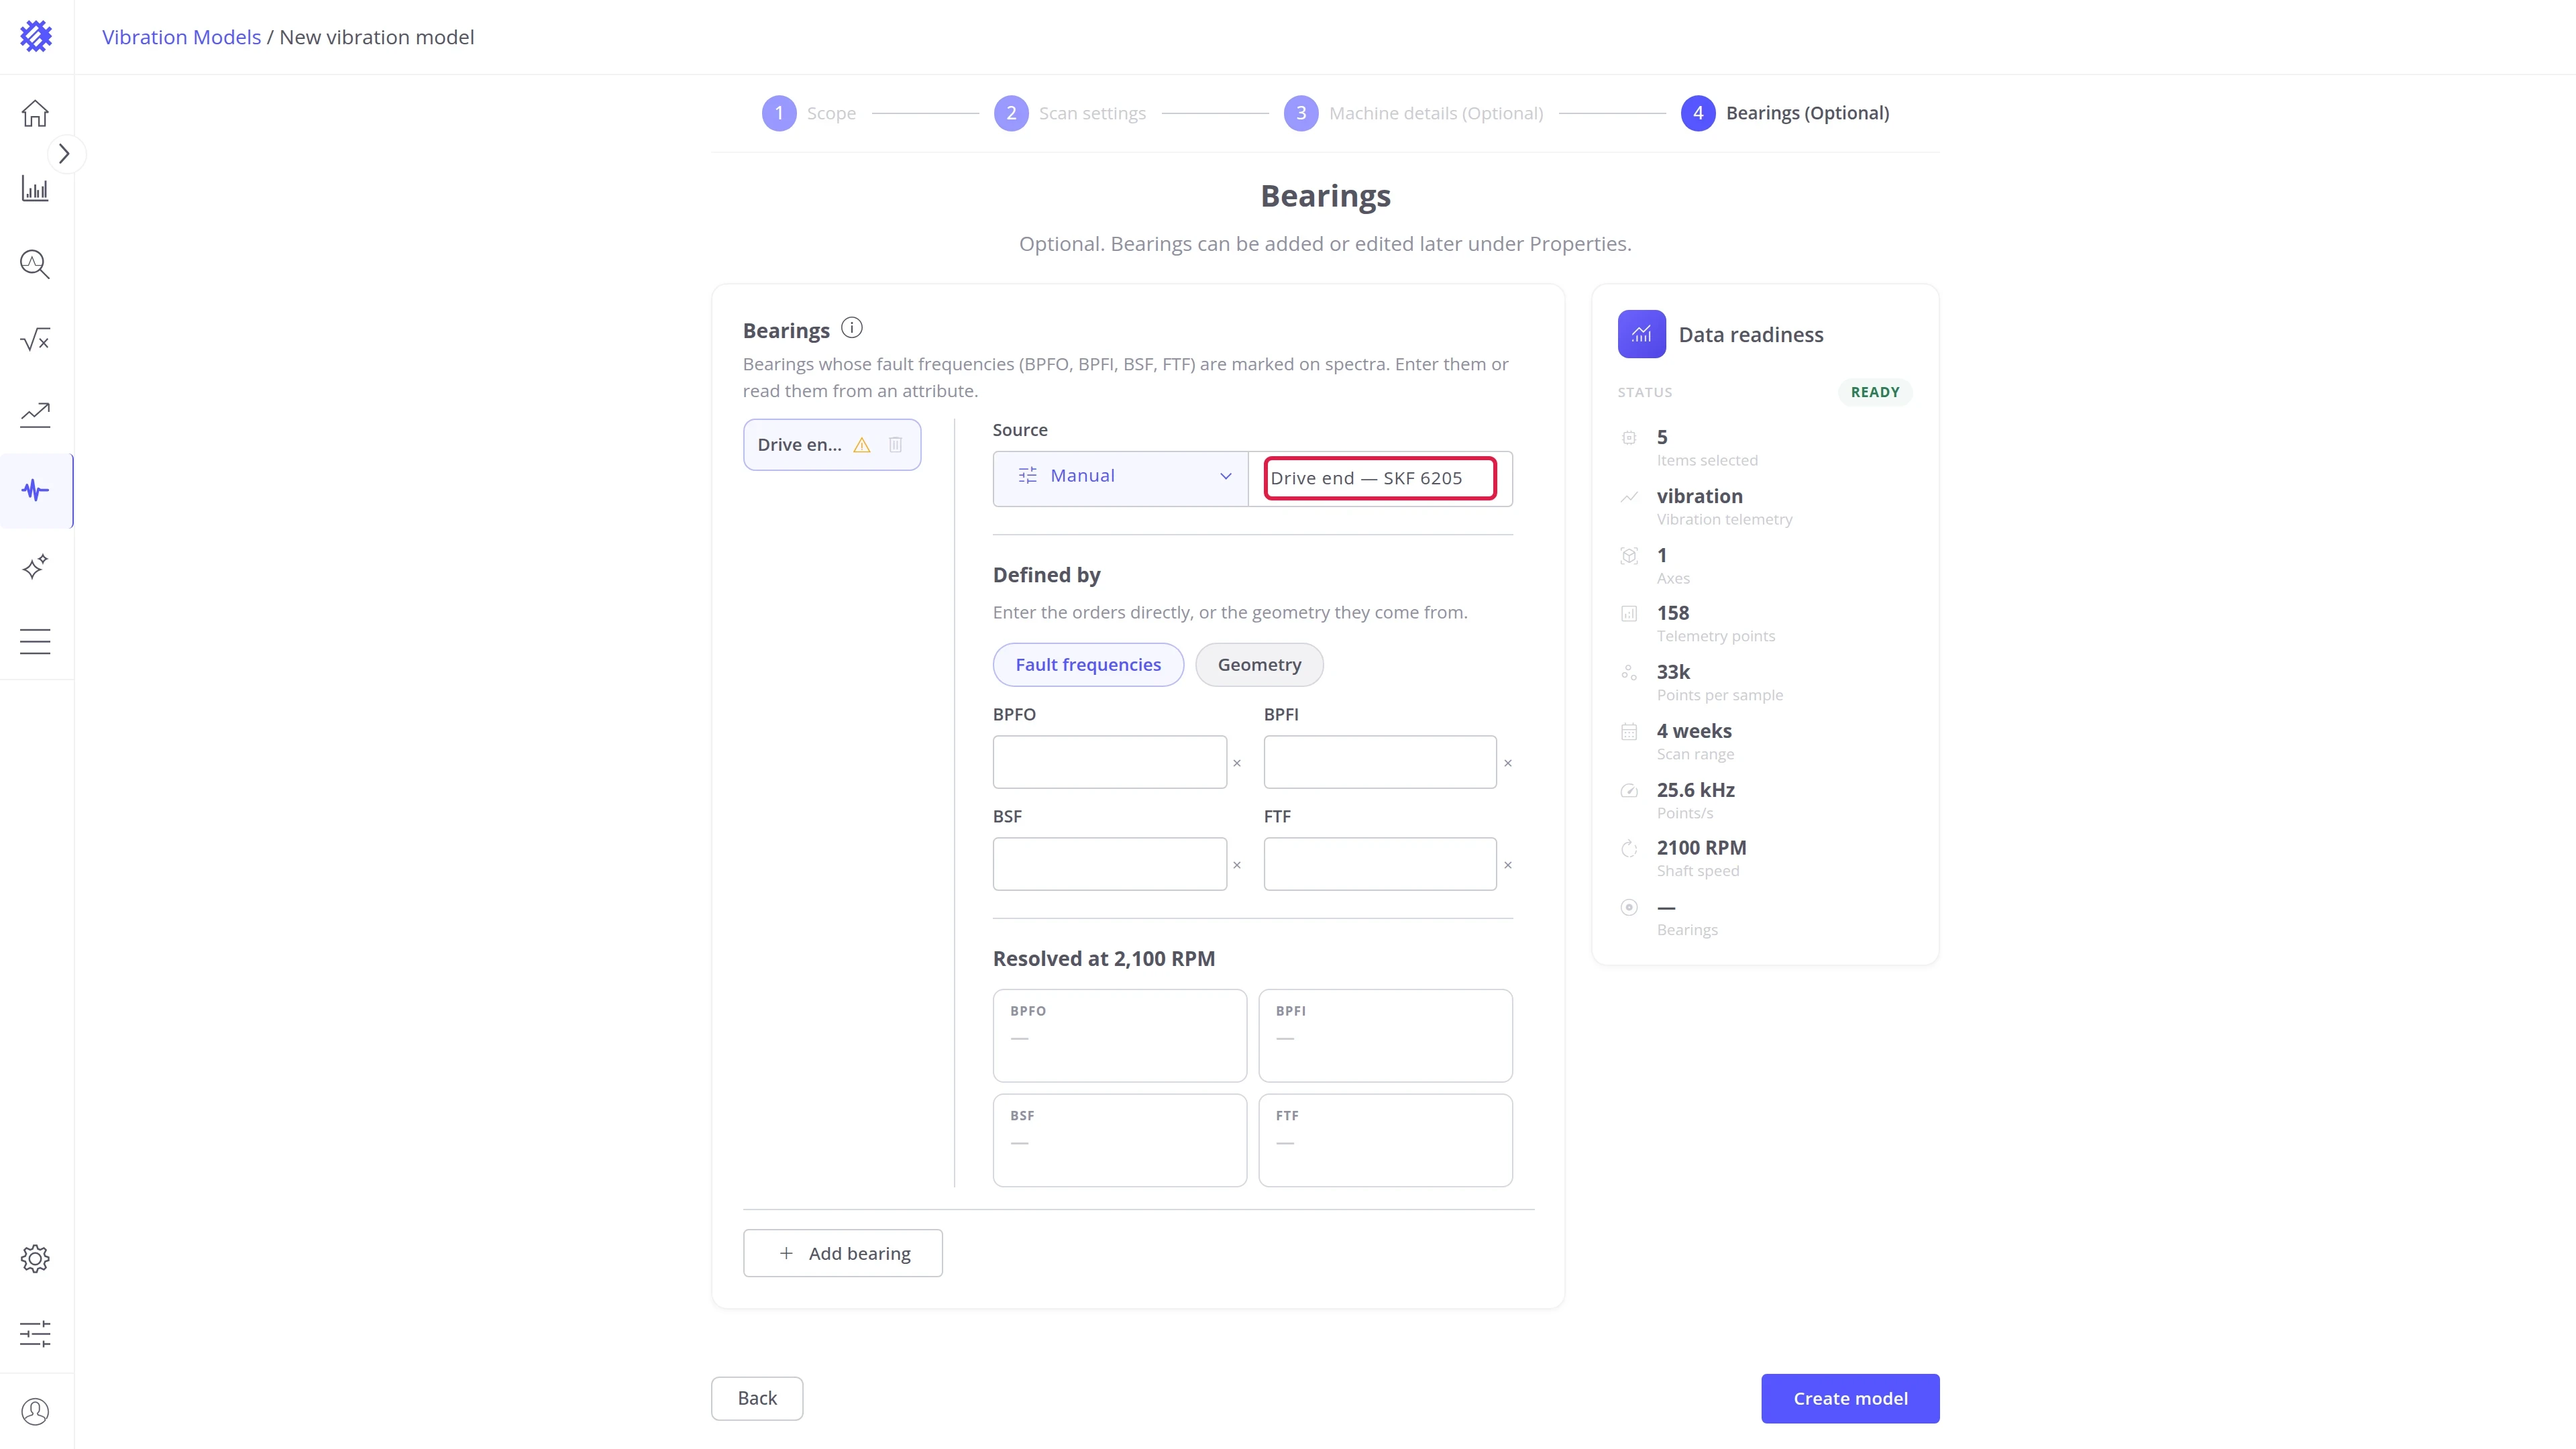
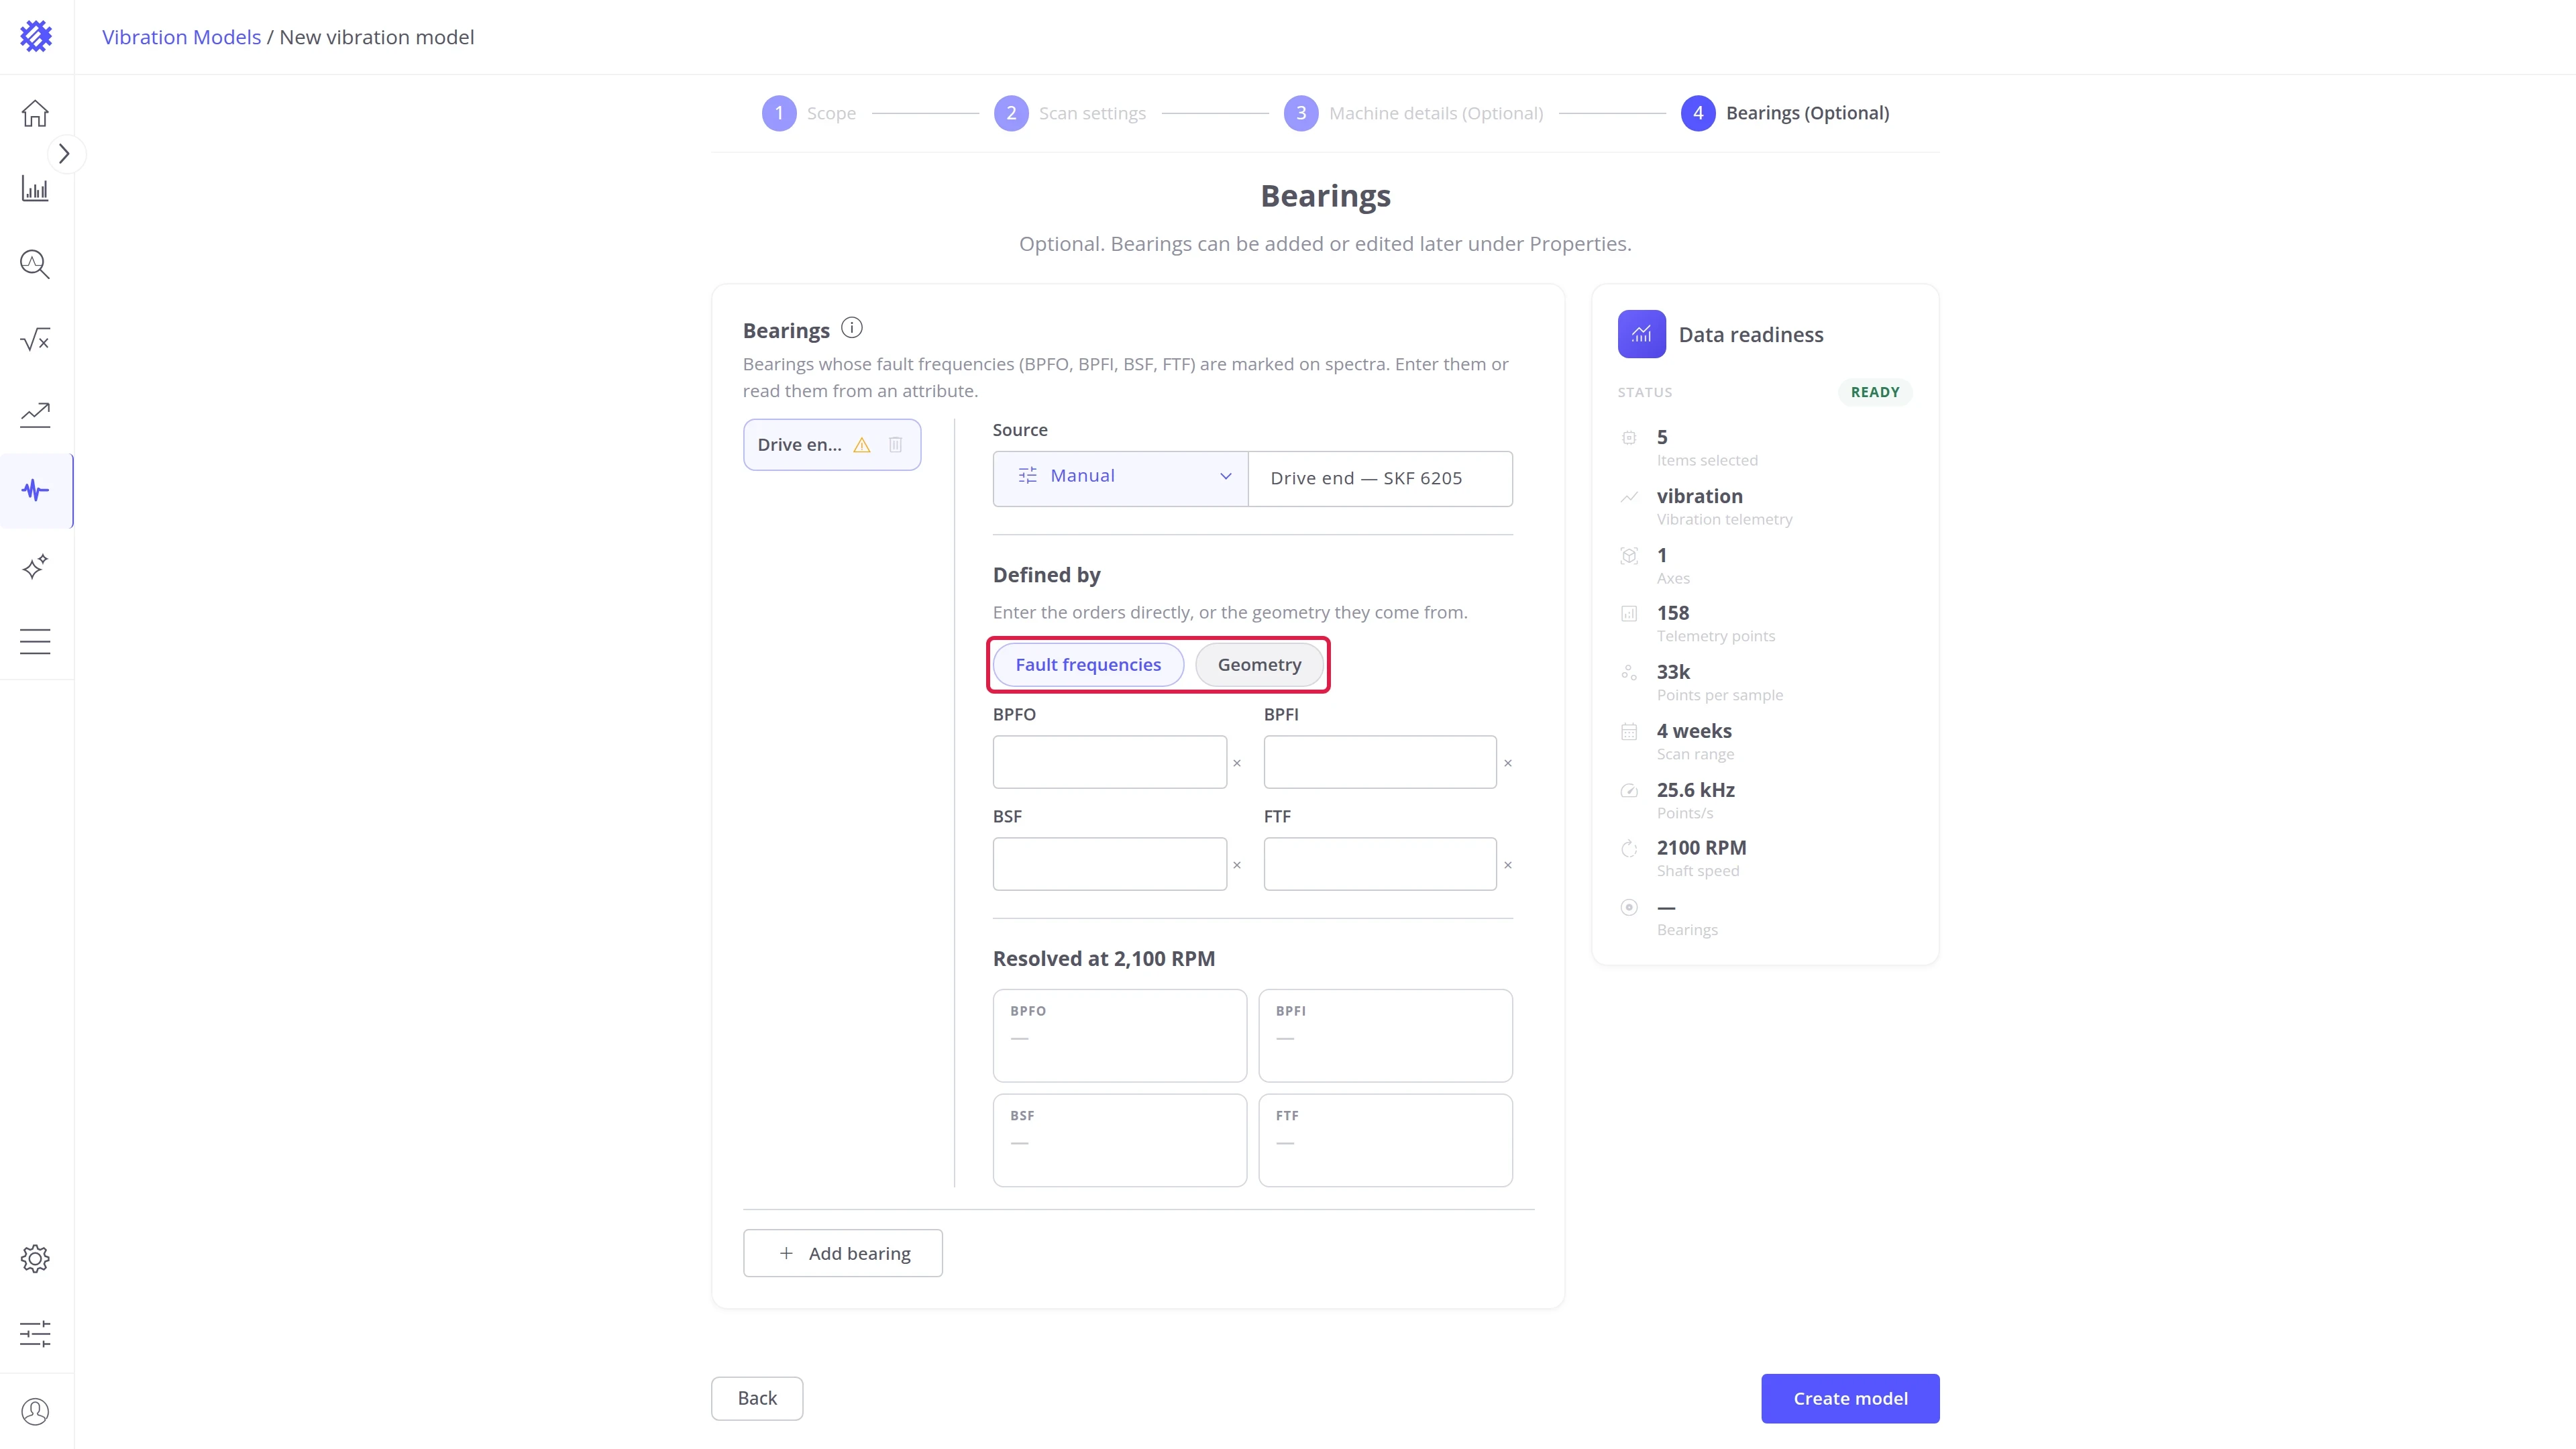
For more bearing settings, such as reading a different bearing for each machine from an attribute, see Properties Tab.
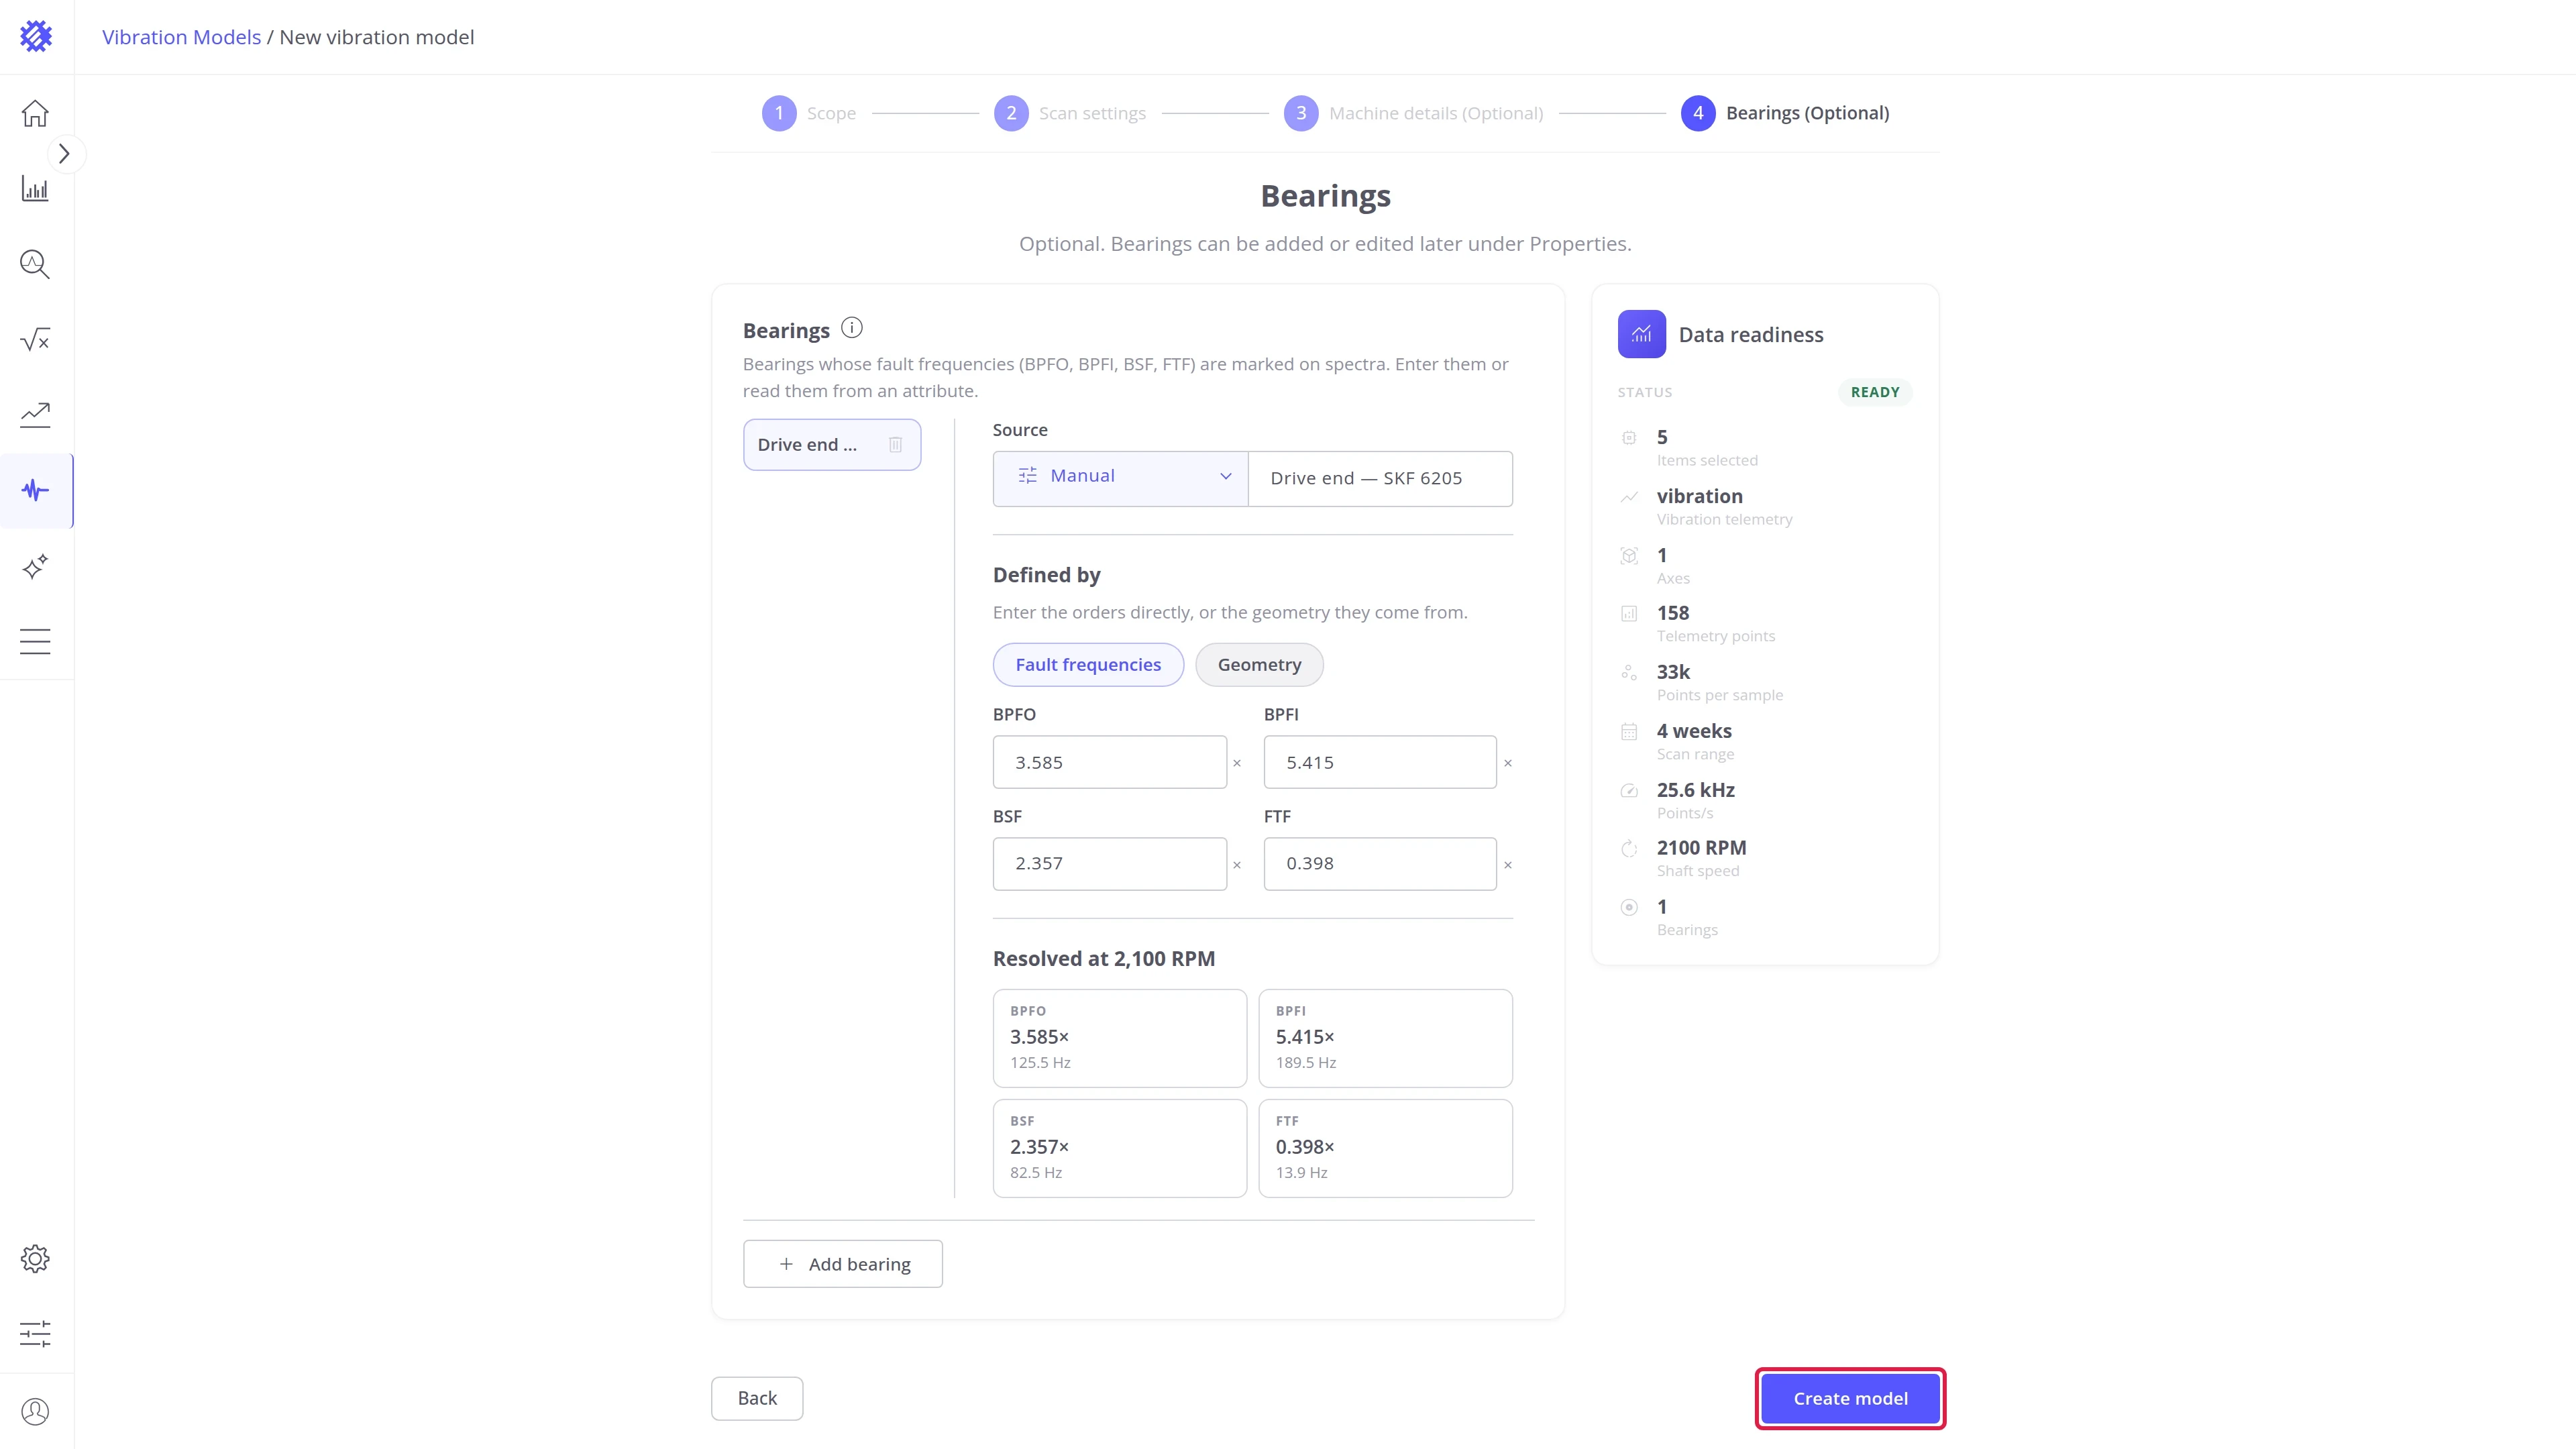
Once the bearings are set, click Create model. Trendz starts the first scan.
Step 7. See the results
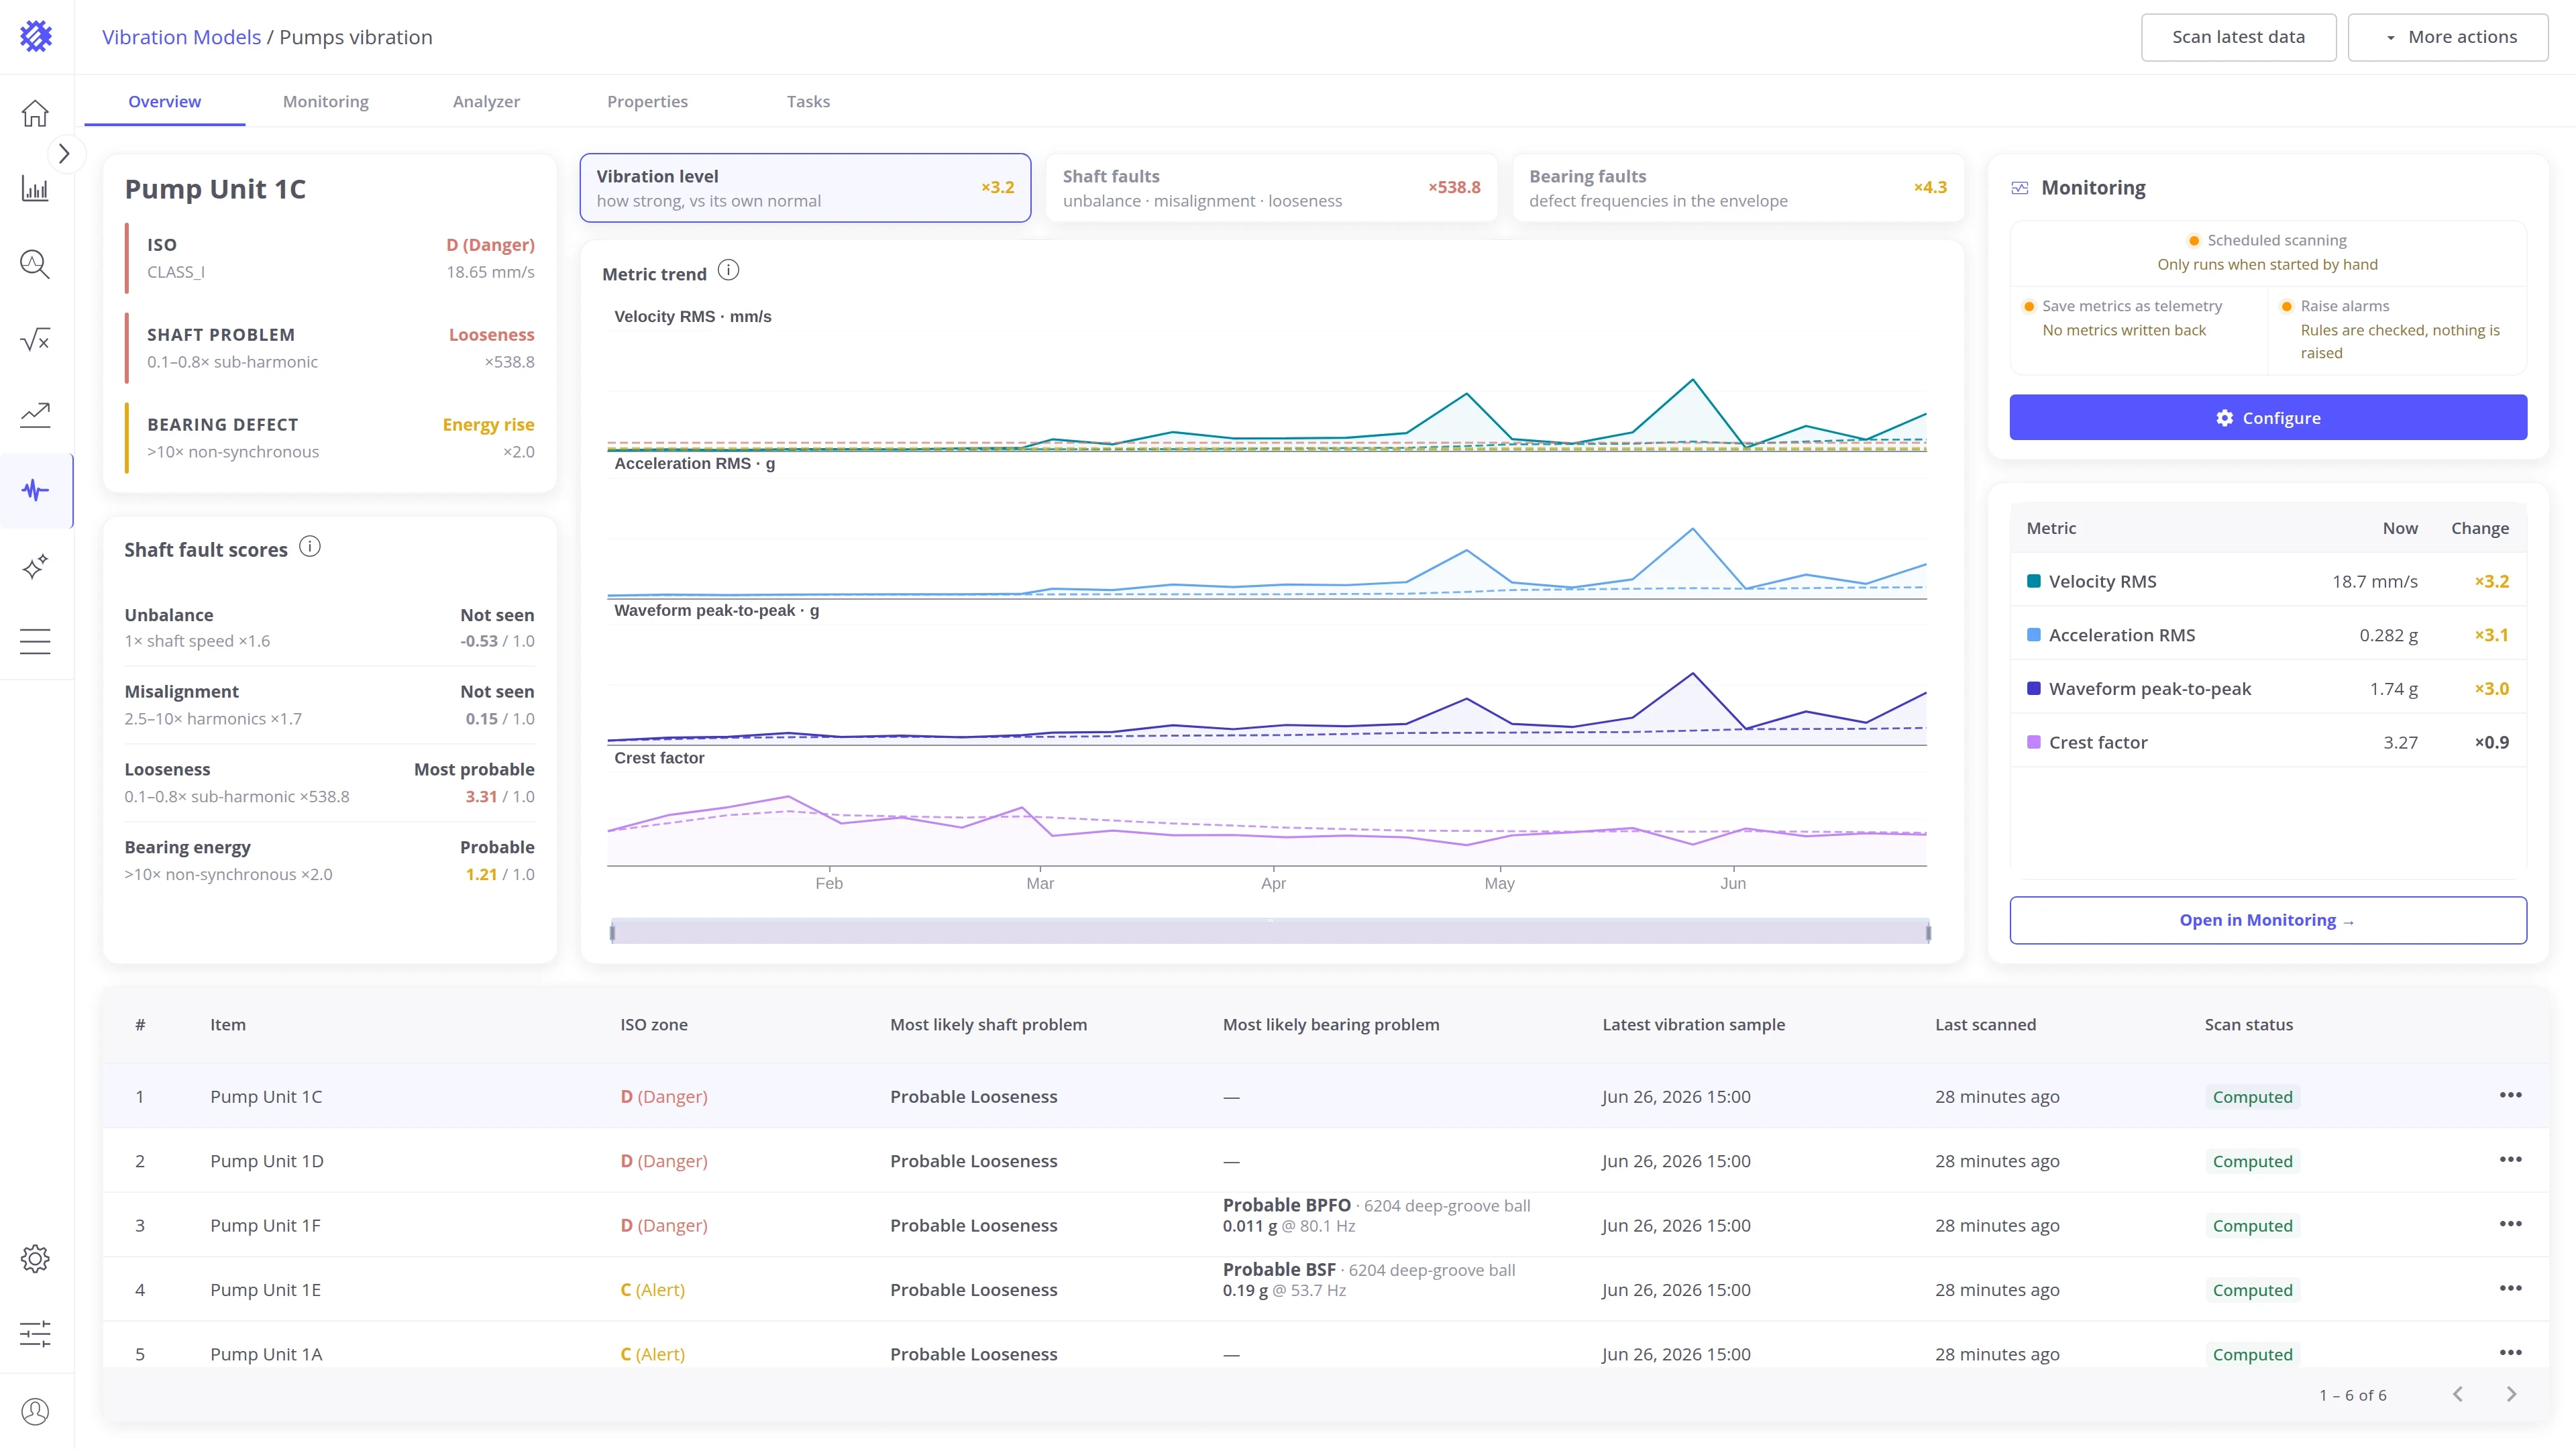
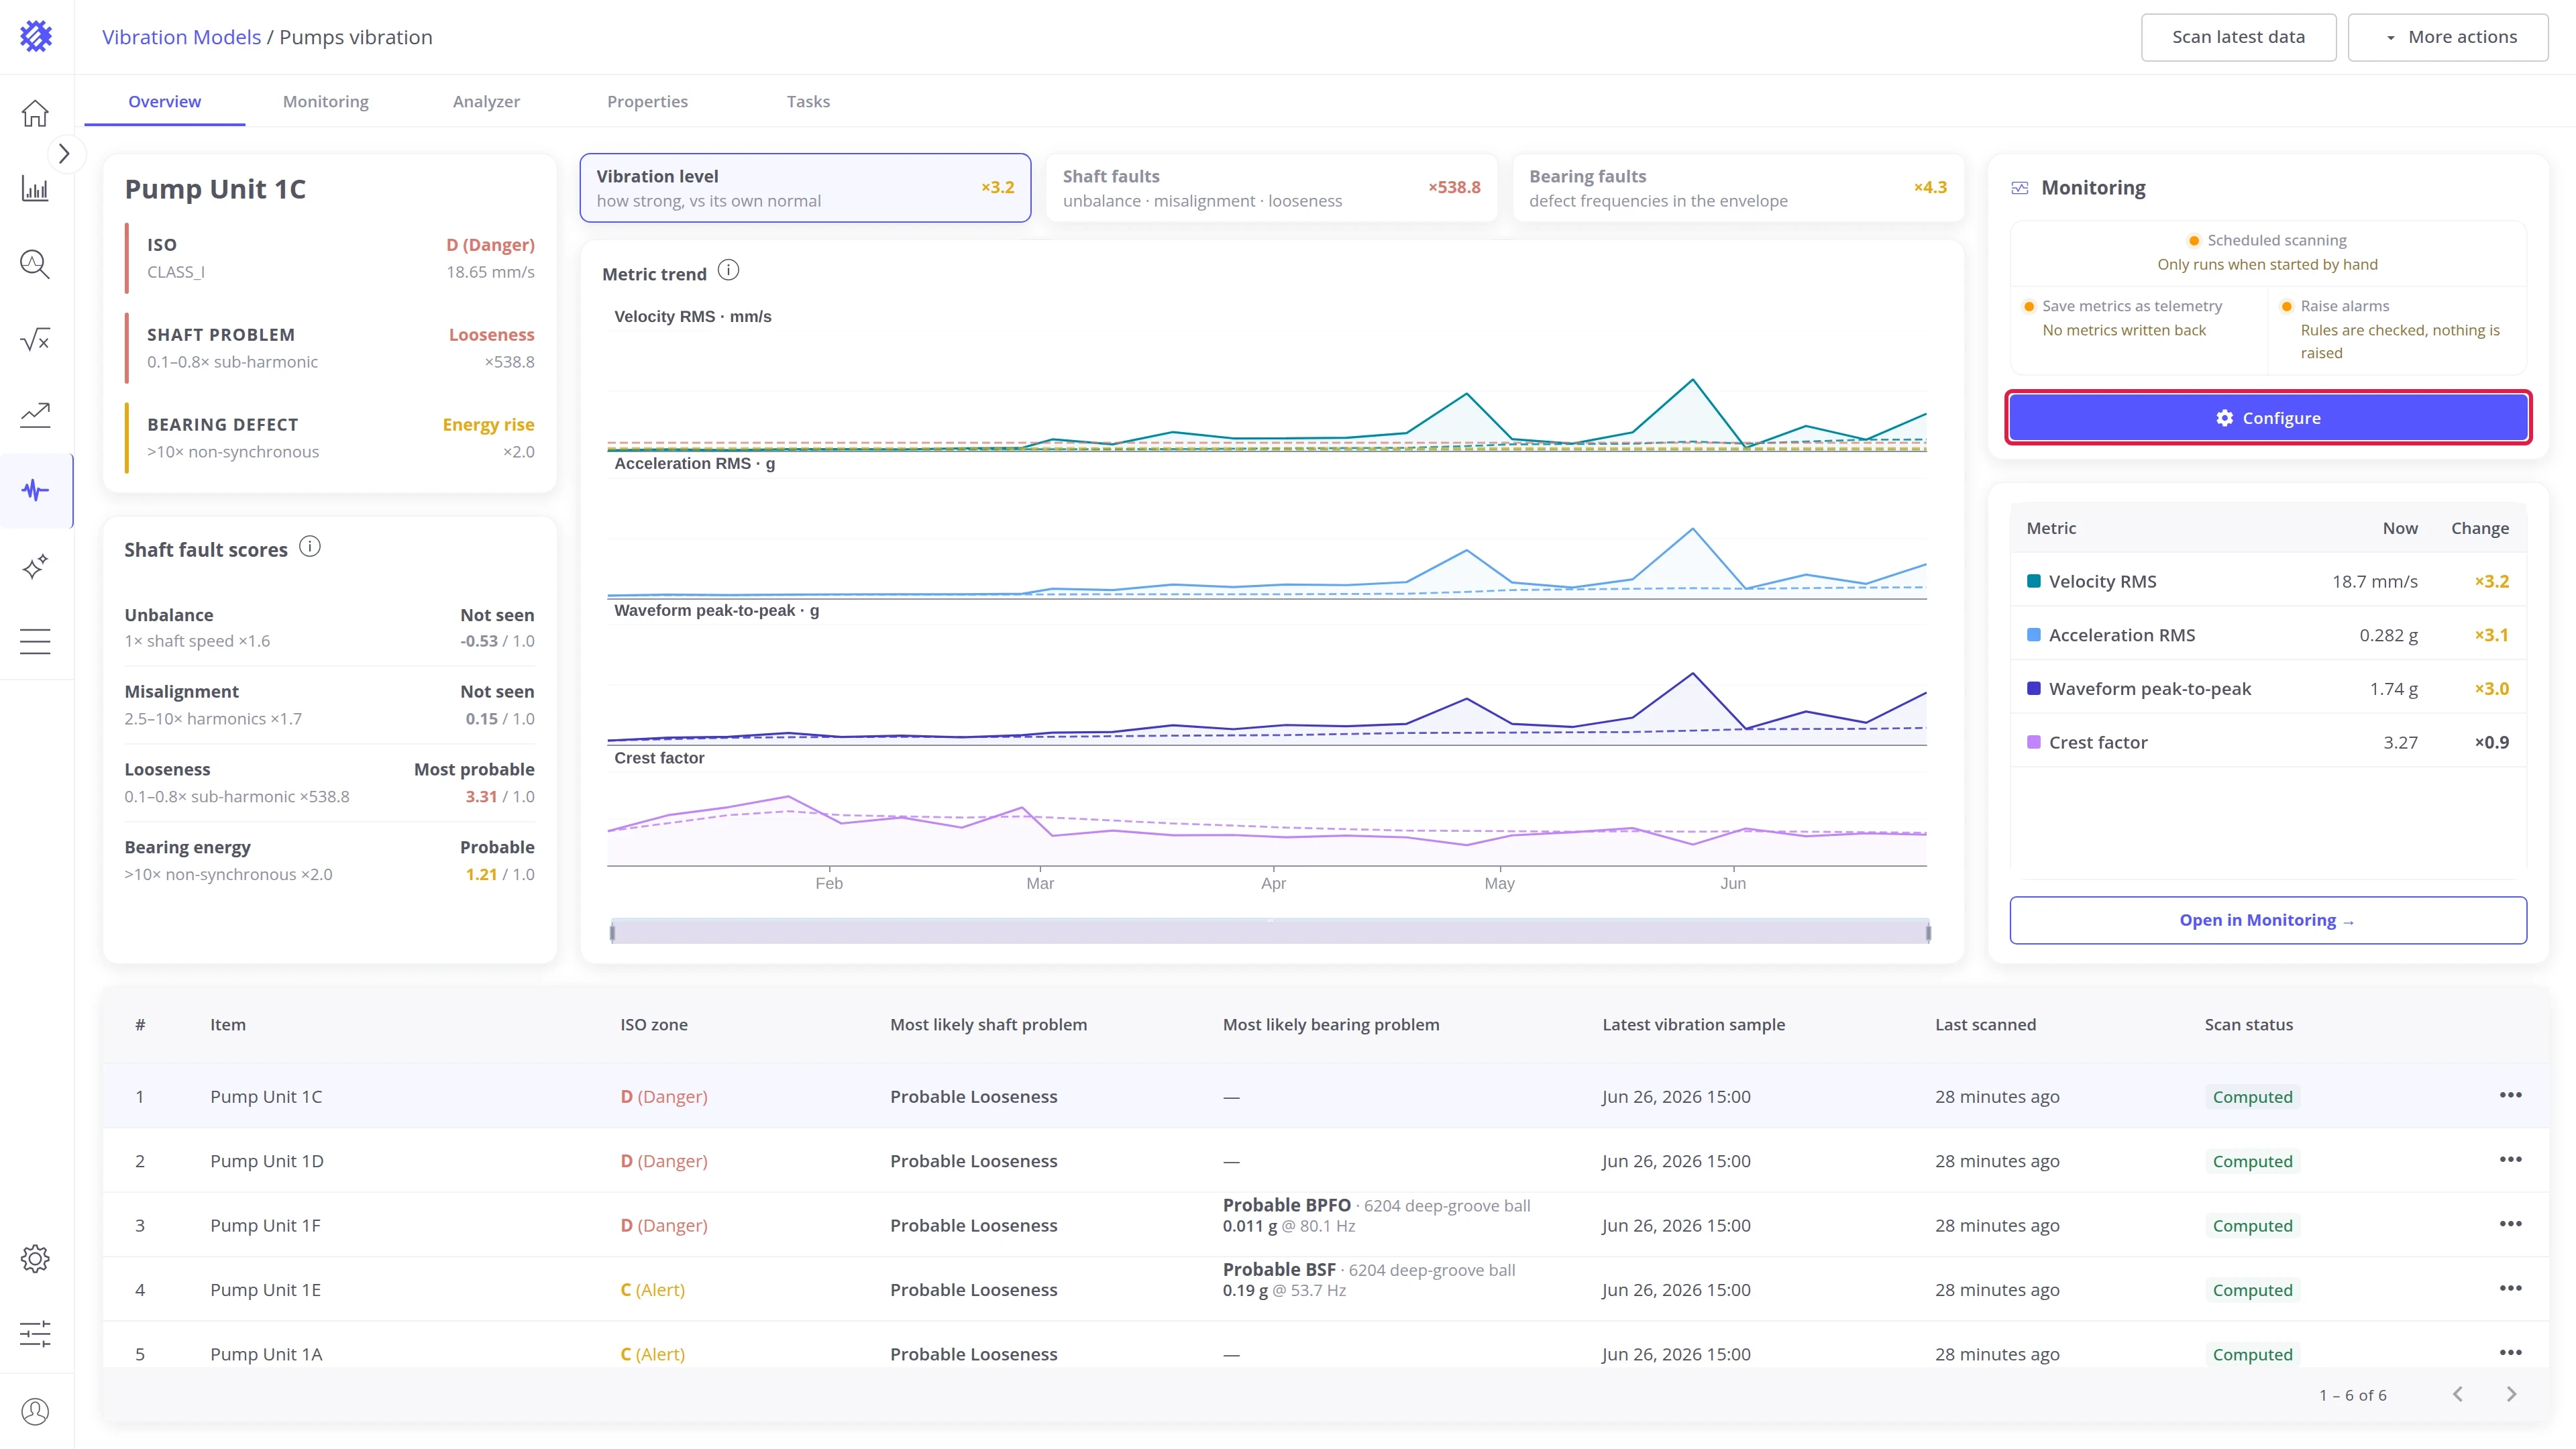
Section titled “Step 7. See the results”The model opens on the Overview tab, and results appear as the scan runs. Select a machine in the table to see its health and how it changes over time. The tab is described in Overview Tab.
Step 8. Keep it up to date
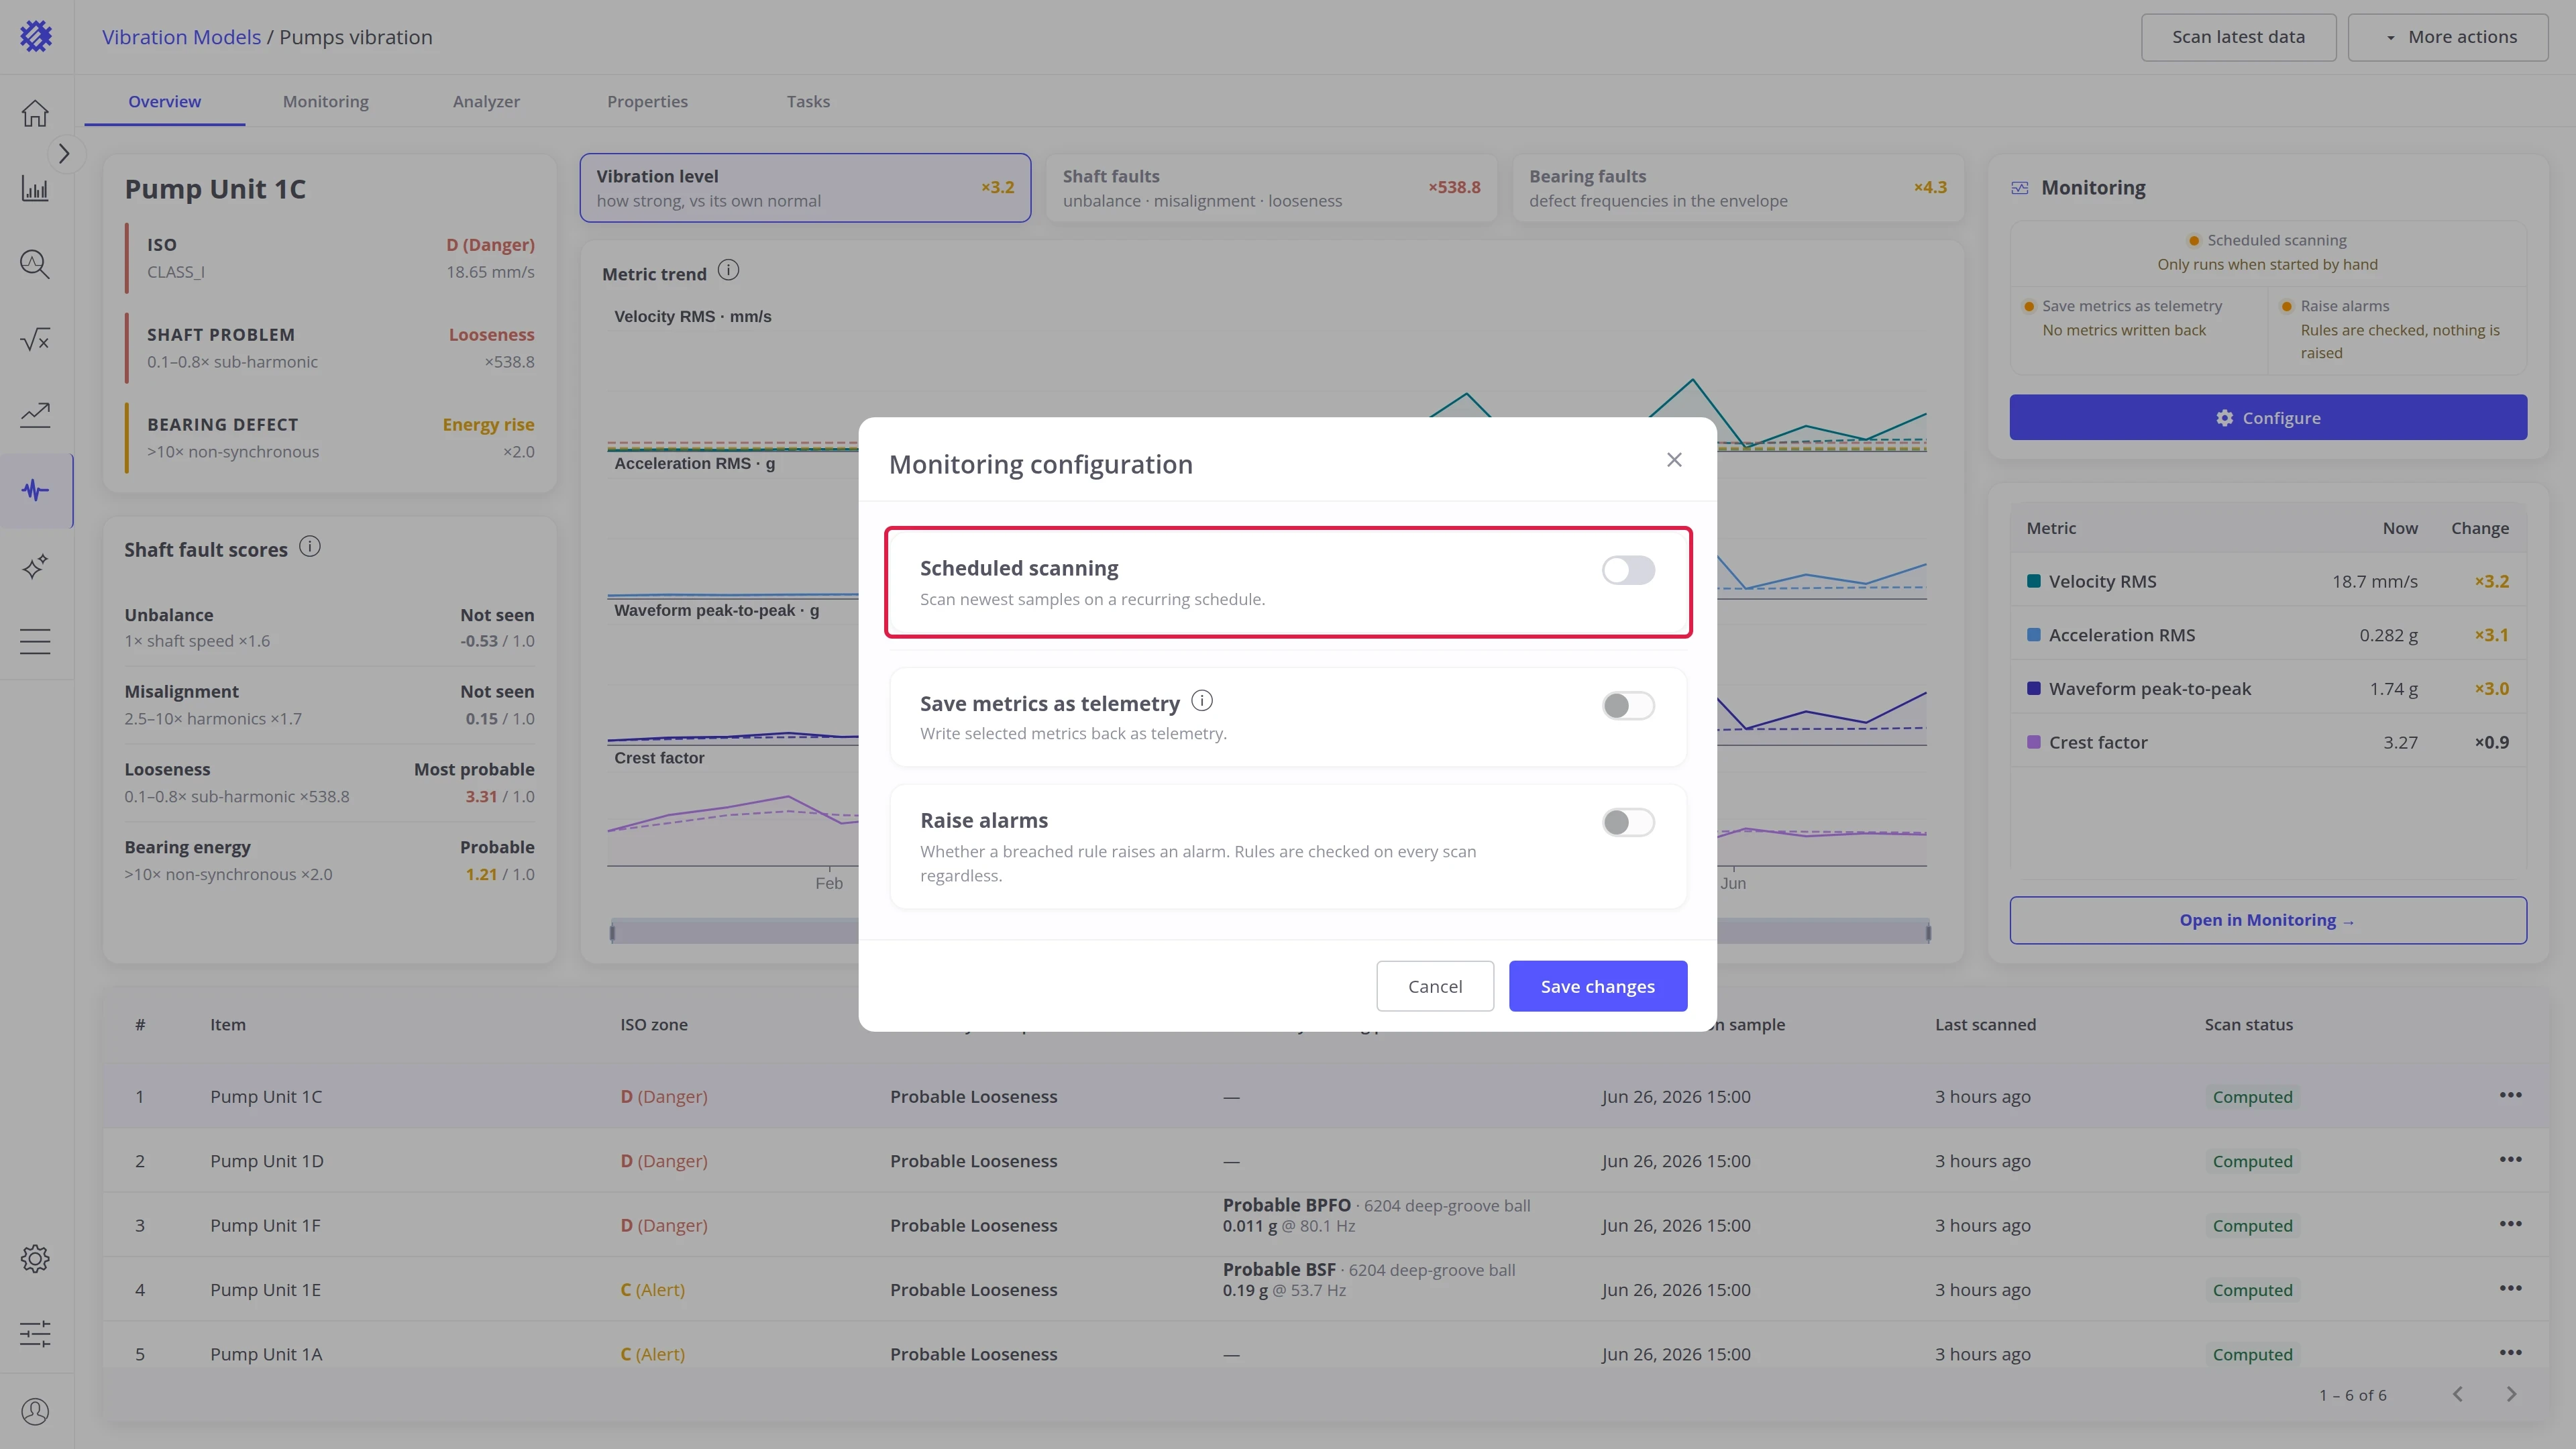
Section titled “Step 8. Keep it up to date”A new model scans once. To scan new samples as they arrive, click Configure on the Monitoring card of the Overview tab:
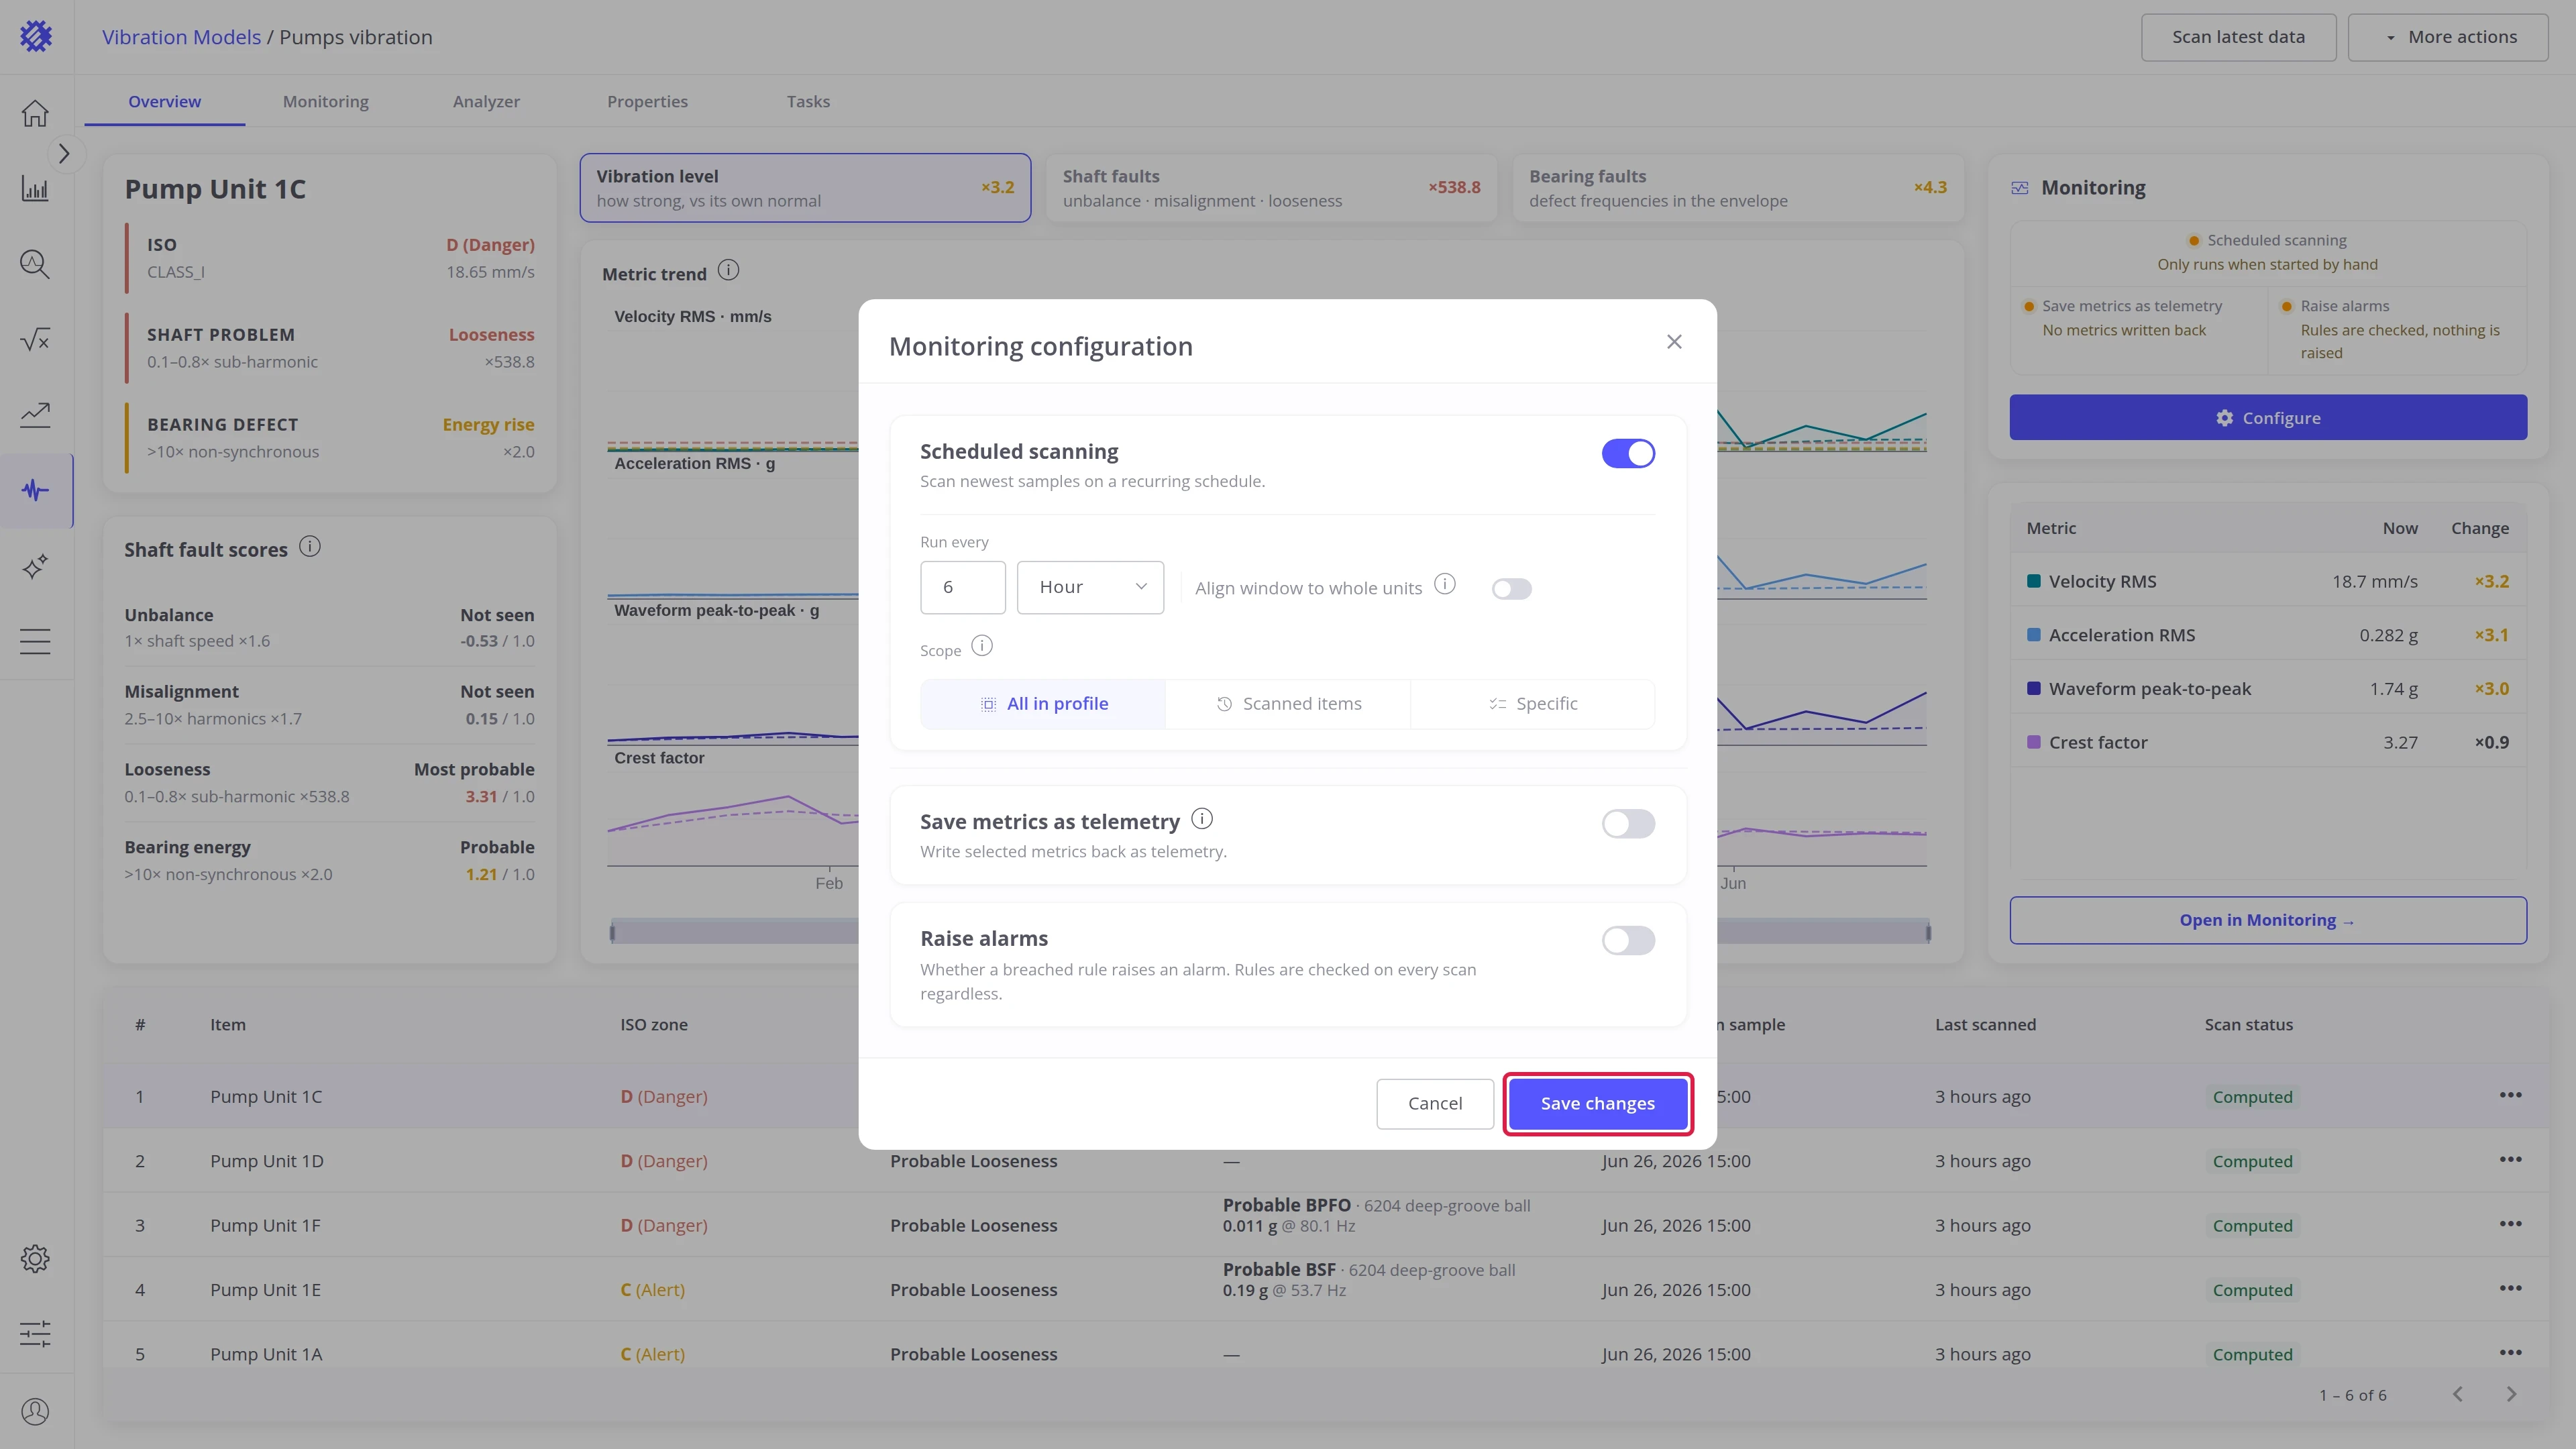
- Switch Scheduled scanning on and choose how often, for example every 6 hours.
- Click Save changes.
That’s it: the model now keeps its results current on its own.
Where to go next
Section titled “Where to go next”Explore the model
Section titled “Explore the model”-
Overview Tab
The verdict for each machine: ISO zone, shaft problem, and bearing defect.
-
Monitoring Tab
Each machine over time against its alarm rules, with the alarms raised.
-
Analyzer Tab
One sample in full: its waveform, spectrum, and envelope spectrum.
-
Properties Tab
Everything the model is configured with, and what a change costs.
Go further
Section titled “Go further”Was this helpful?