Vibration Monitoring & Alarm Rules
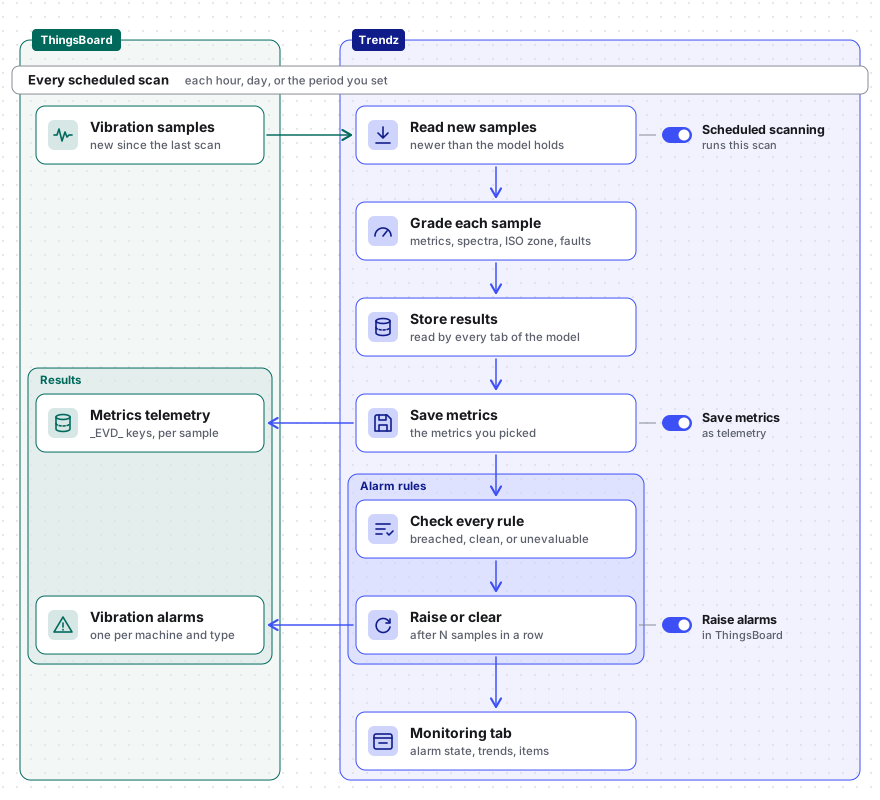
A vibration model scanned by hand is a snapshot. Monitoring turns it into a service: Trendz rescans the machines on a period you choose, grades every new sample, and reports what it finds, as telemetry in ThingsBoard, as alarms, or both.
What continuous monitoring does
Section titled “What continuous monitoring does”A scheduled run works like a manual scan: it analyzes new samples and grades each machine. Three switches decide what happens next:
| Switch | What the model does with each run |
|---|---|
| Scheduled scanning | Runs the scan itself, every hour, day, or whatever period you set |
| Save metrics as telemetry | Writes the metrics of every scanned sample back to ThingsBoard, under keys the model owns |
| Raise alarms | Raises a ThingsBoard alarm when an alarm rule is breached |
Set up continuous monitoring
Section titled “Set up continuous monitoring”Monitoring is off on a new model. Turn on Scheduled scanning, and the model rescans its machines by itself.
-
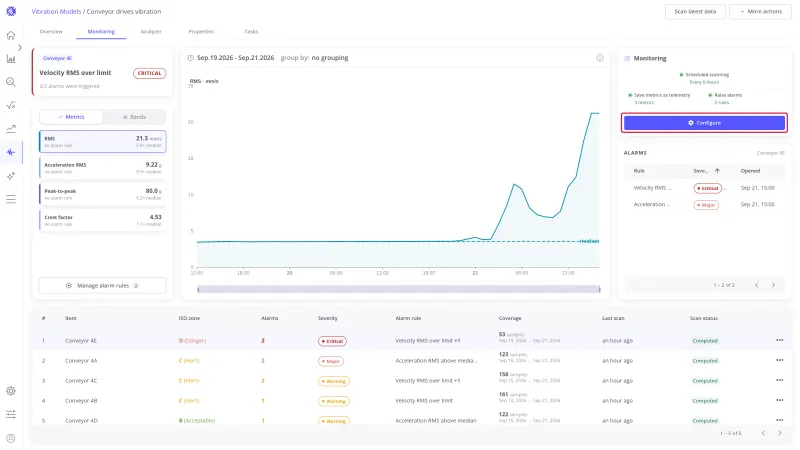
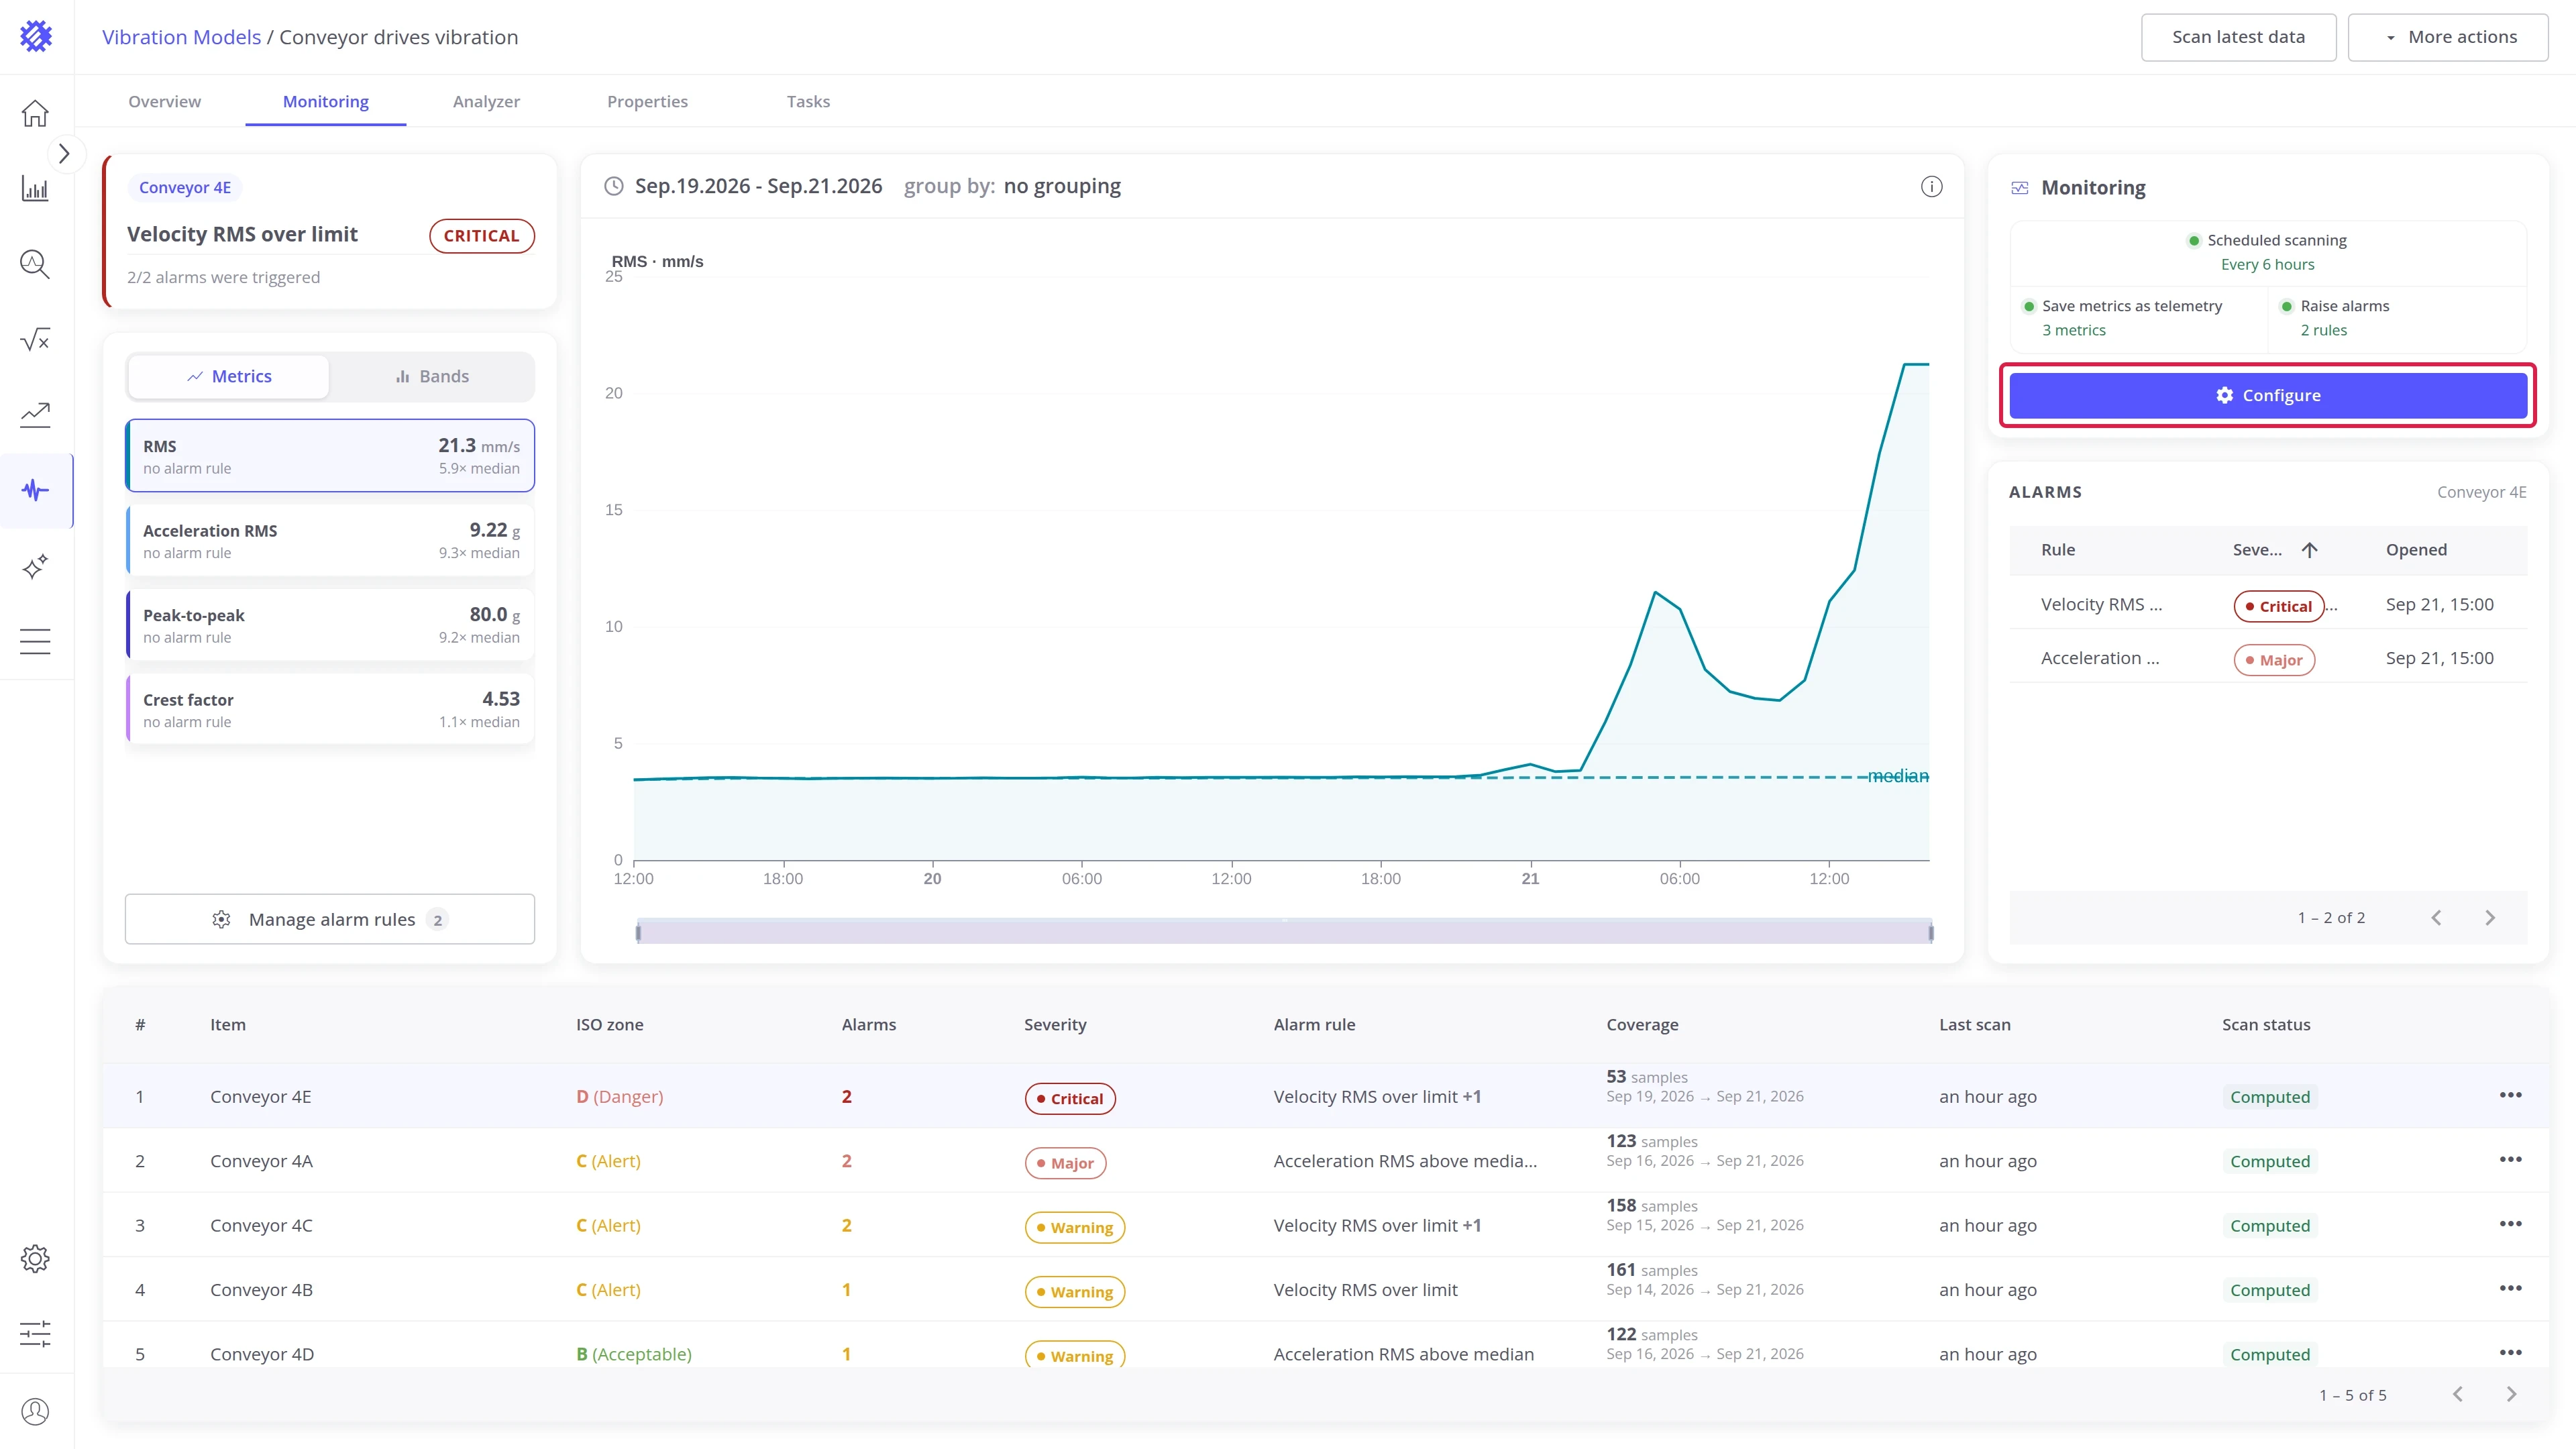
Open the model and click Configure on the Monitoring card. It sits on the Overview and the Monitoring tab.
-
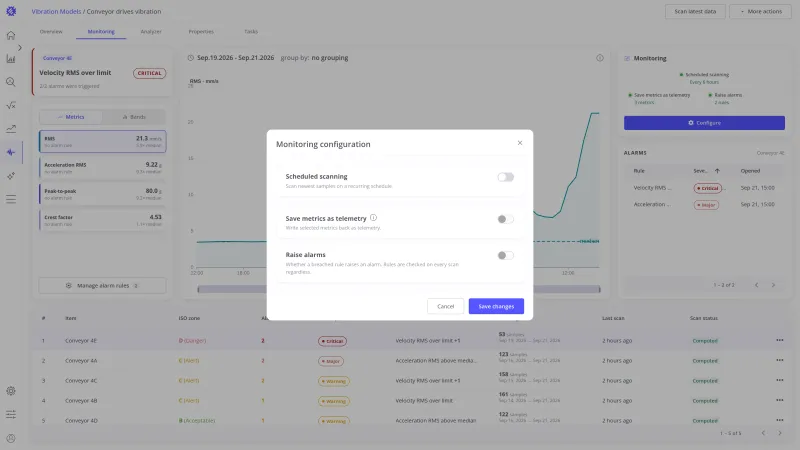
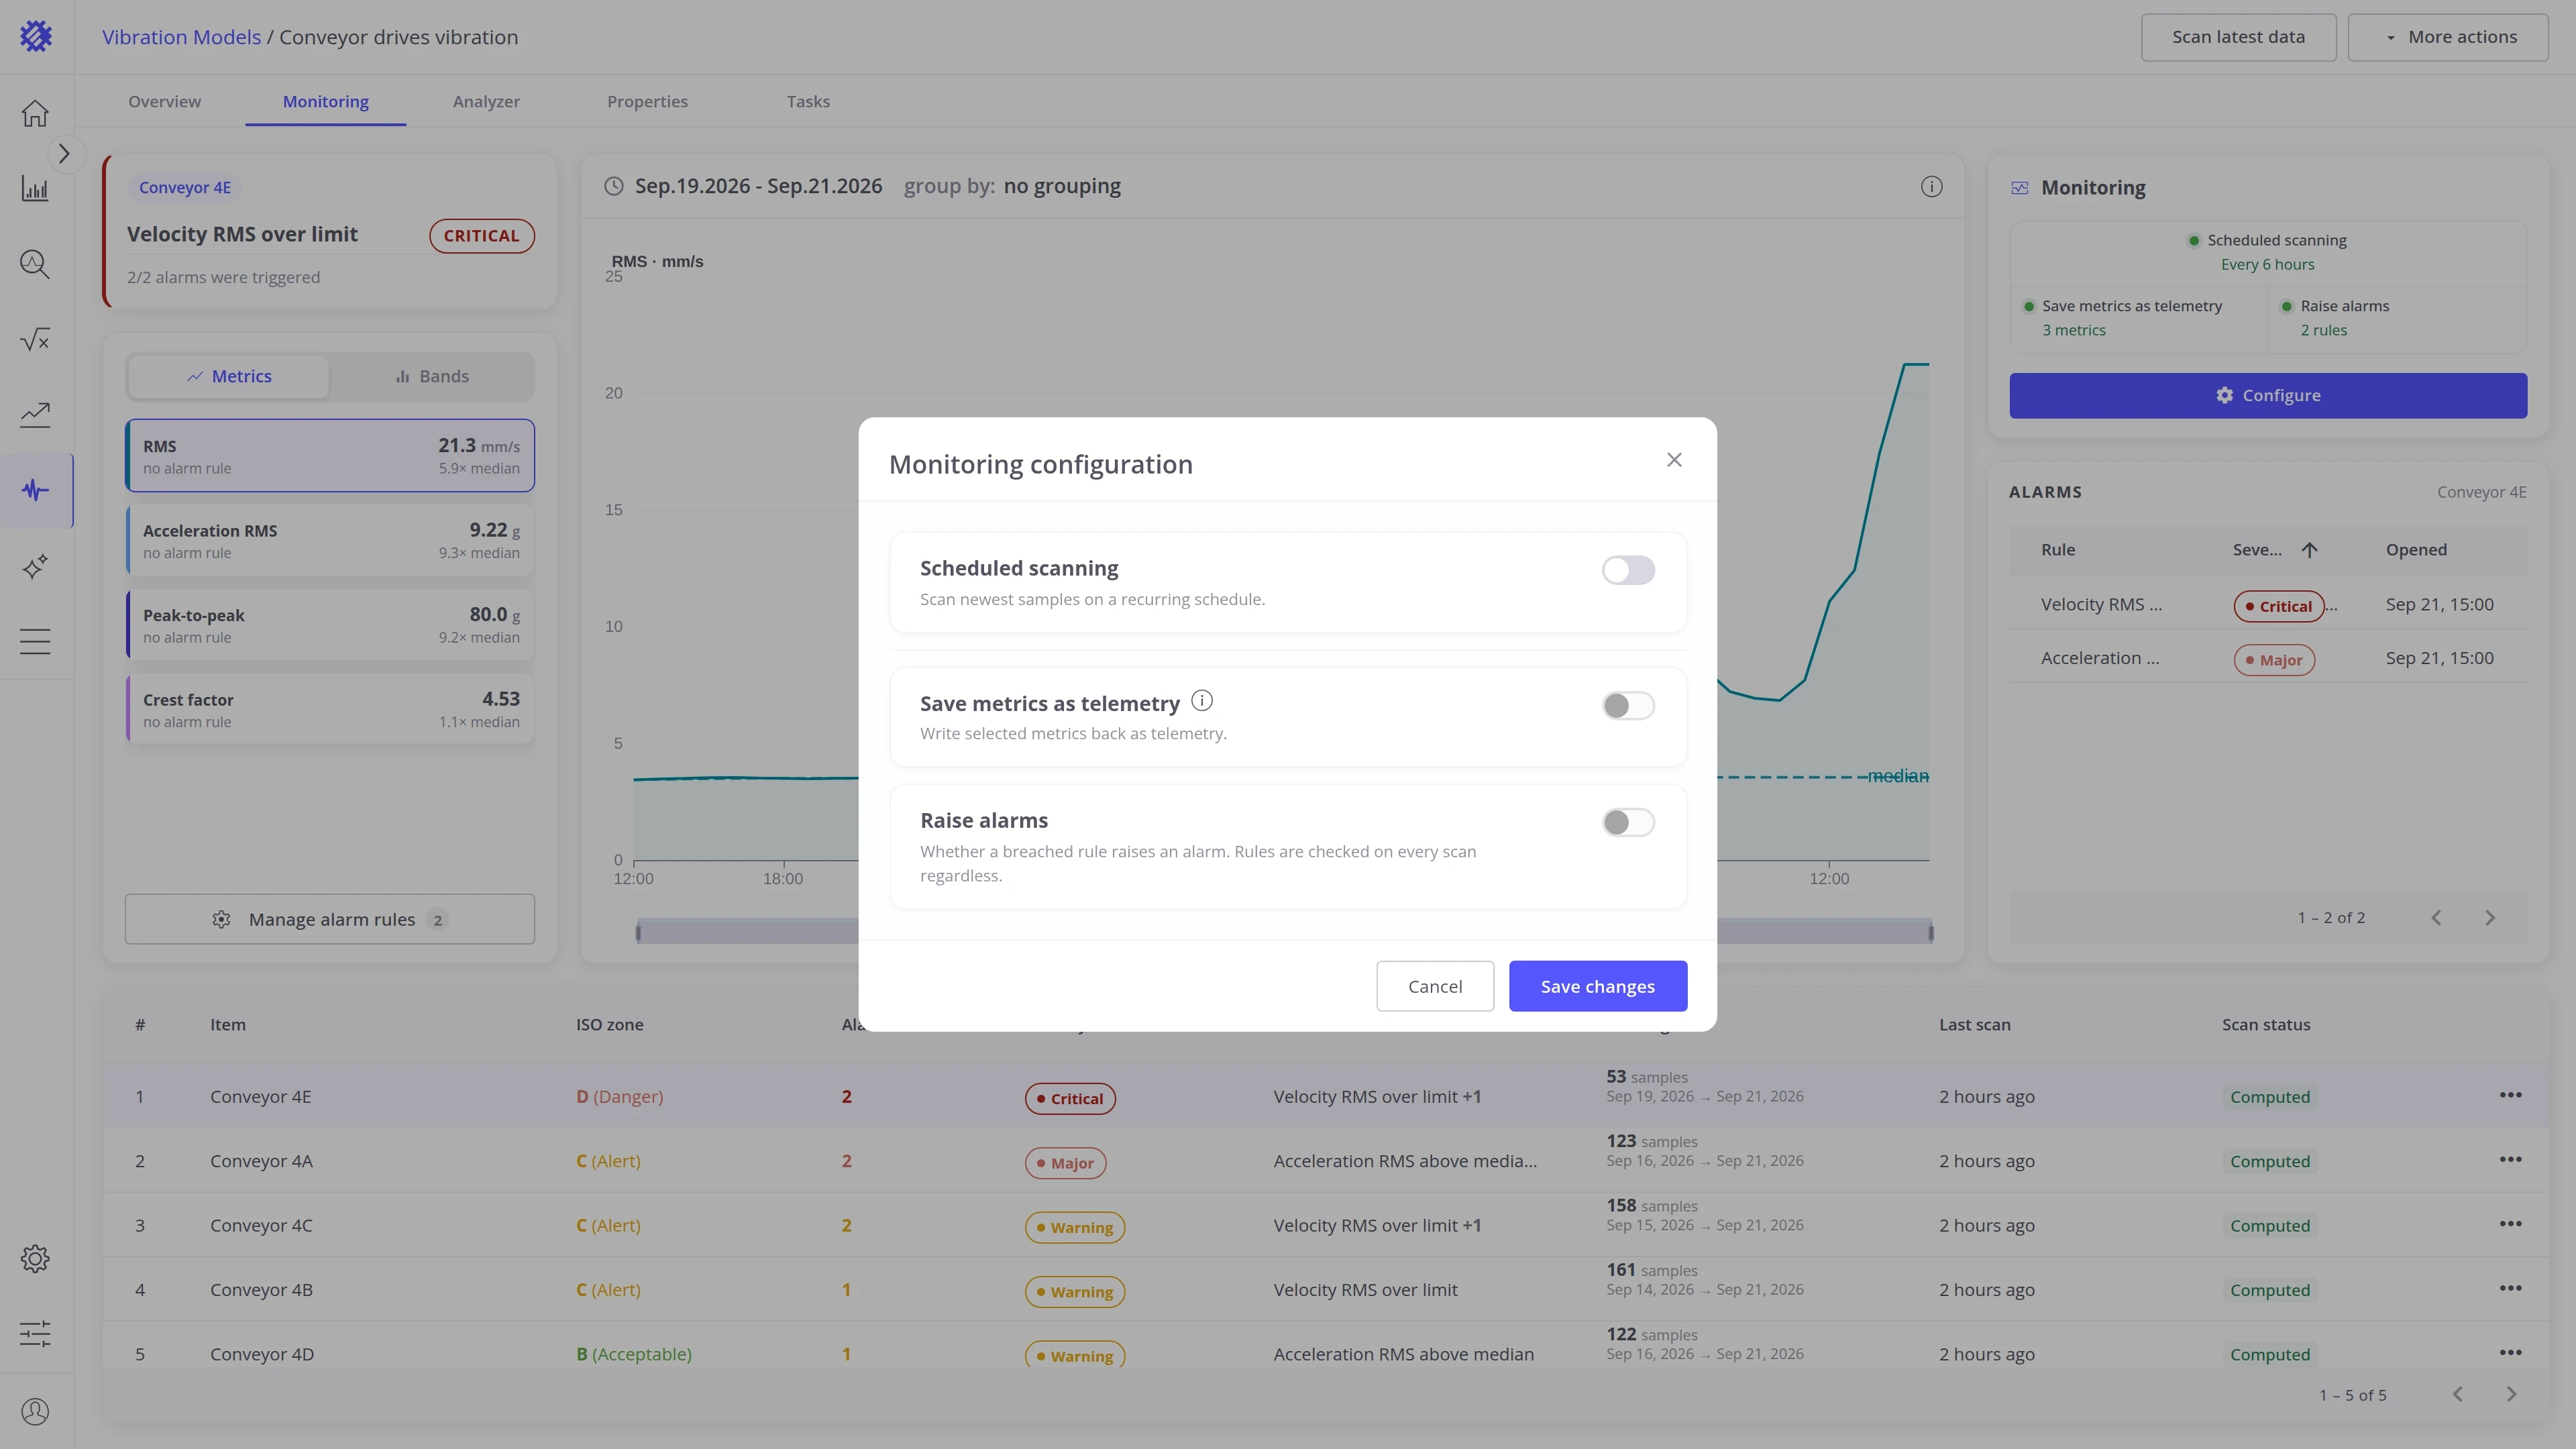
The dialog holds the three switches. When all are off, the model is scanned only when you start a scan by hand, writes nothing back to ThingsBoard, and raises no alarms.
-
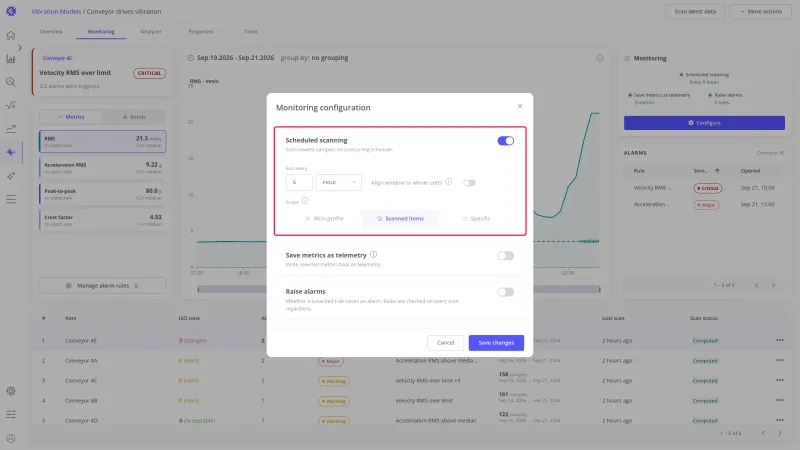
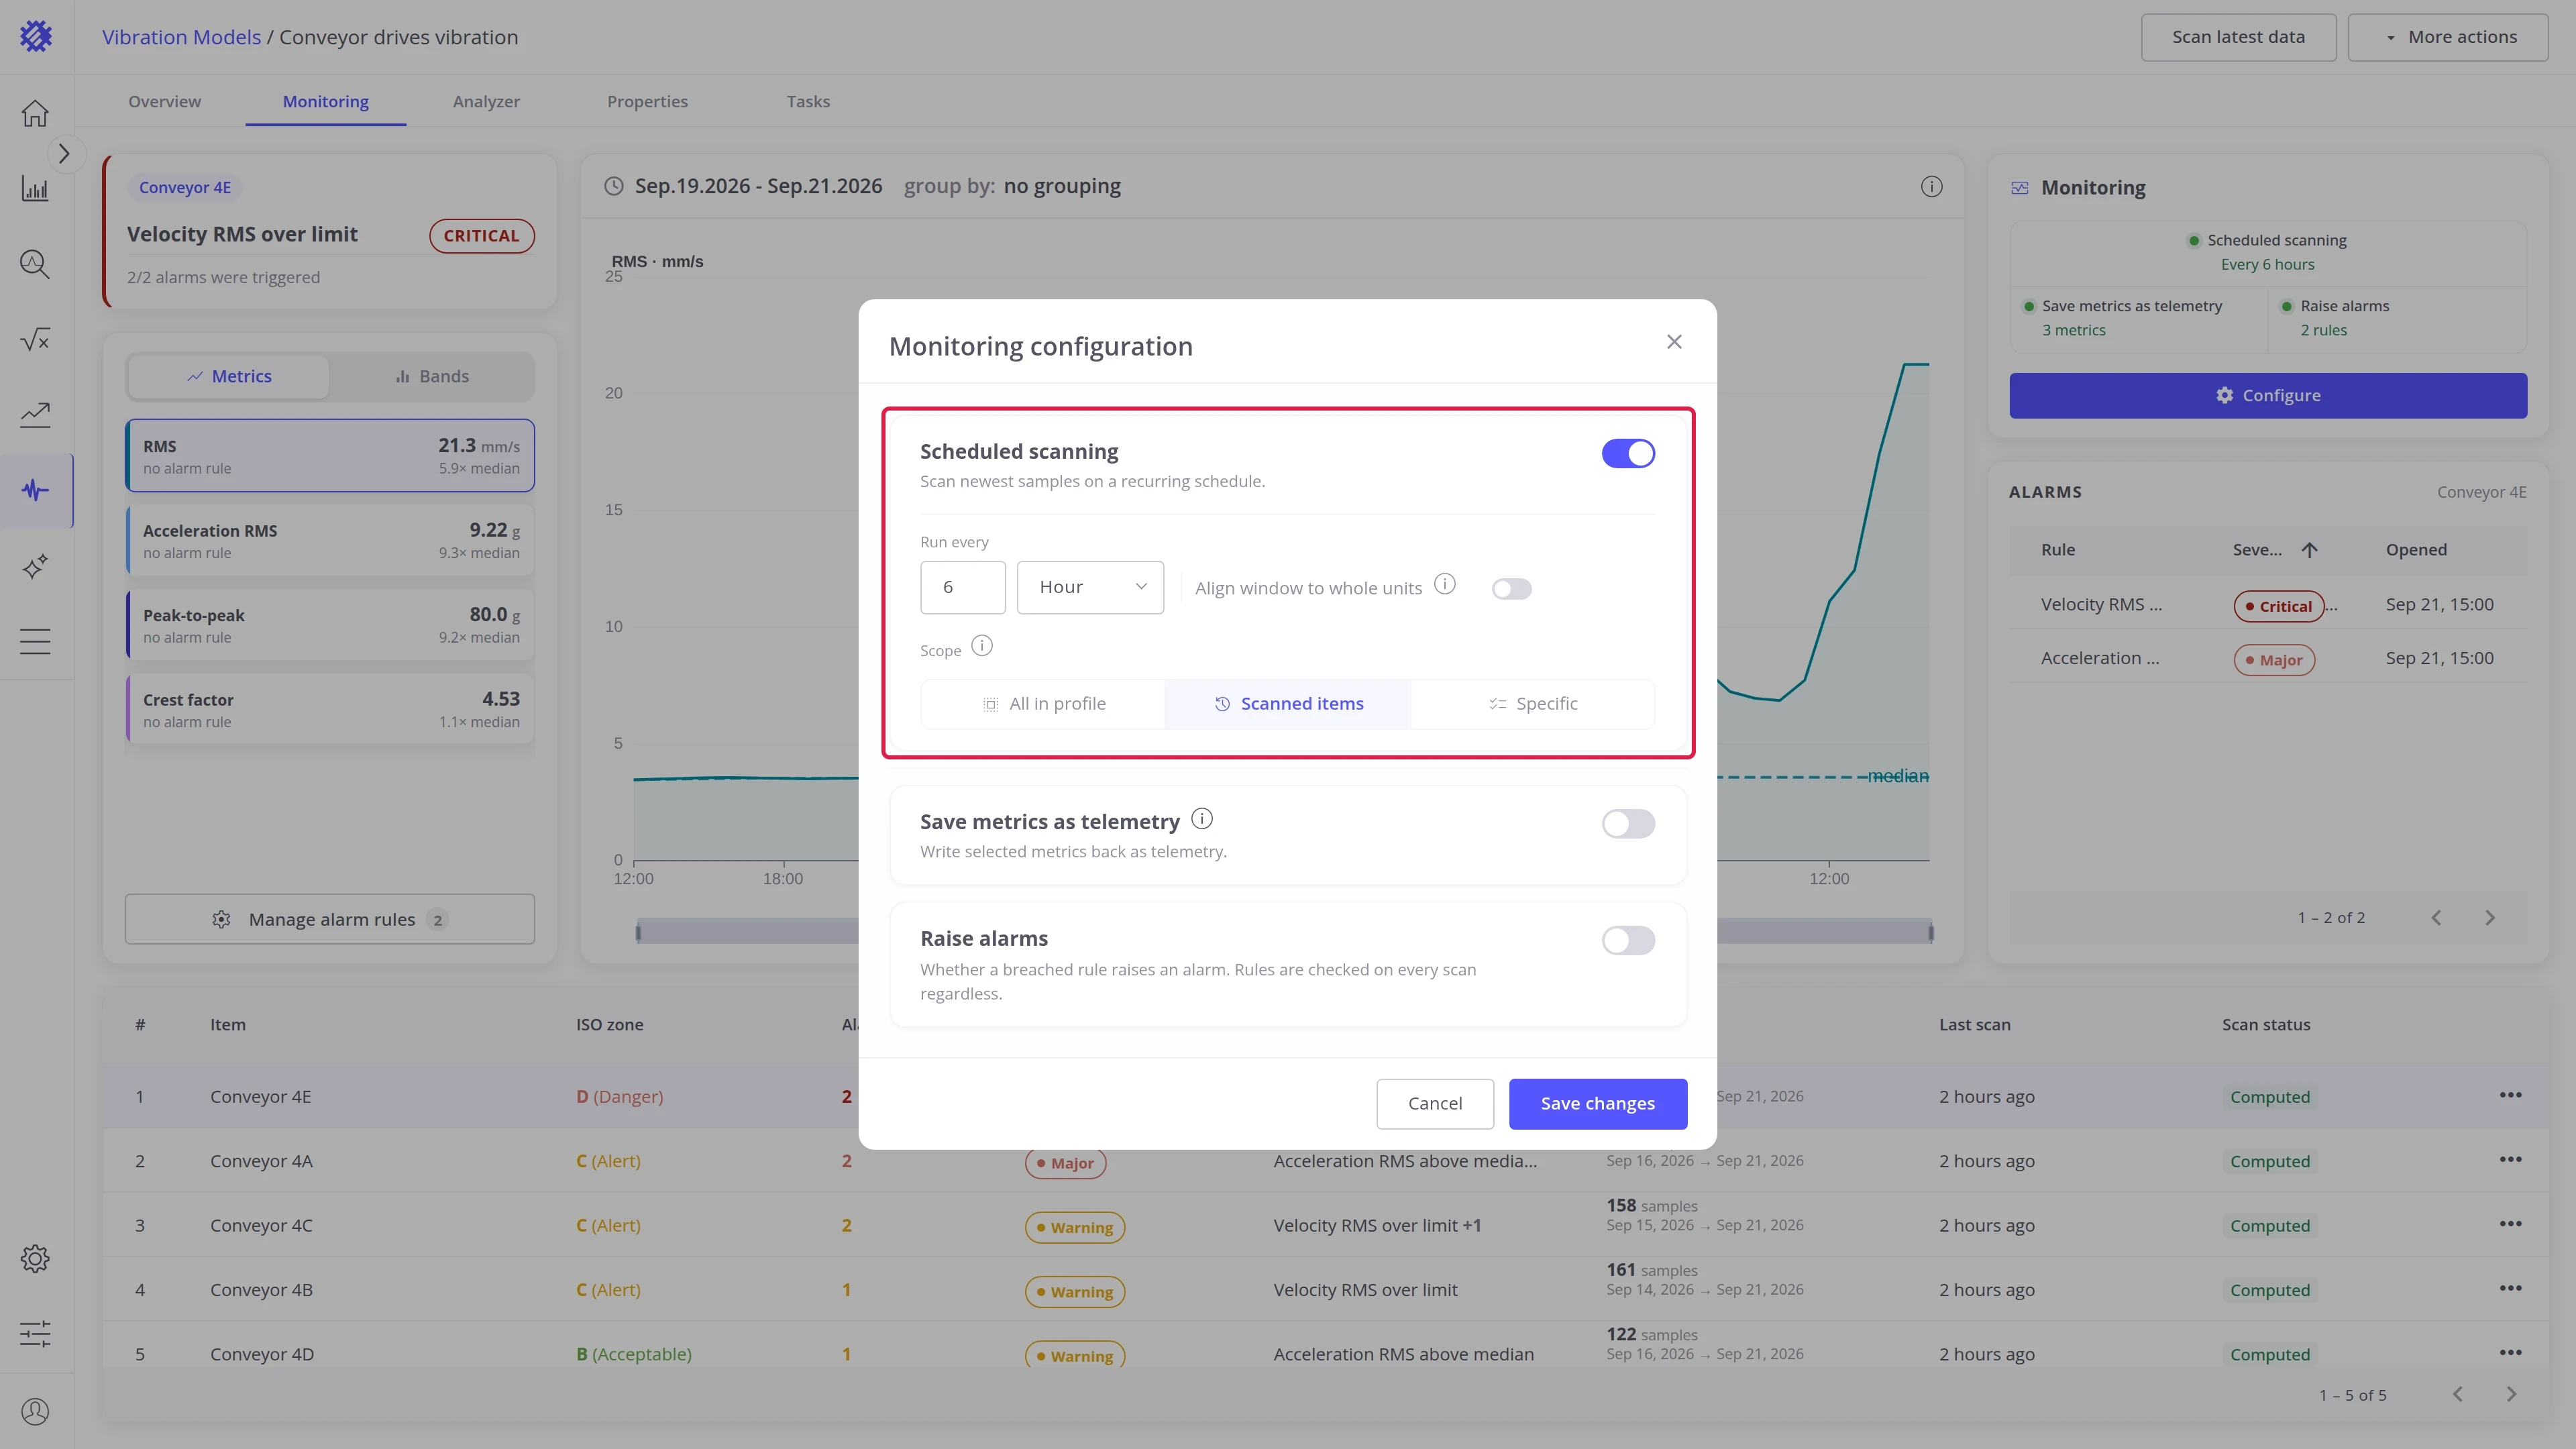
Switch Scheduled scanning on and set how the model scans itself.
Field Description Run every How often the scan runs, as a count and a unit Align window to whole units Windows start on whole units: a 6-hour window at 00:00, 06:00, 12:00, 18:00 Scope All in profile covers every item the profile holds, Scanned items only the ones already scanned, Specific the machines you list Pick the period from how often the sensors deliver: a scan finds nothing if it runs more often than the machines report, and a fault develops unseen if it runs far less often.
-
Click Save changes. The model now rescans itself every period and keeps its own results current.
That is enough to keep a model up to date. What a run then does with its results is the other two switches, each in its own section: Save metrics as telemetry writes the numbers back to ThingsBoard, and Raise alarms turns breached rules into ThingsBoard alarms.
Save metrics as telemetry
Section titled “Save metrics as telemetry”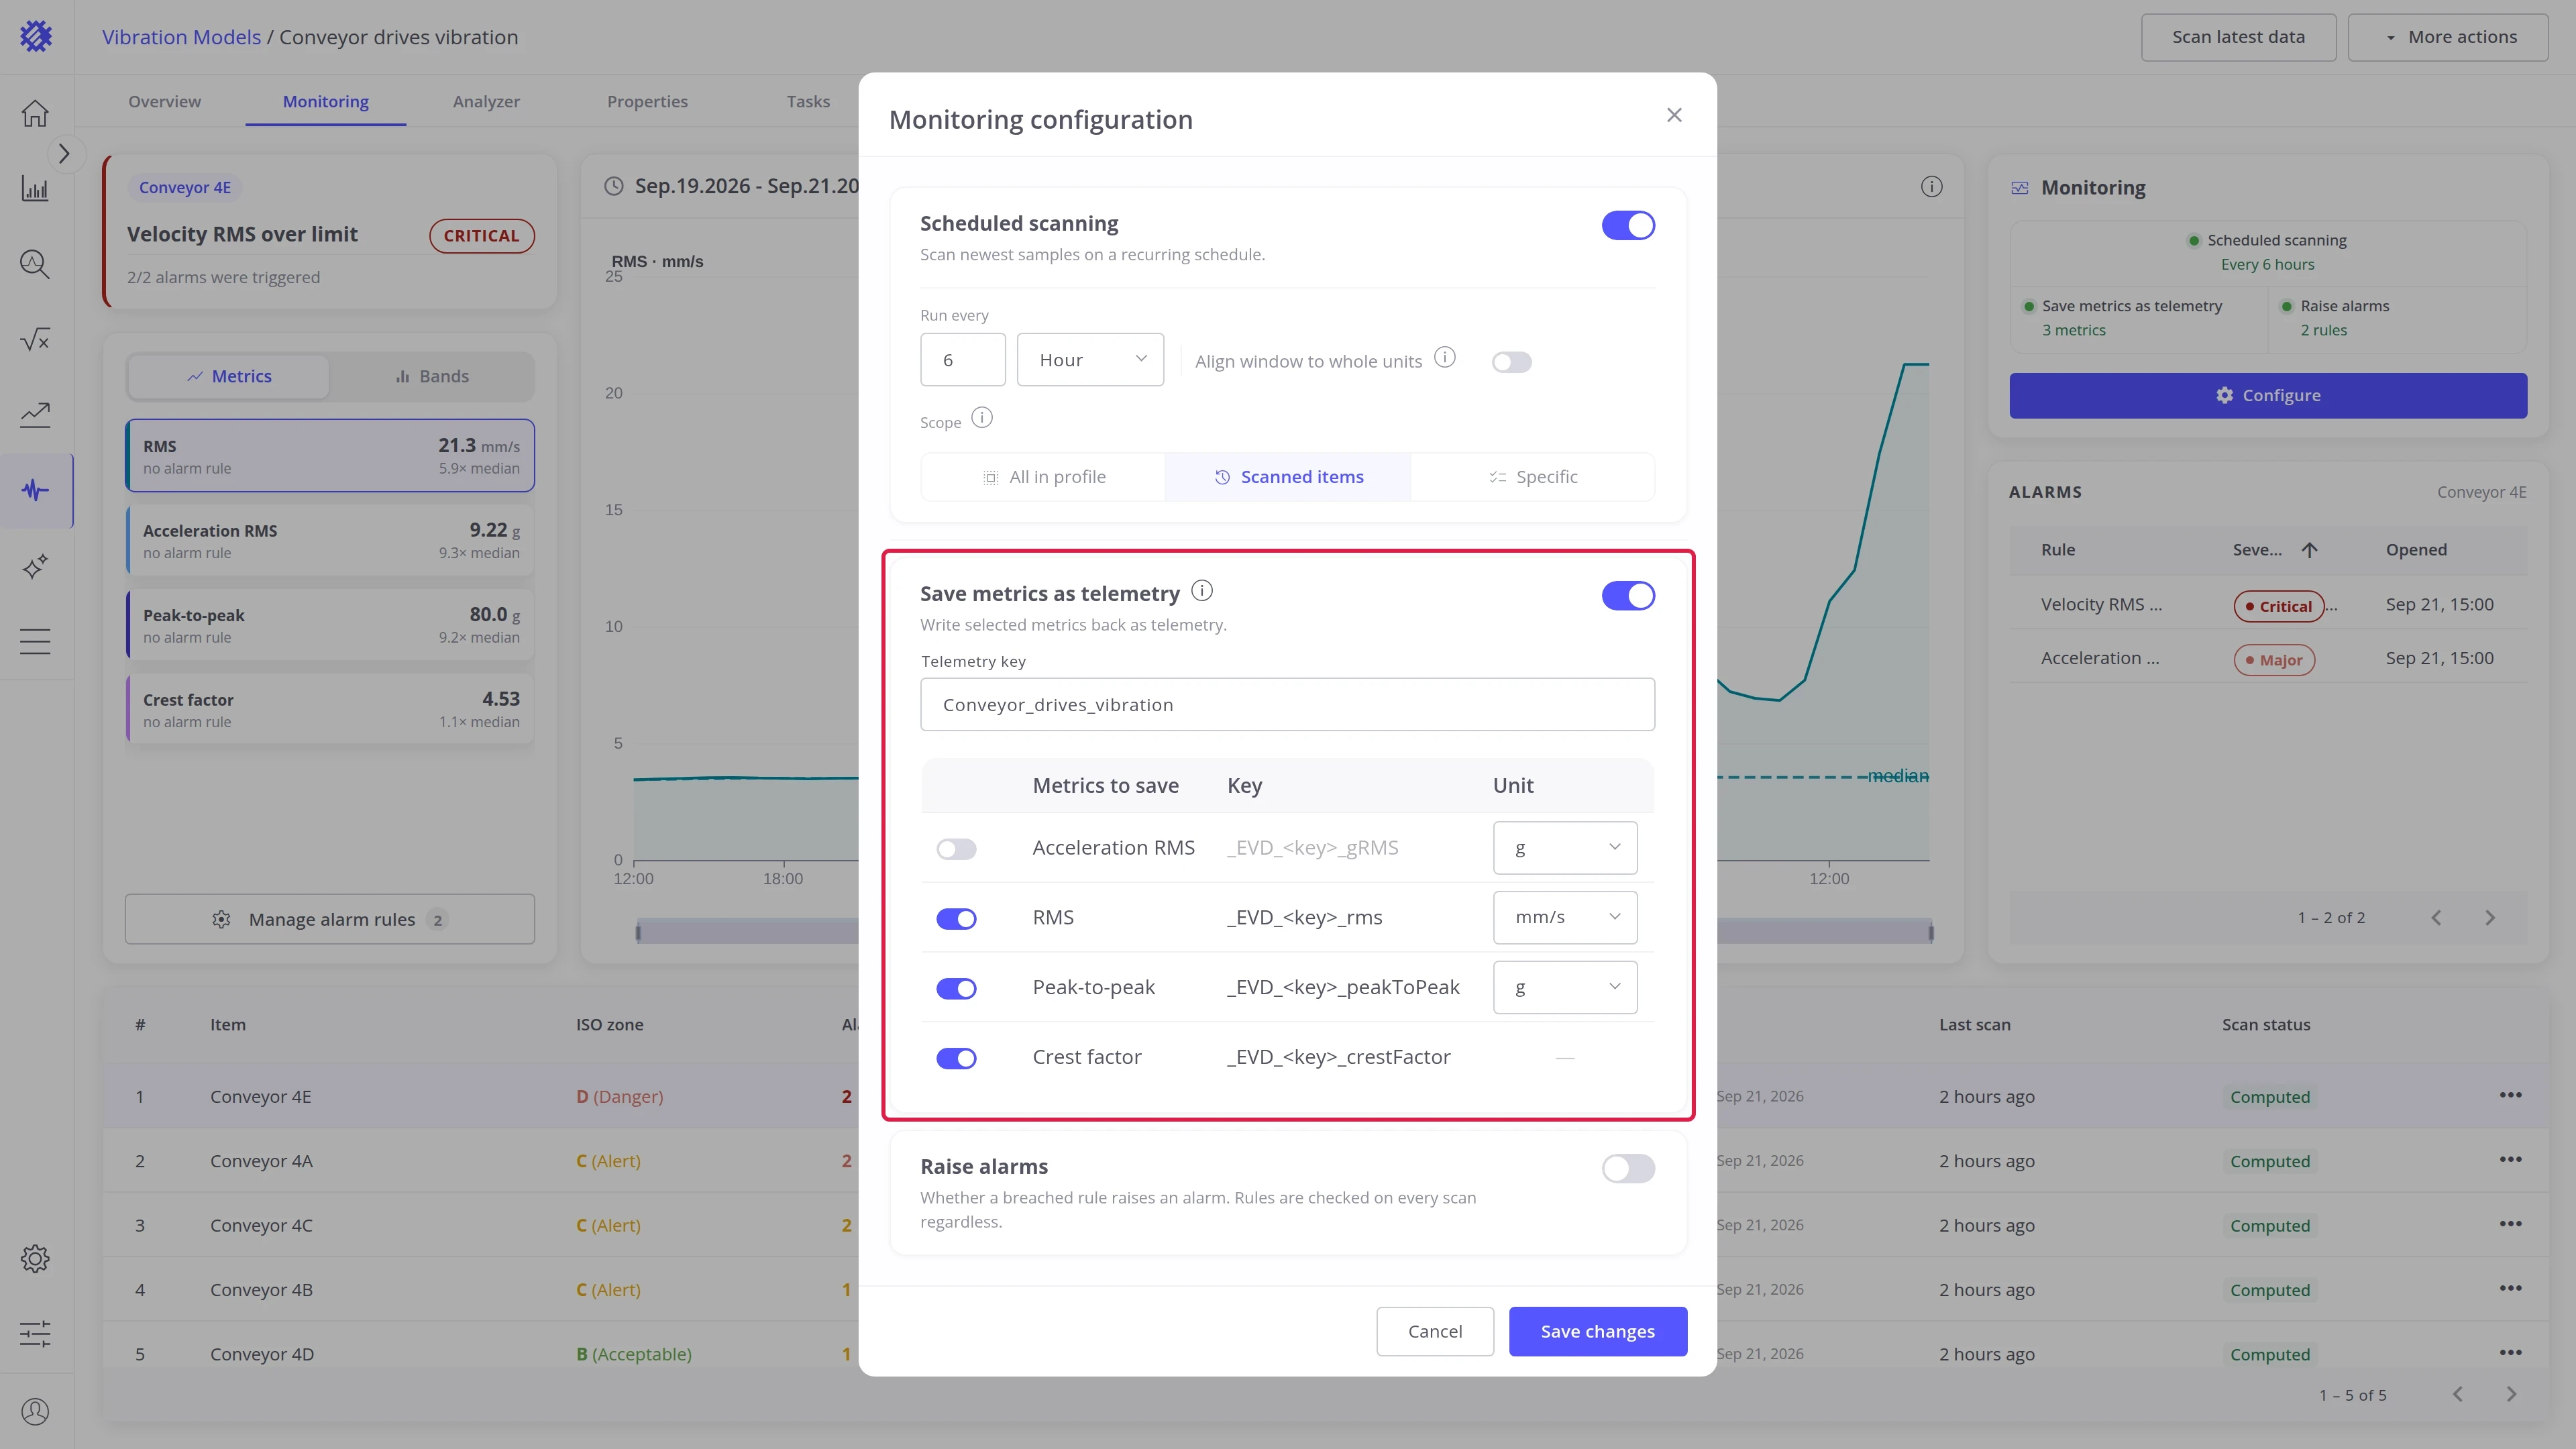
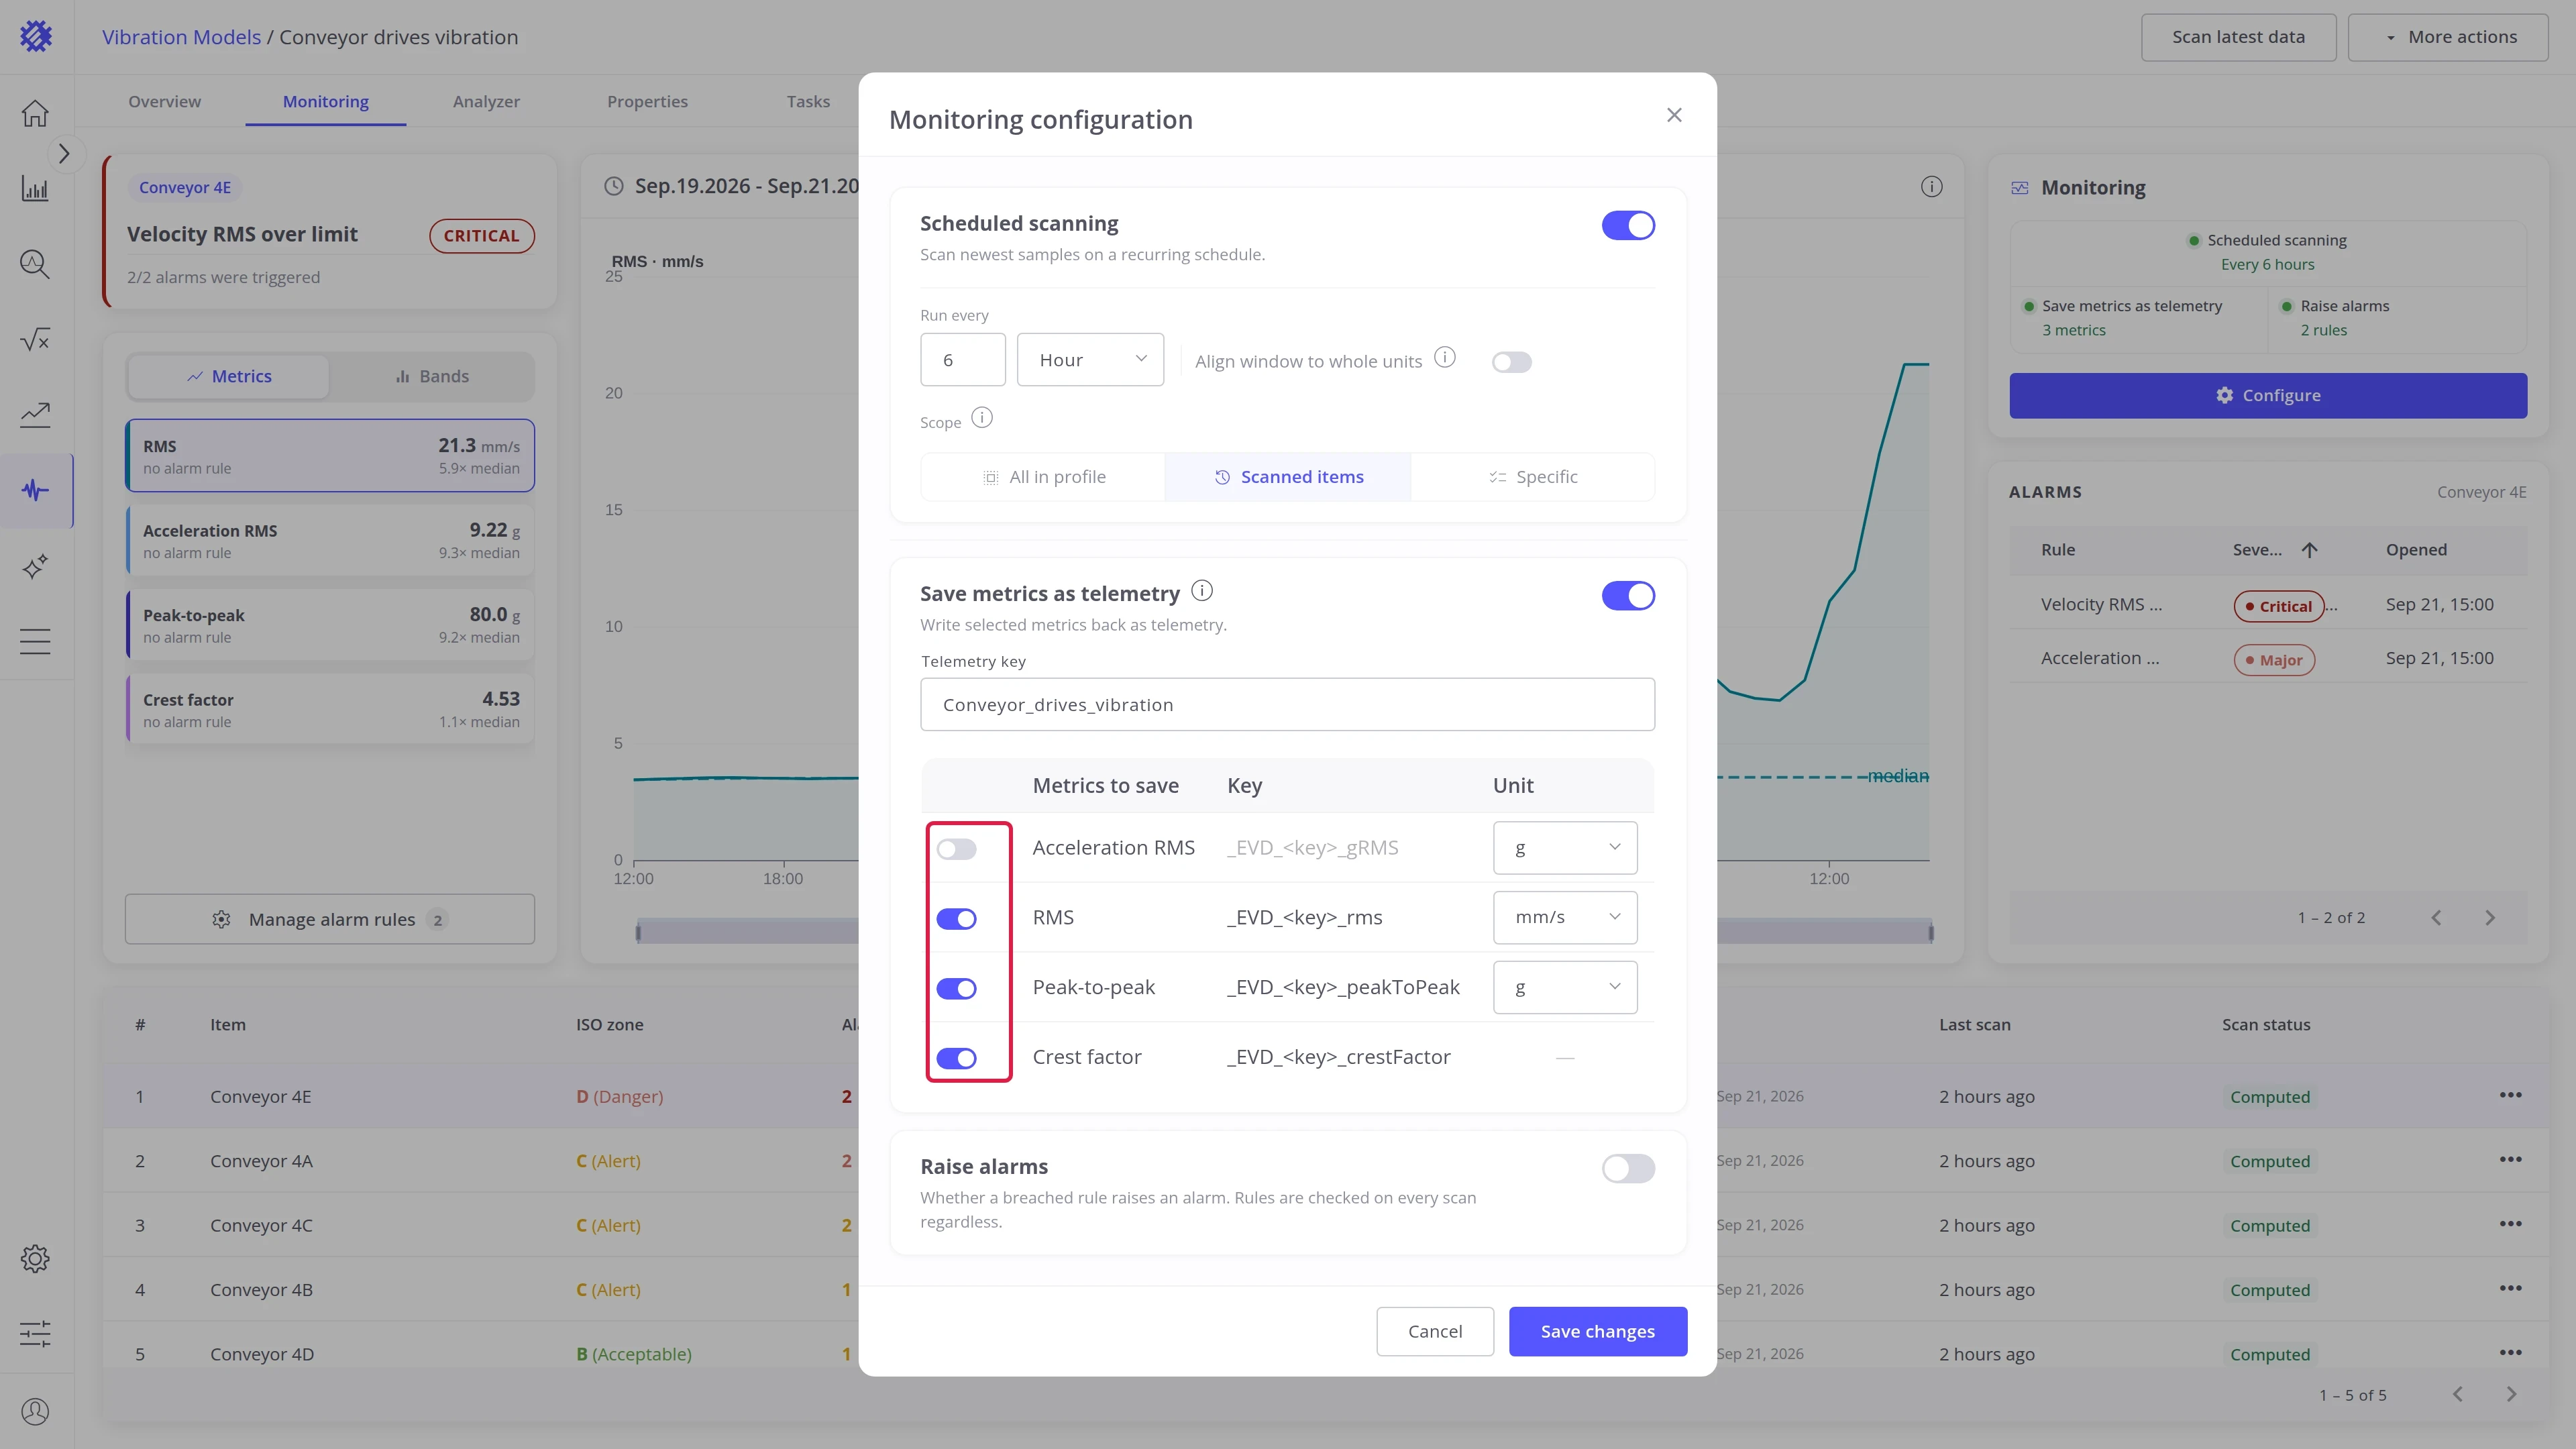
Switch it on in the same dialog, give the export a Telemetry key, and pick the metrics to write in the Metrics to save table. Each scanned sample then writes its metrics at the sample’s own timestamp, under keys built from that key:
| Key | Holds |
|---|---|
_EVD_<telemetry key>_rms |
Velocity RMS |
_EVD_<telemetry key>_gRMS |
Acceleration RMS |
_EVD_<telemetry key>_peakToPeak |
Waveform peak-to-peak |
_EVD_<telemetry key>_crestFactor |
Crest factor |
On a multi-axis model the axis label sits between the key and the metric,
_EVD_<telemetry key>_<axis>_<metric>, and Axes to save picks the axes. The _EVD_ prefix is reserved for
this export, so the keys are never mistaken for the device’s own telemetry.
You choose what is written in the Metrics to save table:
- Switch a metric off to stop writing it. Only the metrics that are on get a key.
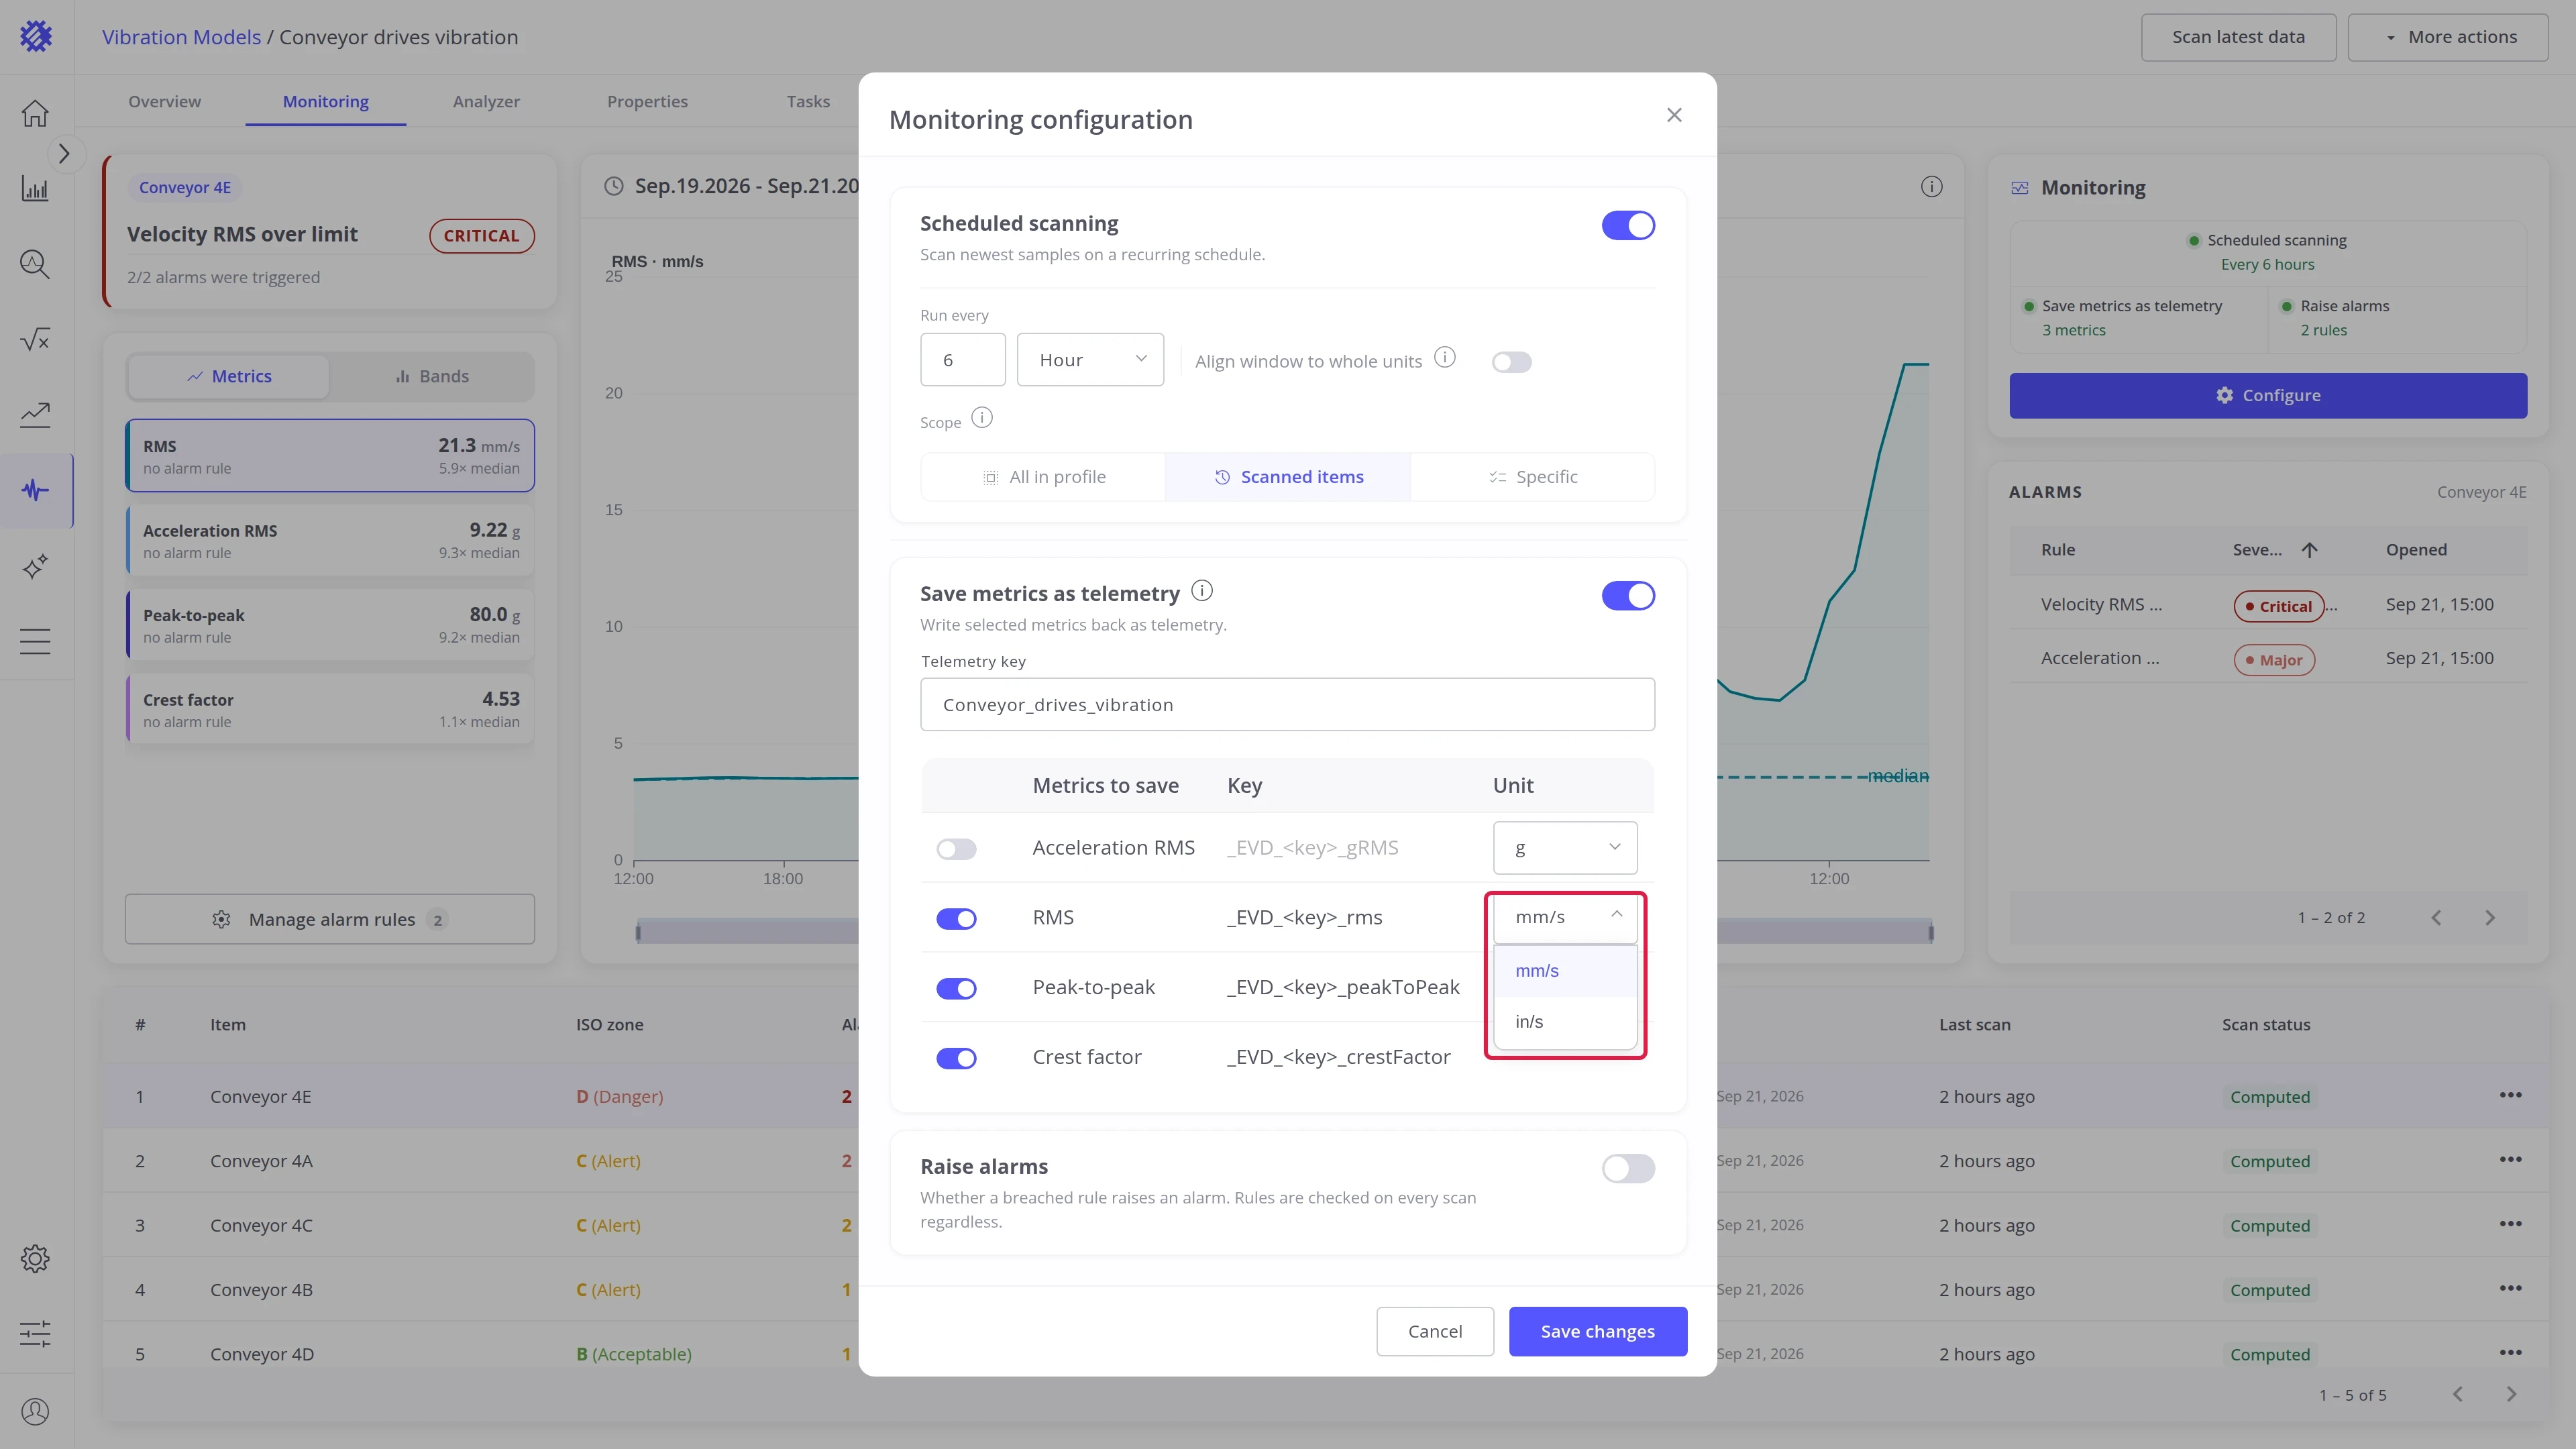
- Change the unit a metric is written in, for example in/s instead of mm/s for RMS. Crest factor has no unit.
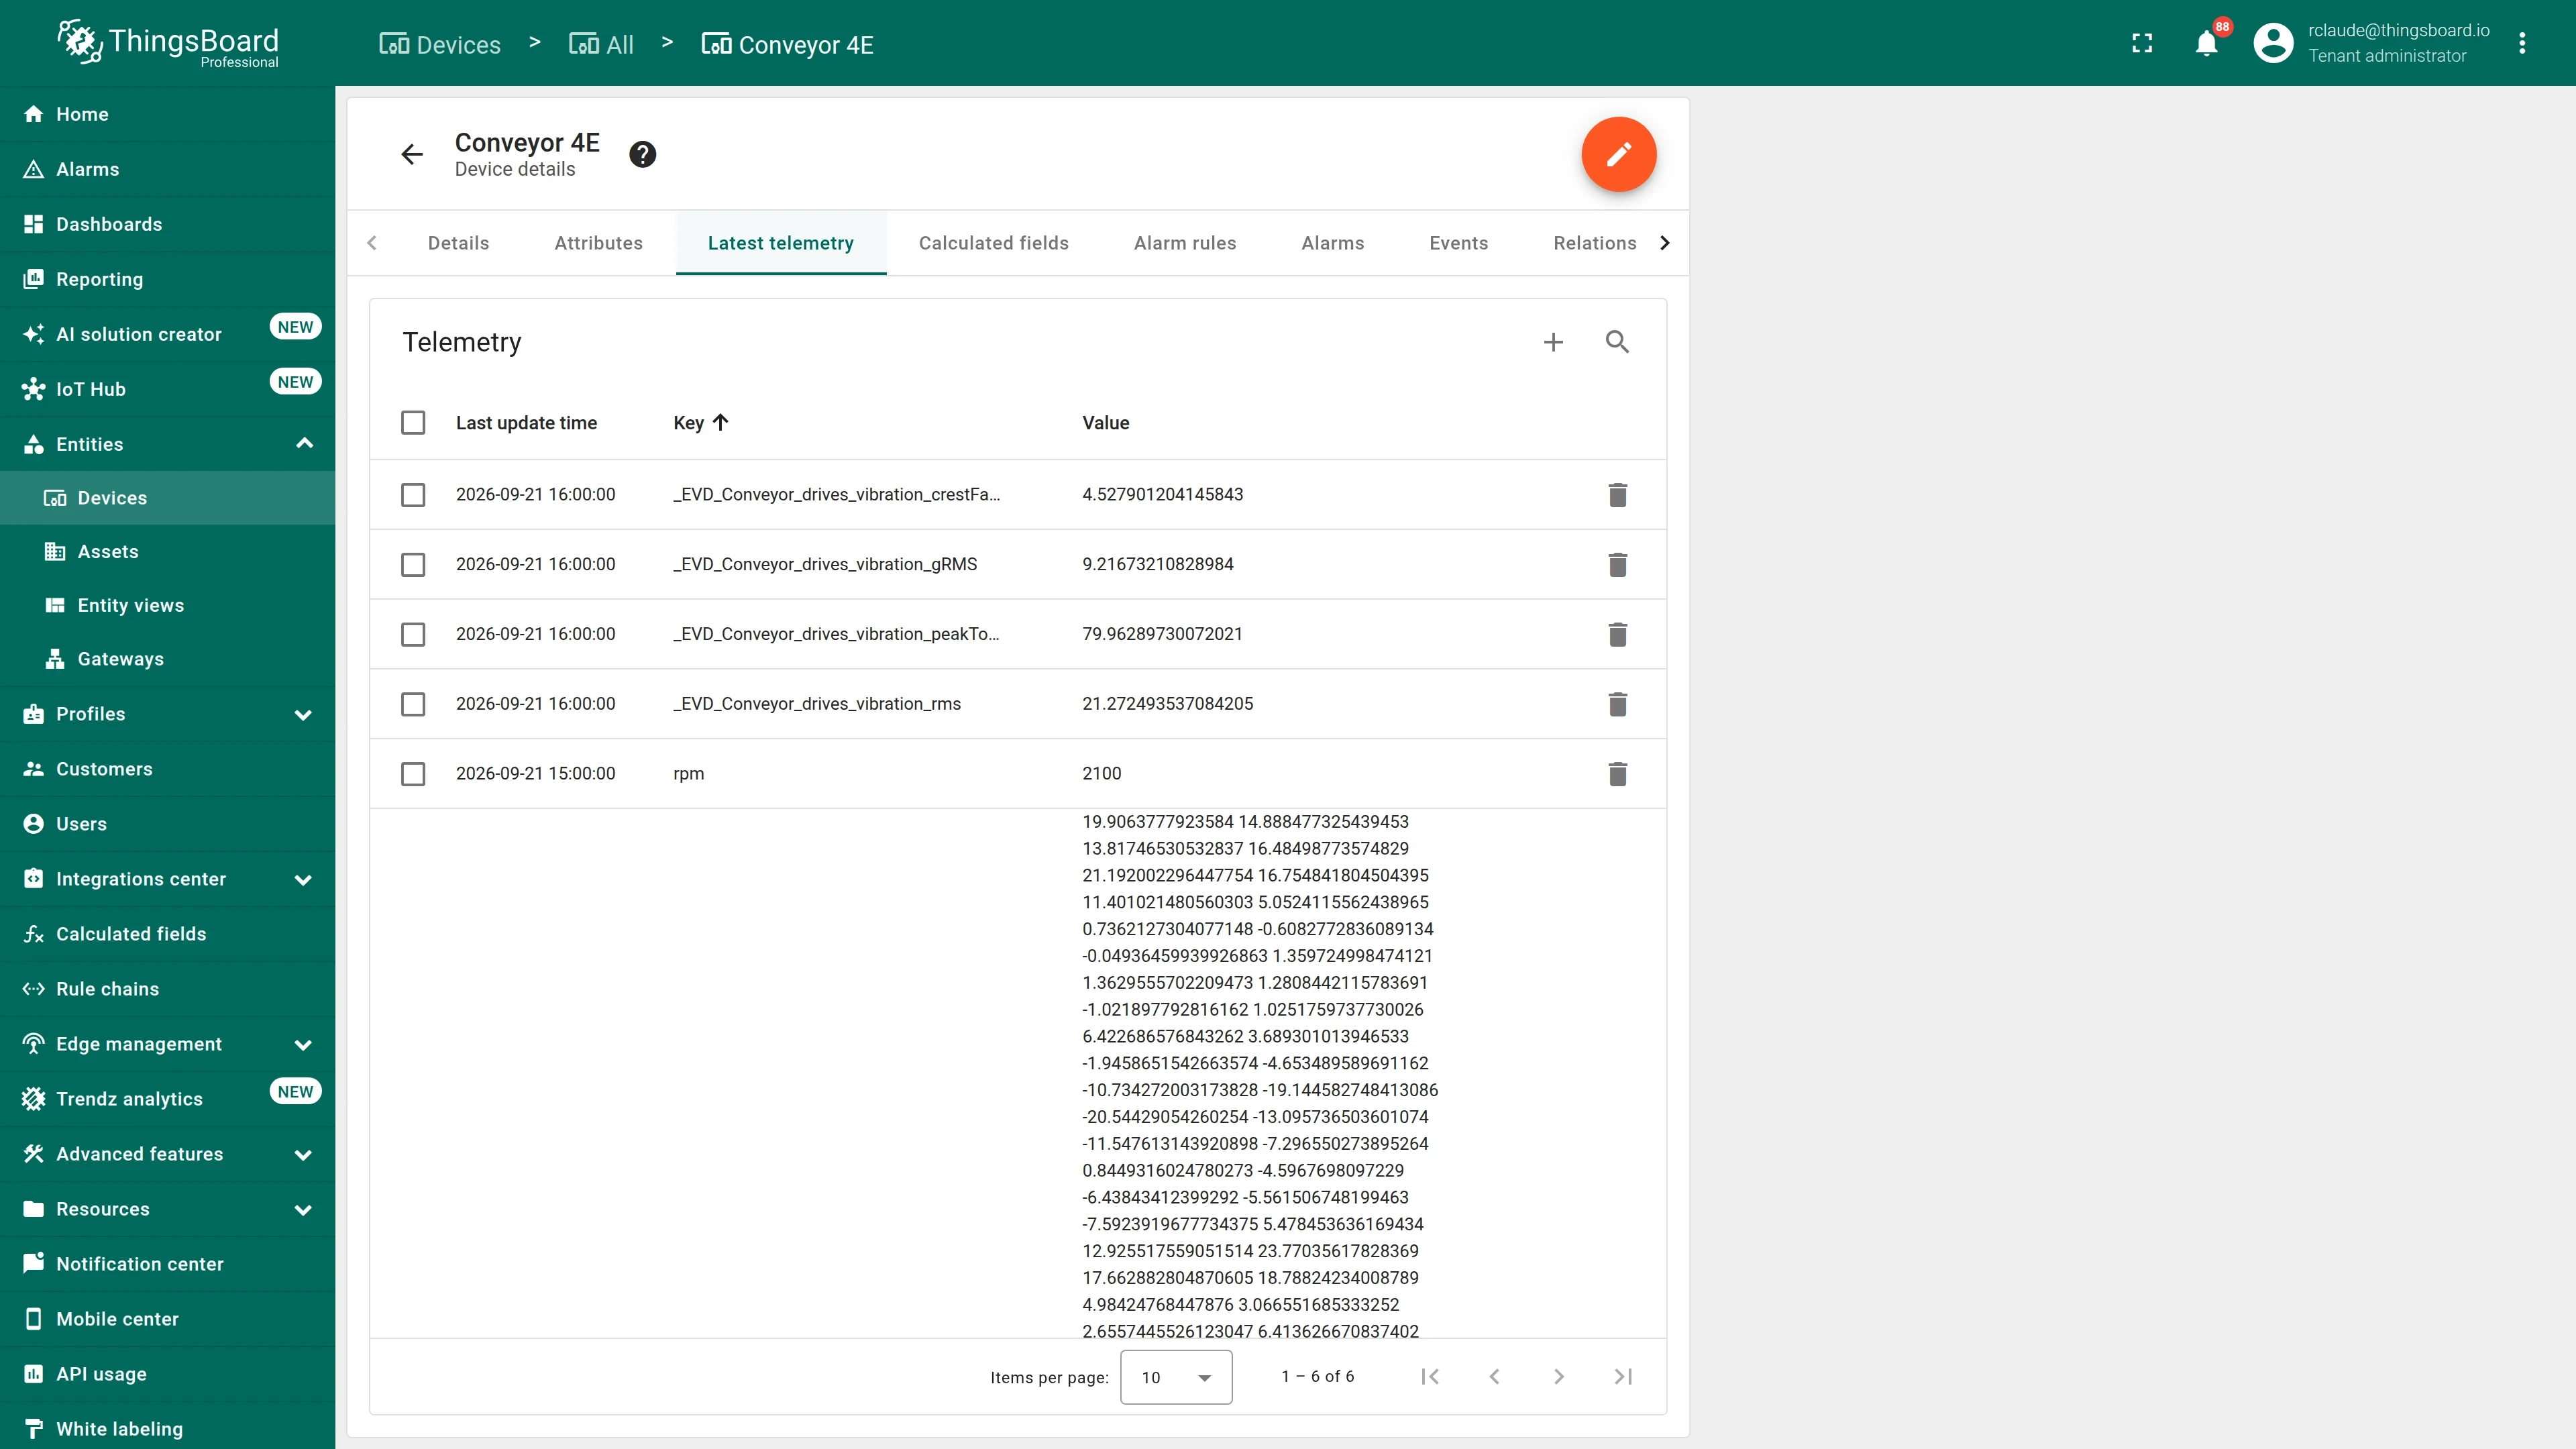
The keys appear on each machine as the next scan writes them, and they are ordinary telemetry from then on: chart them on a ThingsBoard dashboard, compare them with process data, or read them in a rule chain.
Raise alarms
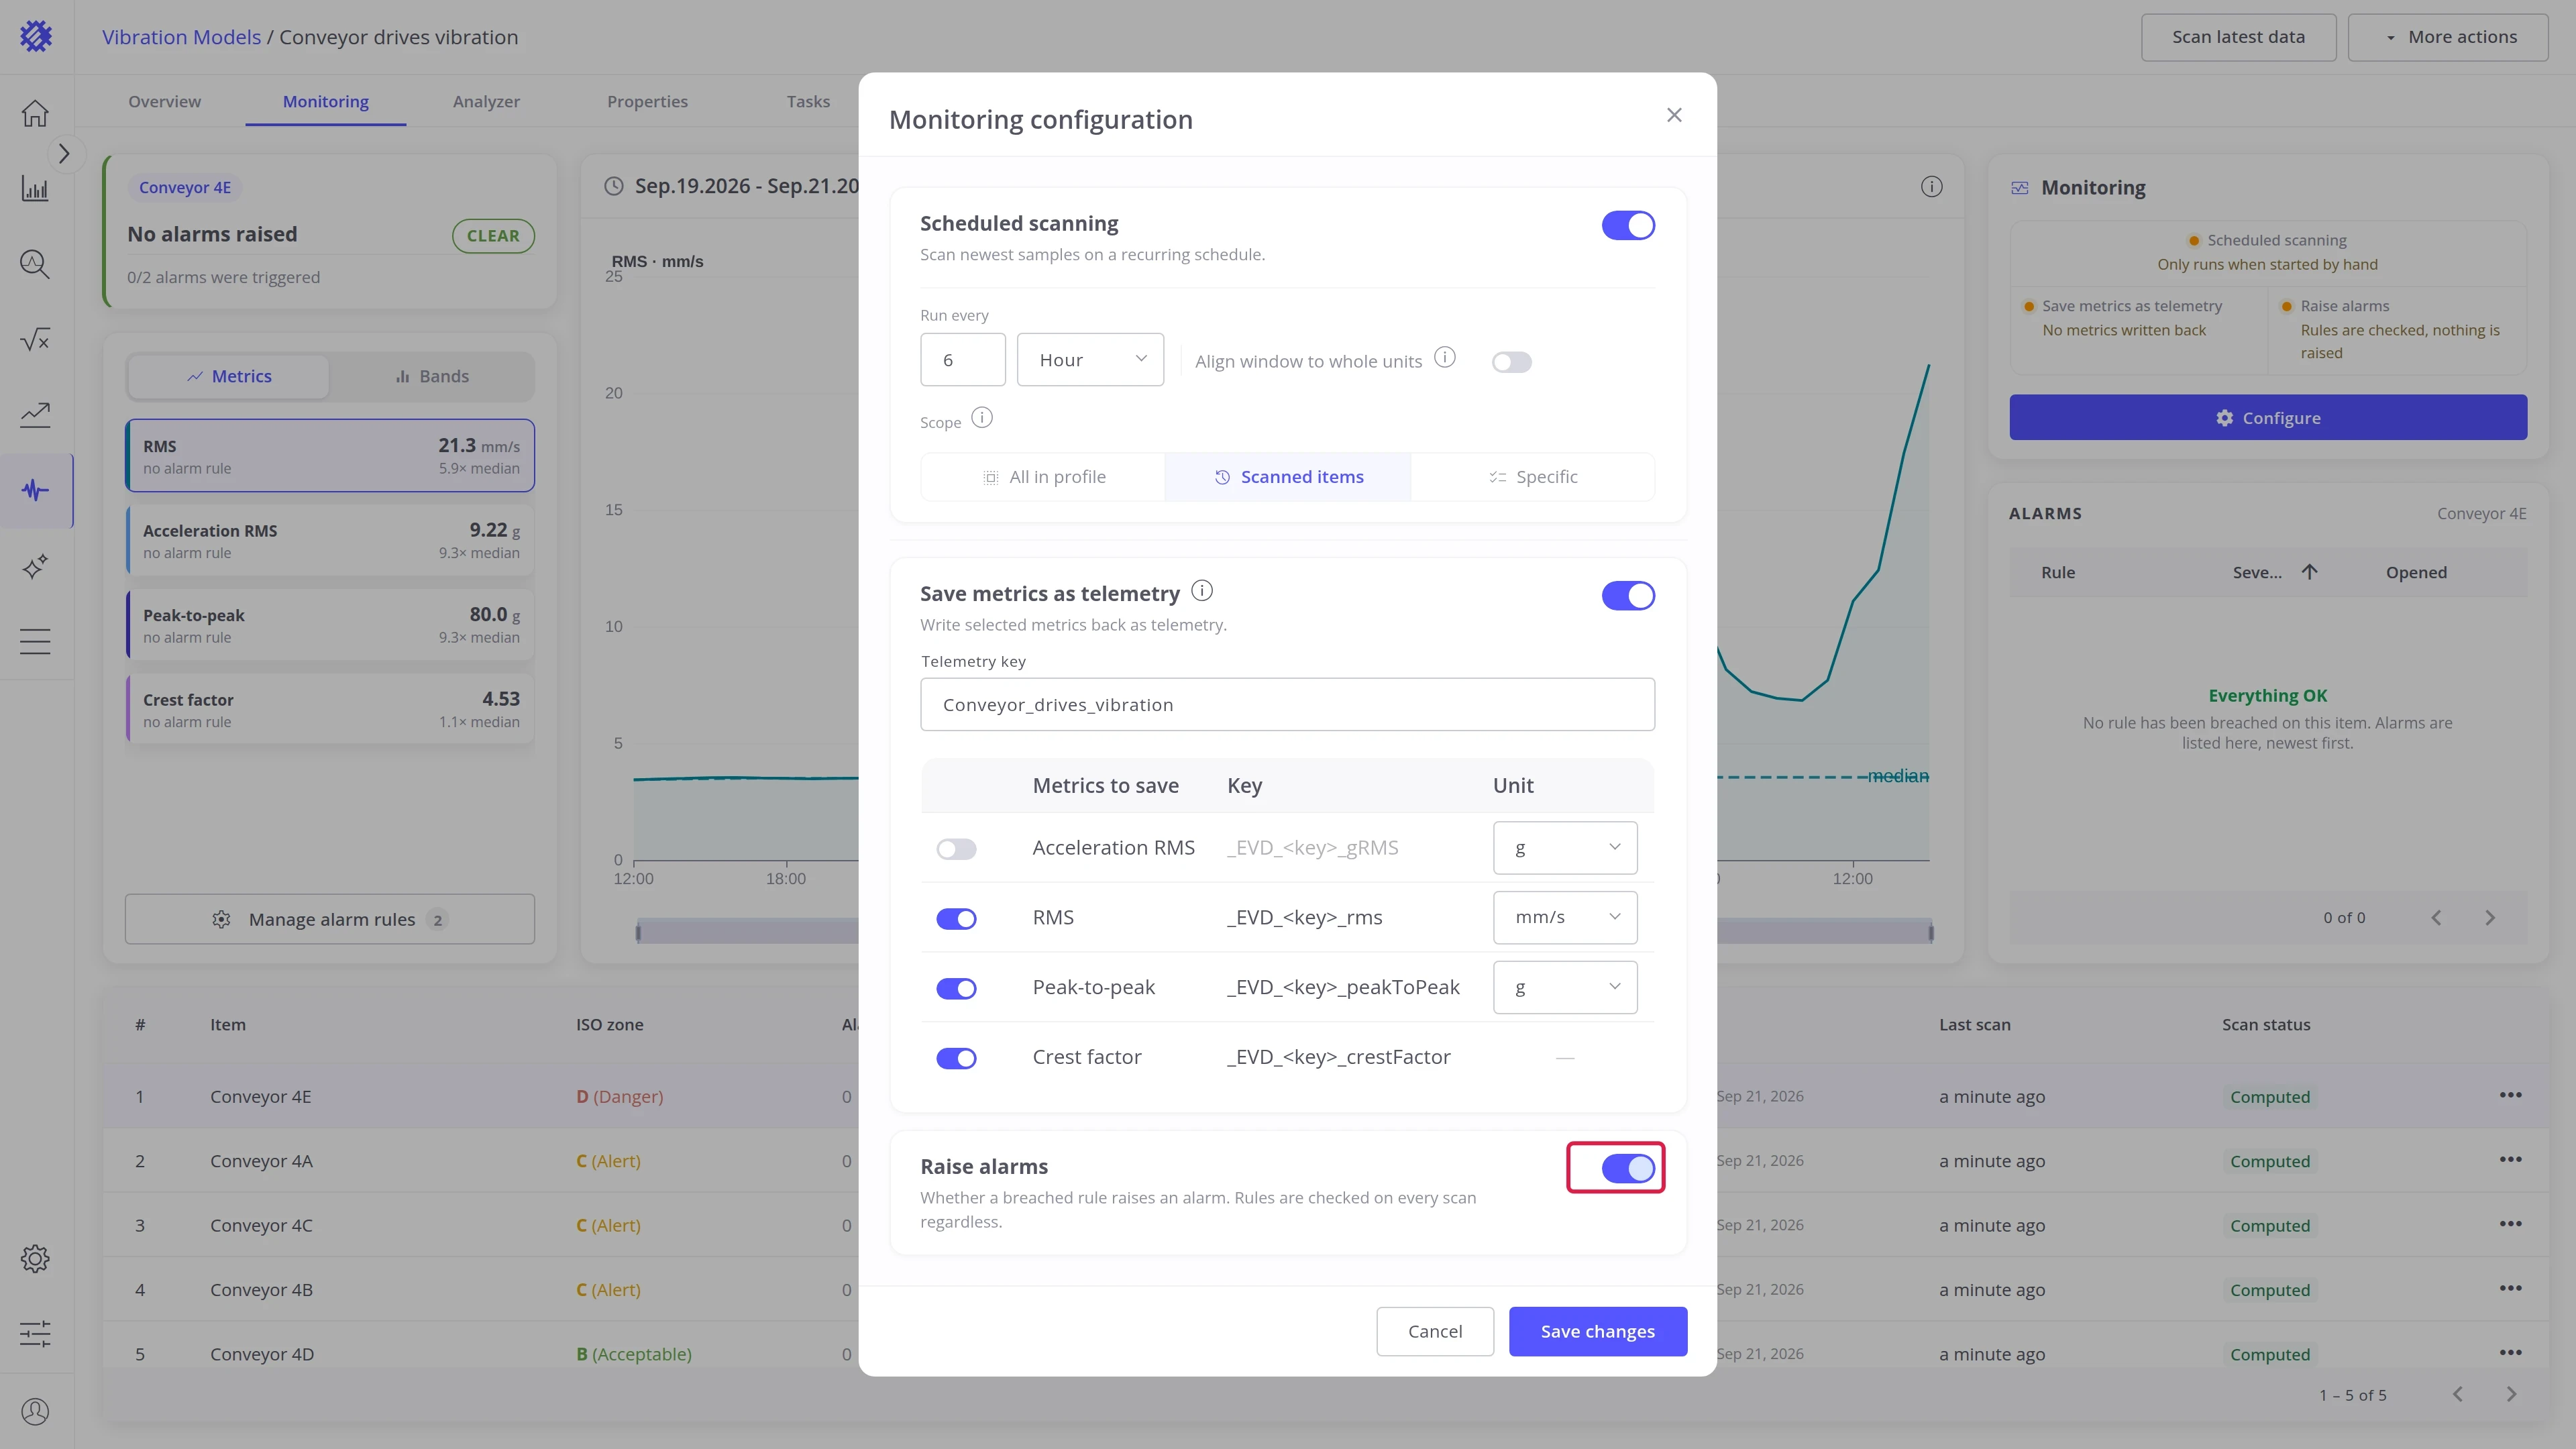
Section titled “Raise alarms”This switch sends breached rules to ThingsBoard as alarms on the machine. Trendz checks the rules on every scan either way. The switch only decides whether ThingsBoard gets the alarm.
Writing the rules themselves is the next section.
Alarm rules
Section titled “Alarm rules”An alarm rule tells Trendz when a machine needs attention. Every scan checks each rule on each machine, and a rule that keeps breaking raises an alarm in ThingsBoard.
Answer three questions from the top down. They pick the kind of rule and what it watches, as set in Step 2 below:
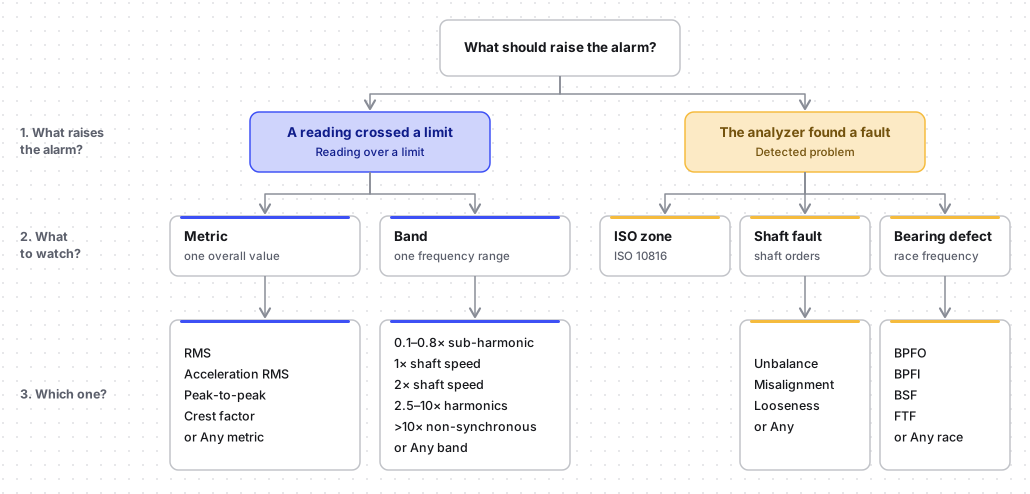
Every rule then gets severity levels (Step 3) and a confirmation (Step 4), which decides how many samples in a row must break the rule before the alarm is raised or cleared.
Step 1. Open the rule editor
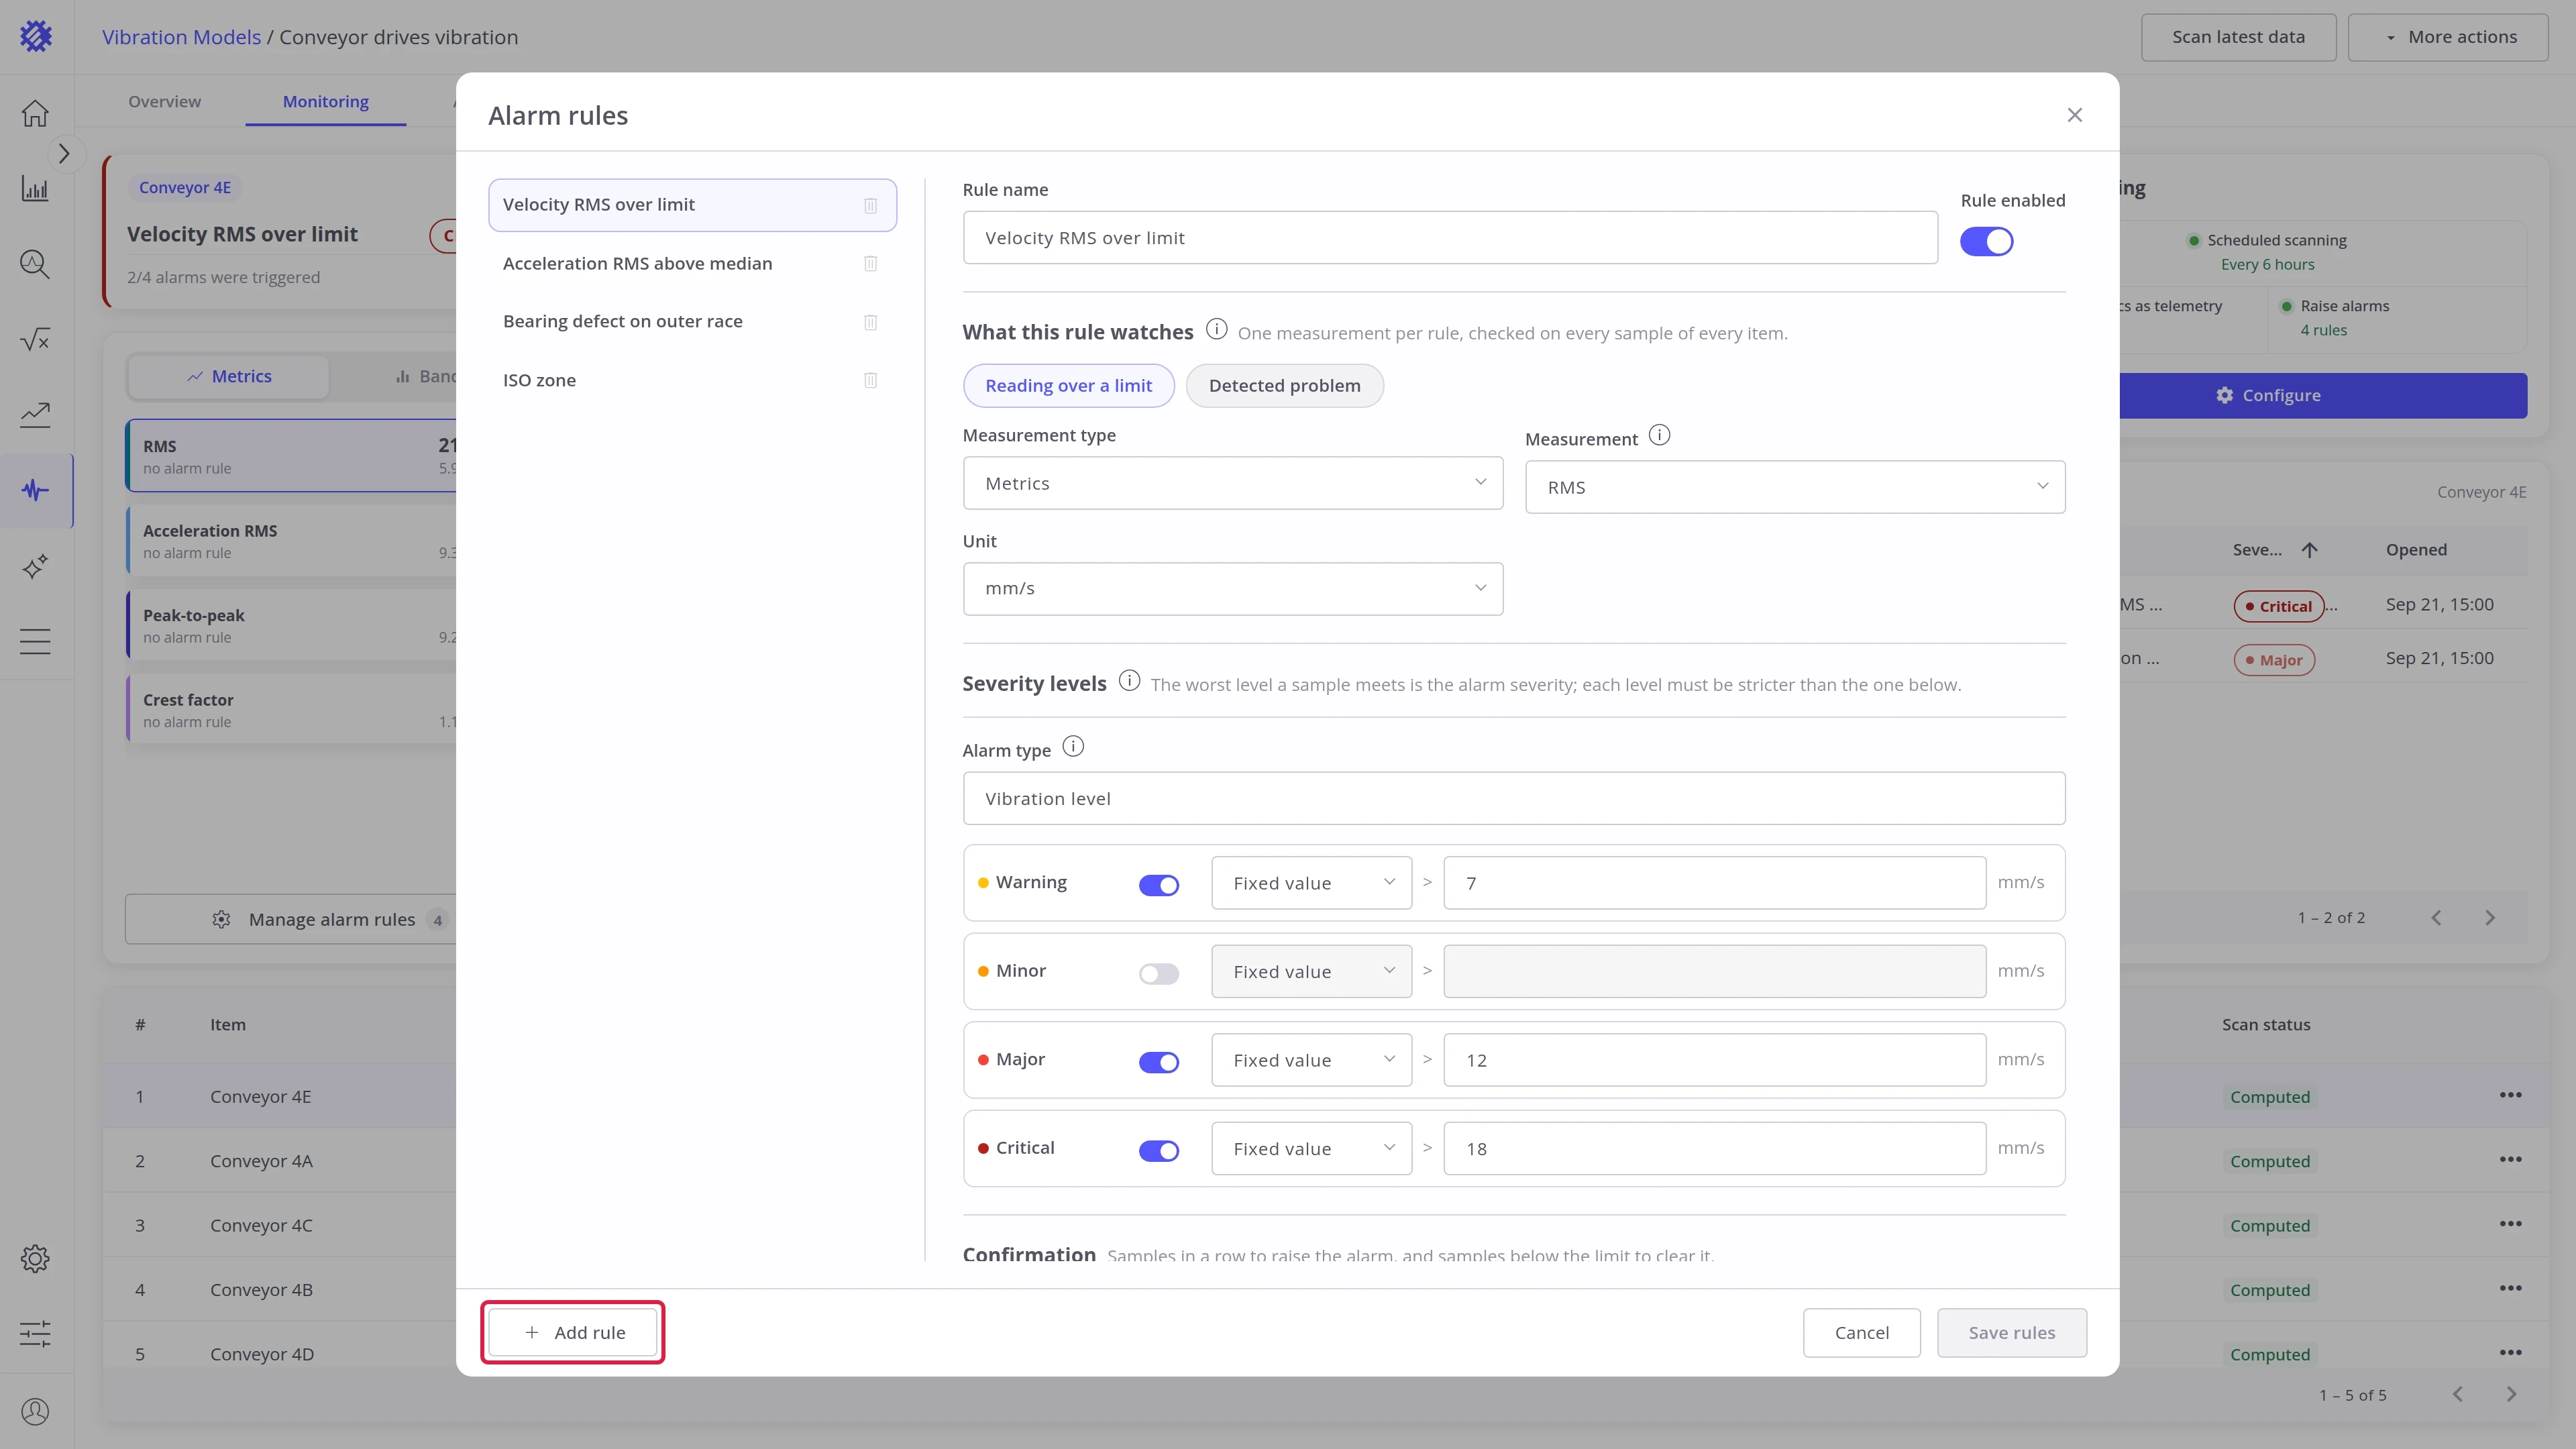
Section titled “Step 1. Open the rule editor”Open the Monitoring tab (1) and click Manage alarm rules (2). The editor lists the model’s rules on the left and shows the selected rule on the right.
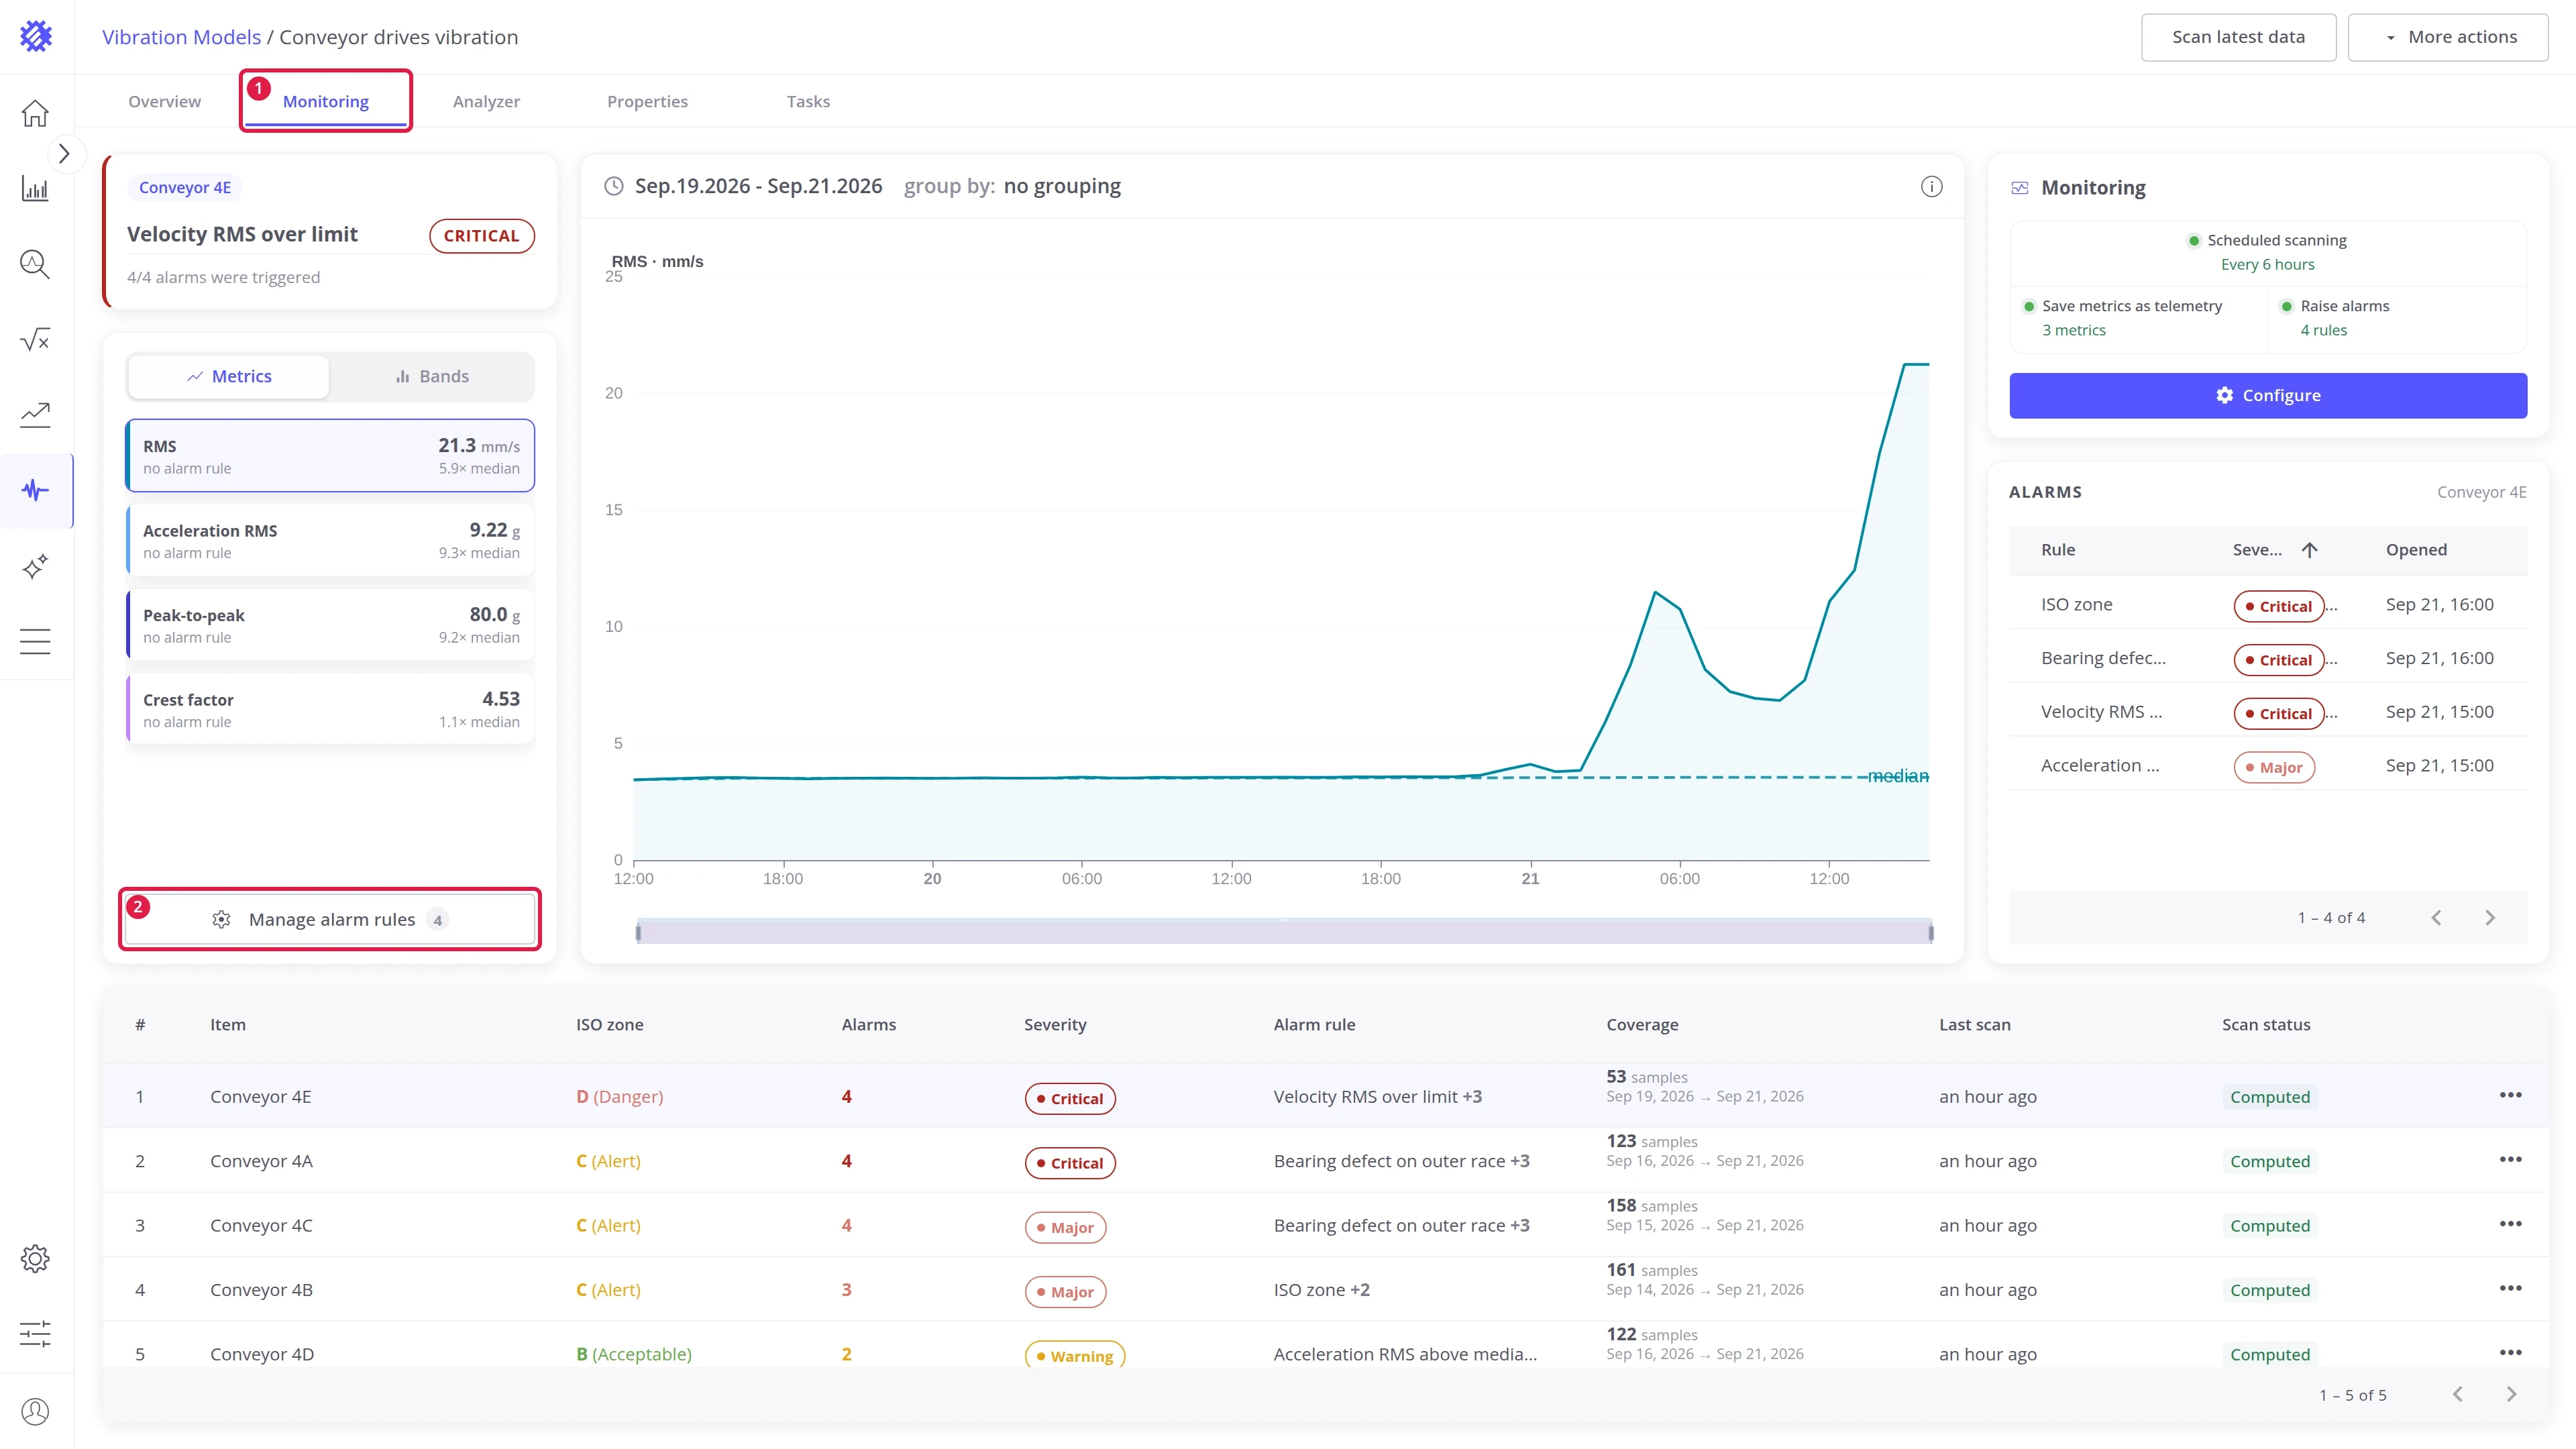
- Add a rule: click + Add rule at the bottom left. The new rule is marked Unsaved until you save.
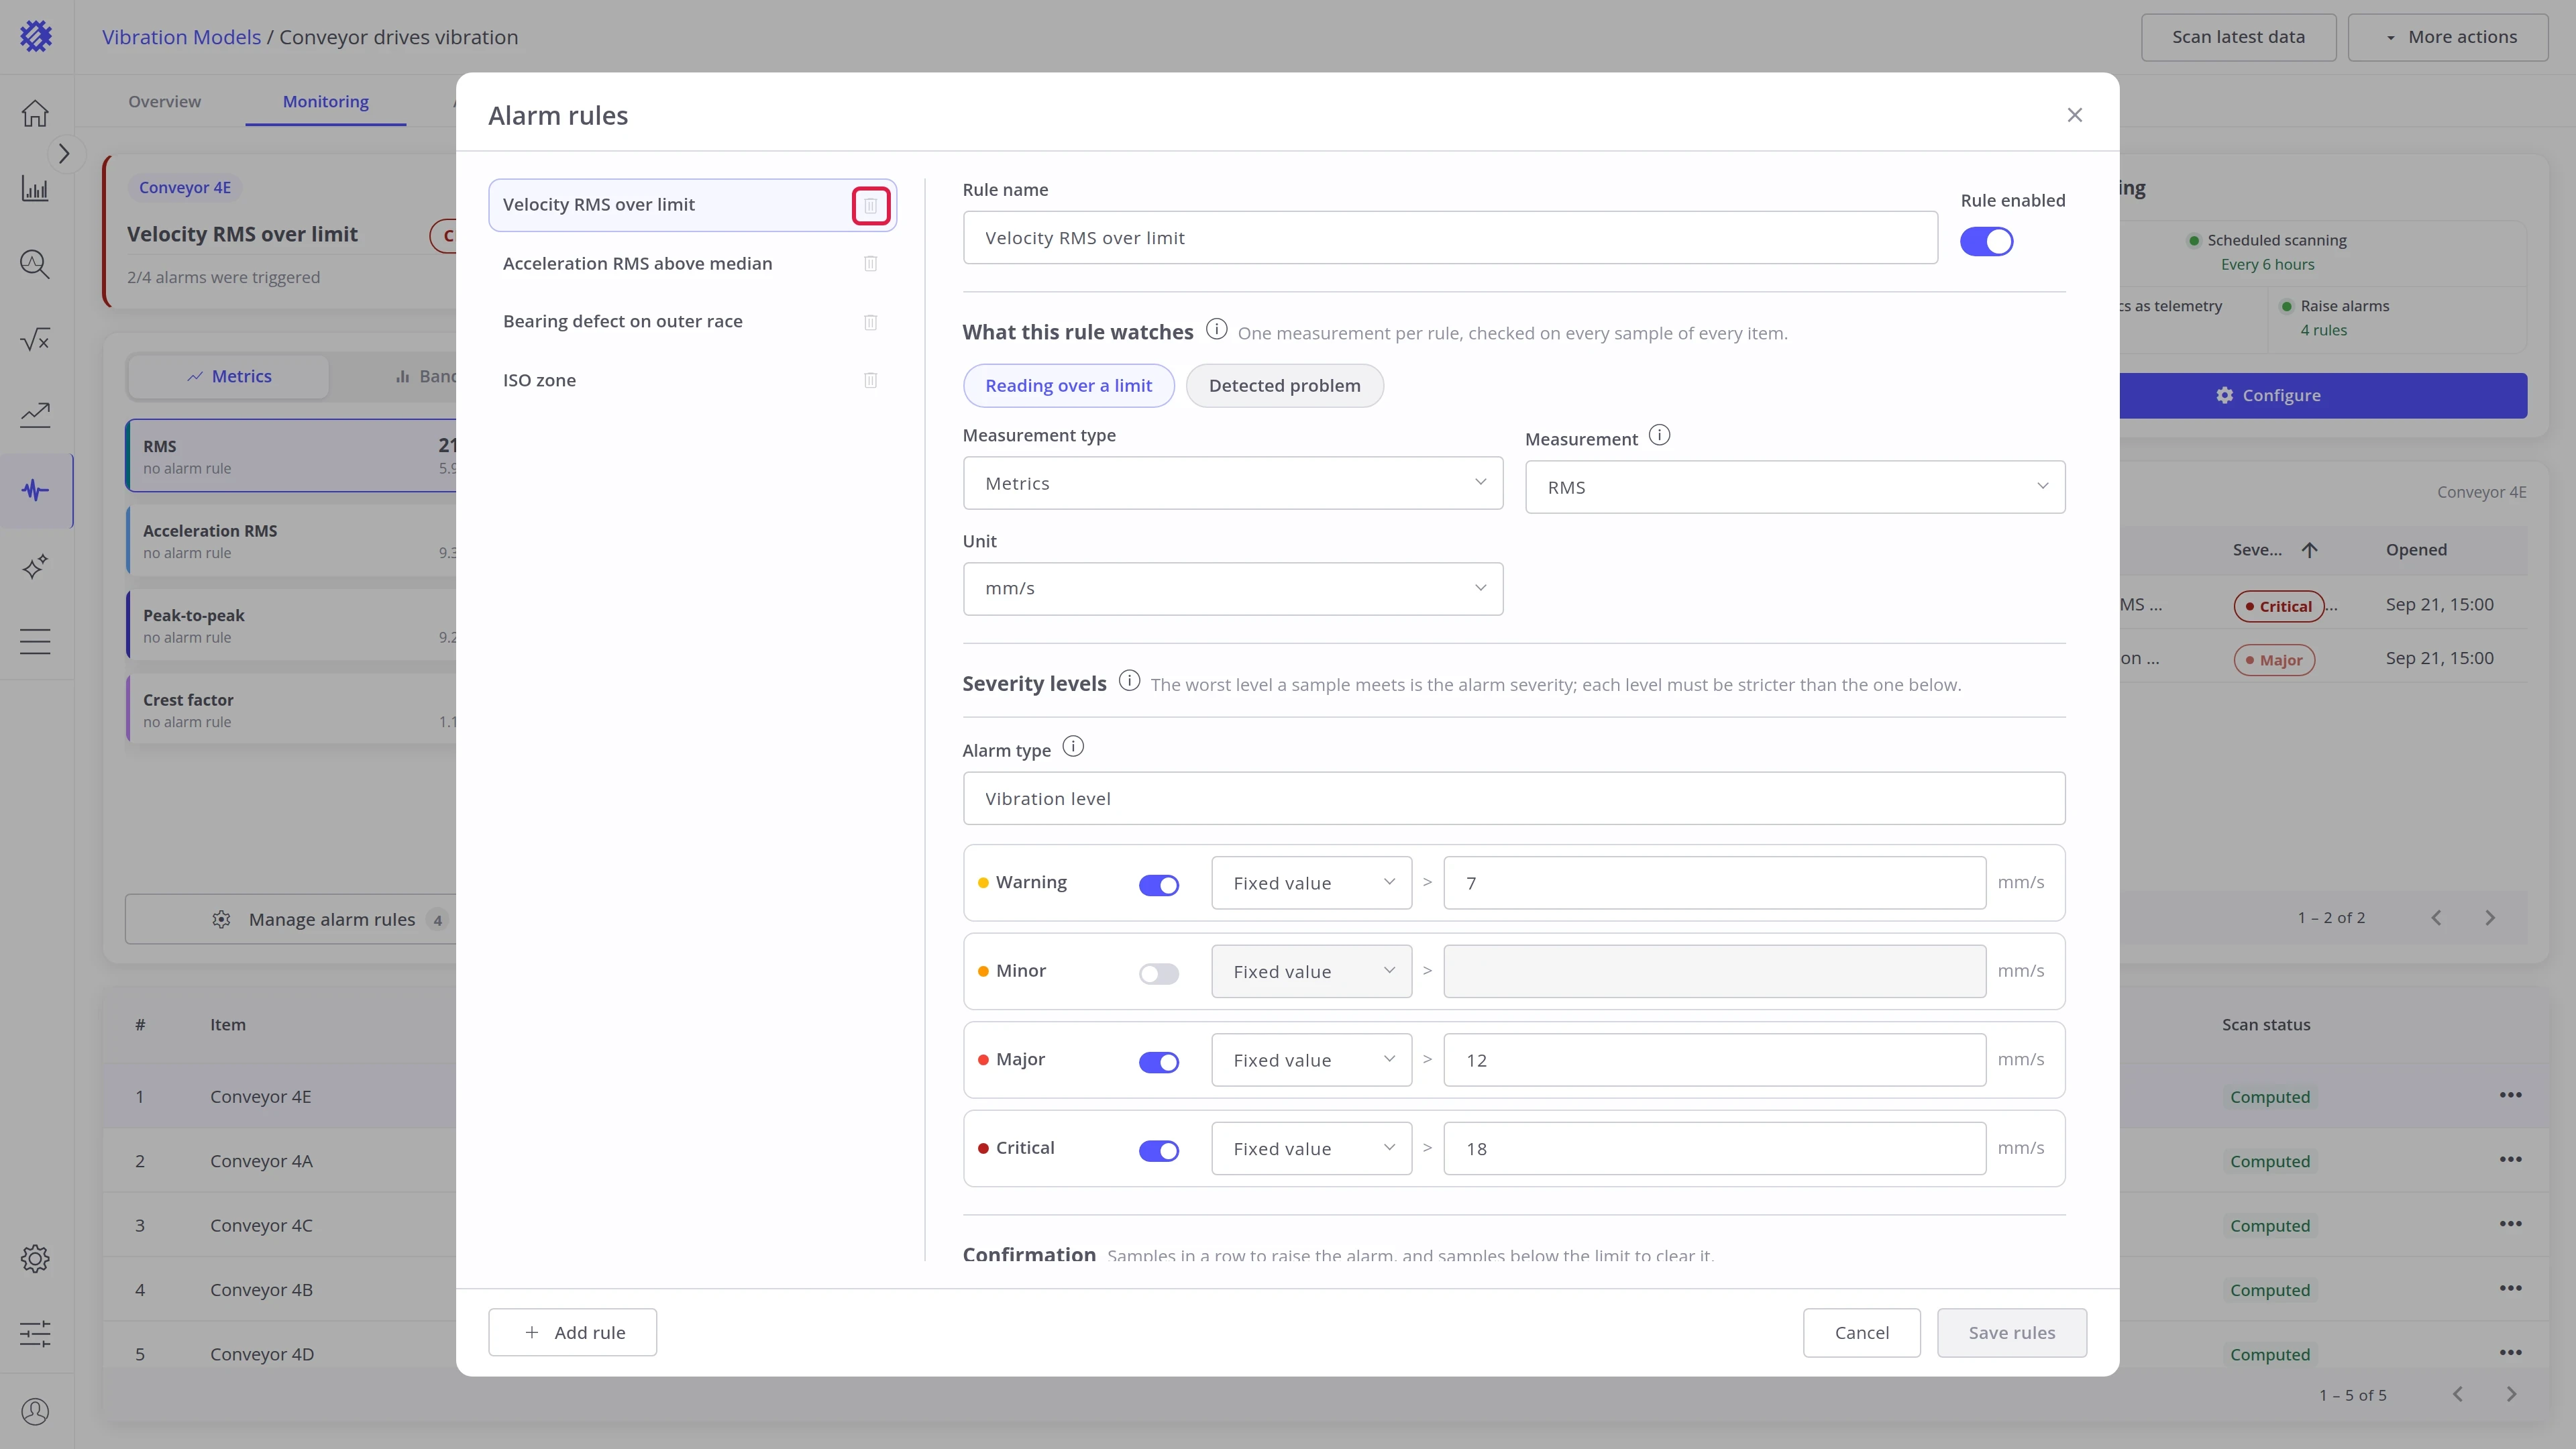
- Delete a rule: click the trash icon next to its name in the list.
Step 2. Choose what the rule watches
Section titled “Step 2. Choose what the rule watches”Pick one of two kinds. The rest of the form depends on it.
| Kind | Watches | Example |
|---|---|---|
| Reading over a limit | A metric or a frequency band | Velocity RMS |
| Detected problem | A finding of the analyzer | A bearing defect |
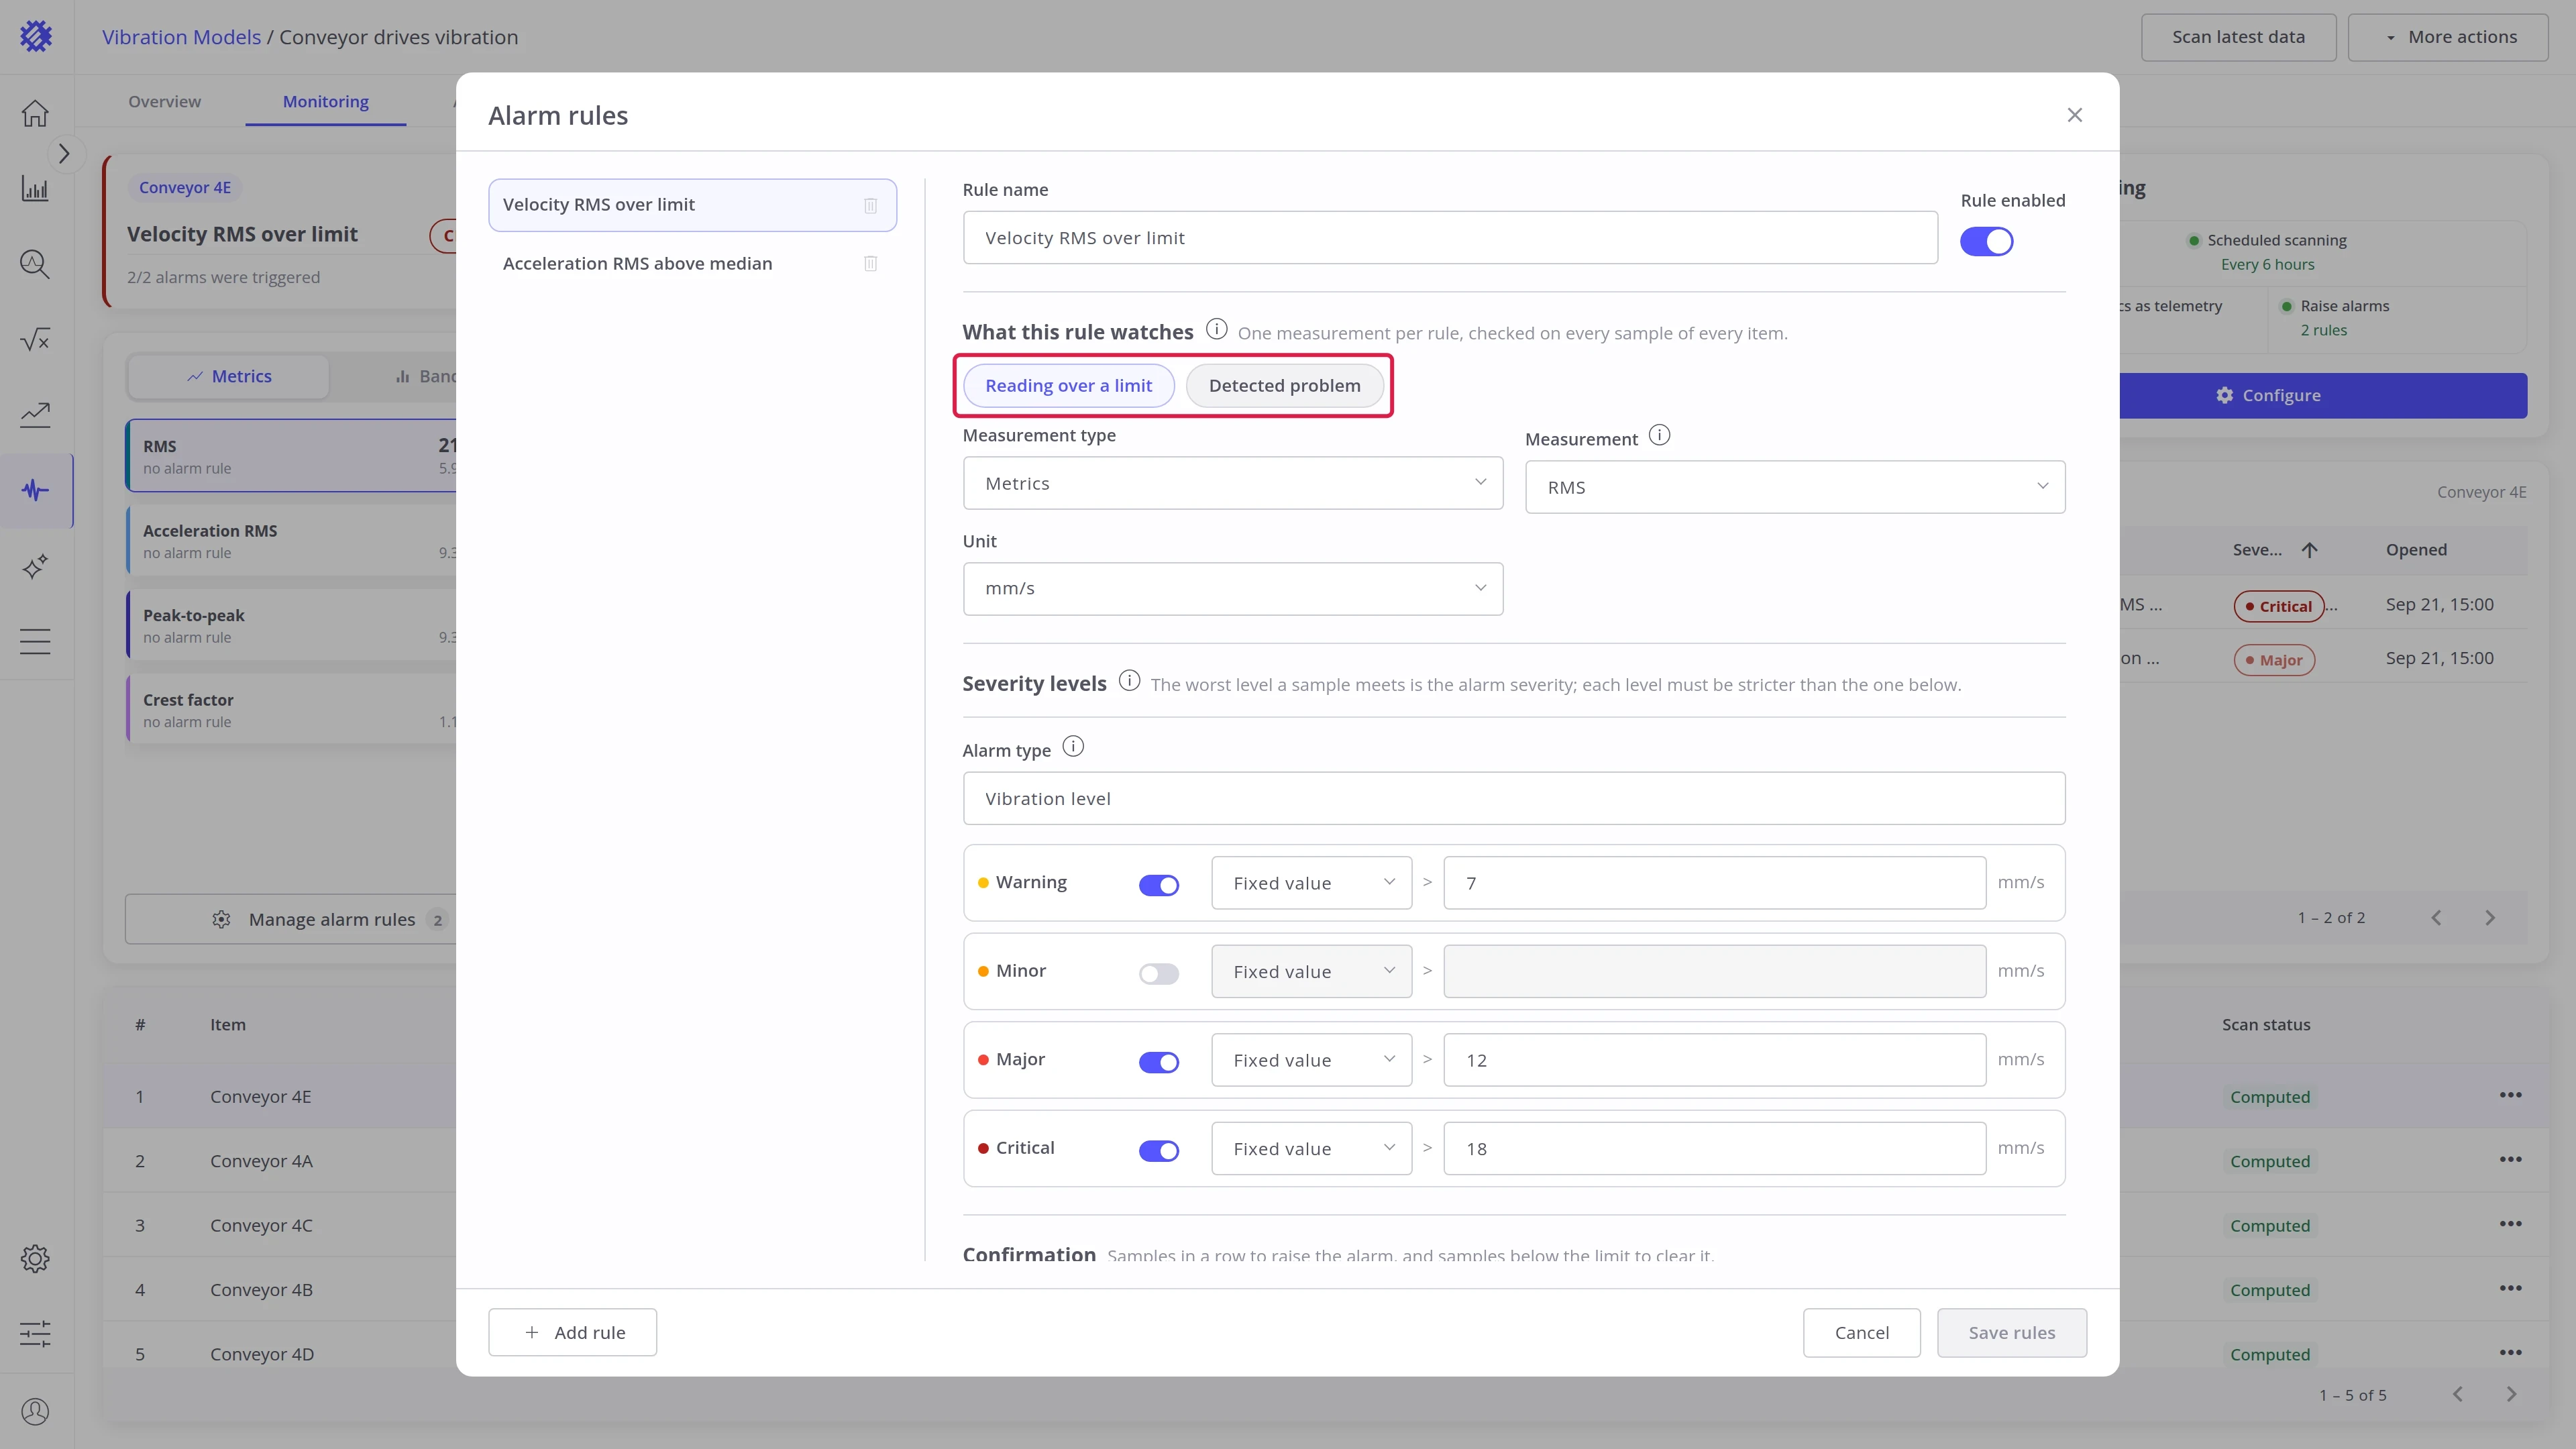
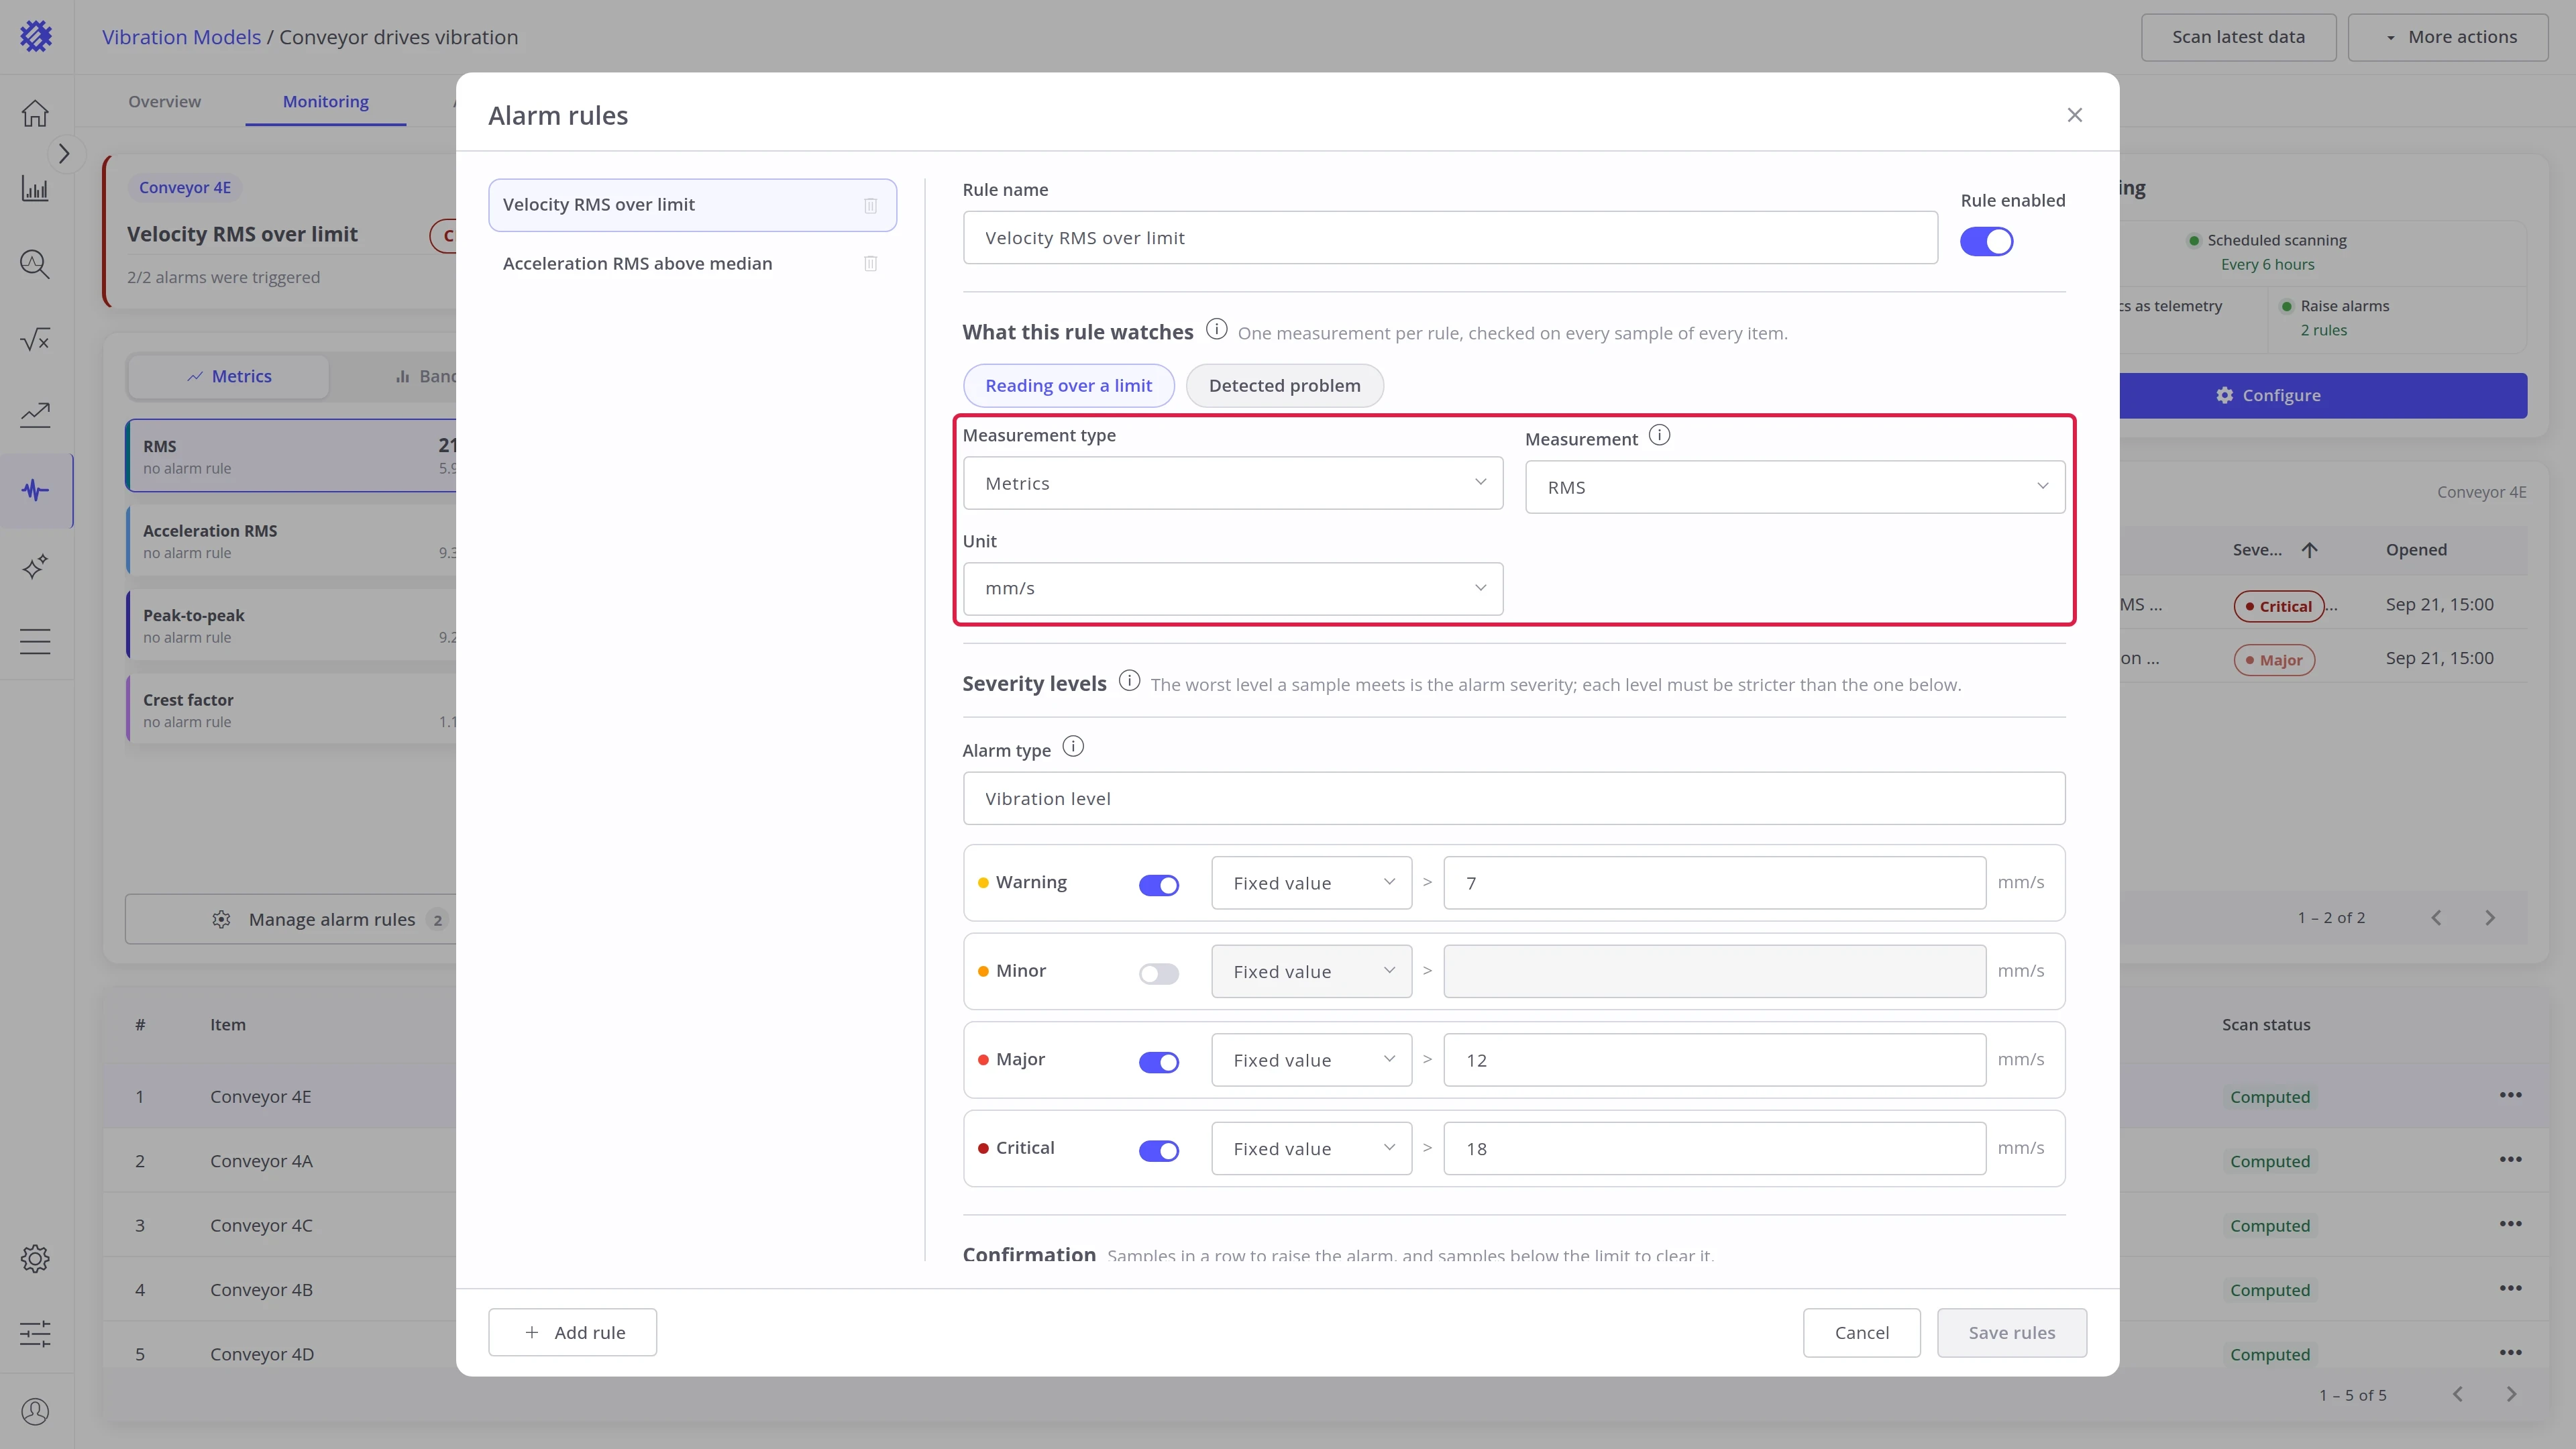
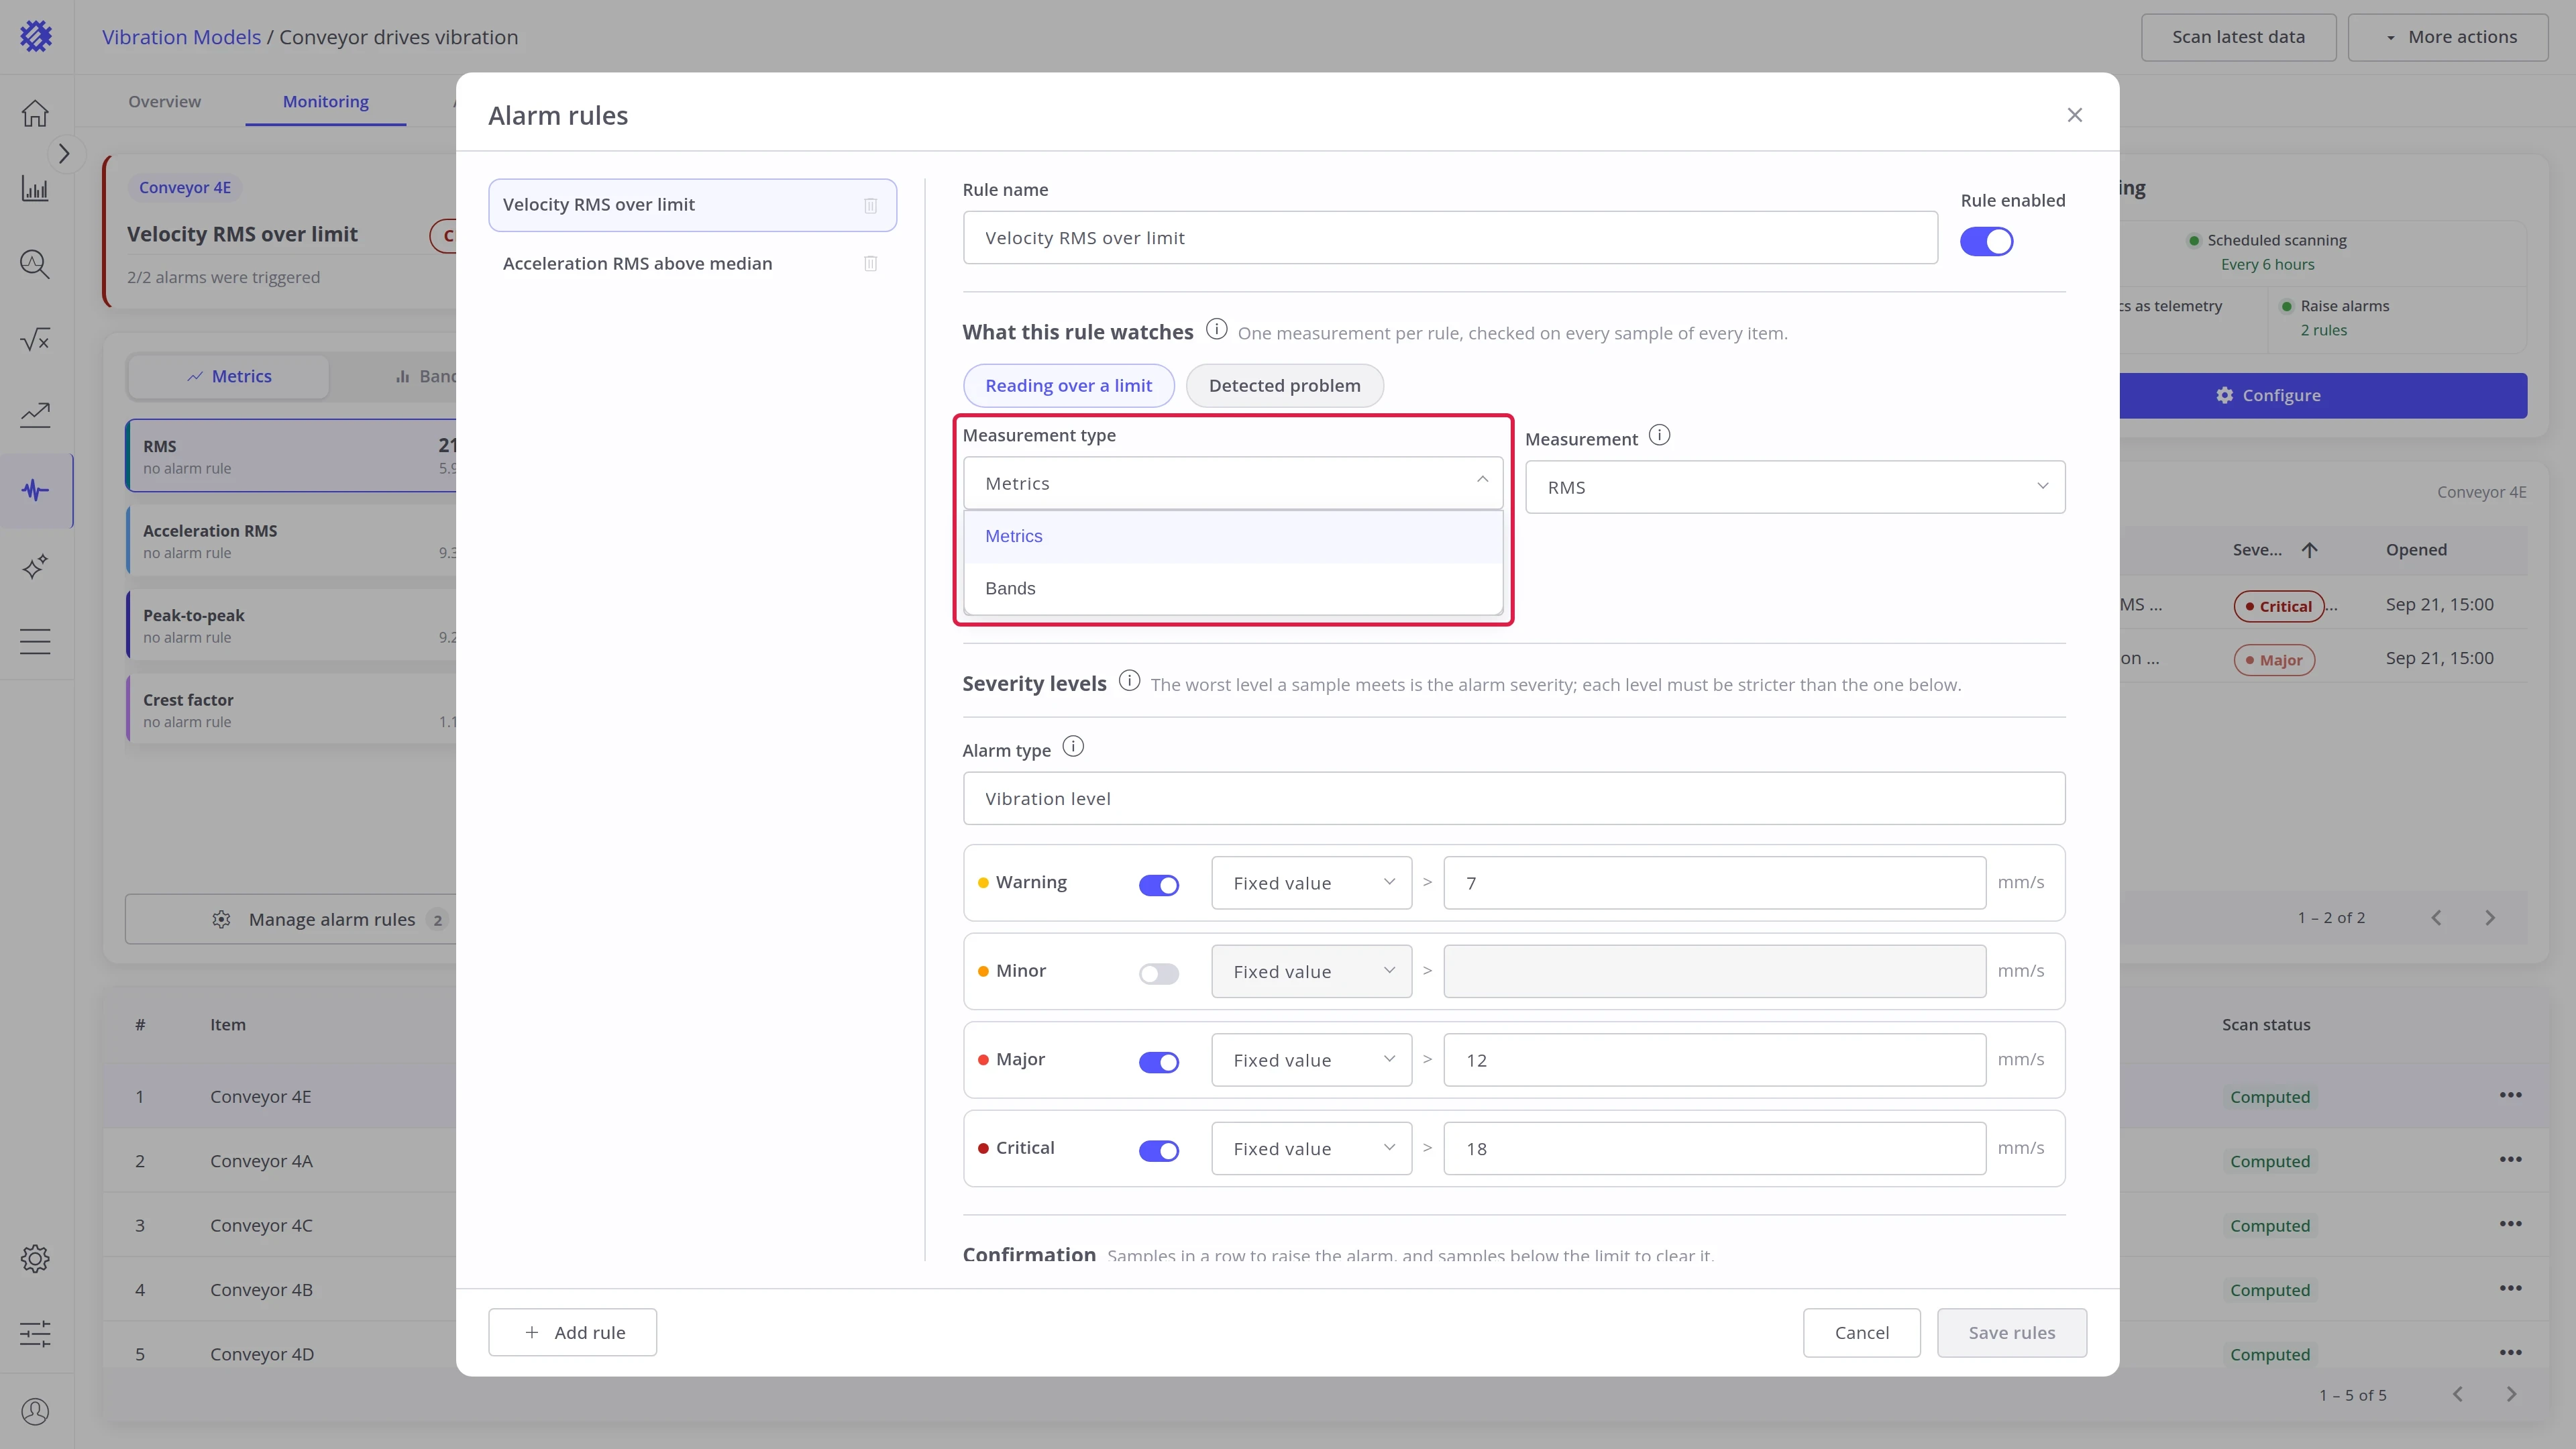
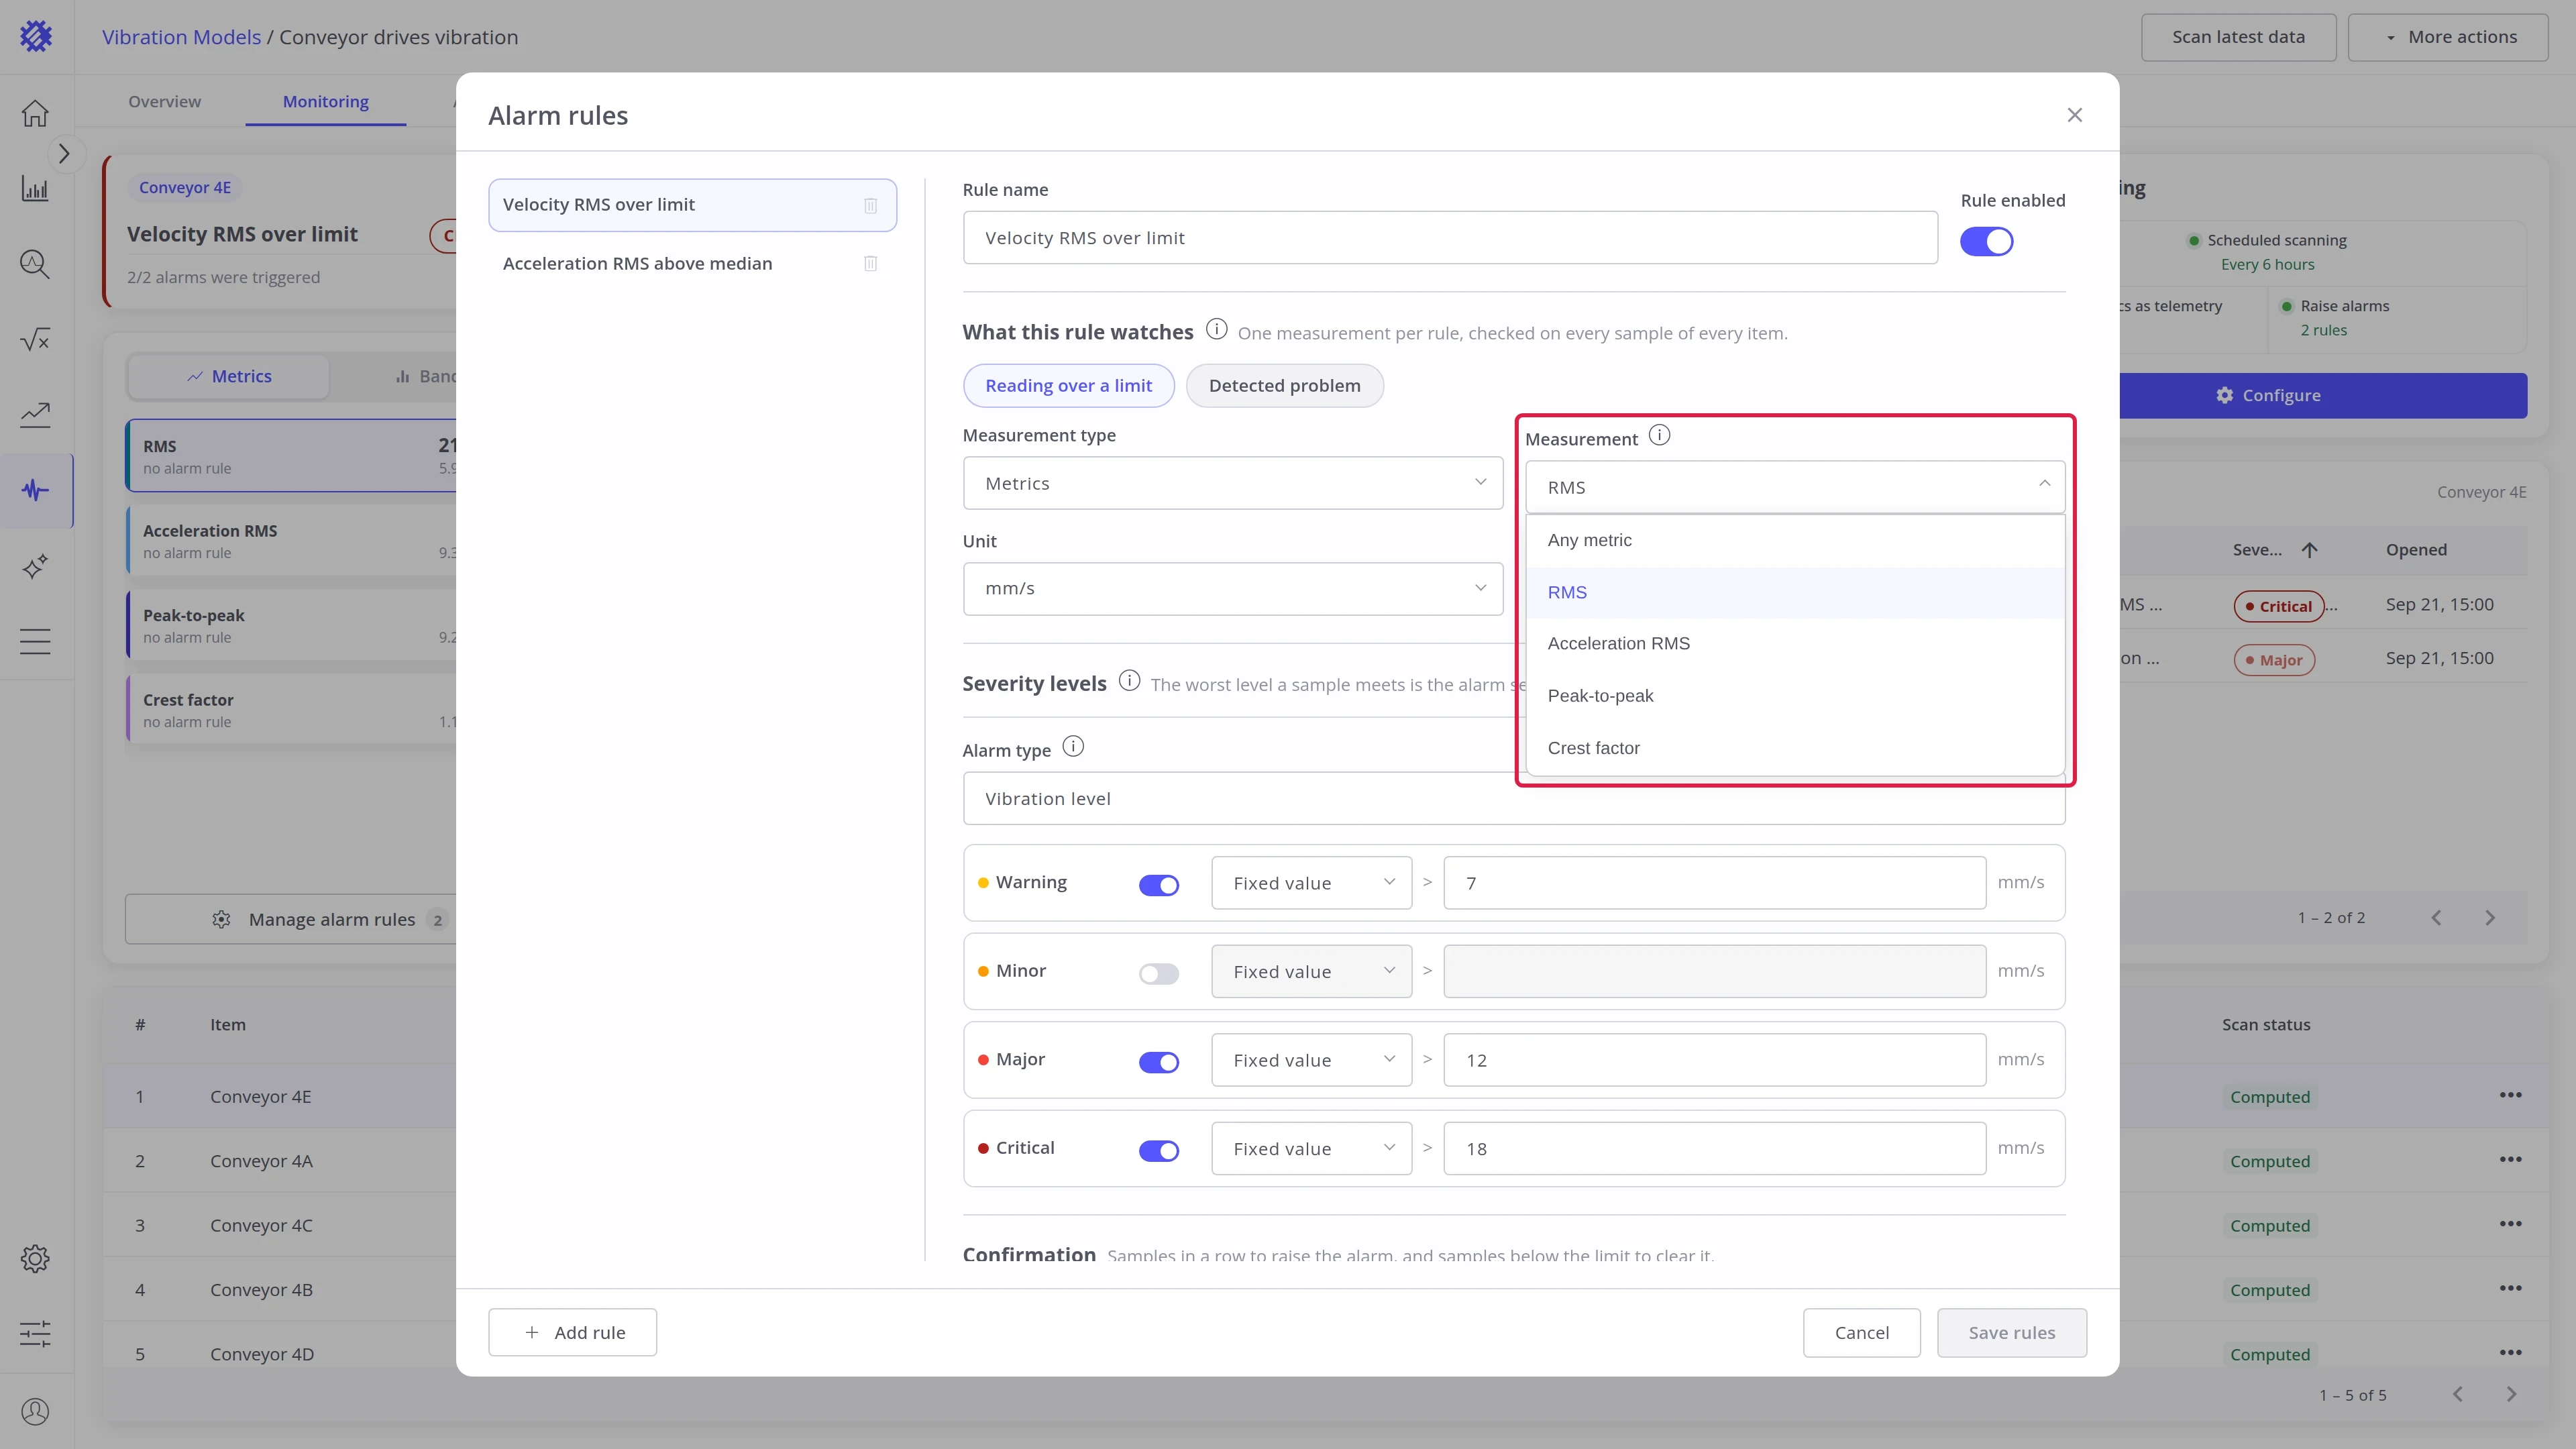
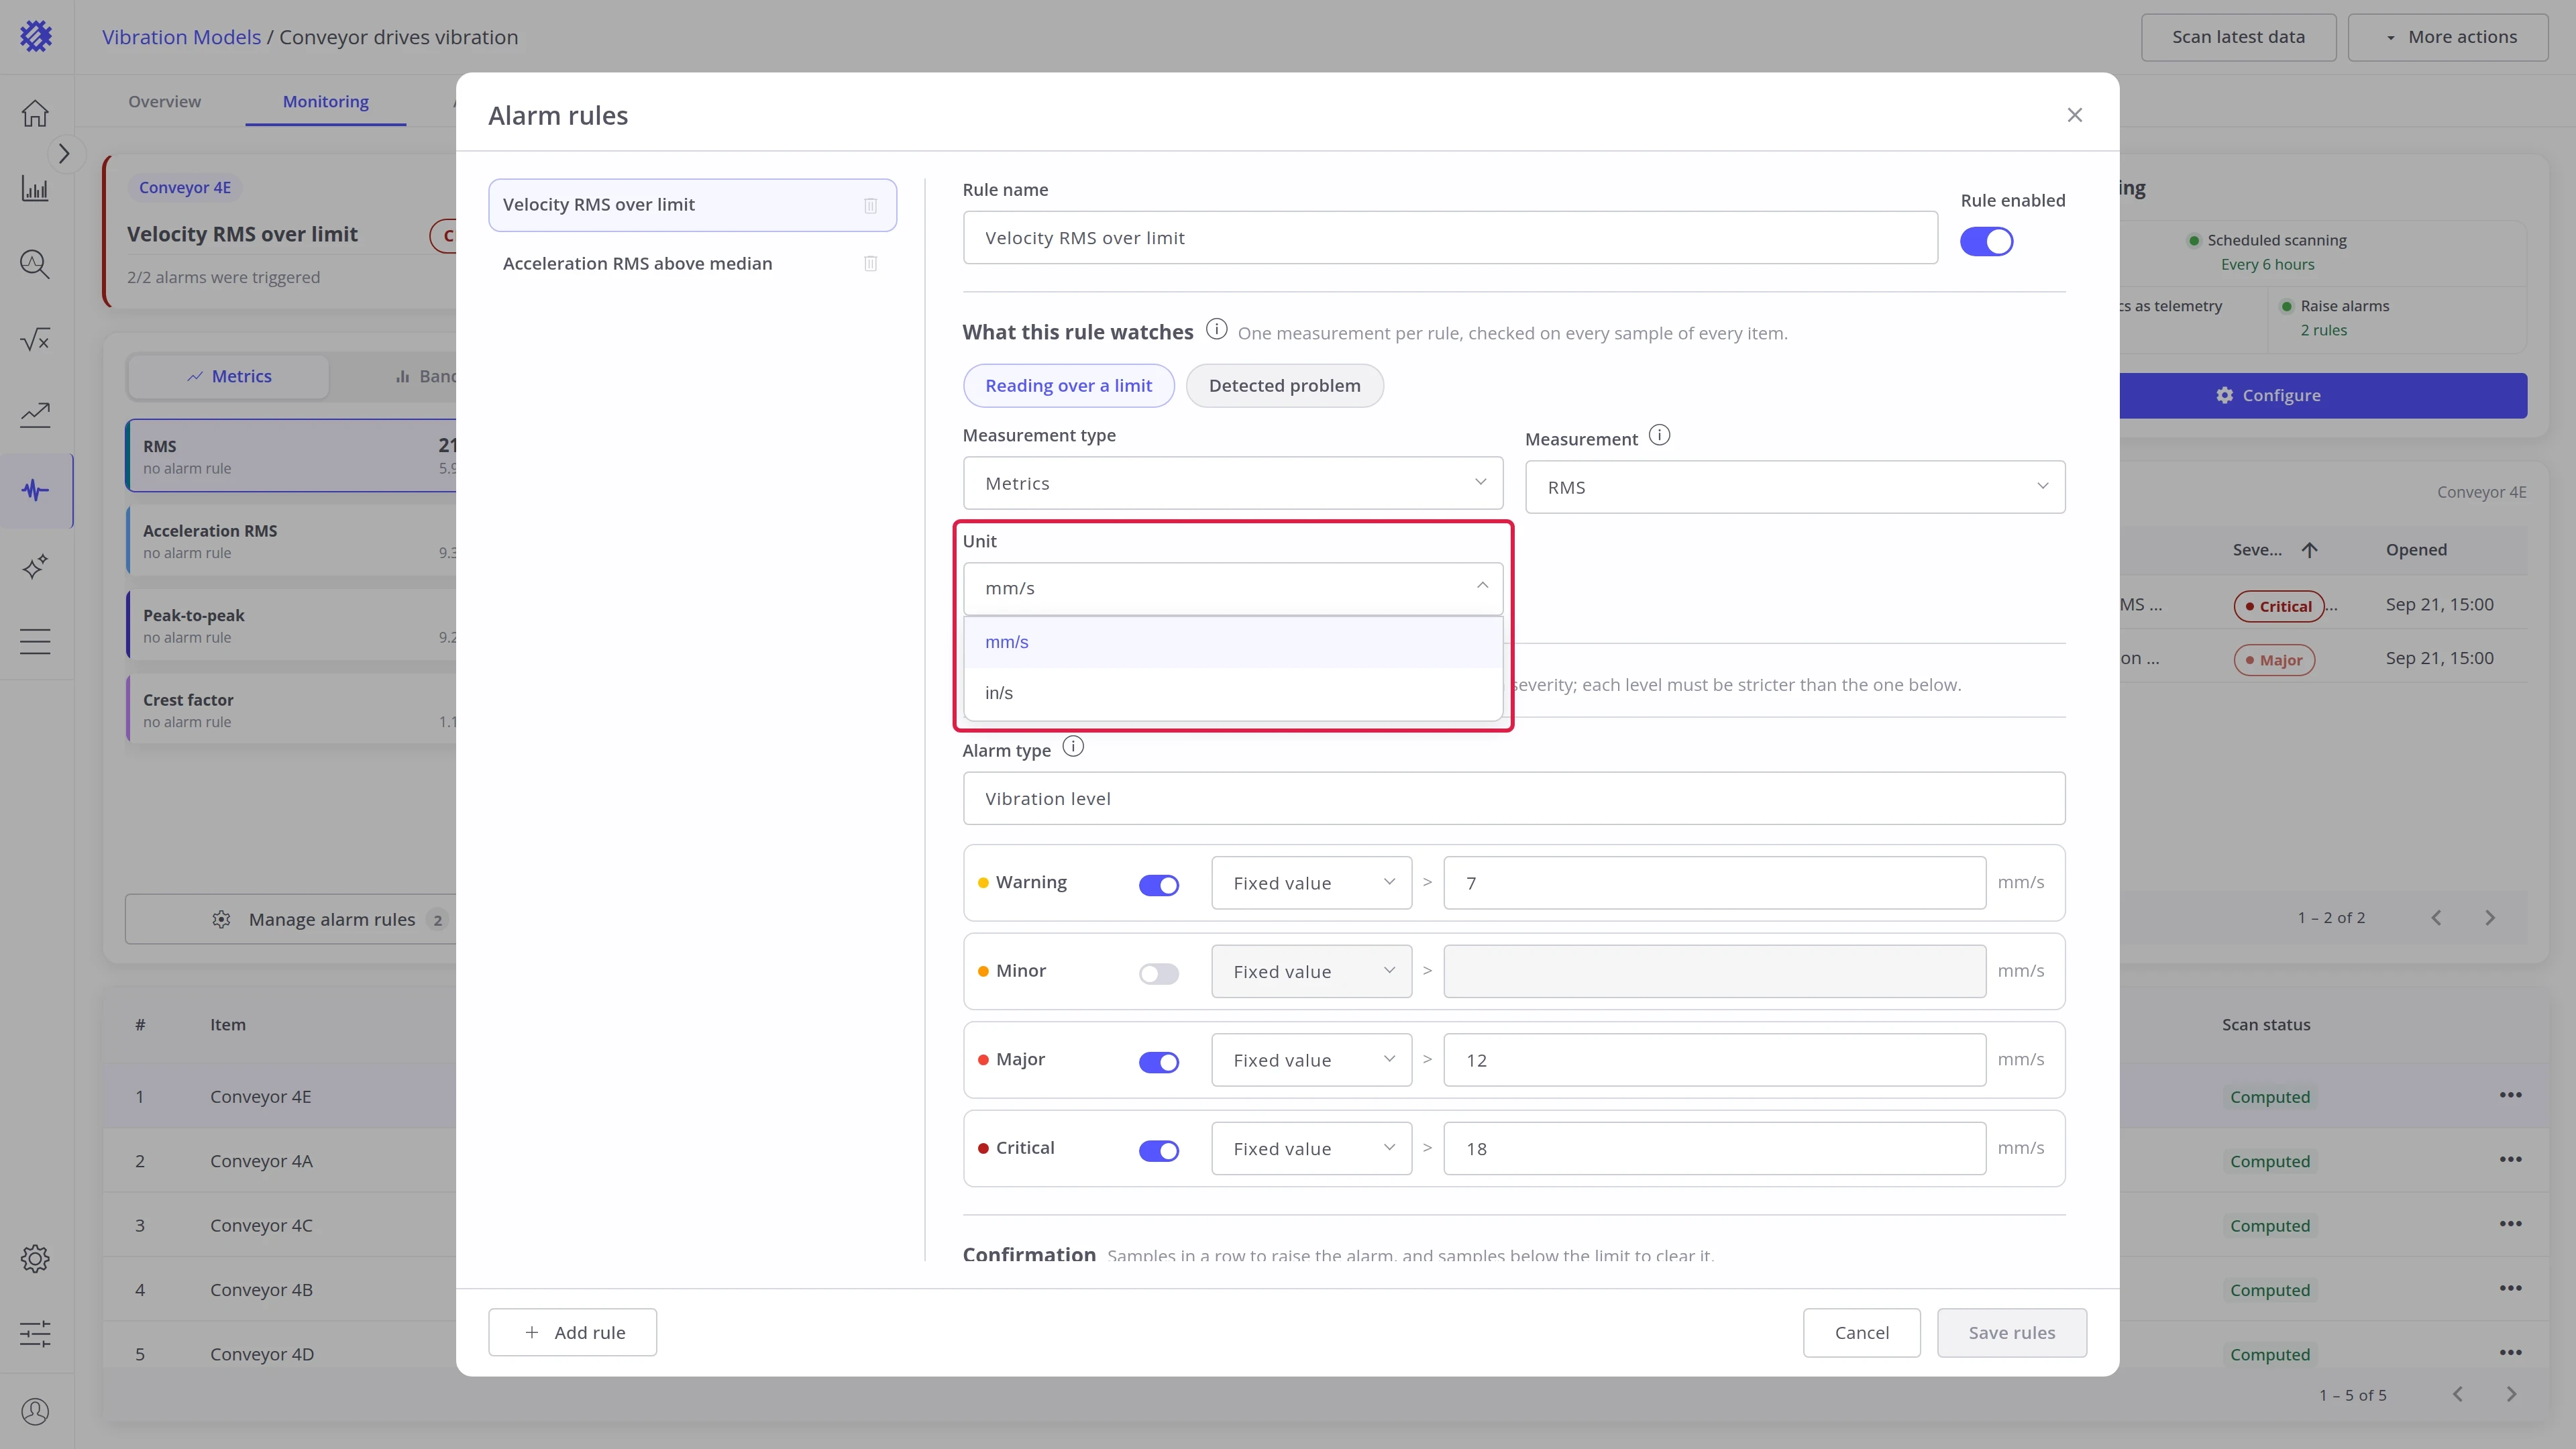
Reading over a limit. Choose the measurement.
| Field | Description |
|---|---|
| Measurement type | Metrics or Bands |
| Measurement | One metric or band, or Any metric / Any band to watch all of them |
| Unit | The unit of the limits in Step 3 |
| Axis | One axis, or Any axis to check each axis on its own |
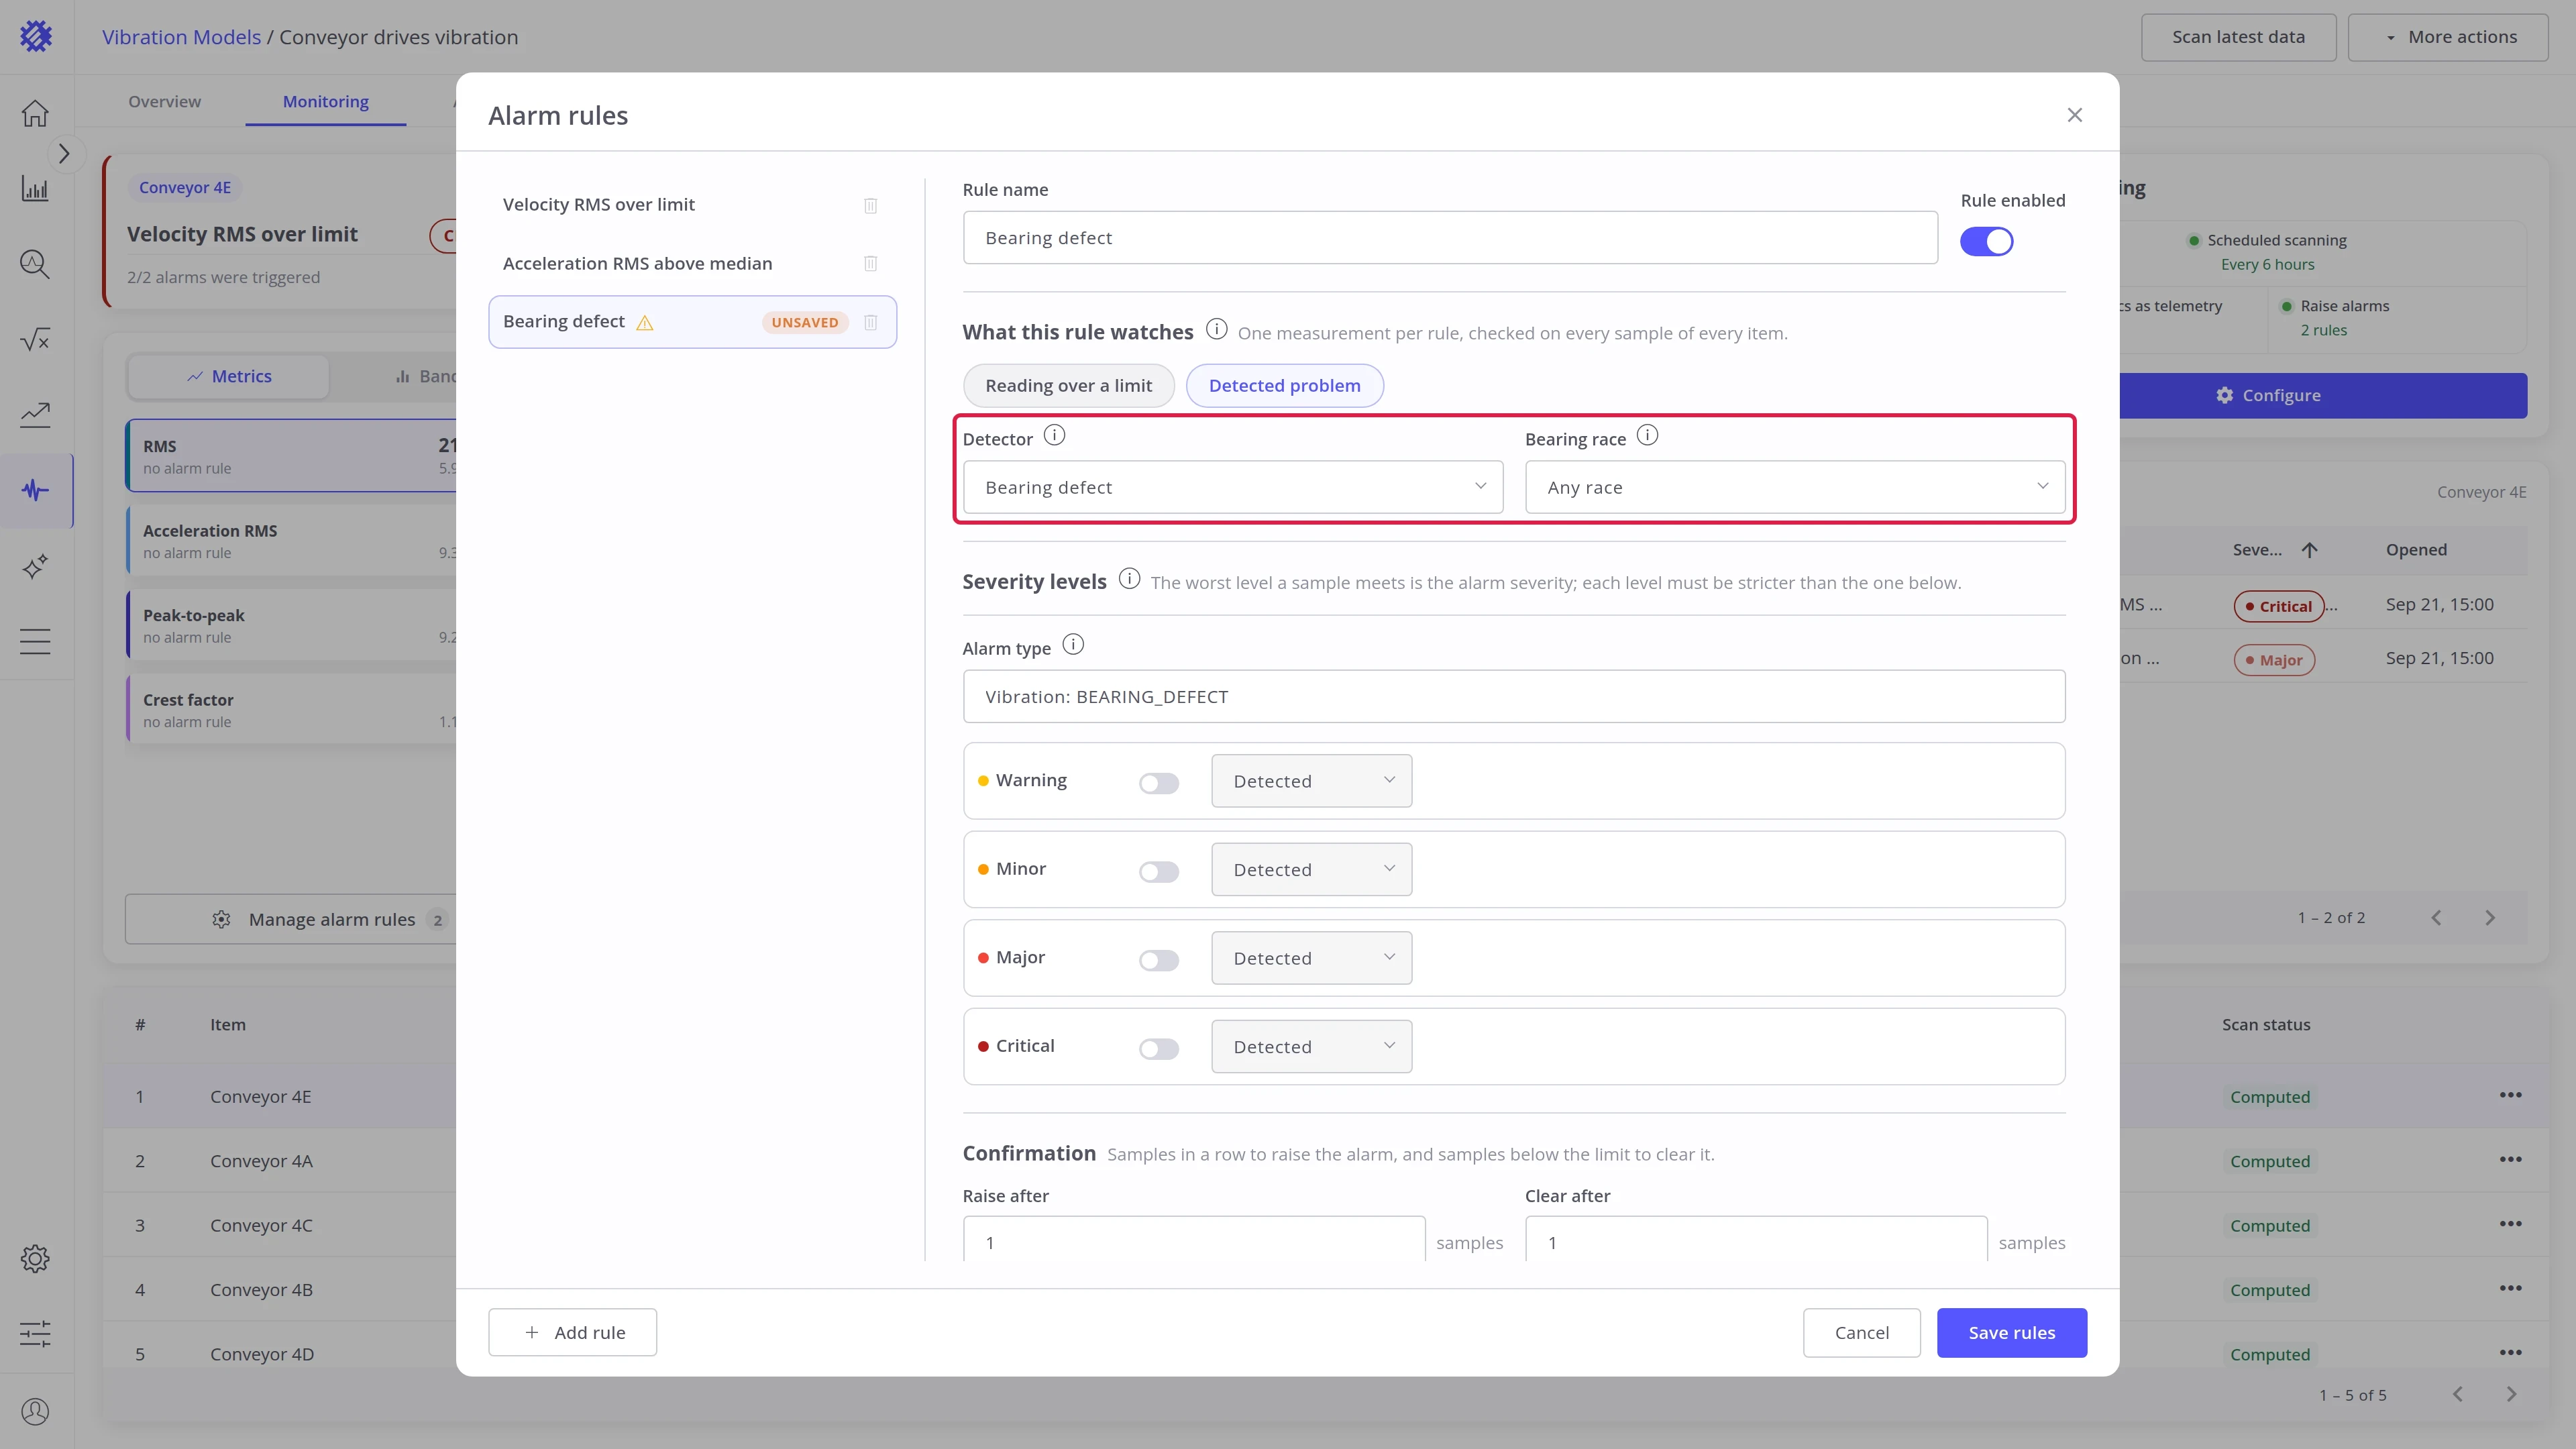
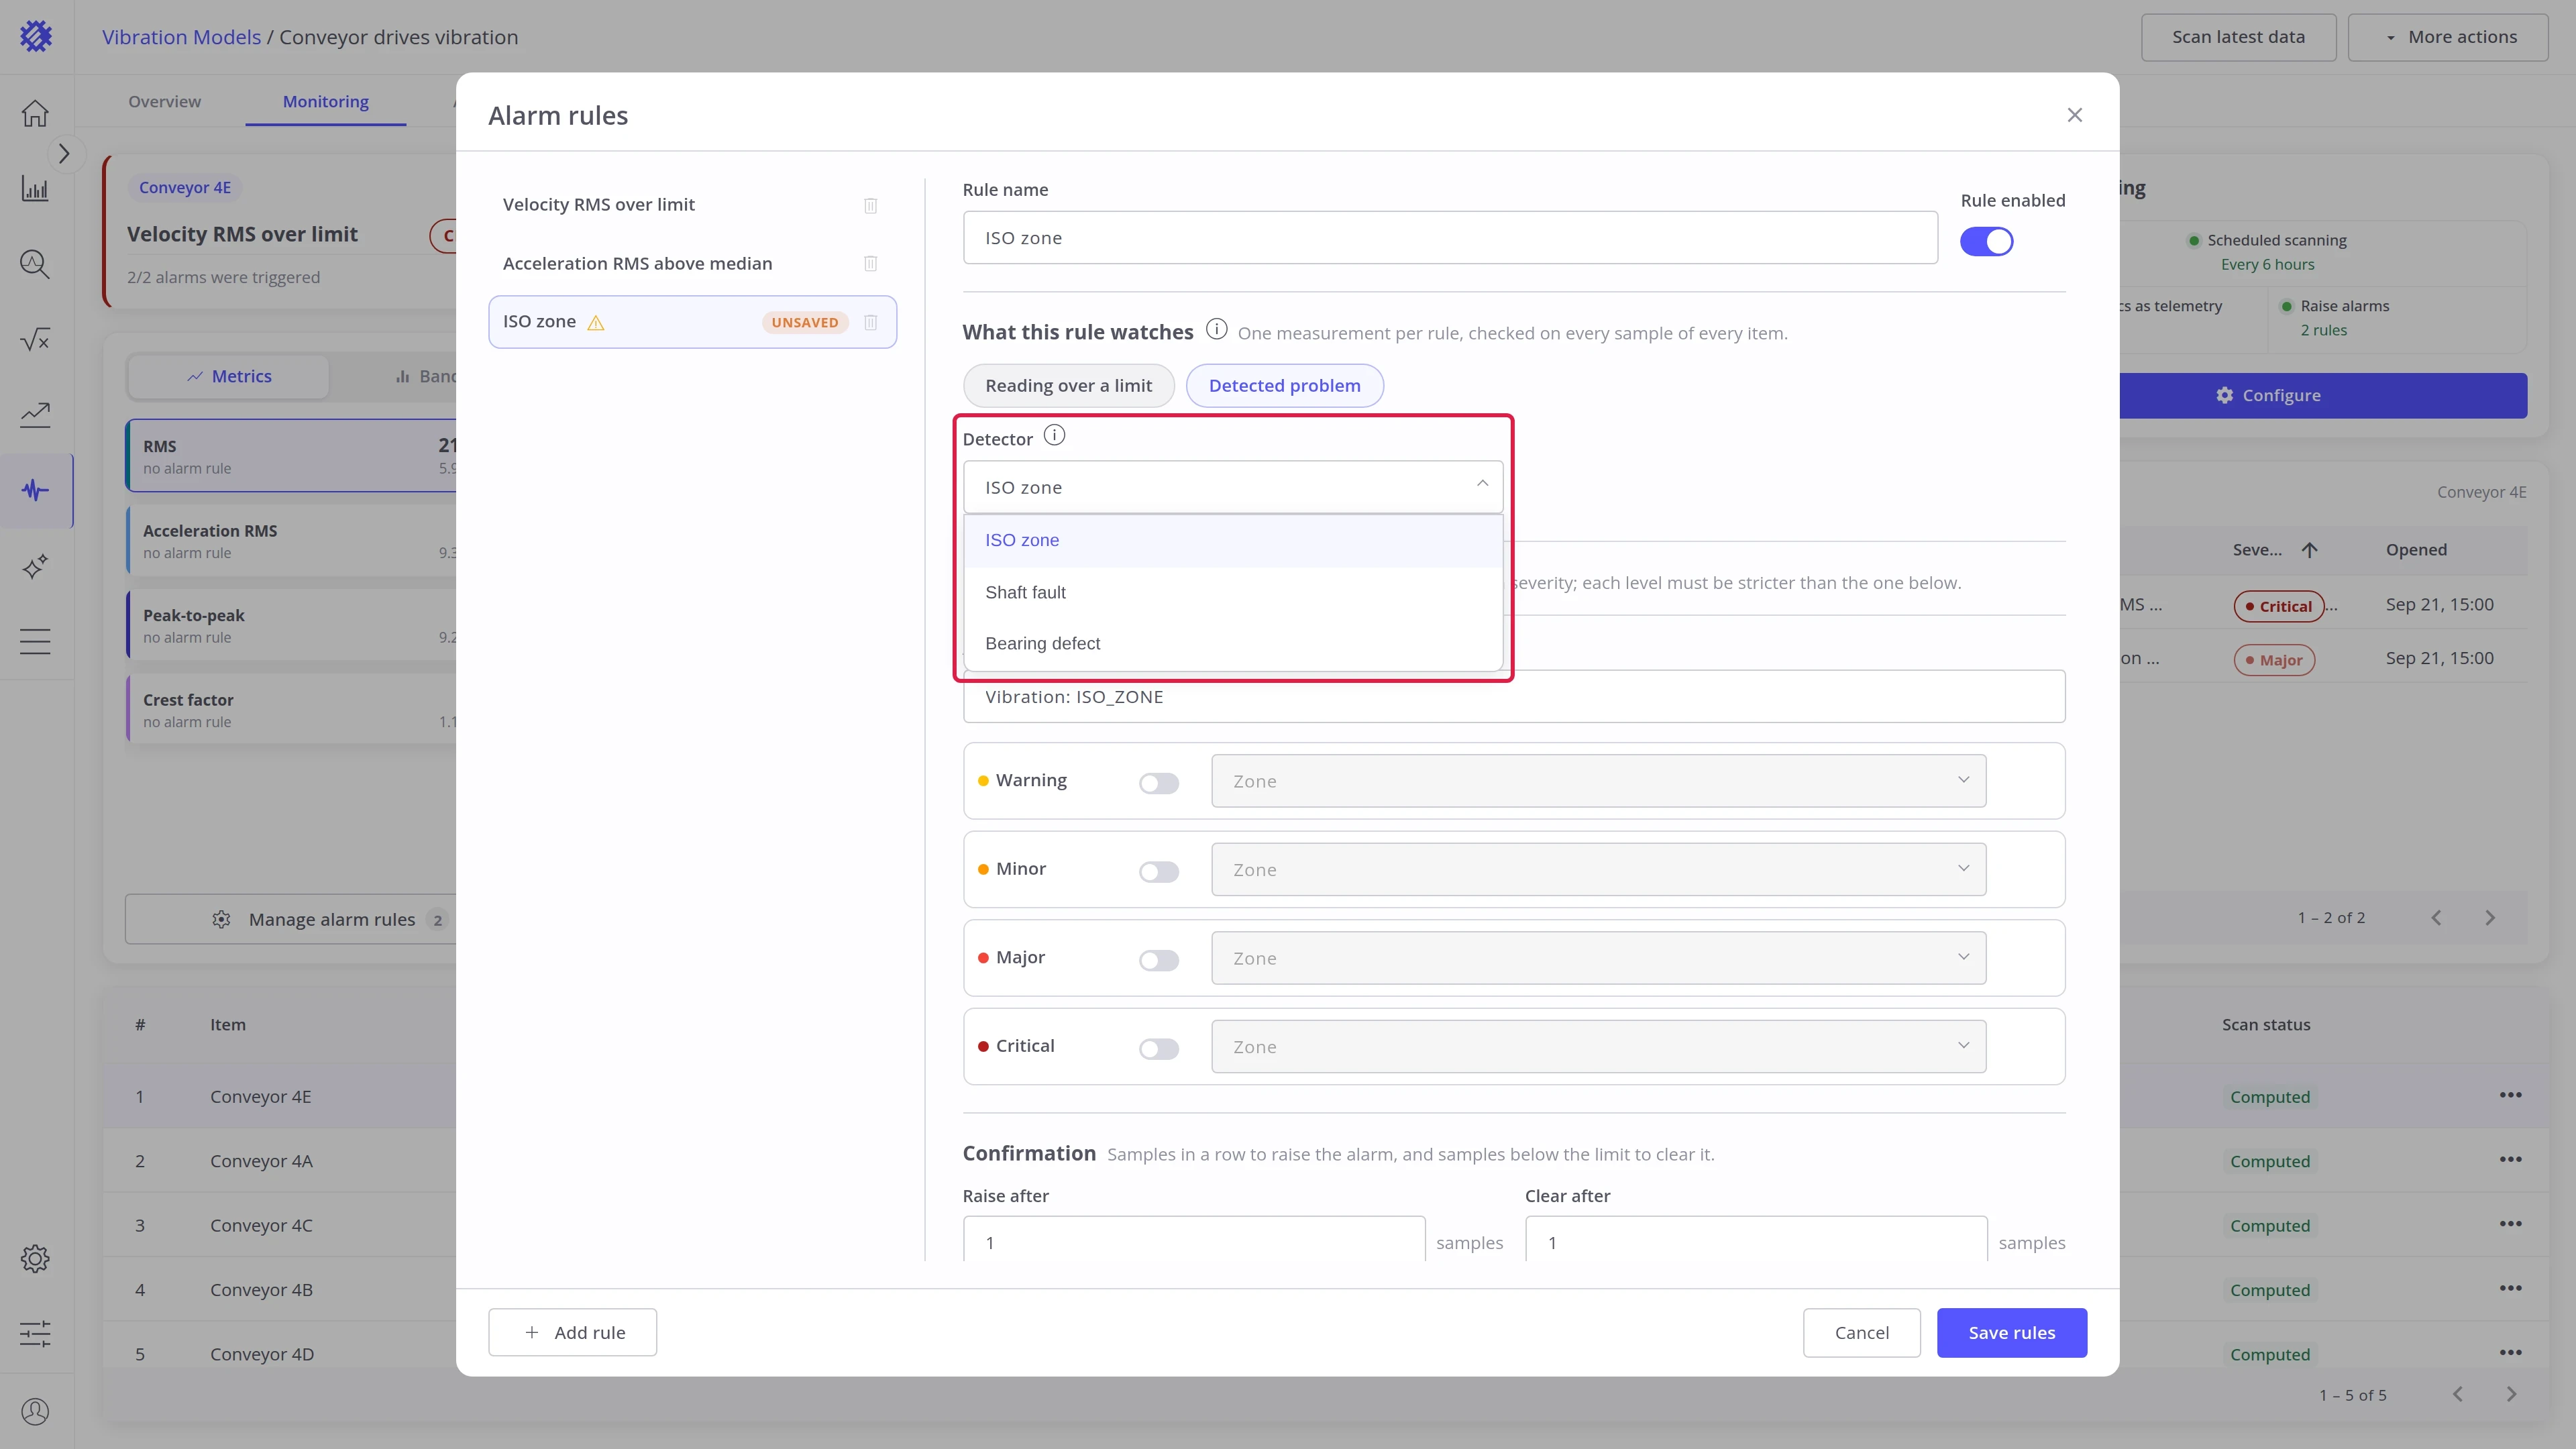
Detected problem. Choose what the analyzer must find.
| Detector | Setting |
|---|---|
| ISO zone | None. Each severity level picks a zone in Step 3 |
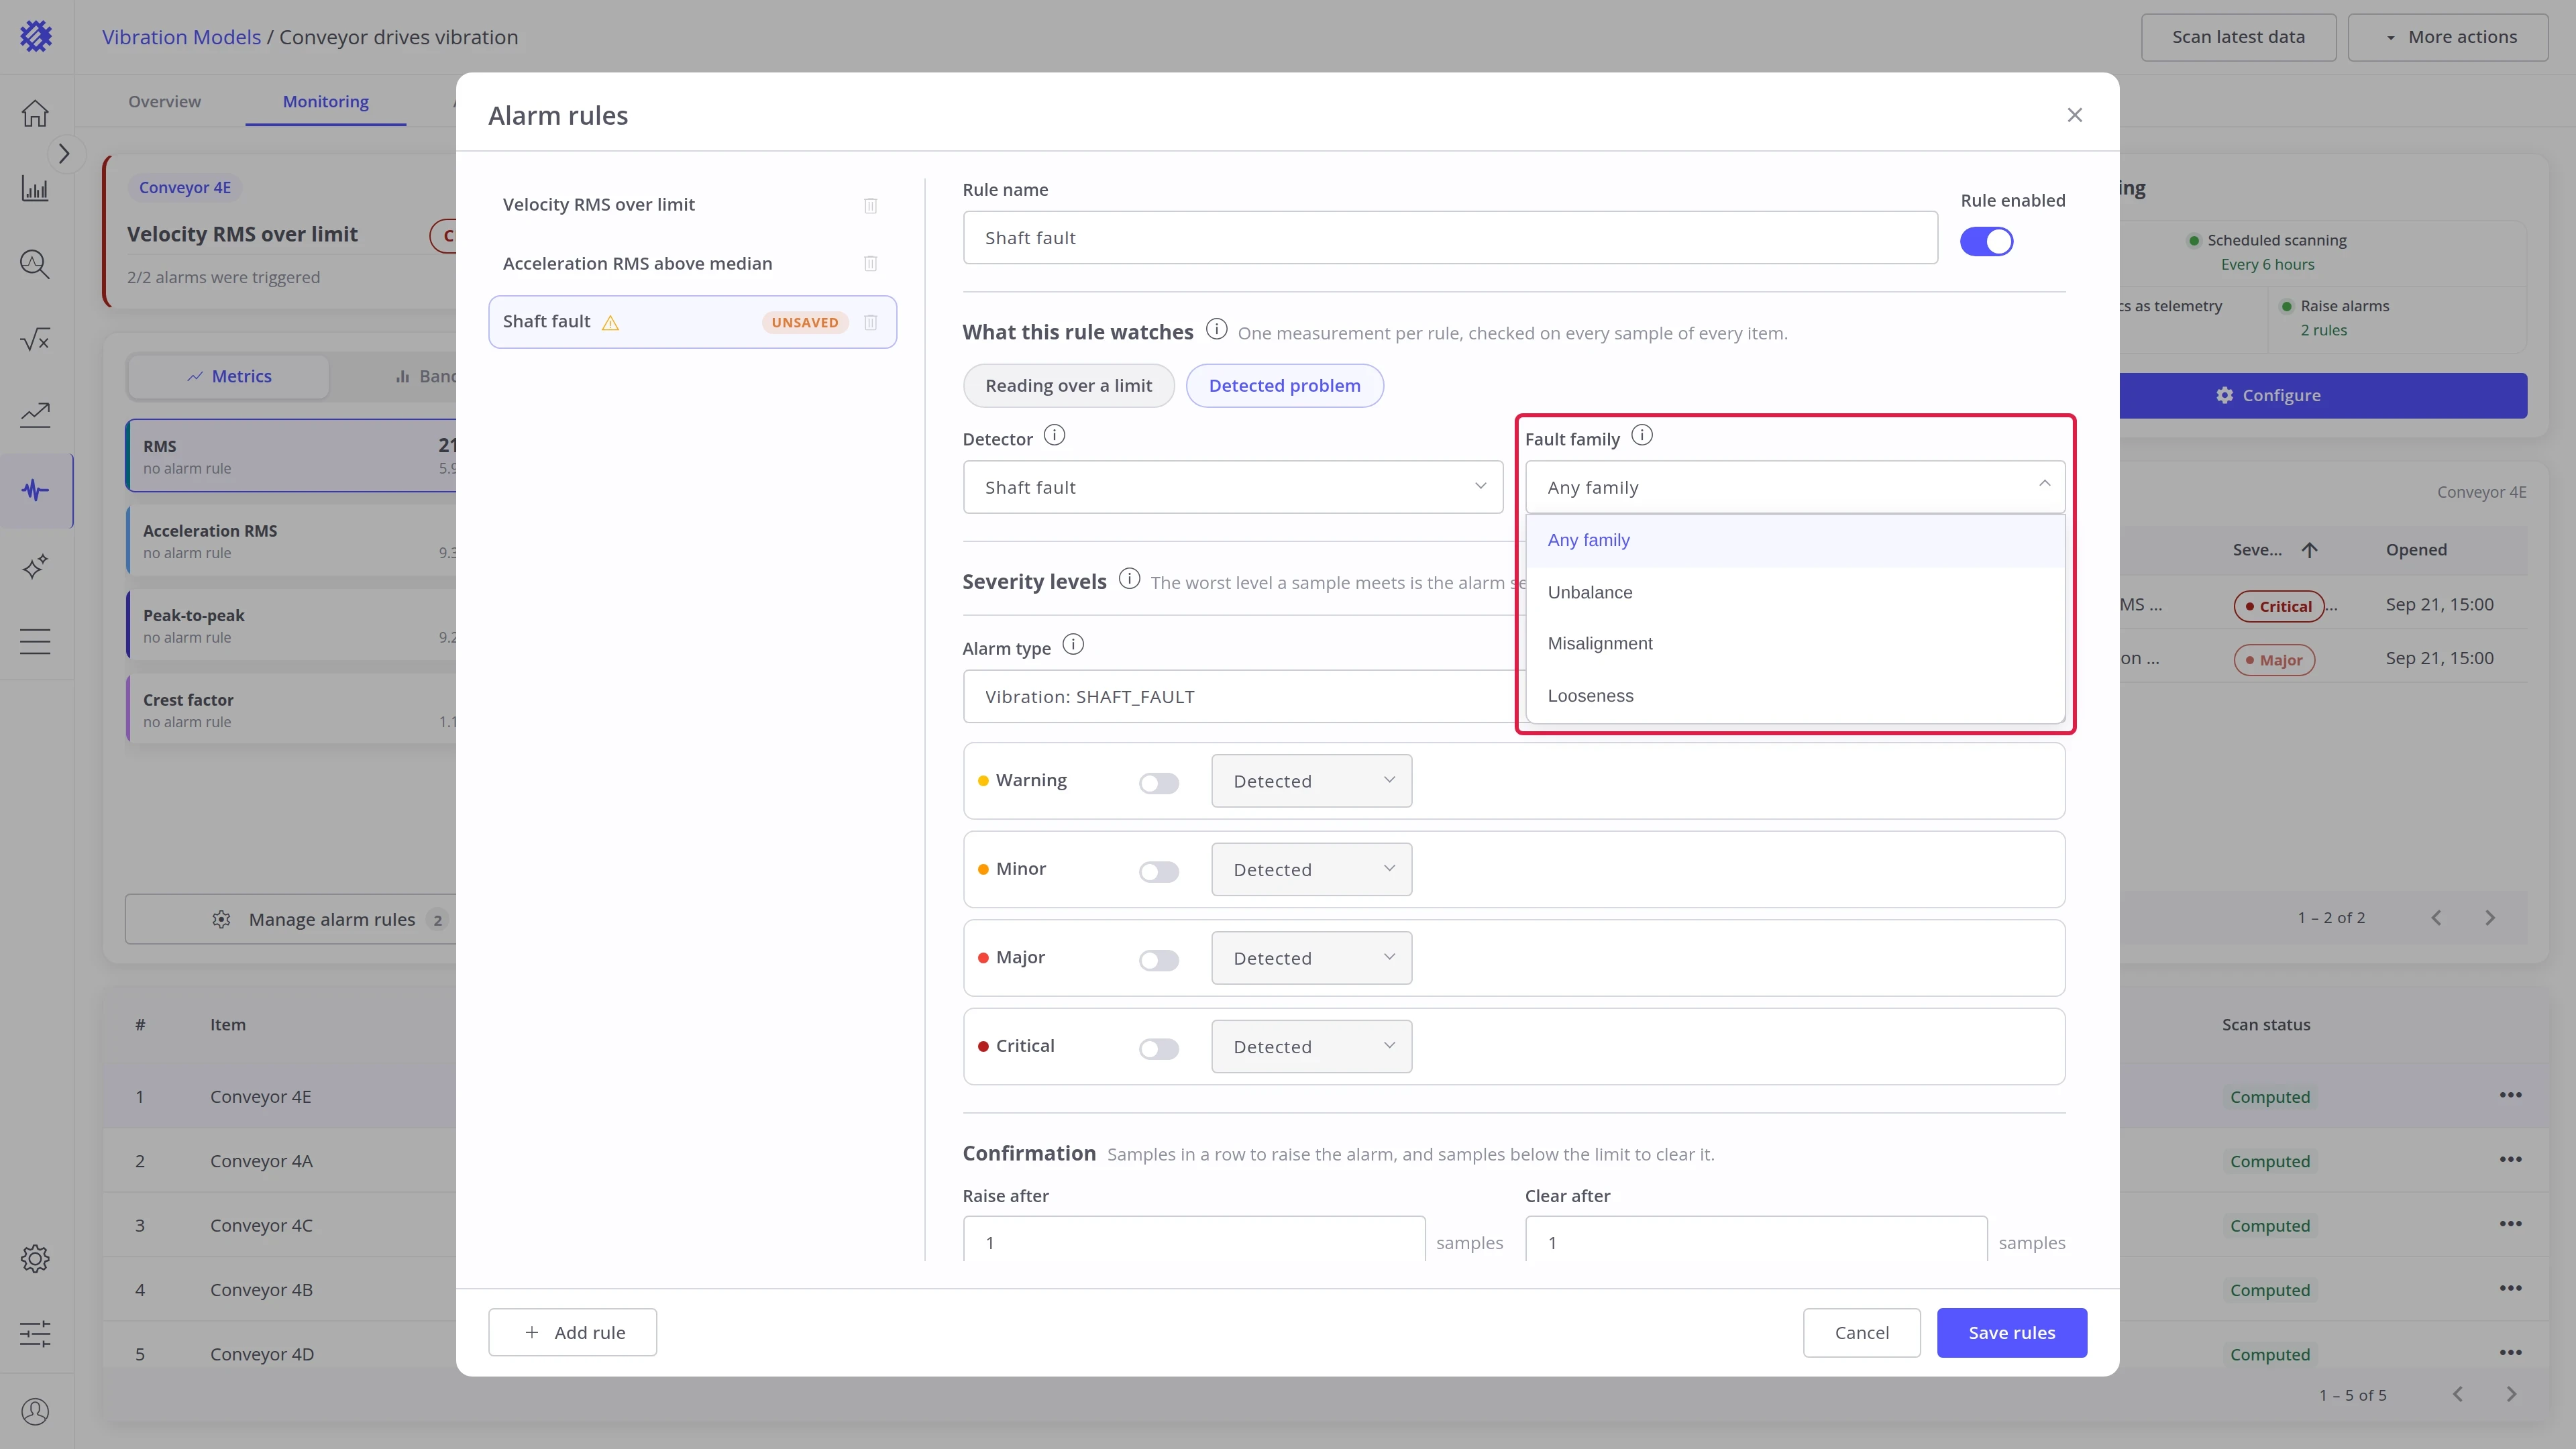
| Shaft fault | Unbalance, misalignment, looseness, or any |
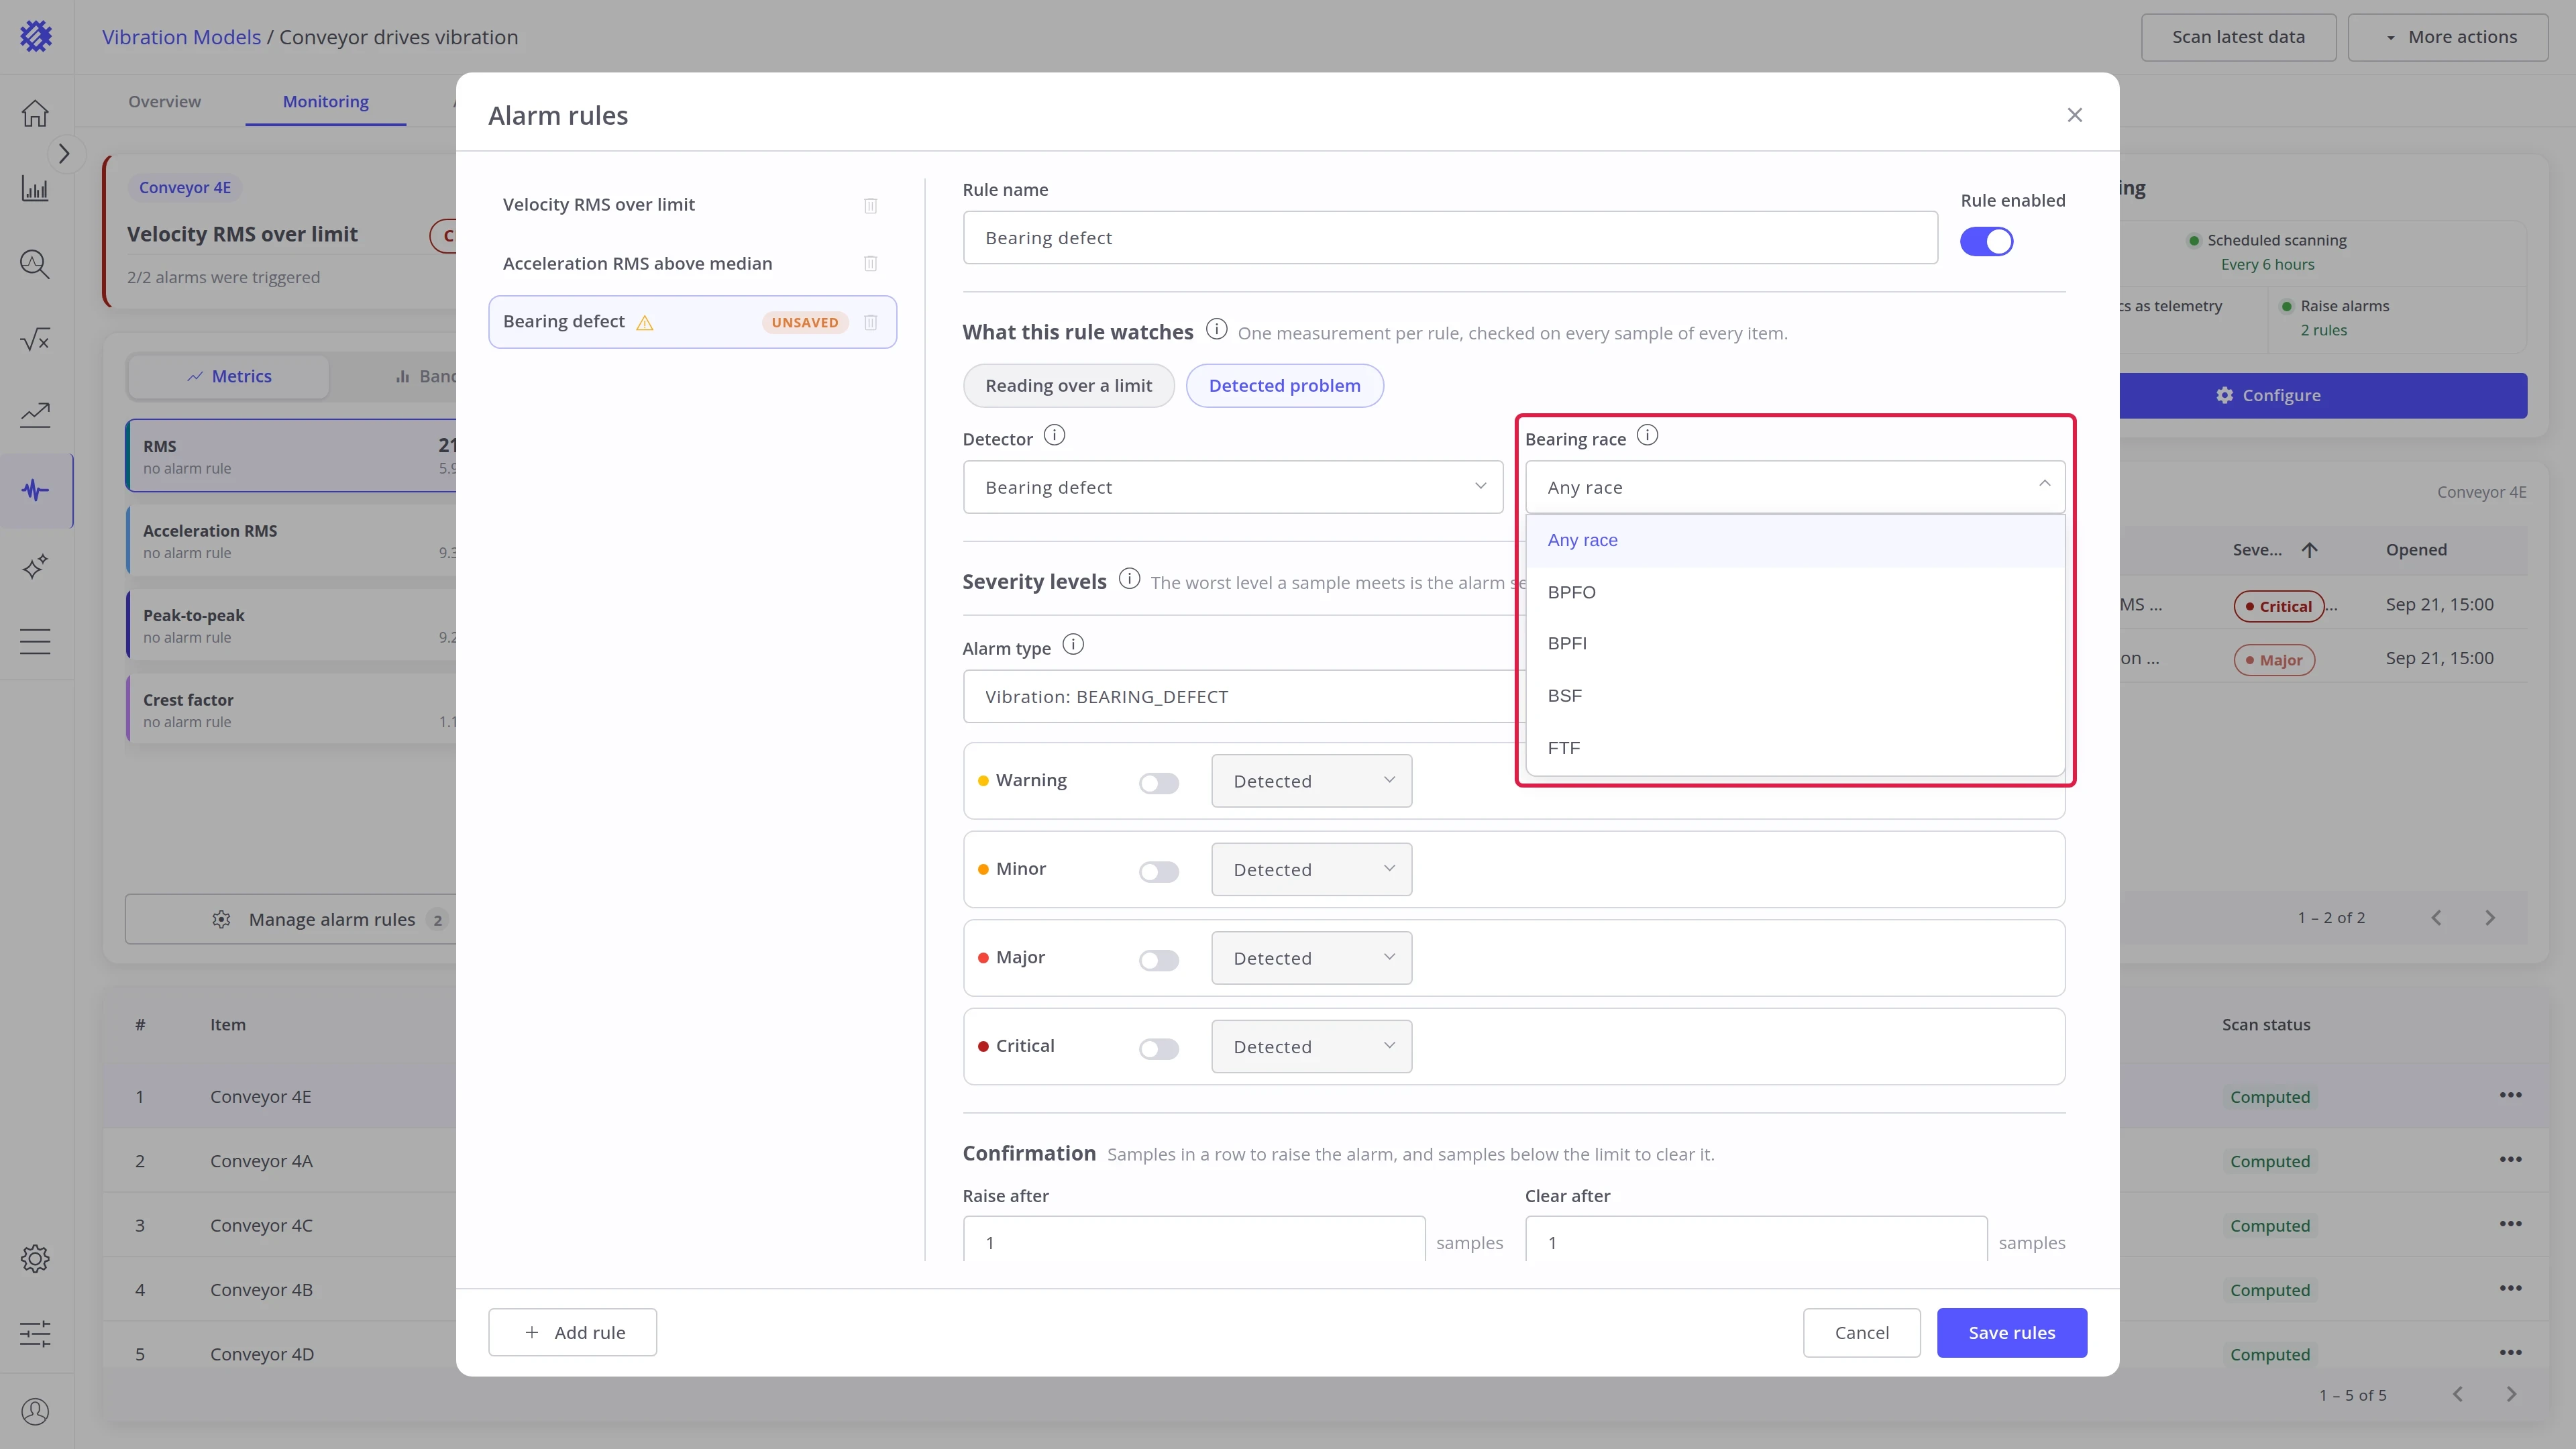
| Bearing defect | BPFO, BPFI, BSF, FTF, or any |
Step 3. Set severity levels
Section titled “Step 3. Set severity levels”A rule has four levels: Warning, Minor, Major, and Critical. Switch on the ones you need and give each a limit. Each level must be stricter than the one below it. The worst level a sample meets sets the alarm’s severity.
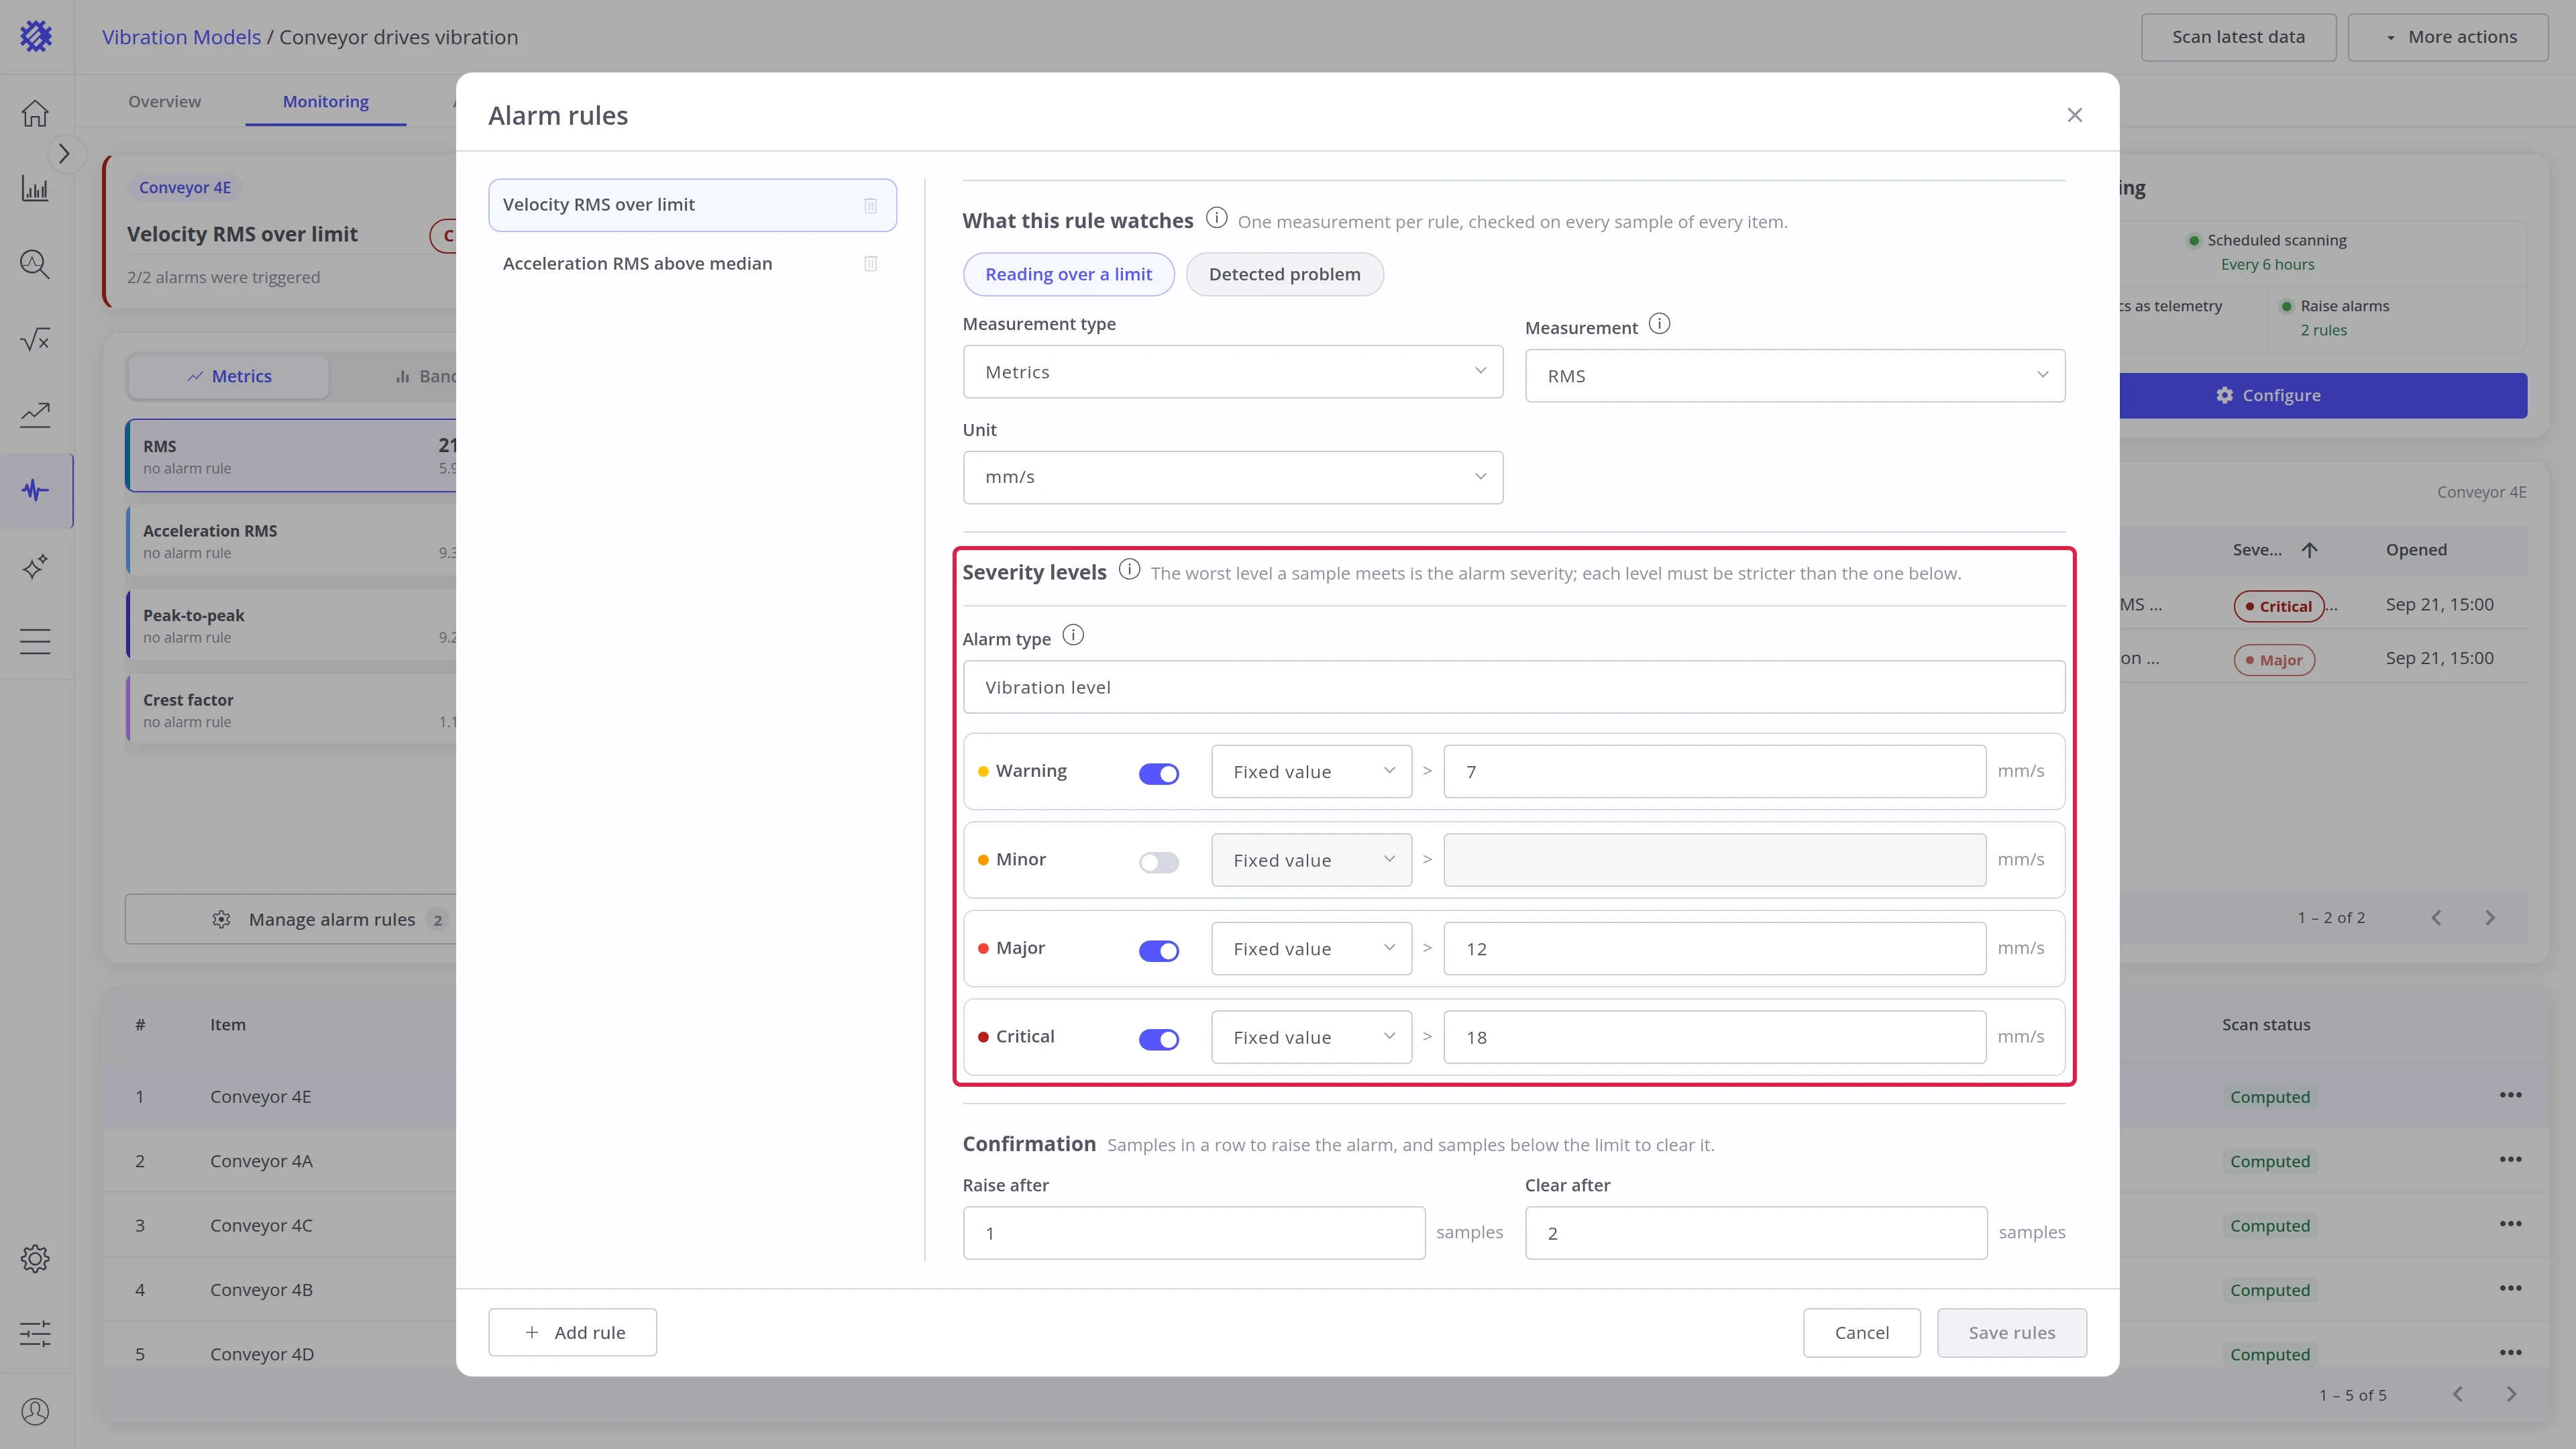
Alarm type is the name of the alarm in ThingsBoard. Rules that share a type raise a single alarm per machine.
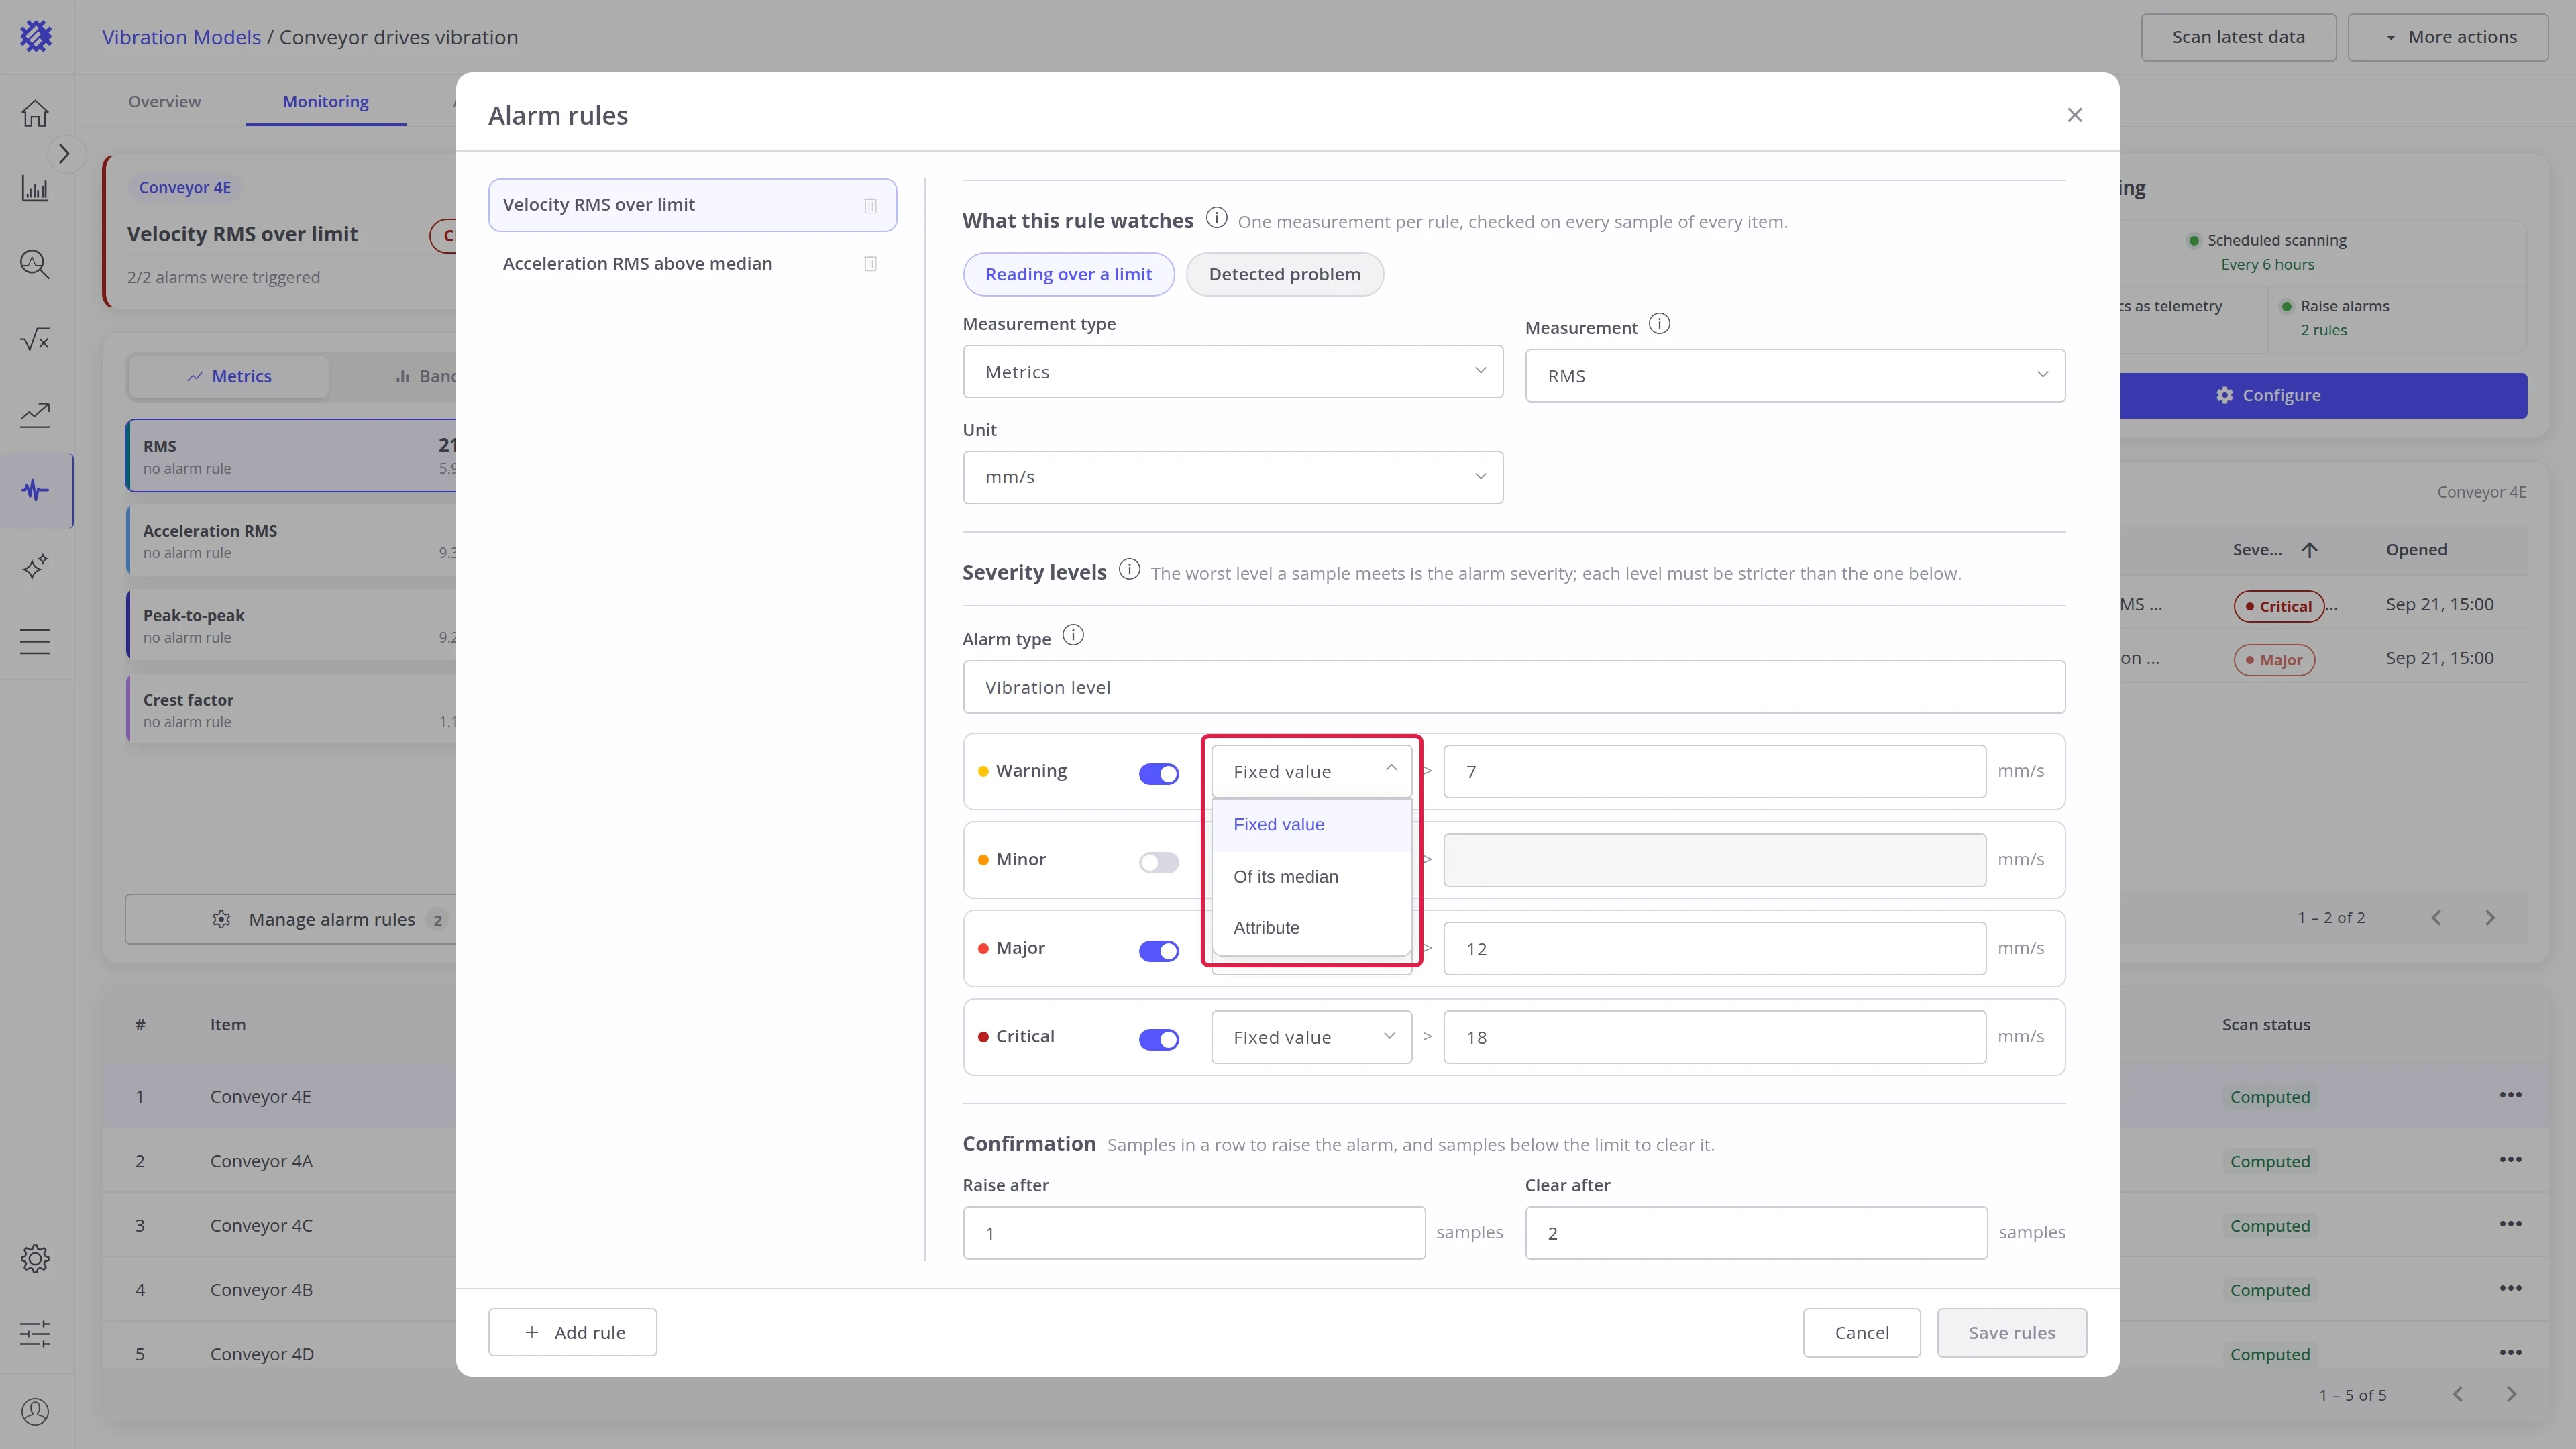
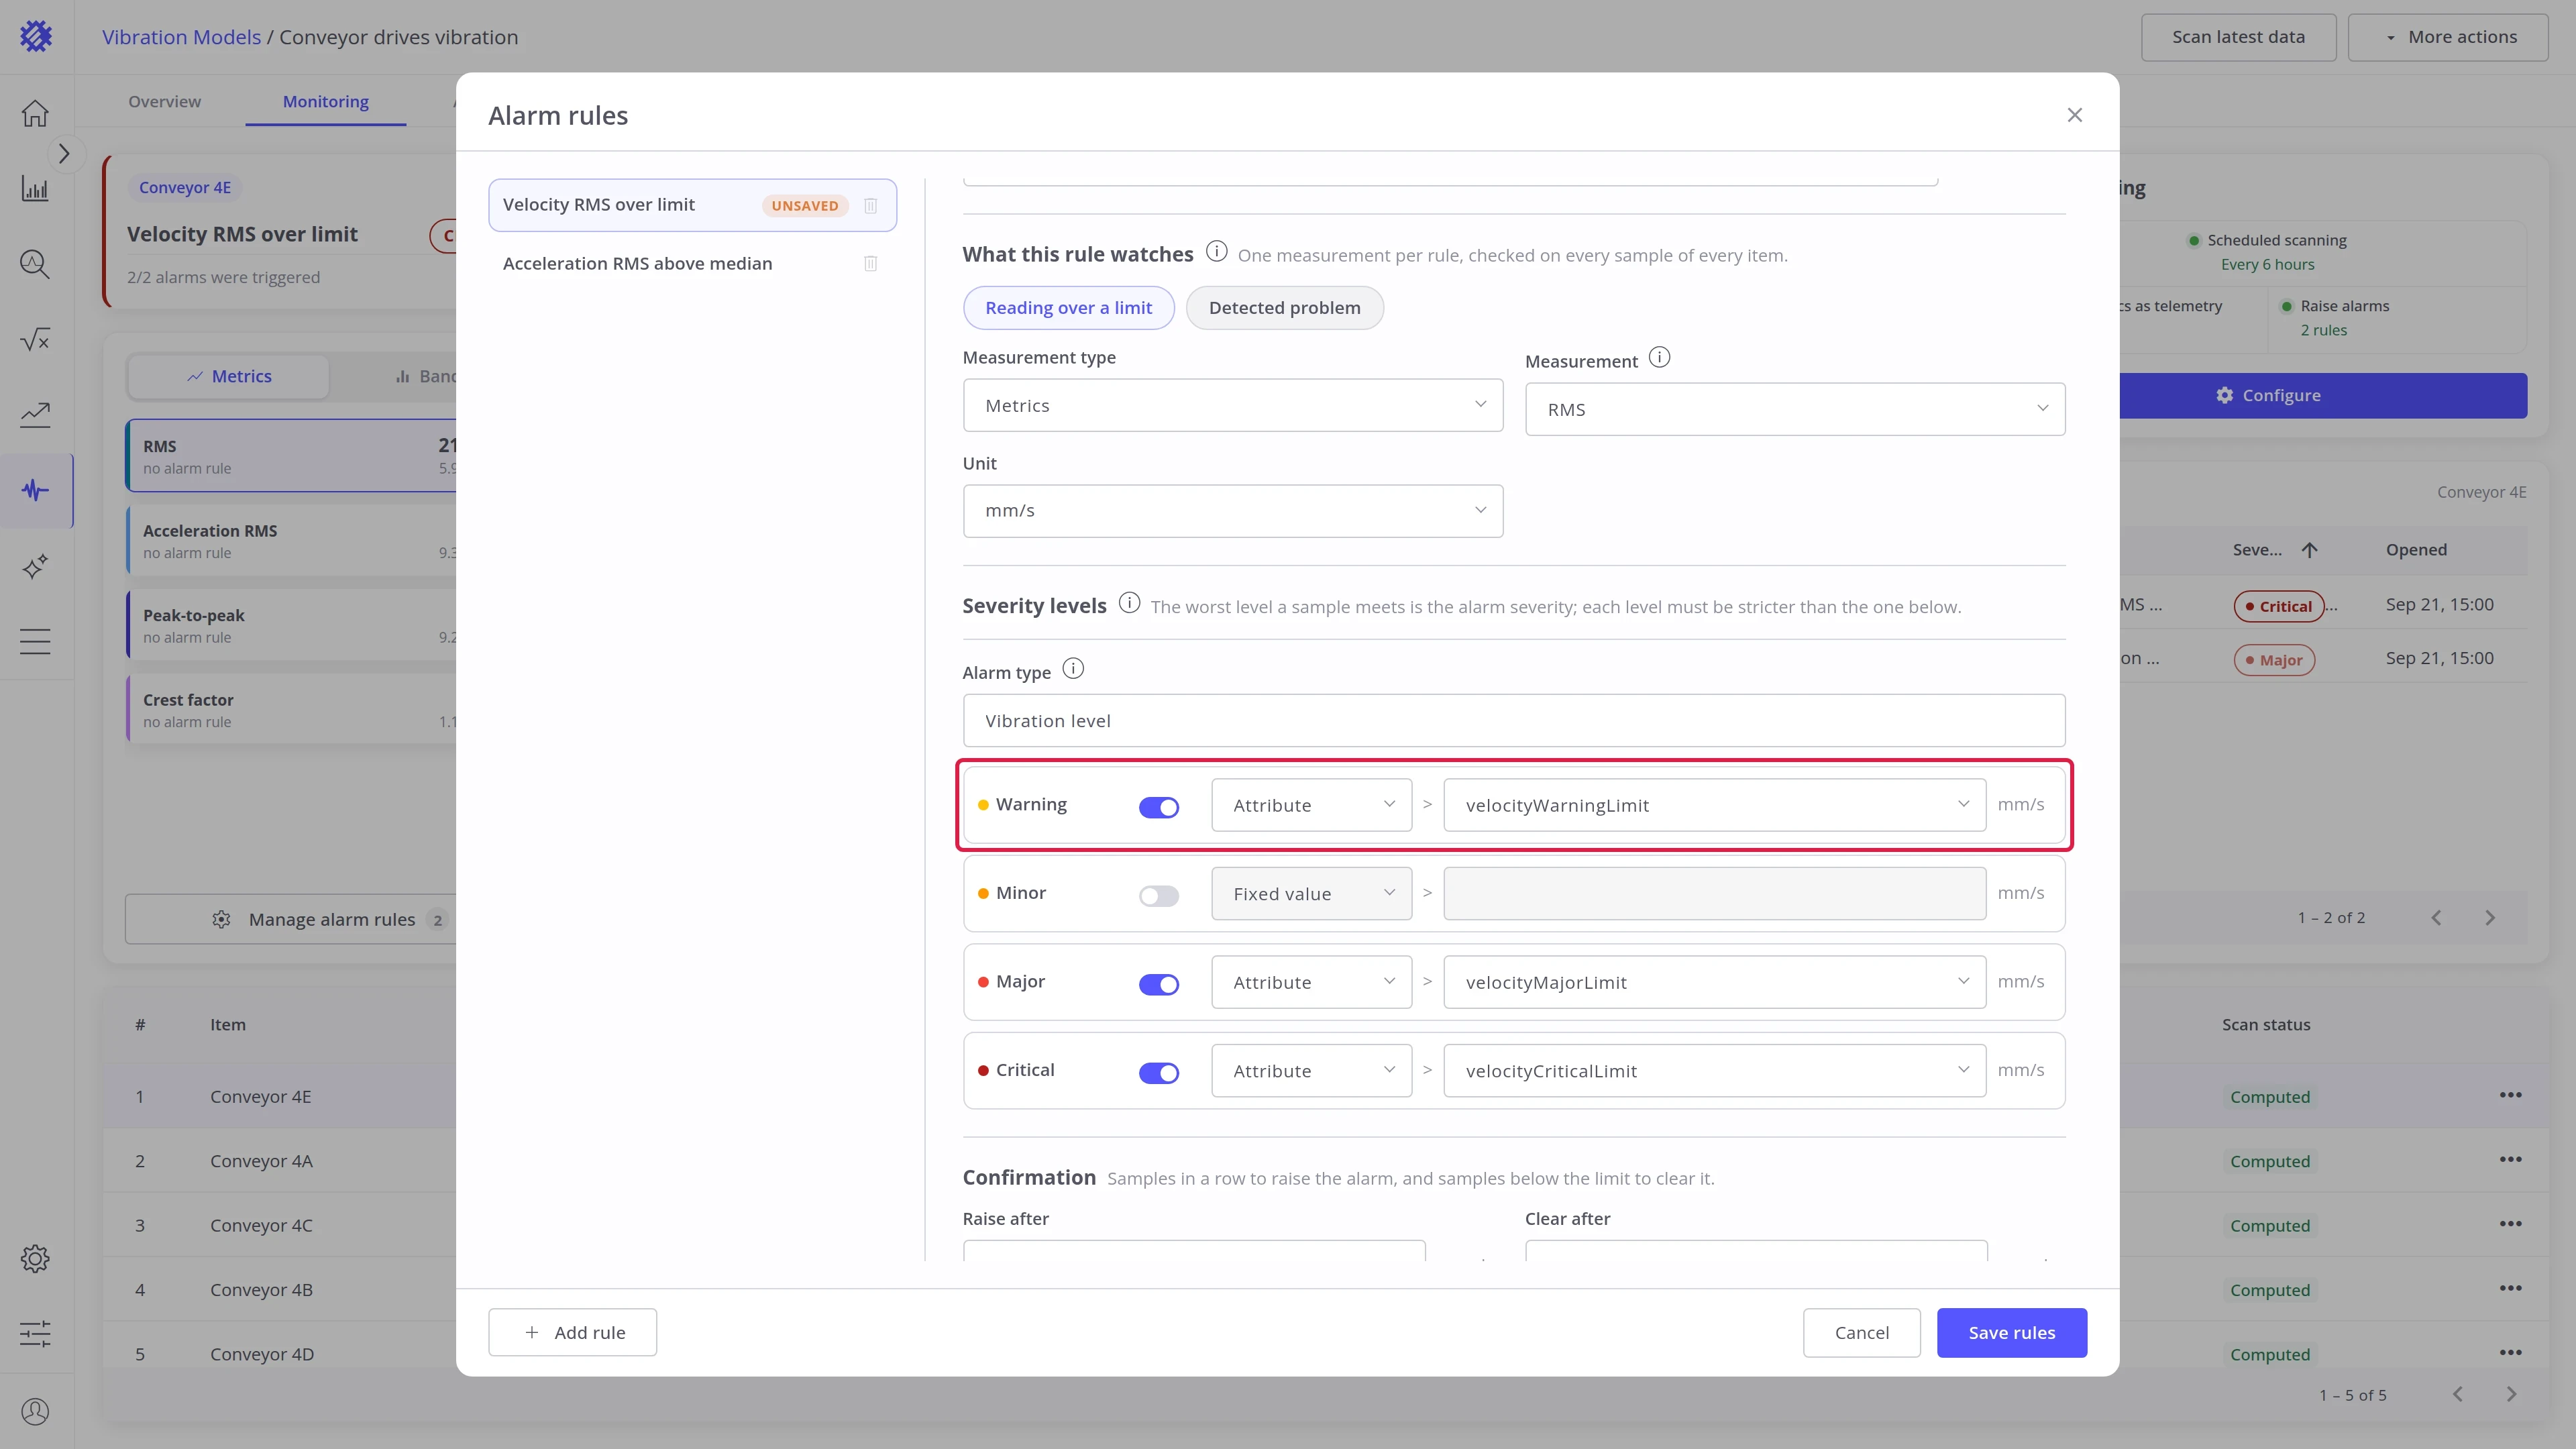
Reading over a limit. Each level takes its limit from one of three sources:
| Limit | The level fires when the reading is above |
|---|---|
| Fixed value | A number you type, for example 7 mm/s |
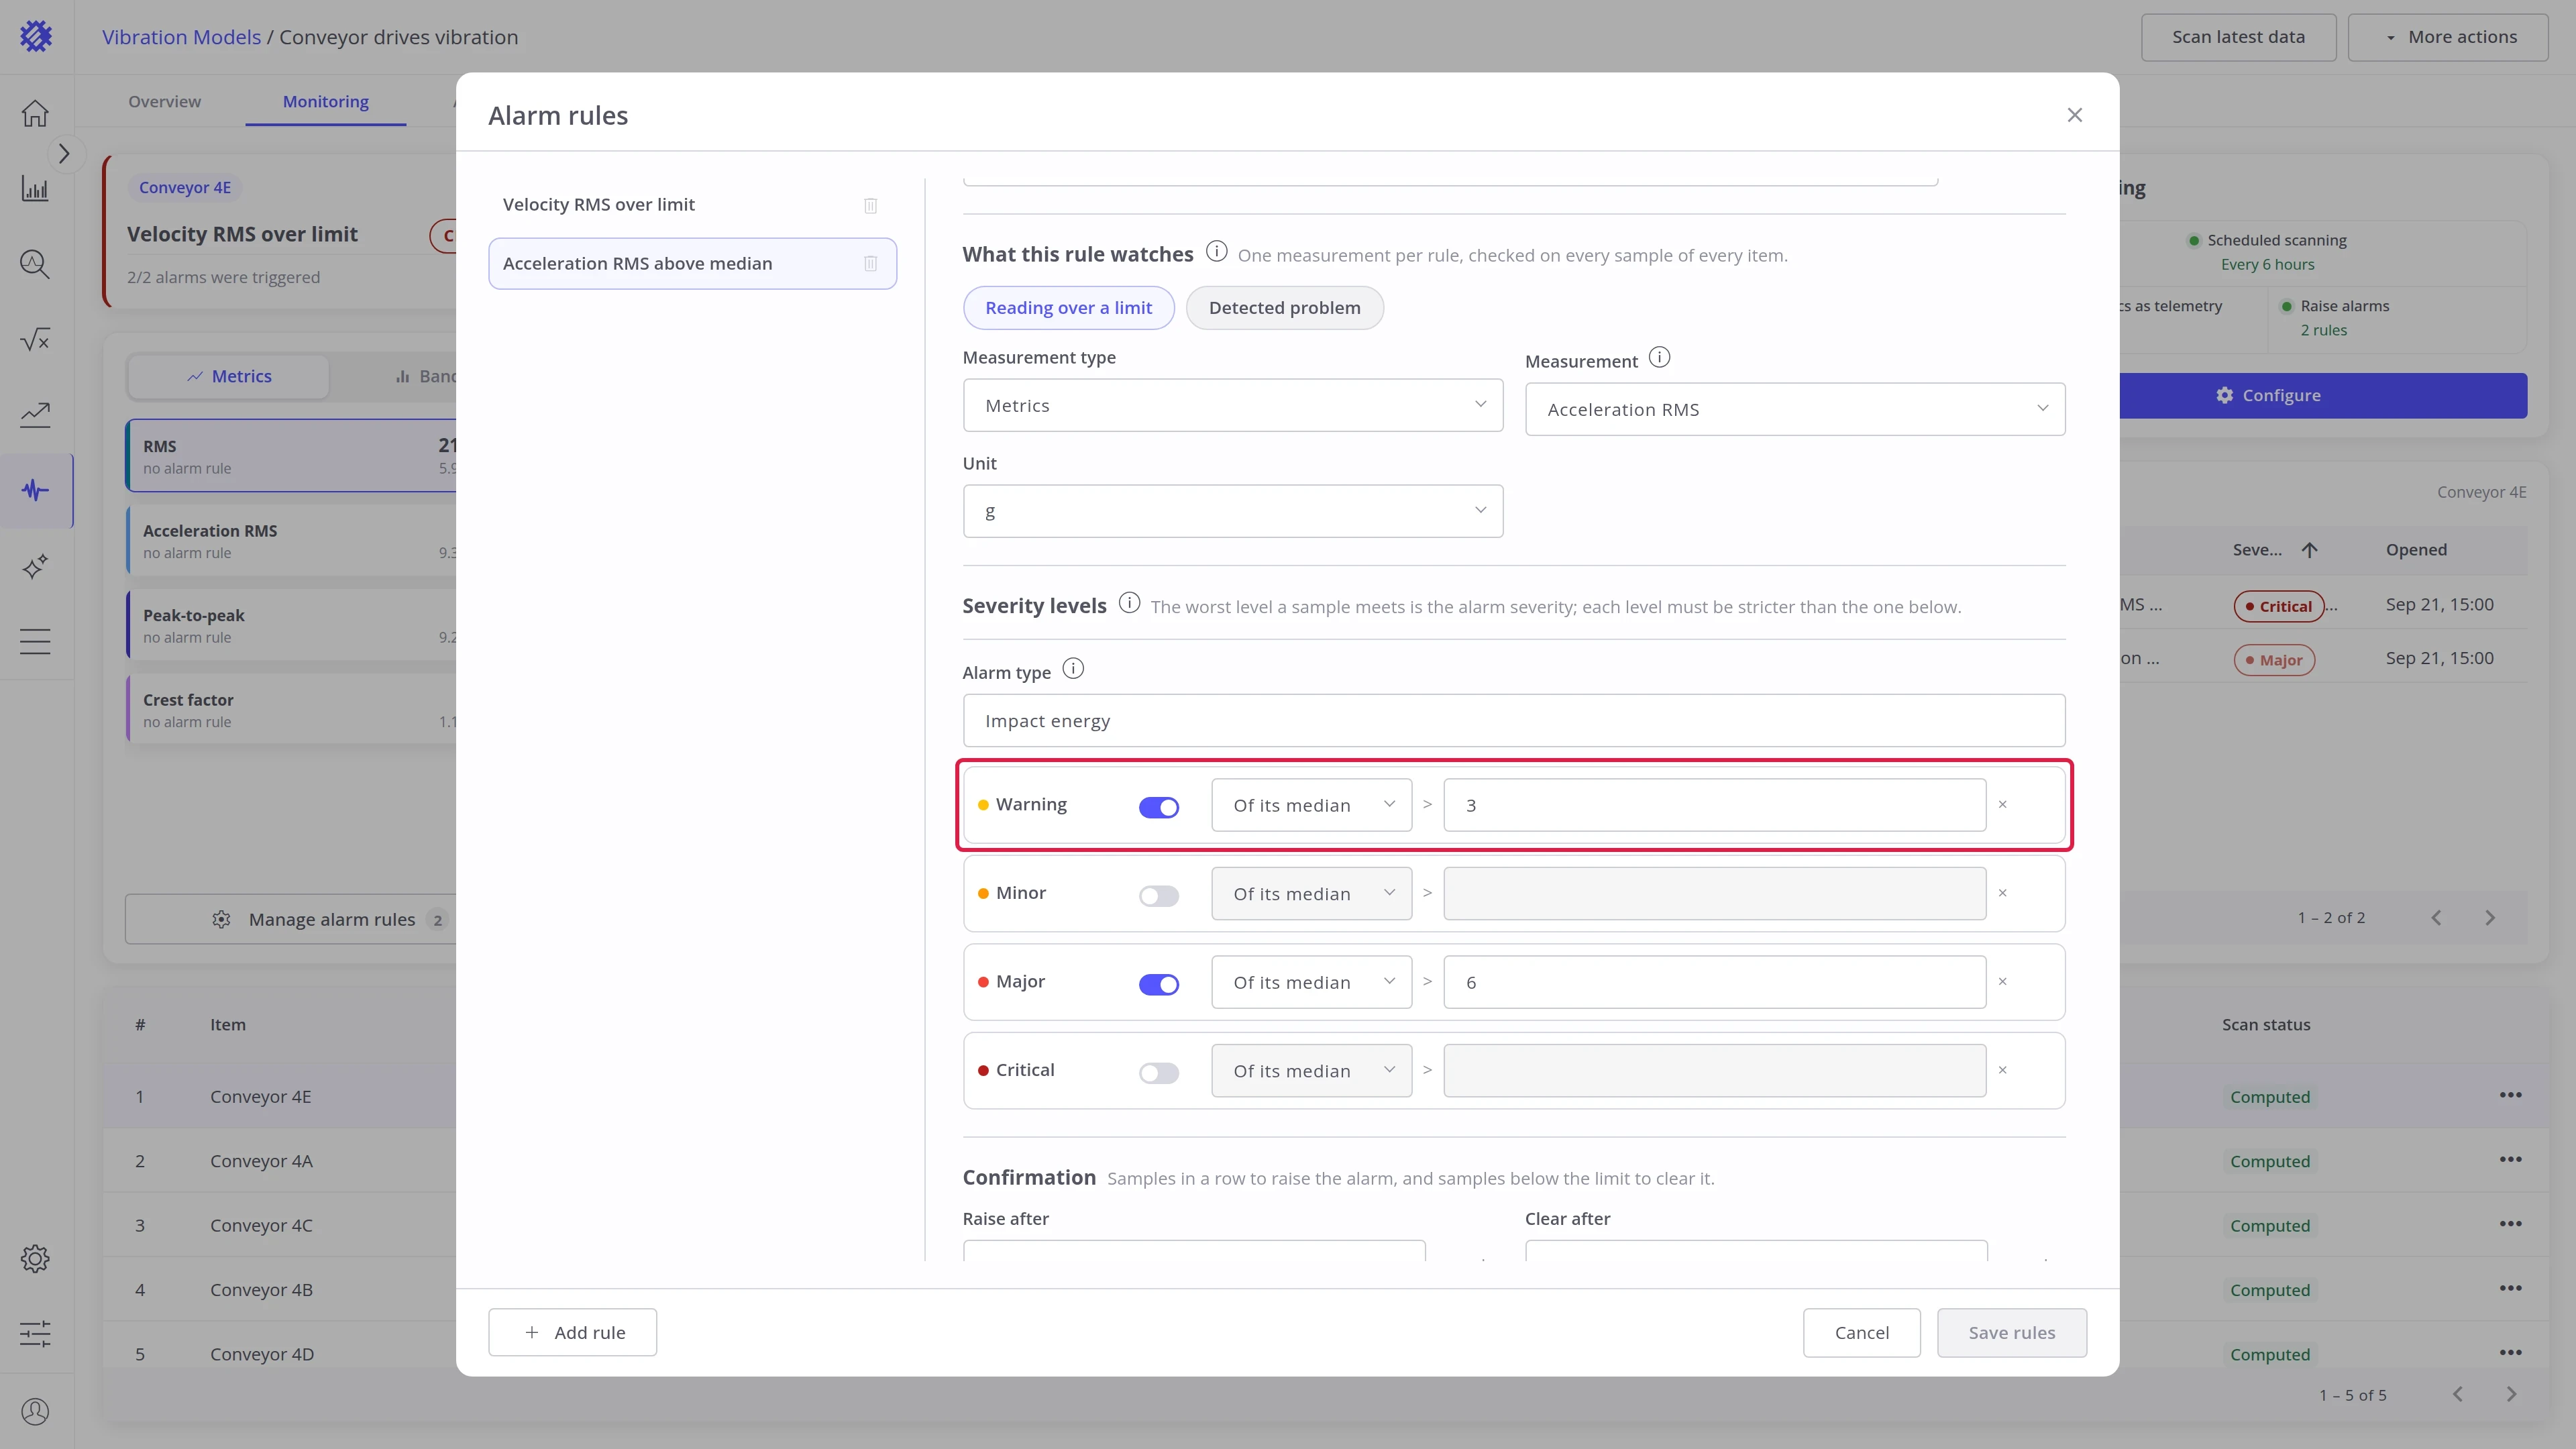
| Of its median | A multiple of the machine’s own median, for example 3× |
| Attribute | A number stored in an attribute of the machine, for example velocityWarningLimit |
With Of its median, one rule fits machines that vibrate differently. Any metric and Any band always use it.
Detected problem. Each level says what counts:
| Detector | Level options |
|---|---|
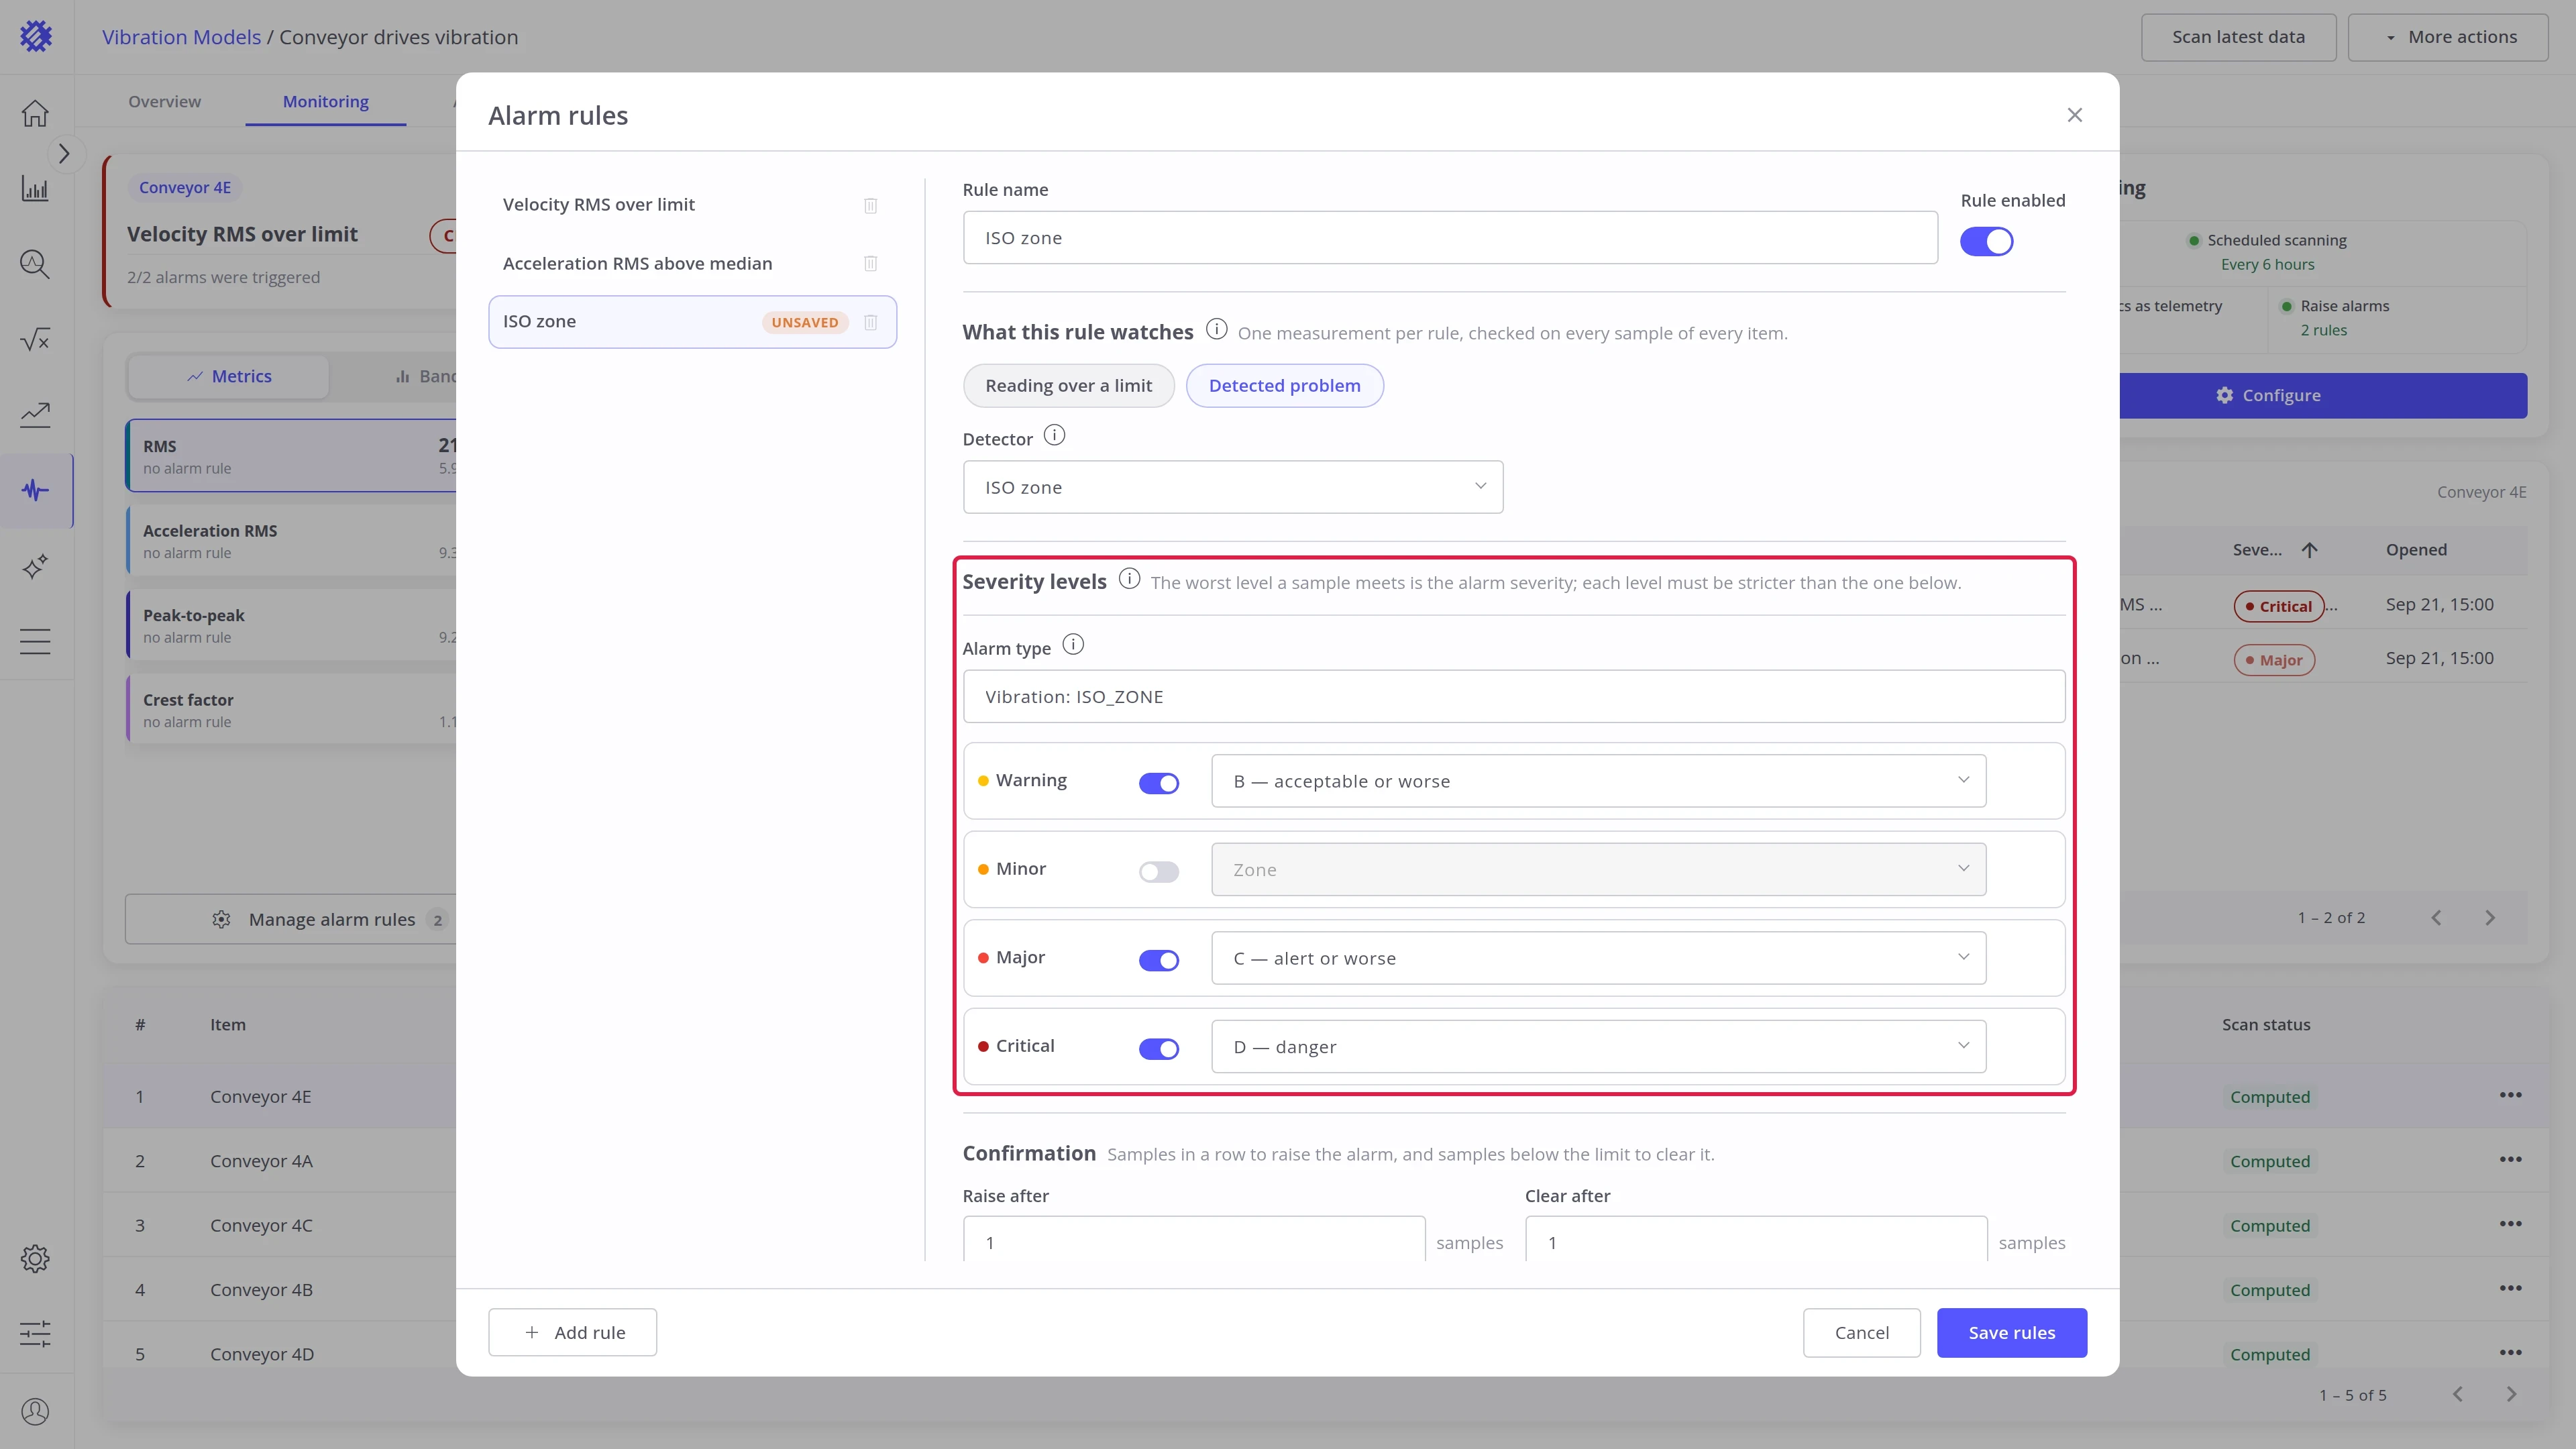
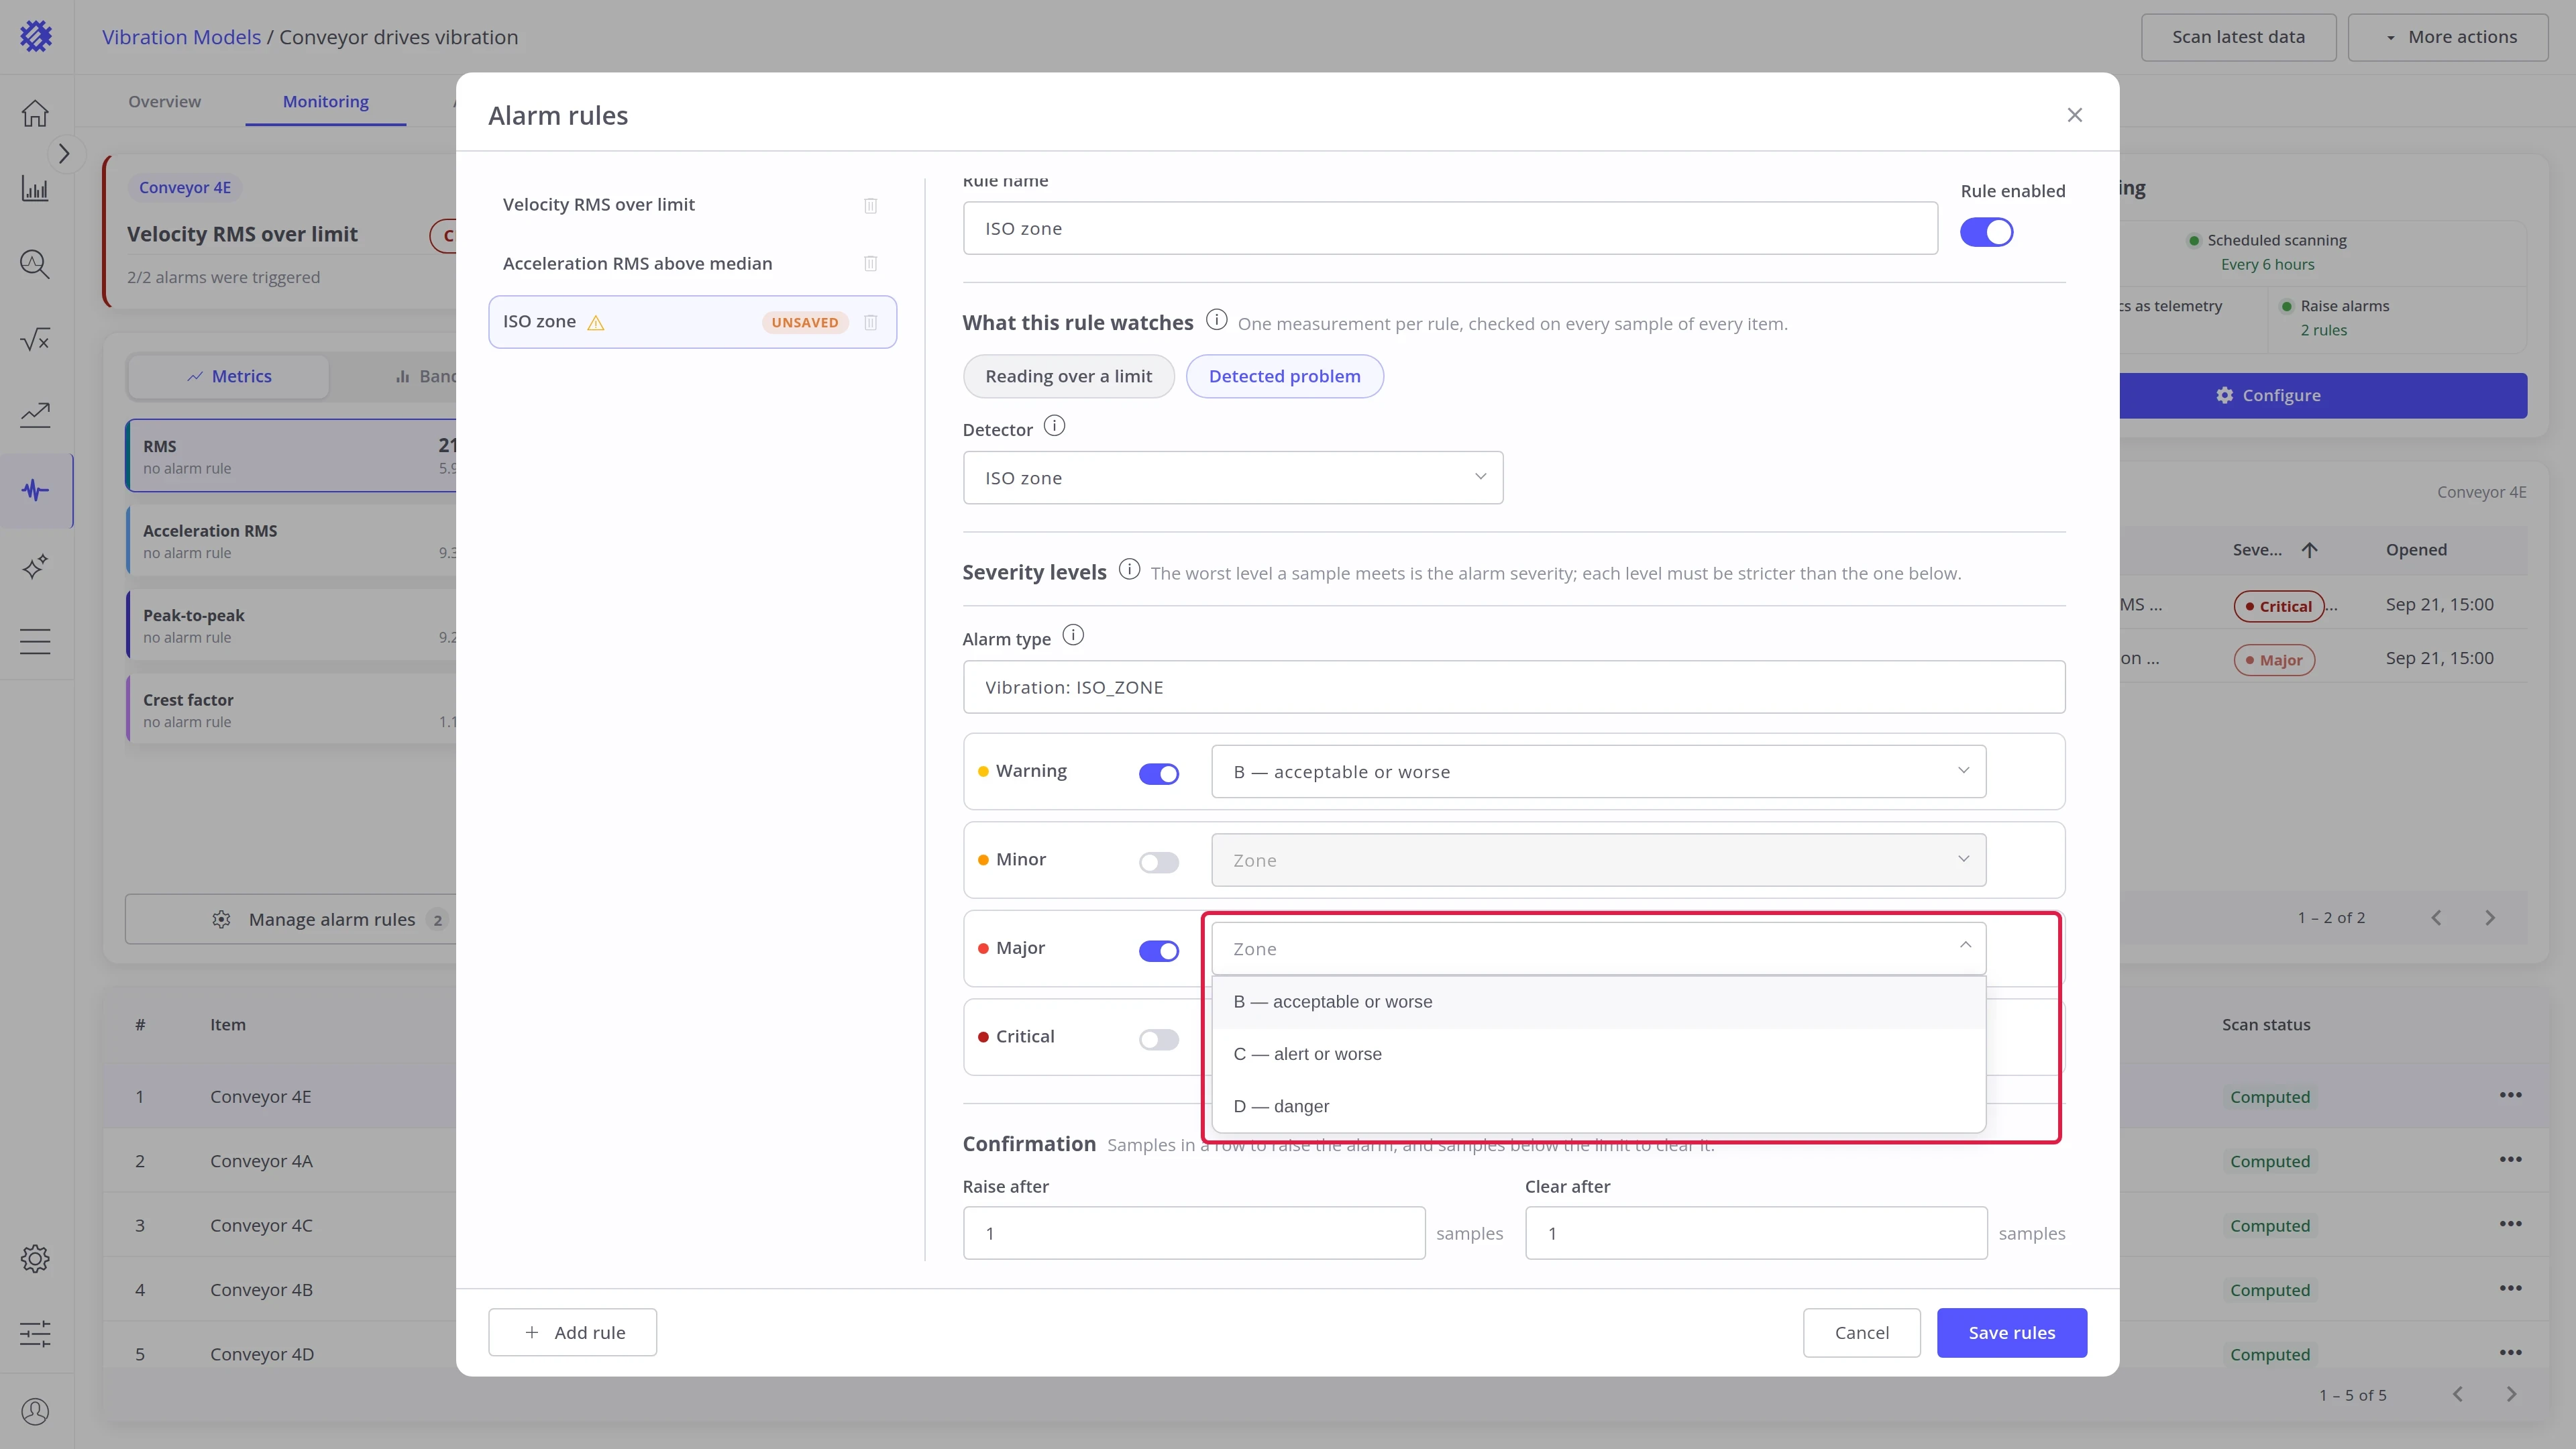
| ISO zone | B — acceptable or worse, C — alert or worse, or D — danger |
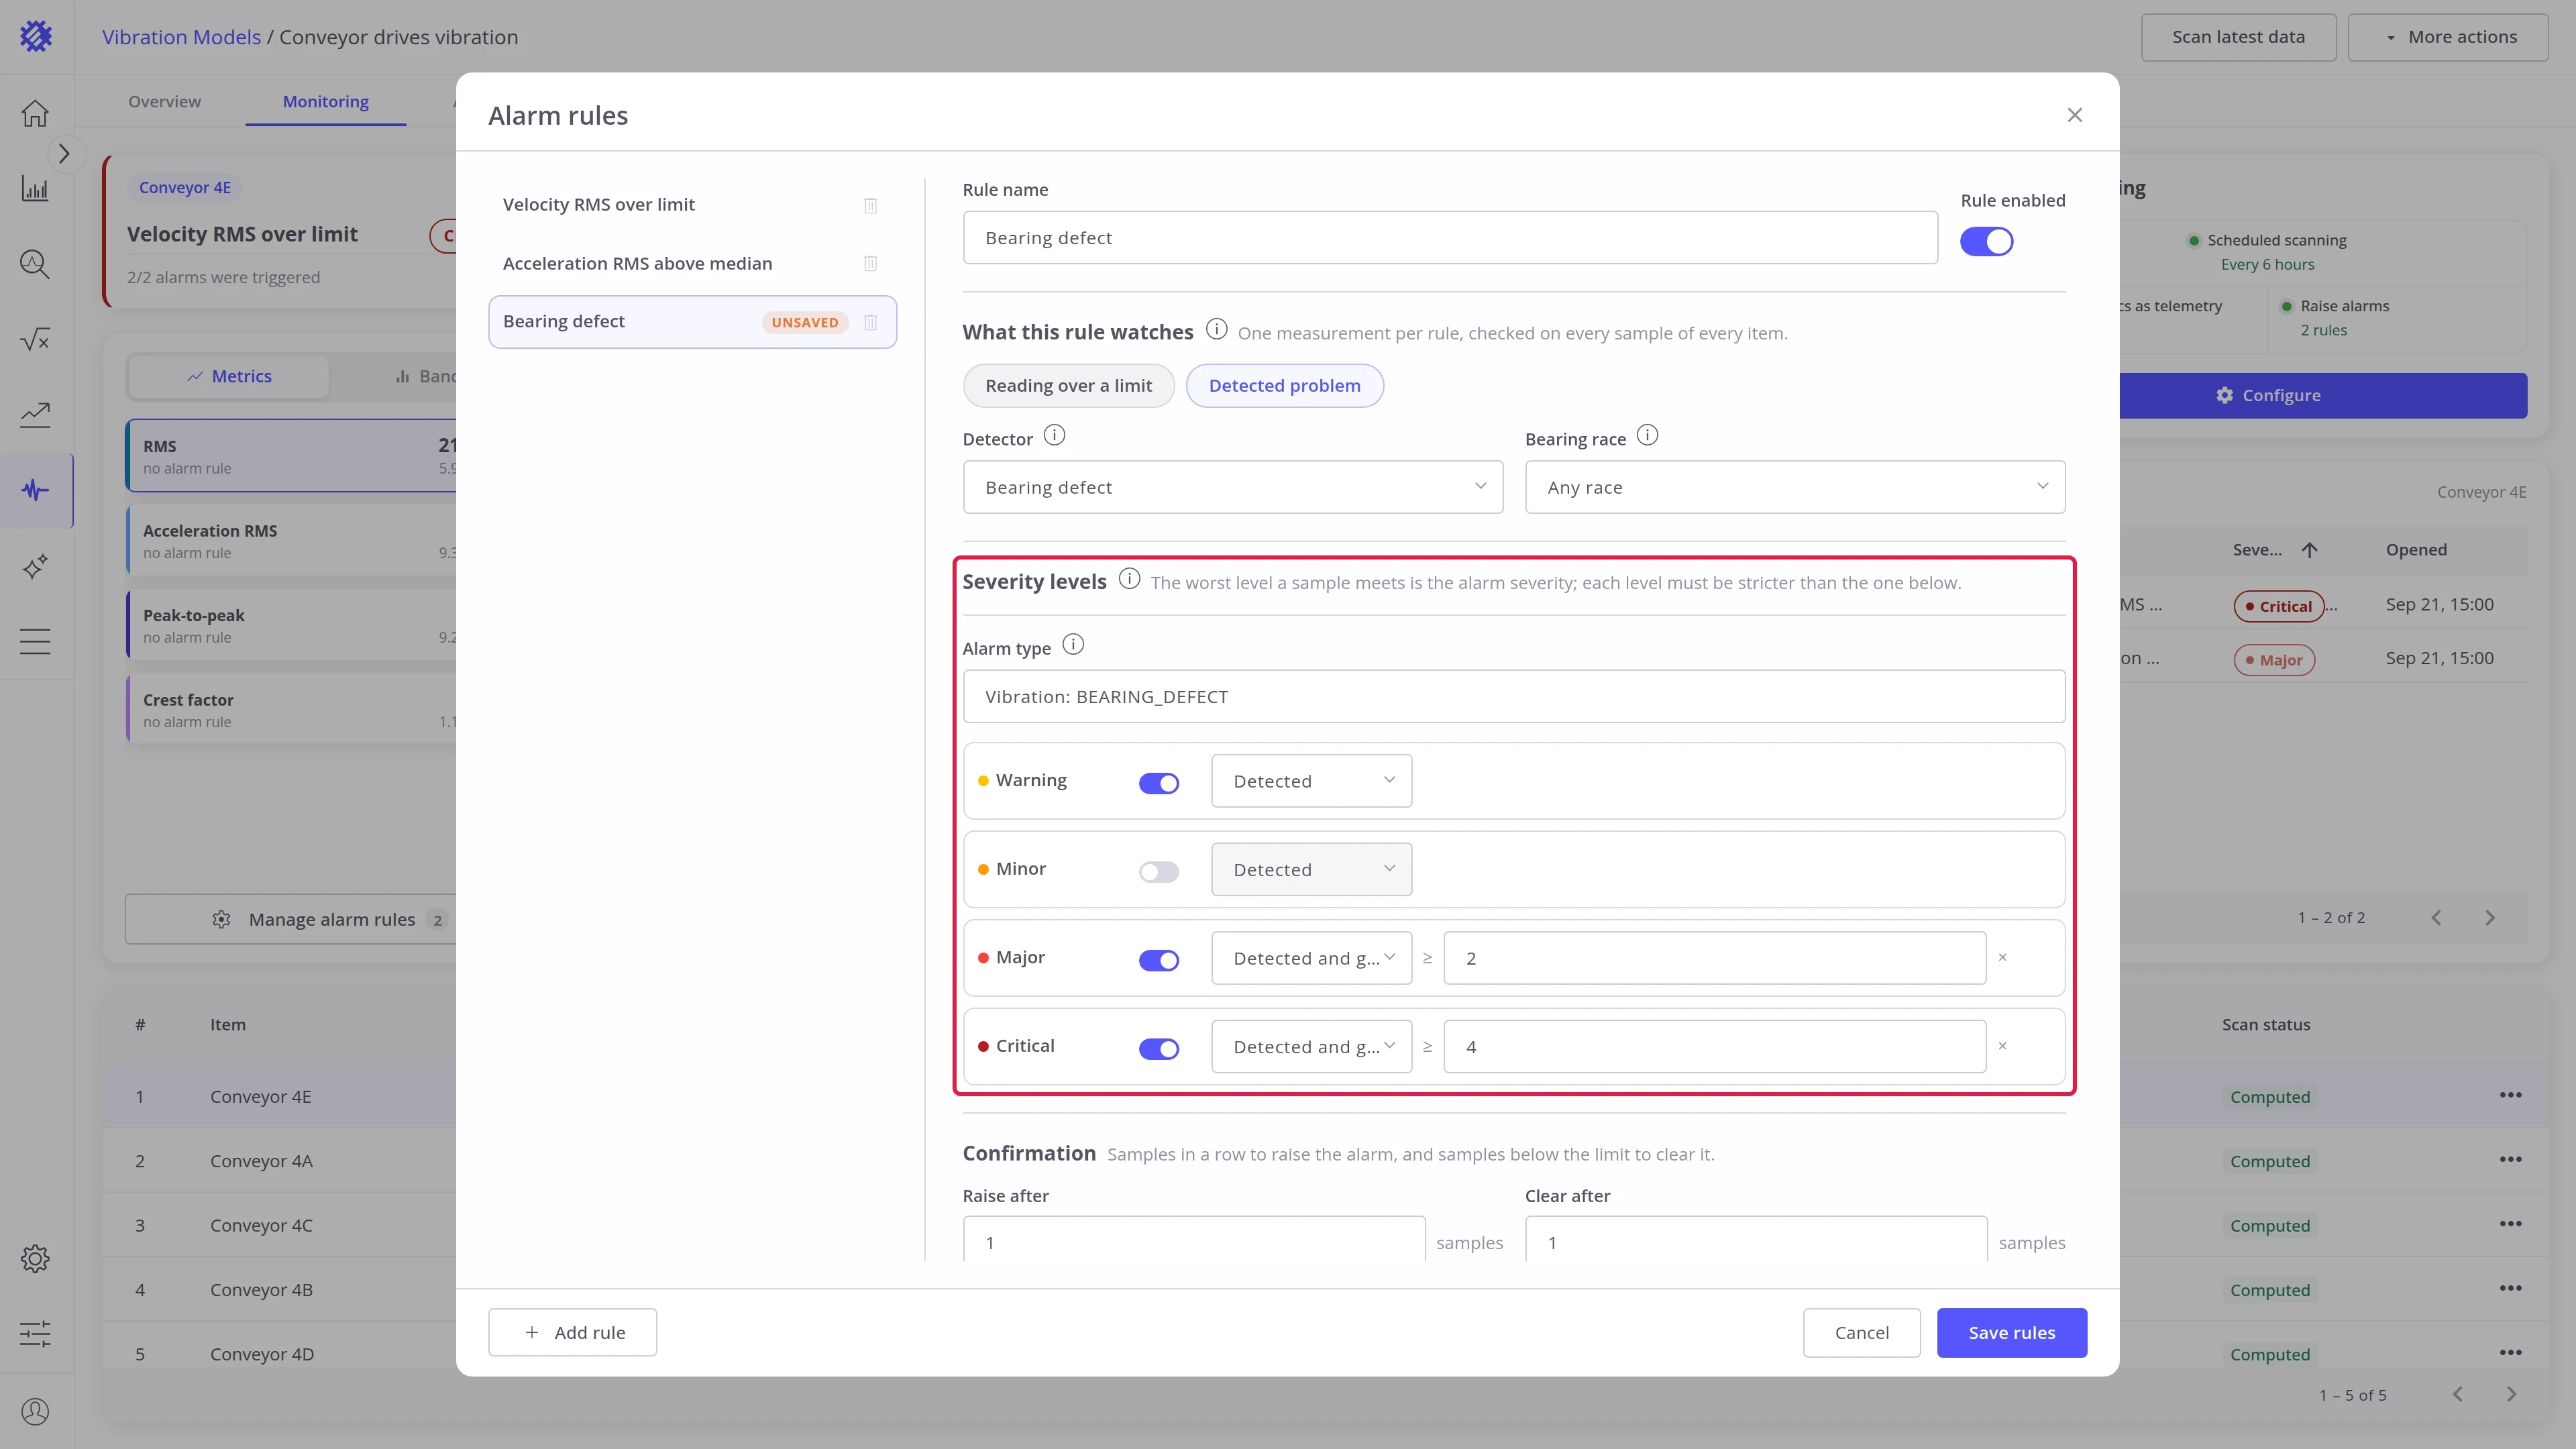
| Shaft fault, Bearing defect | Detected, or Detected and grown by a factor |
Use Detected and grown on machines that already have a known fault. The level stays quiet until the fault grows past its baseline by the factor you set.
Step 4. Set confirmation
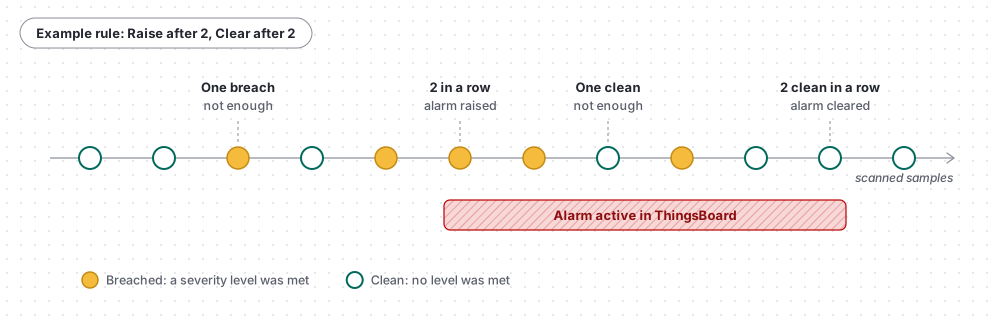
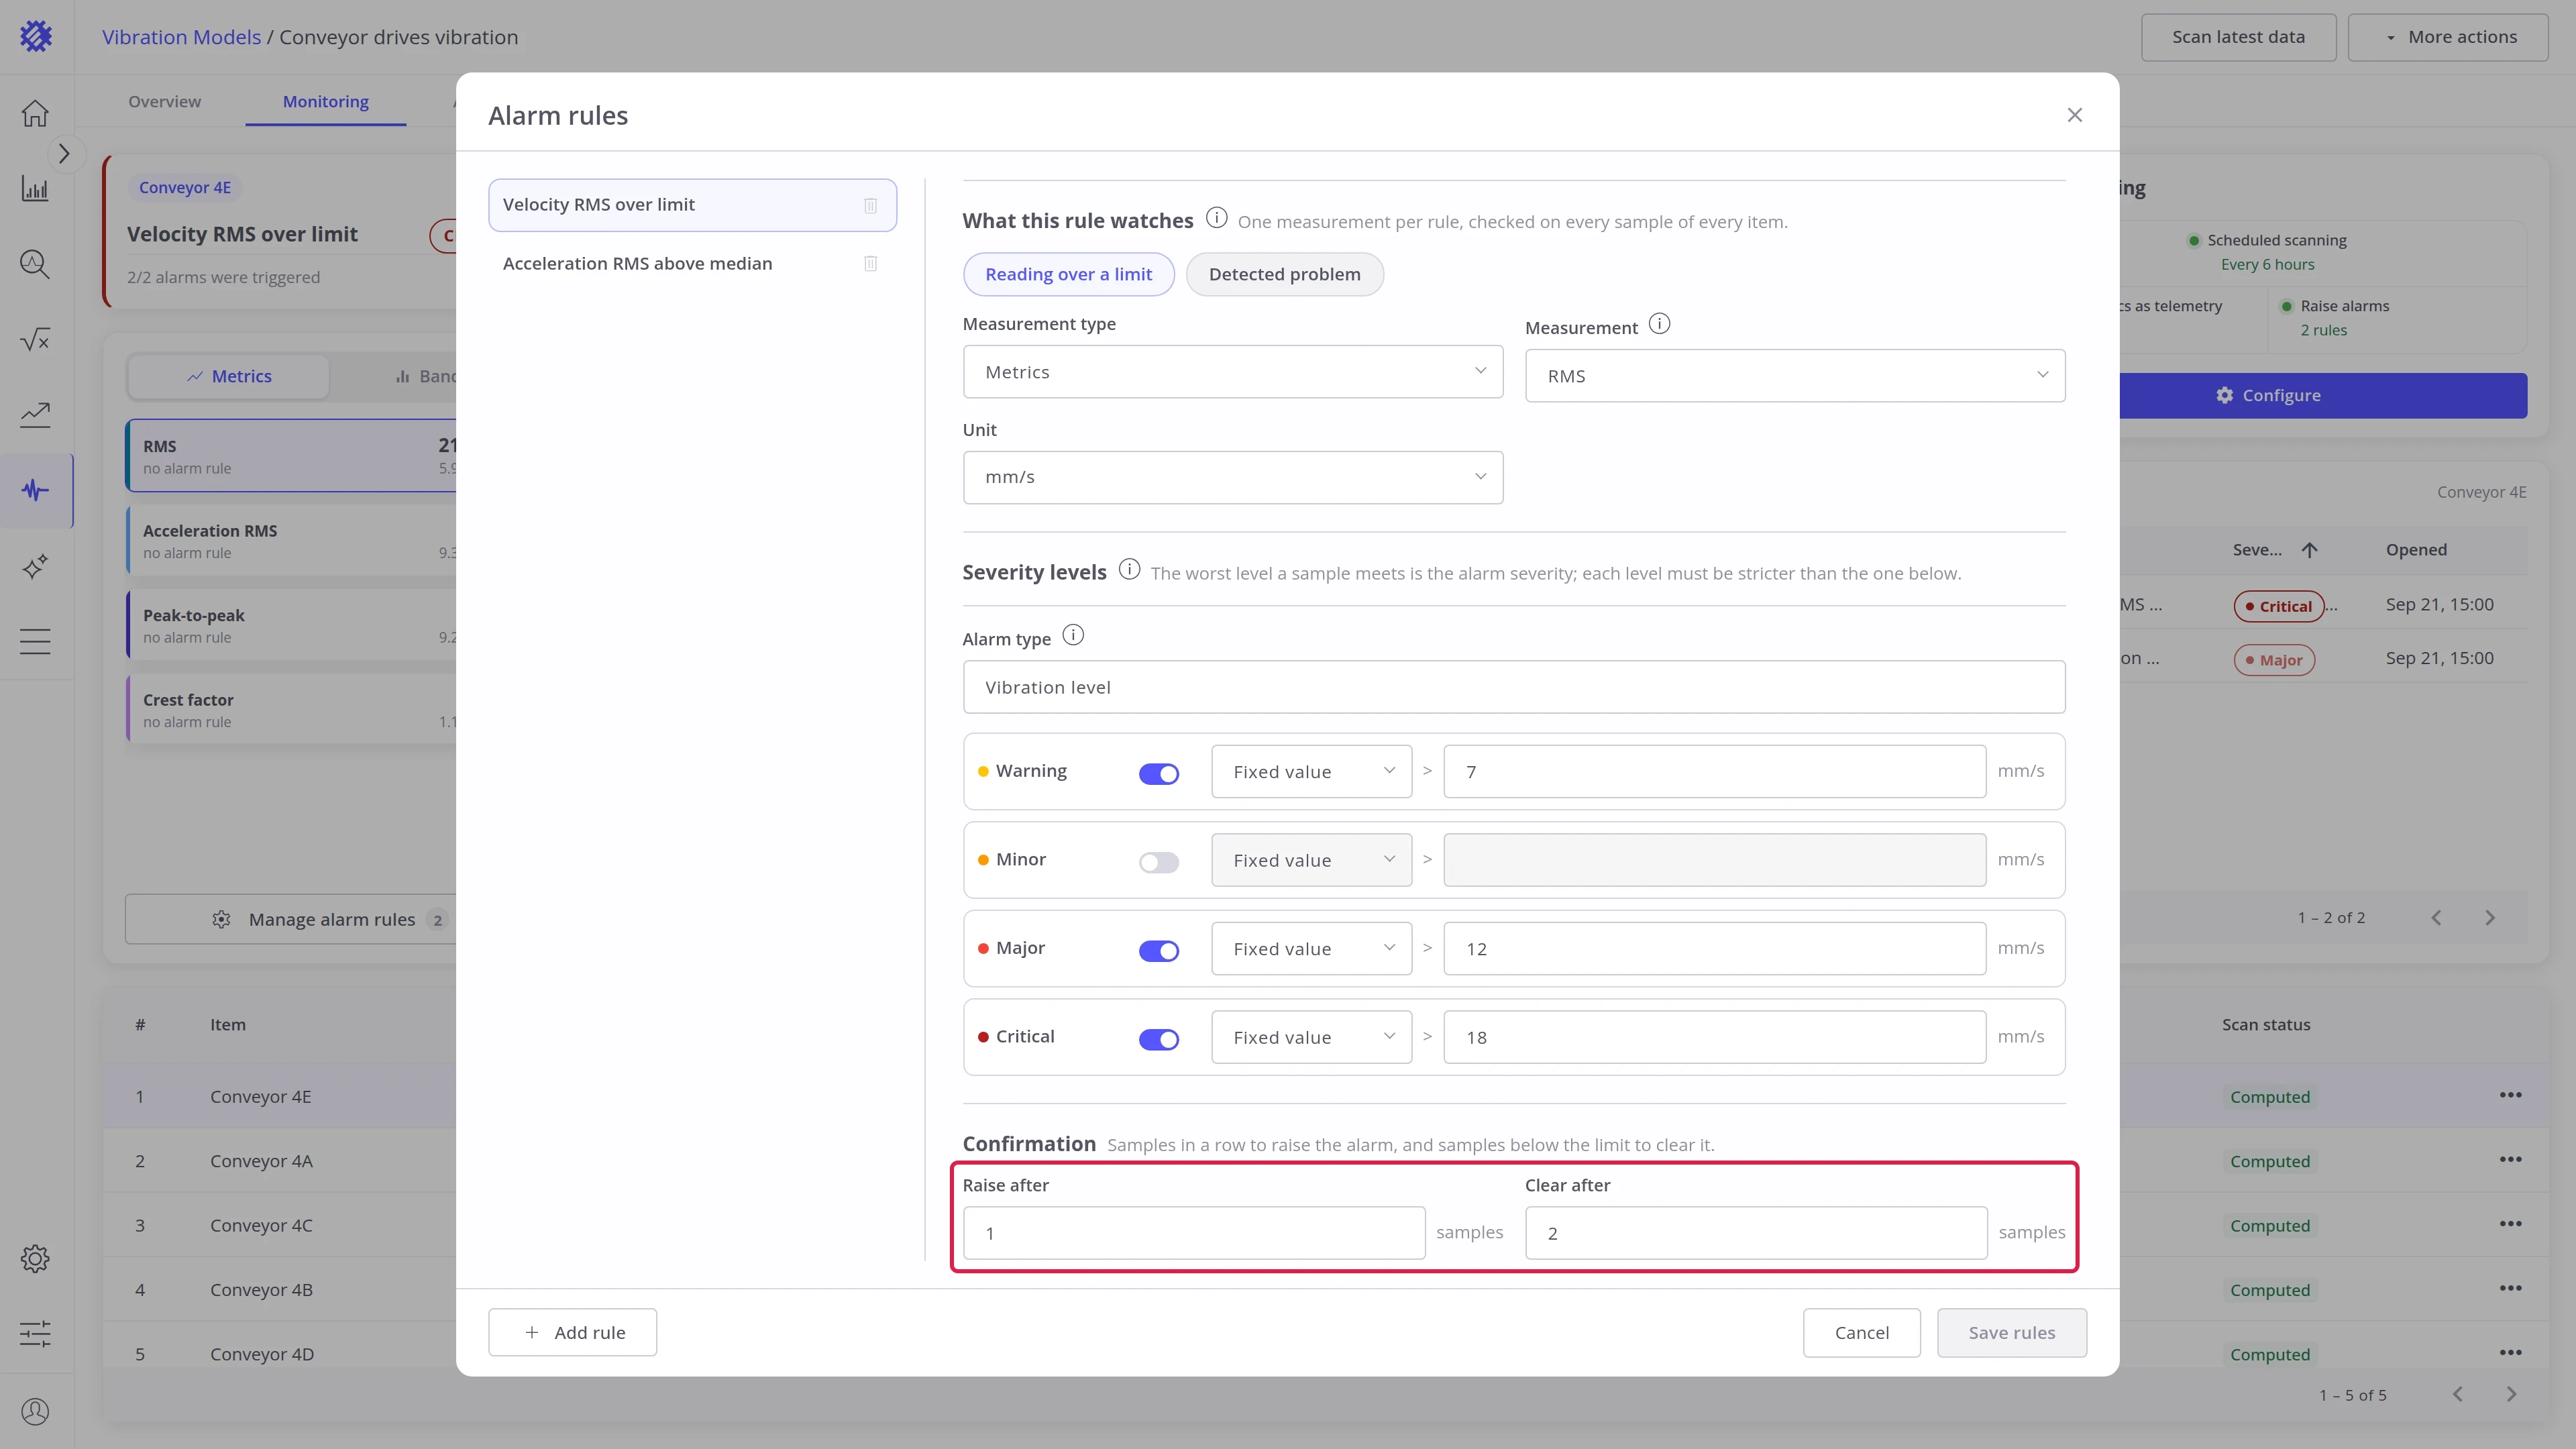
Section titled “Step 4. Set confirmation”Confirmation stops one noisy sample from raising or clearing an alarm.
- Raise after: how many breached samples in a row raise the alarm.
- Clear after: how many clean samples in a row clear it.
Each machine, rule, and axis has its own alarm. When the severity changes, the alarm keeps its original Opened time, so it shows when the problem started.
Step 5. Save the rules
Section titled “Step 5. Save the rules”Click Save rules. The editor does not save until every rule is complete:
- At least one severity level is on, and each level has its limit.
- Each level is stricter than the one below it.
- Any metric and Any band use median multiples.
- The rule has an Alarm type.
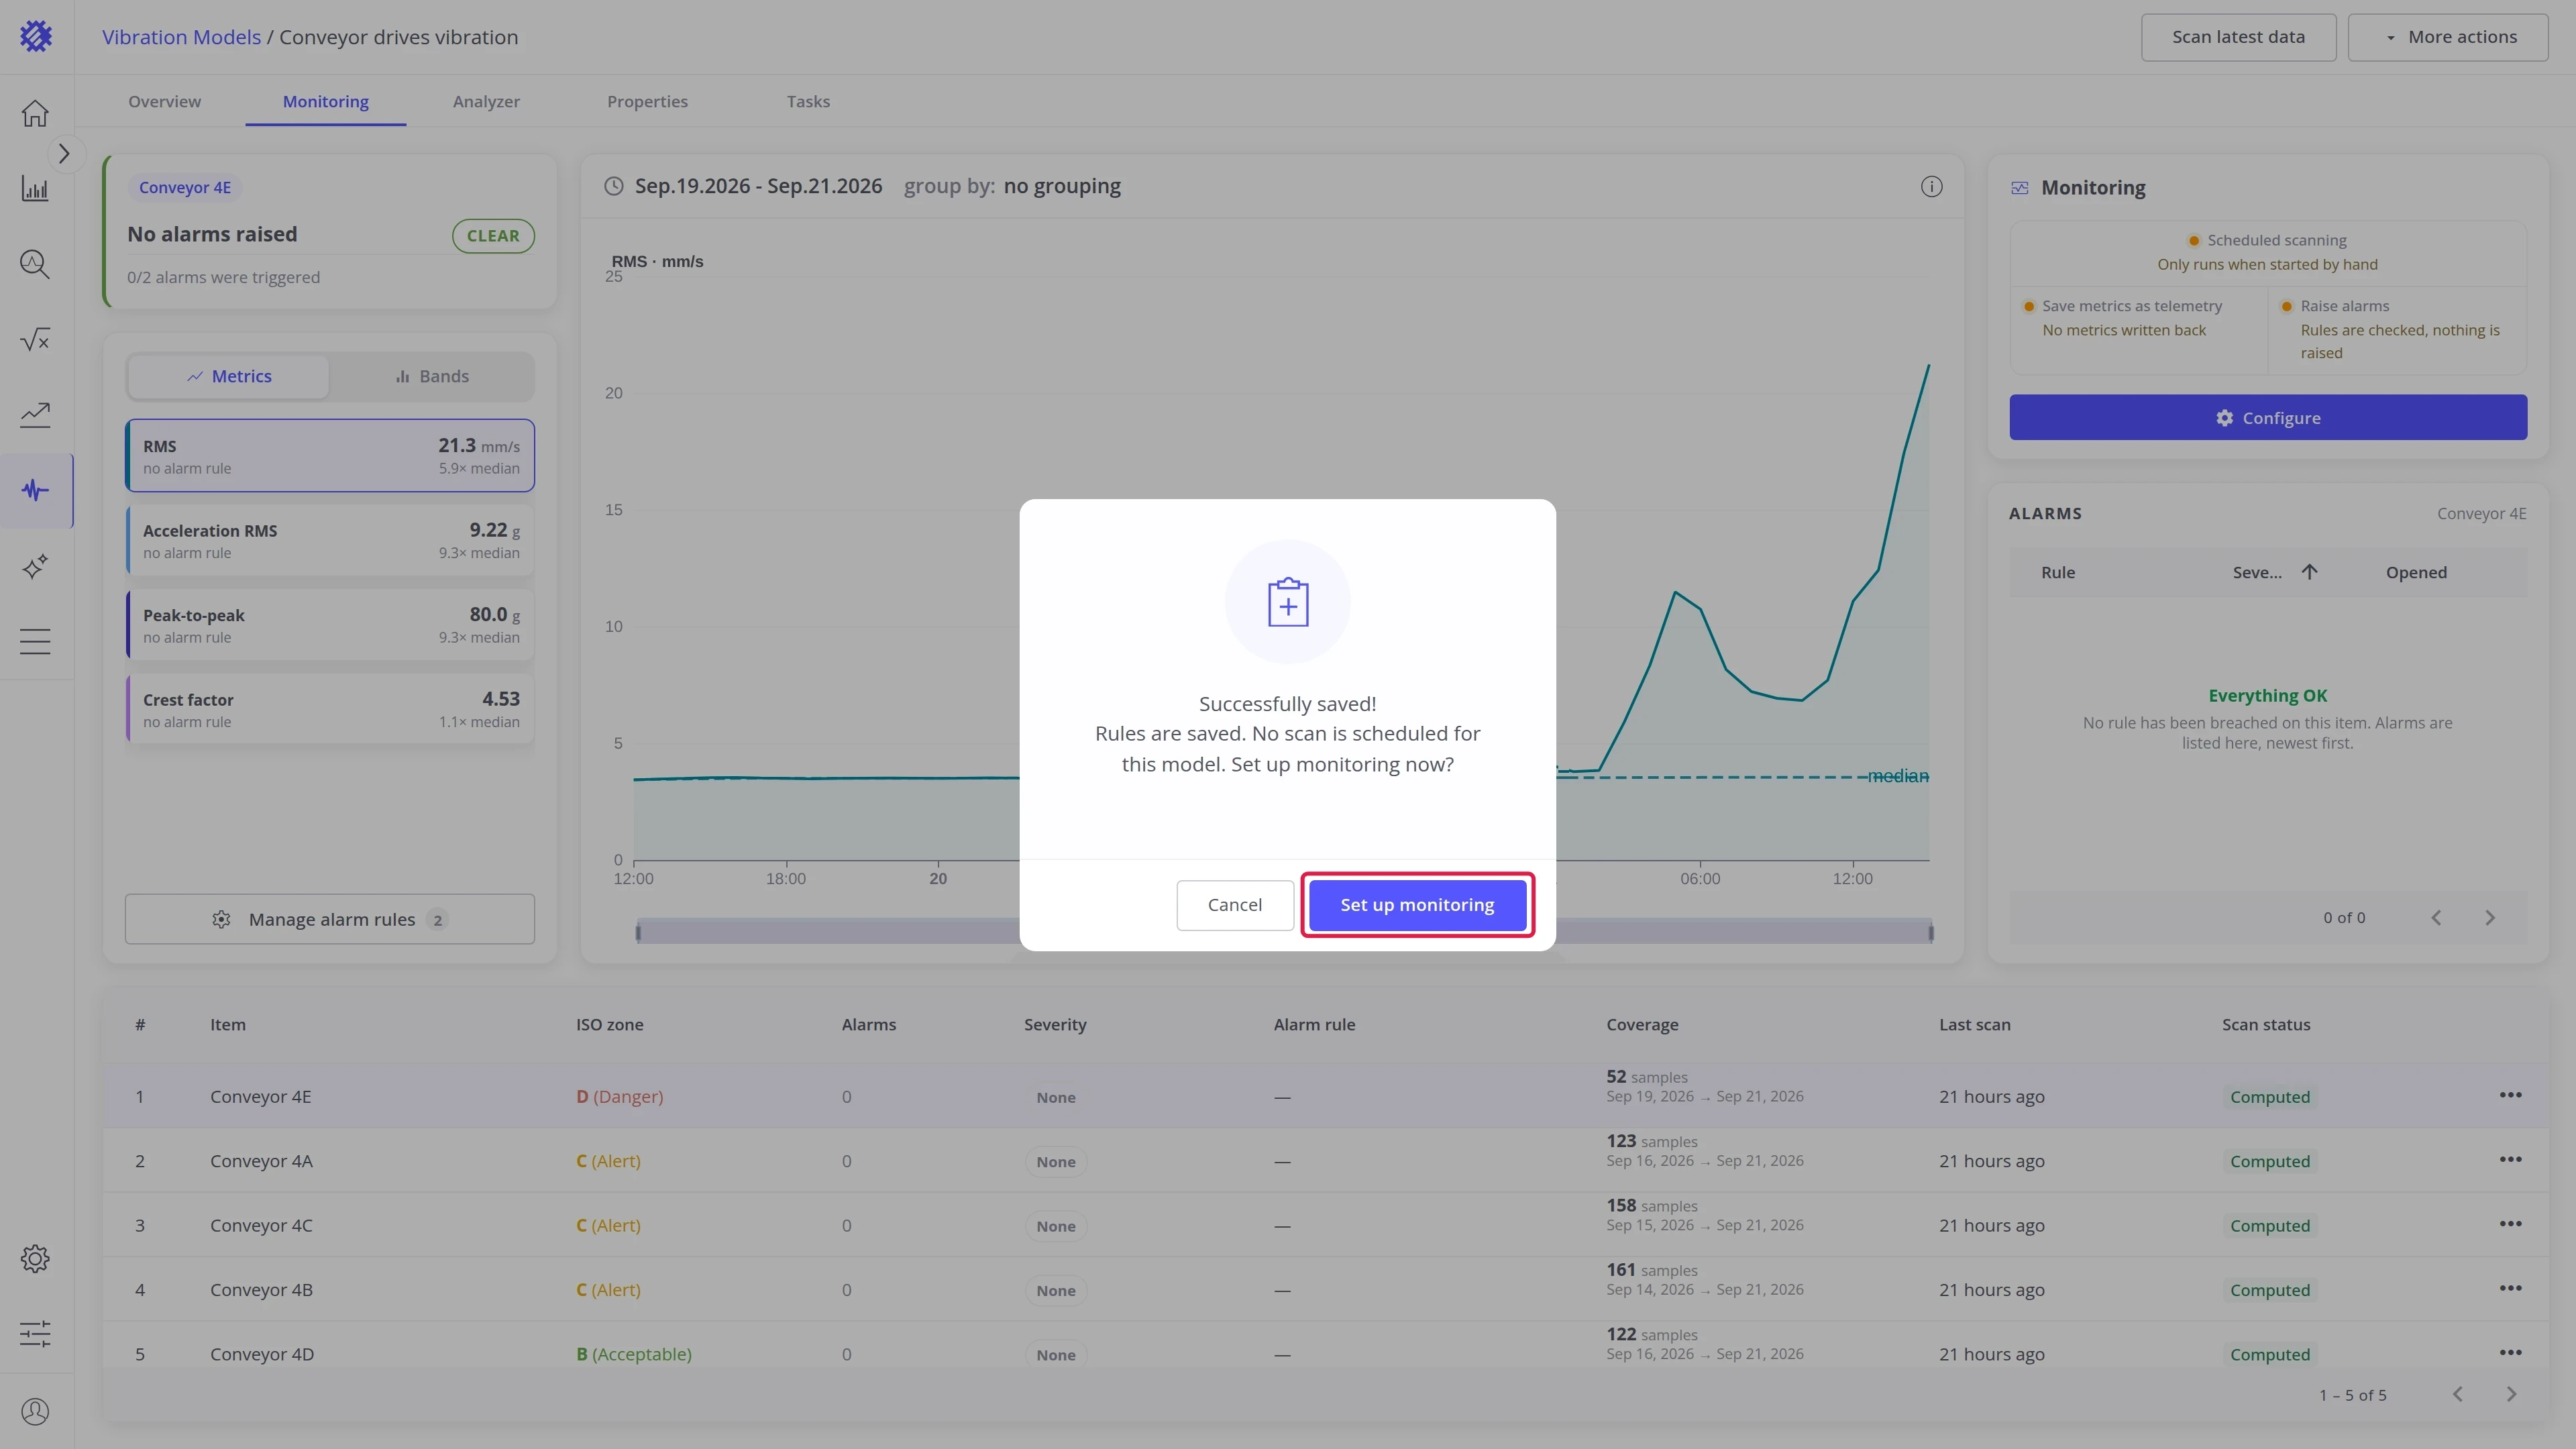
If the model has no scan schedule yet, Trendz offers to set up monitoring, because rules only raise alarms when a scan runs and Raise alarms is enabled.
Example: a conveyor fleet
Section titled “Example: a conveyor fleet”Four rules cover the conveyor fleet, one of each kind. All four raise after one sample and clear after two.
| Rule | Watches | Levels | Alarm type |
|---|---|---|---|
| Velocity RMS over limit | Velocity RMS, fixed values | Warning above 7, Major above 12, Critical above 18 mm/s | Vibration level |
| Acceleration RMS above median | Acceleration RMS, of its median | Warning above 3×, Major above 6× the machine’s median | Impact energy |
| Bearing defect on outer race | Bearing defect on BPFO | Warning when detected, Major at 2×, Critical at 4× its baseline | Bearing defect |
| ISO zone | ISO zone | Warning at B, Major at C, Critical at D | ISO zone |
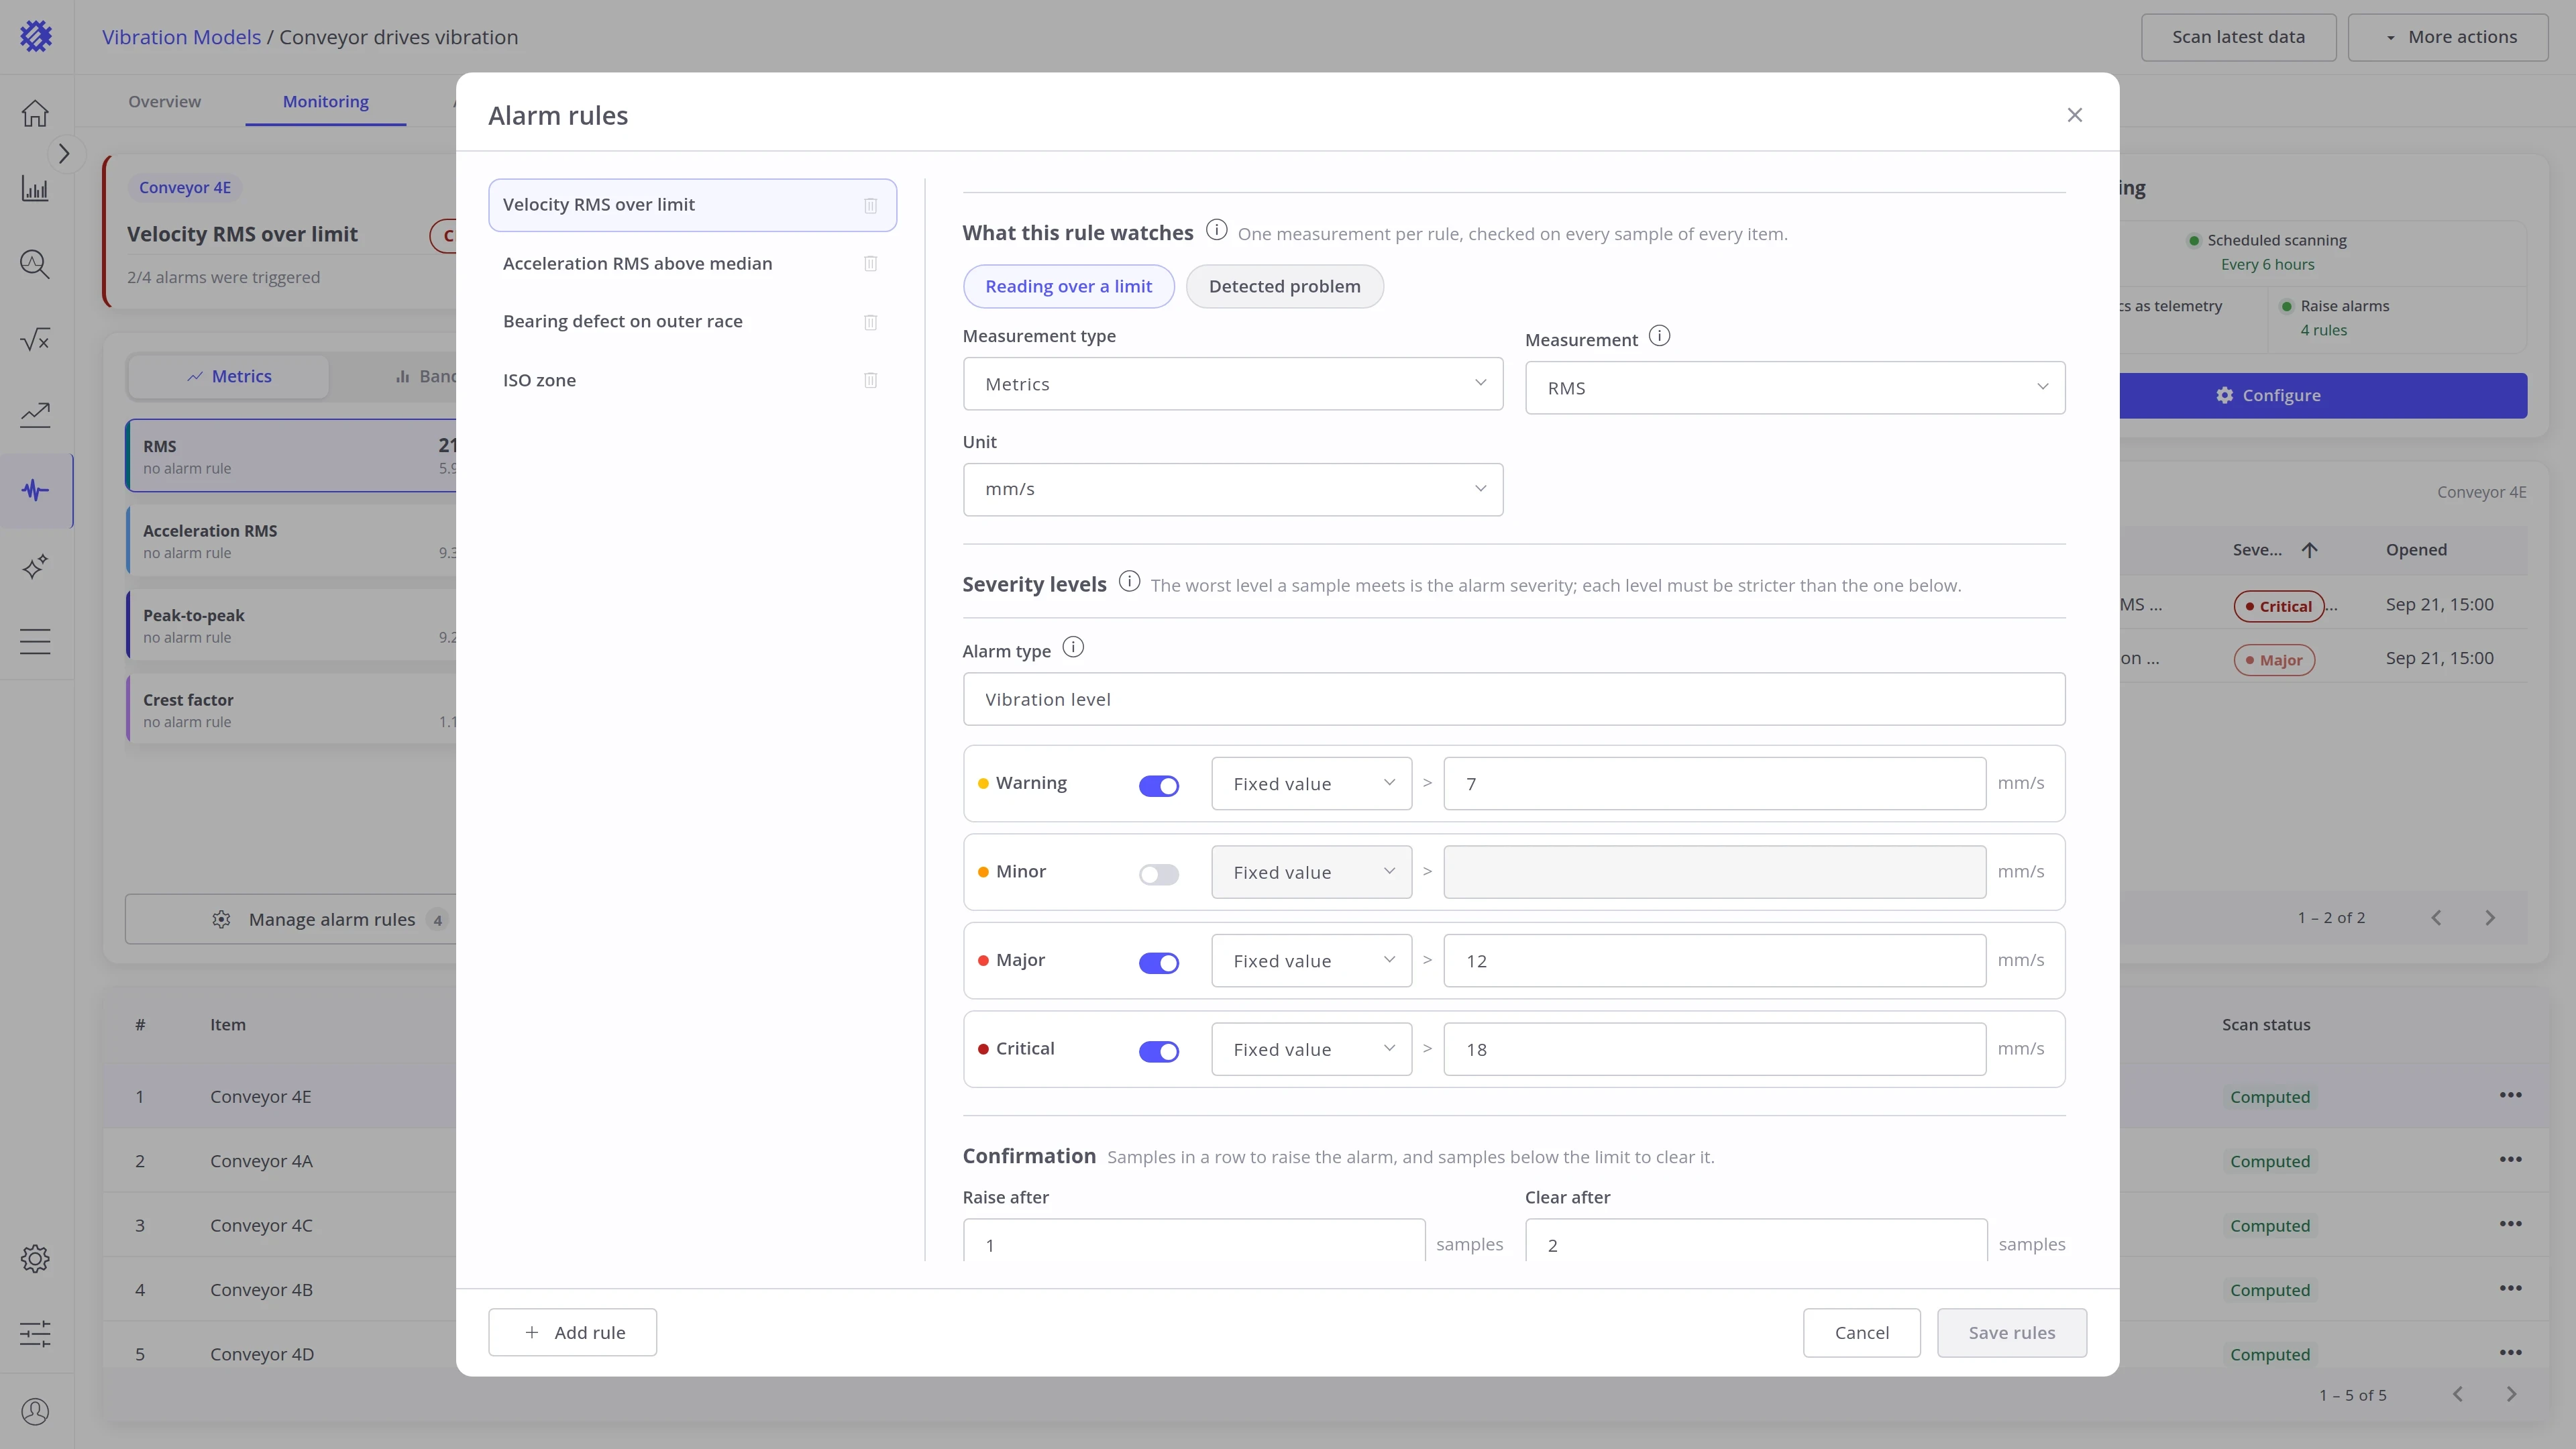
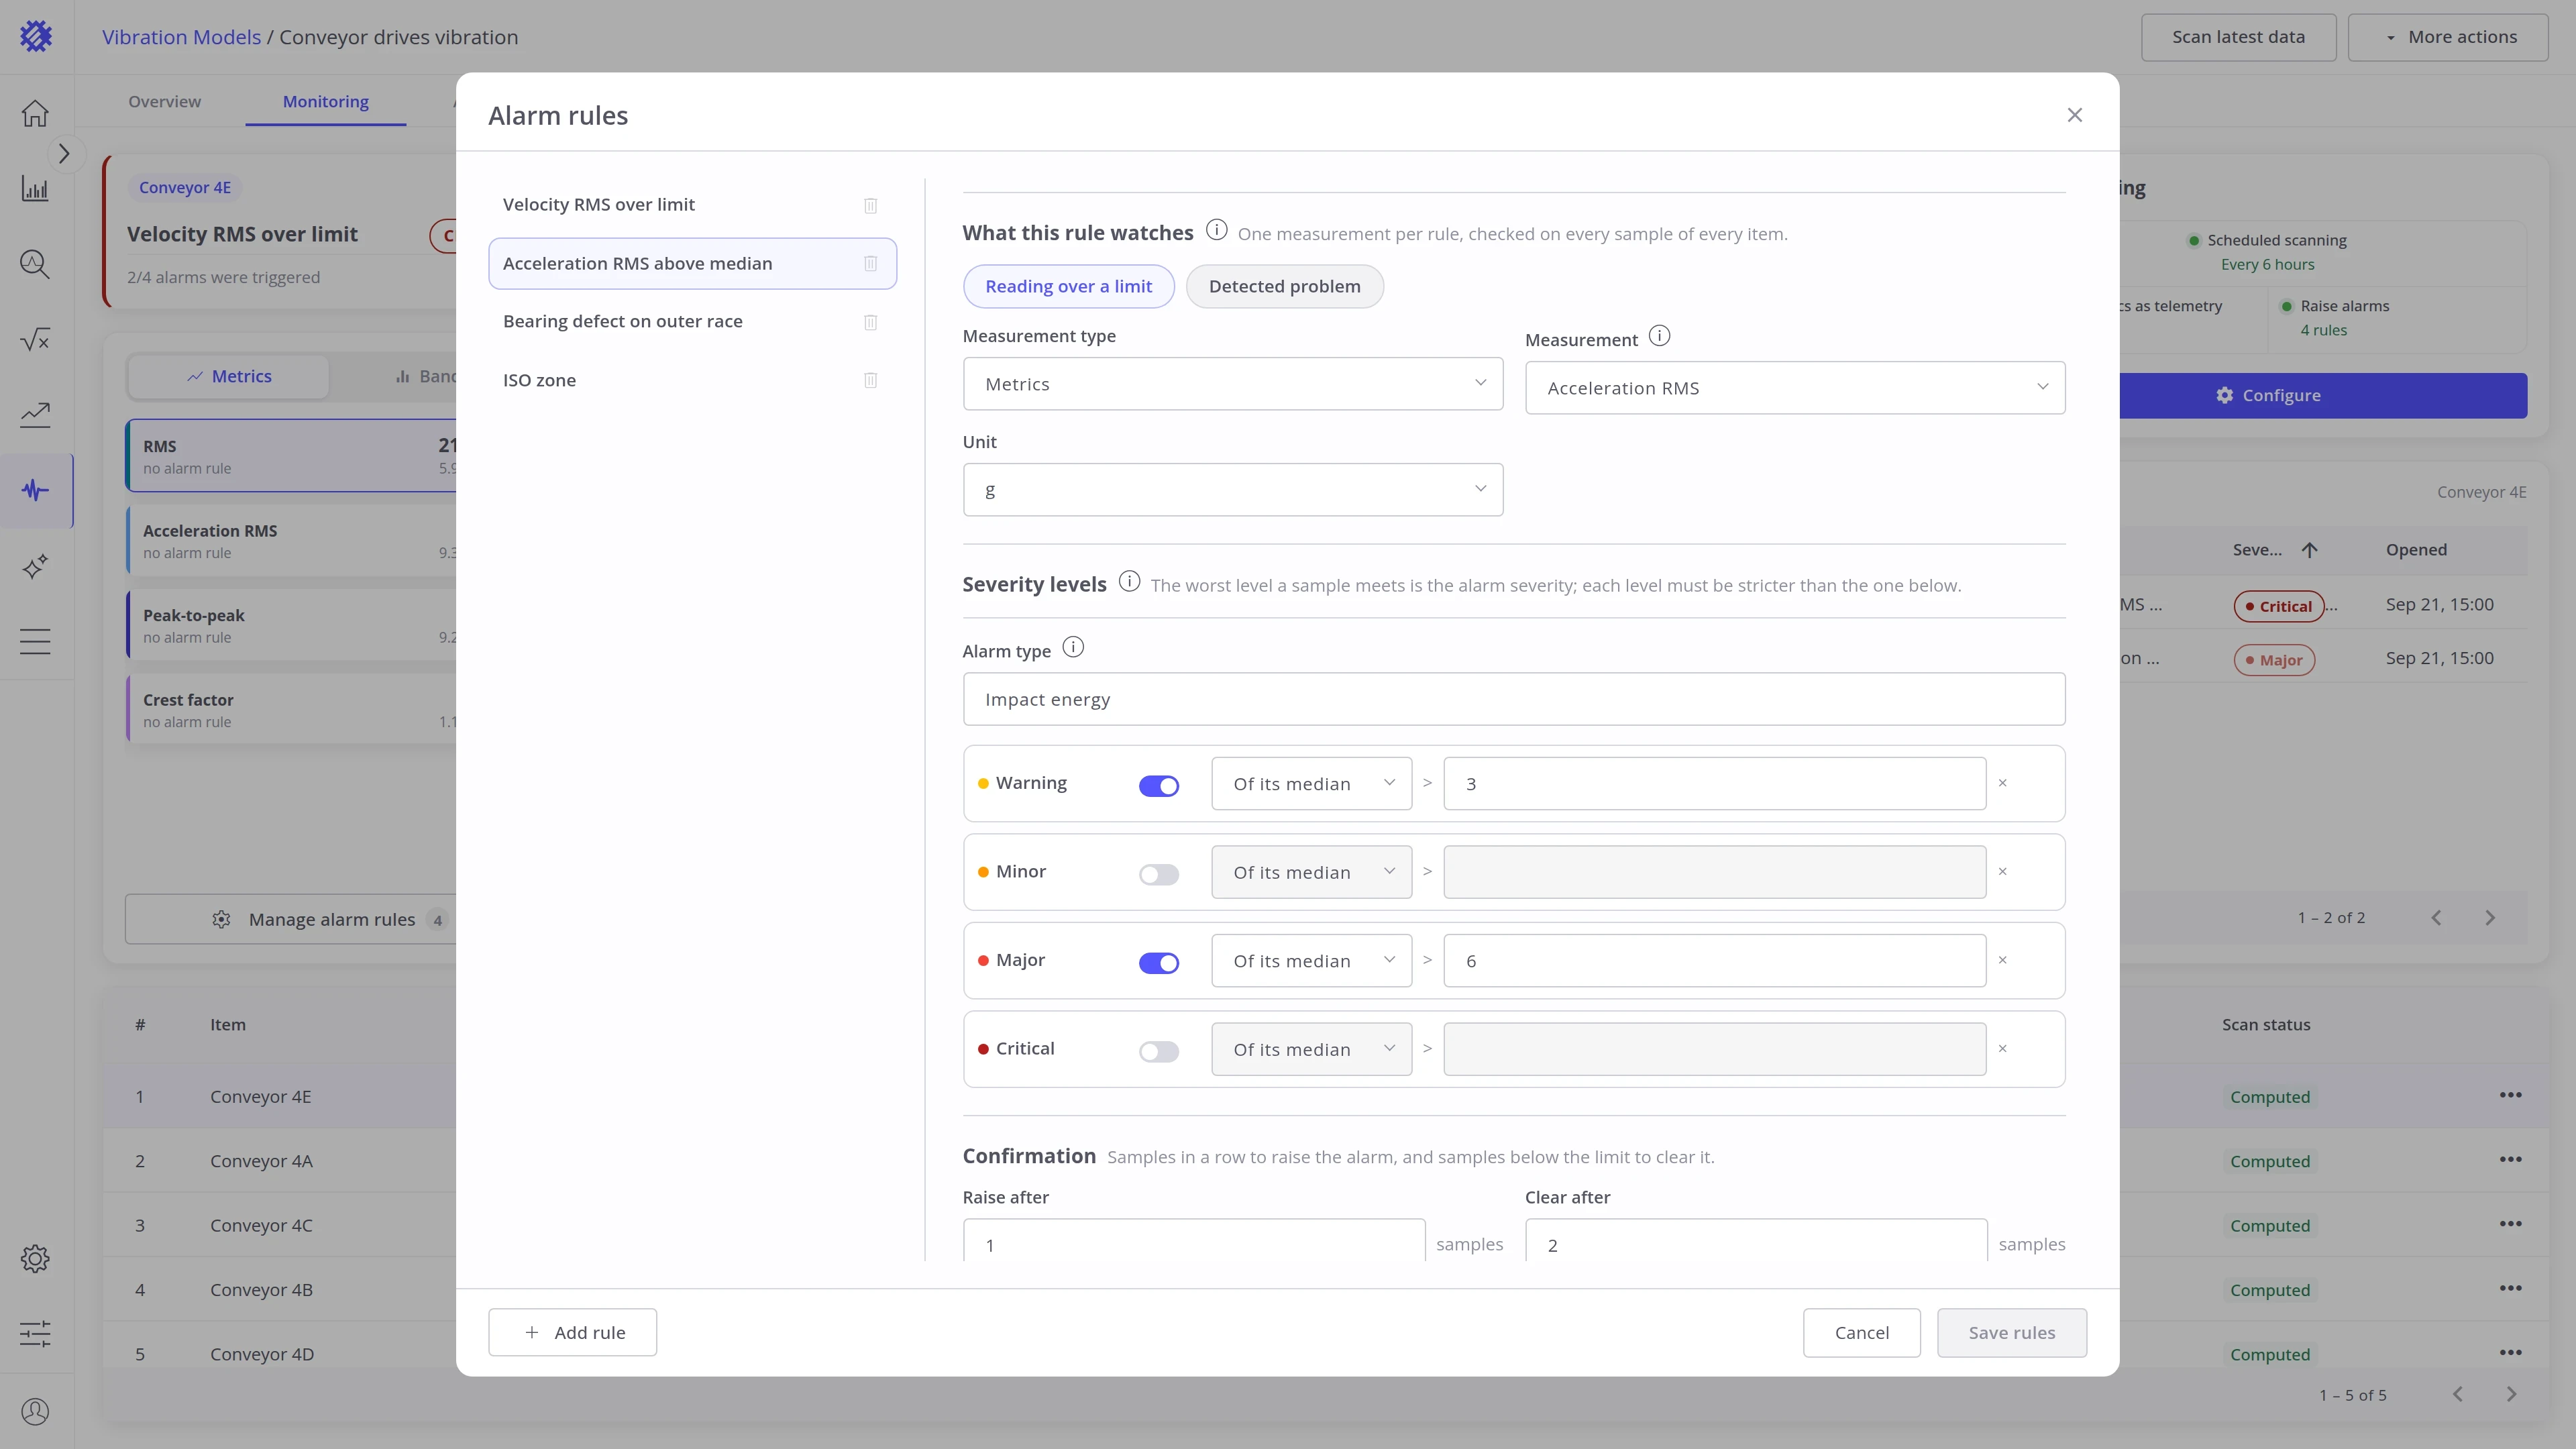
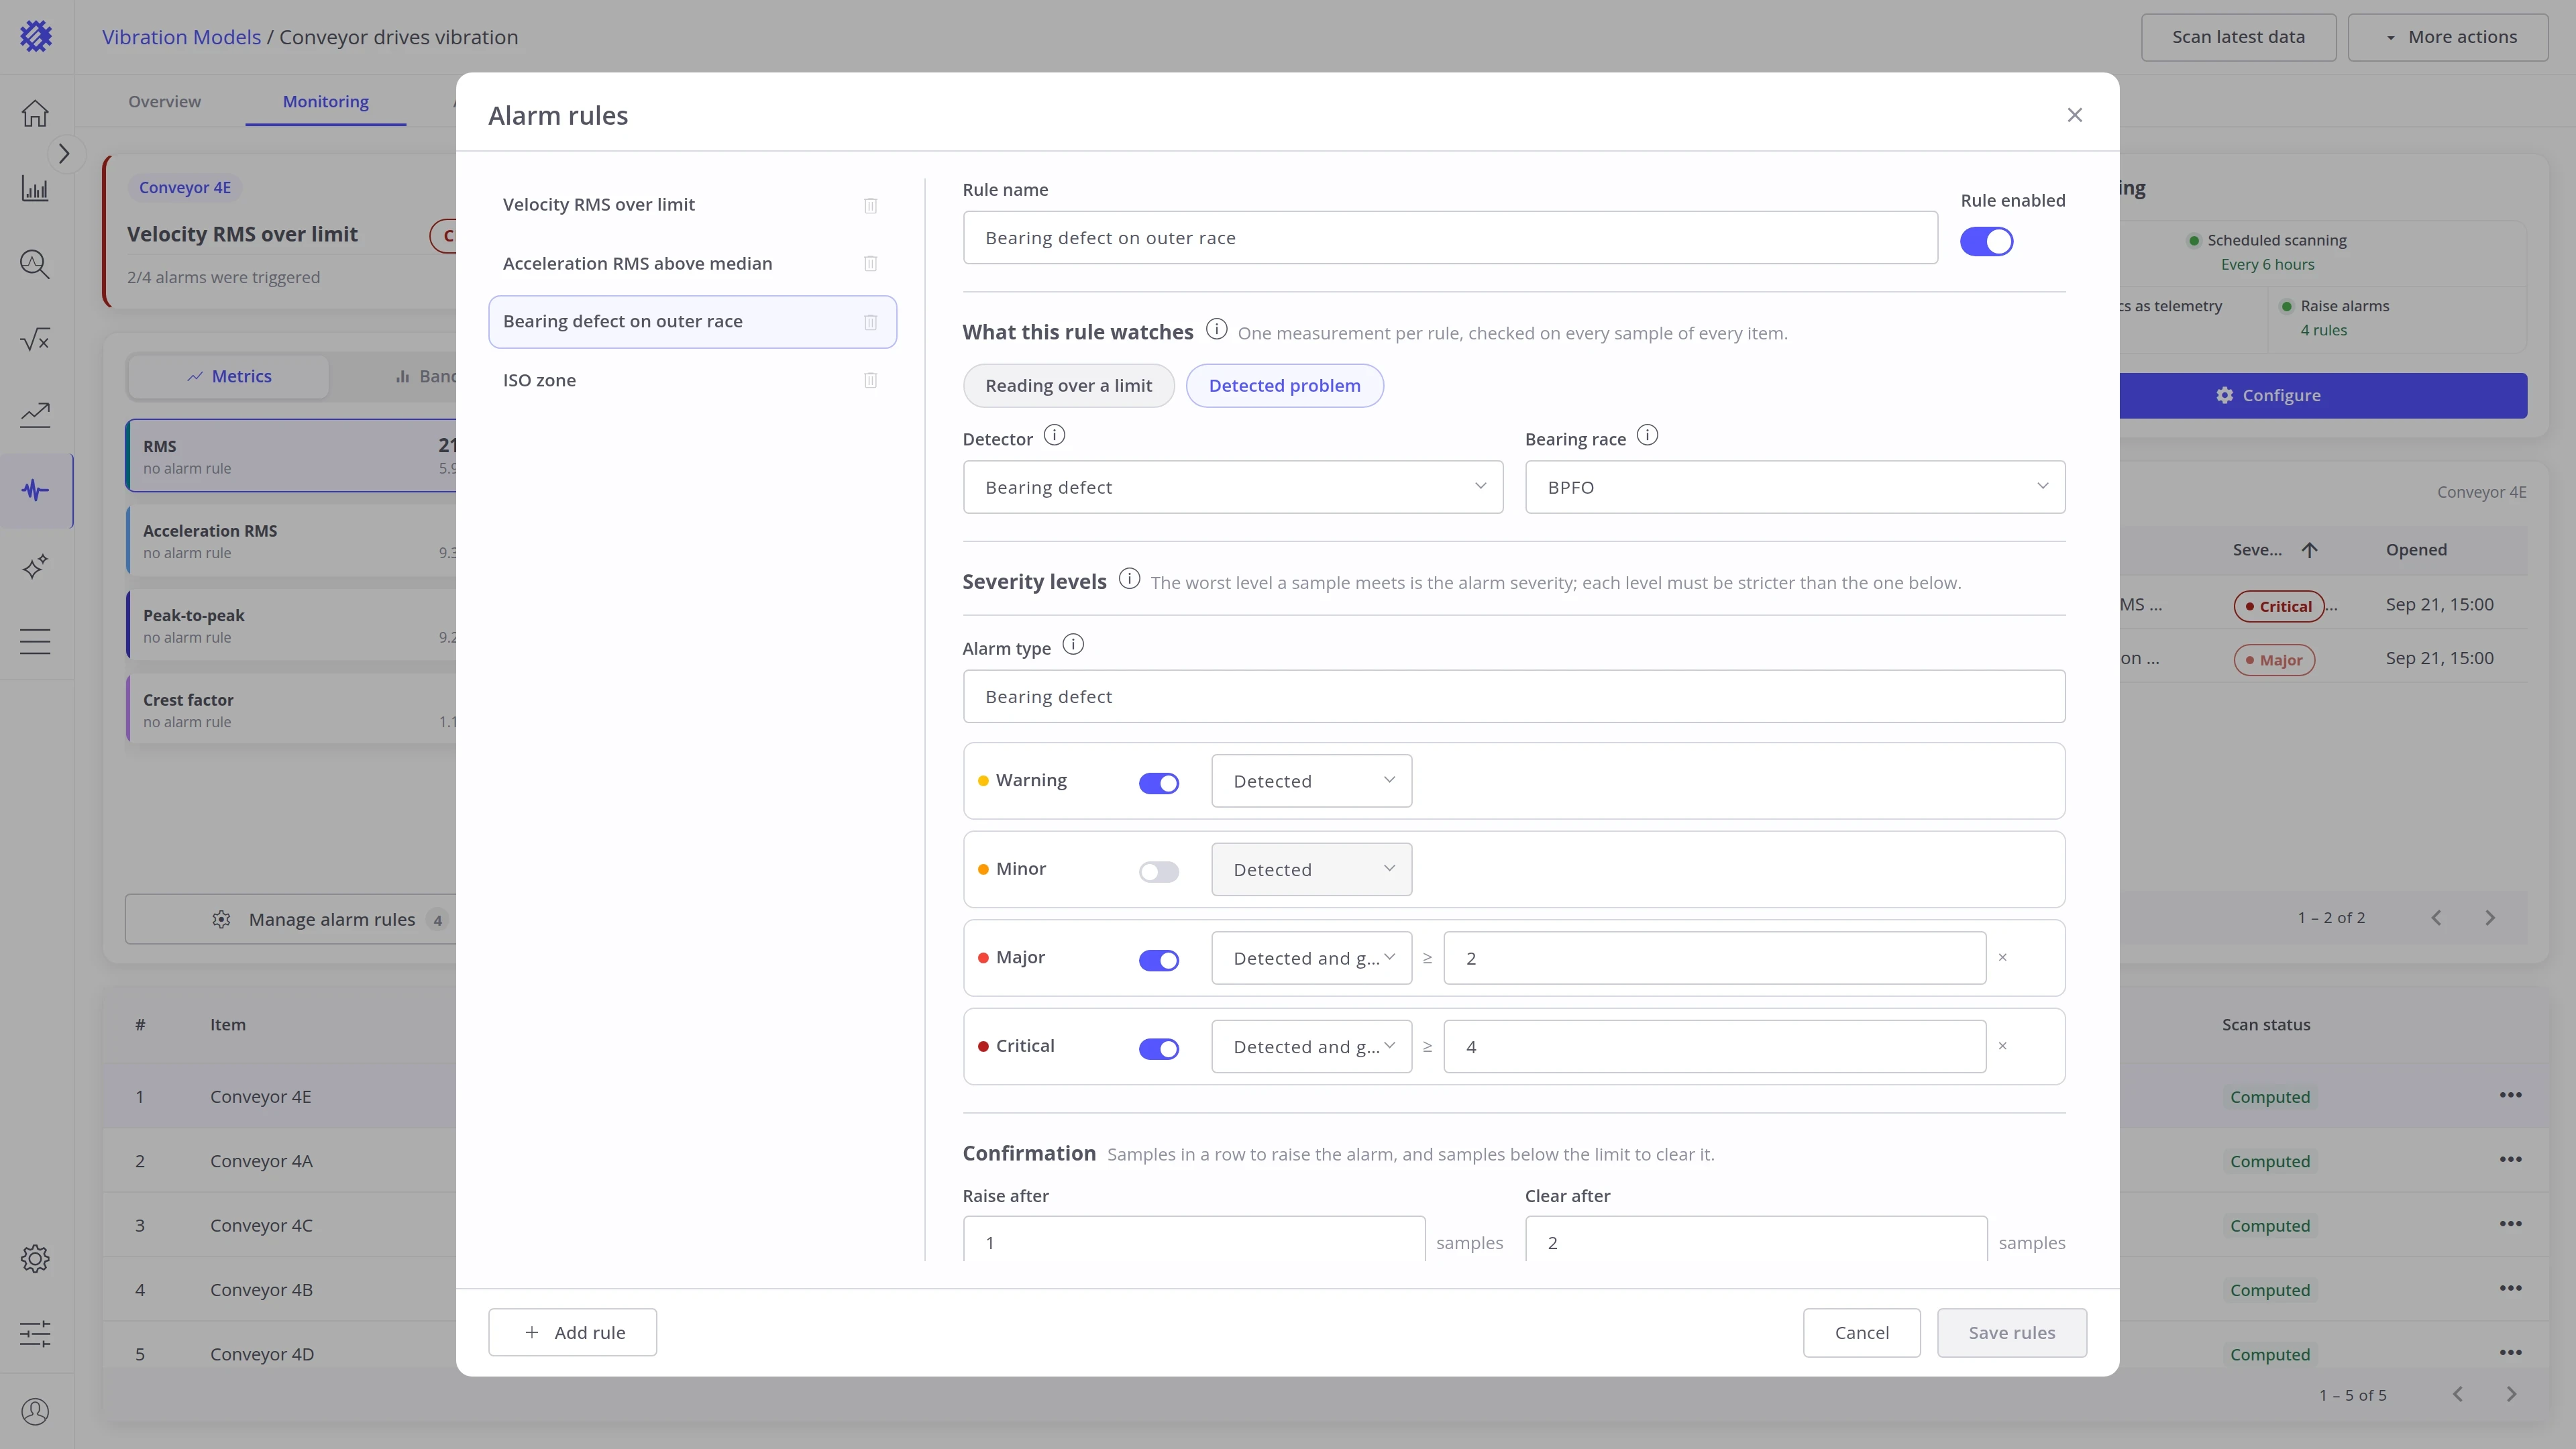
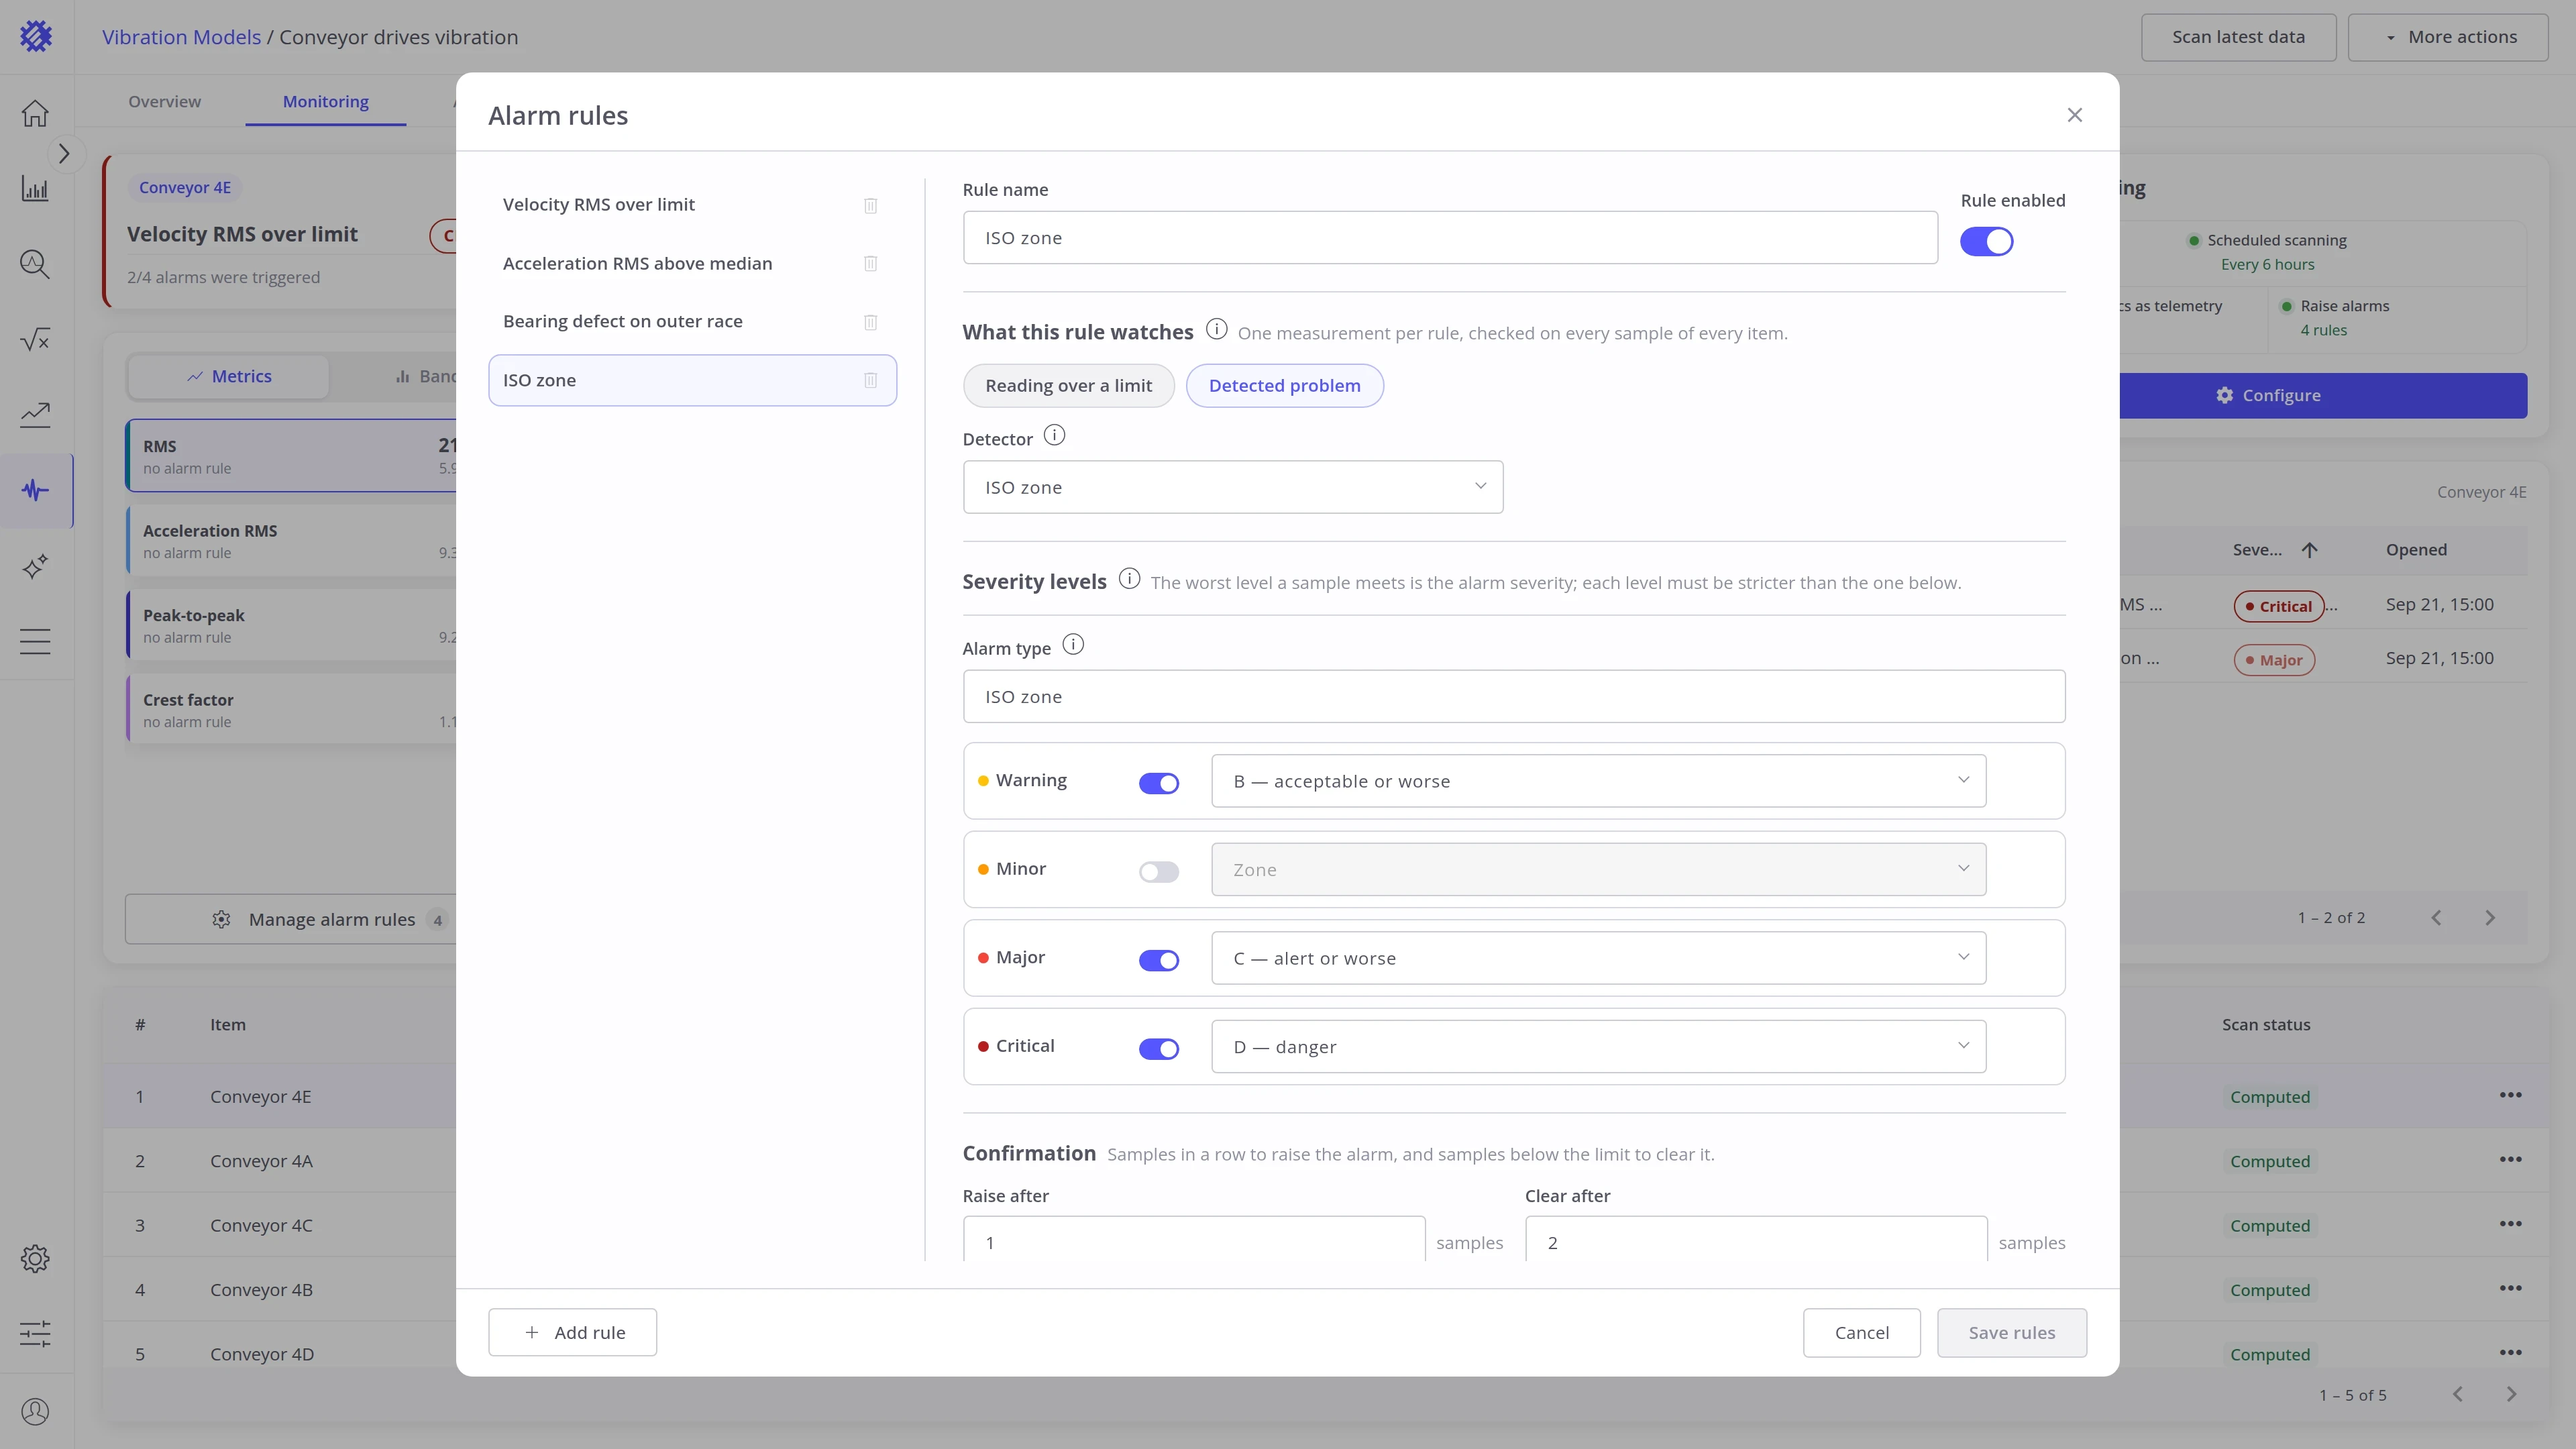
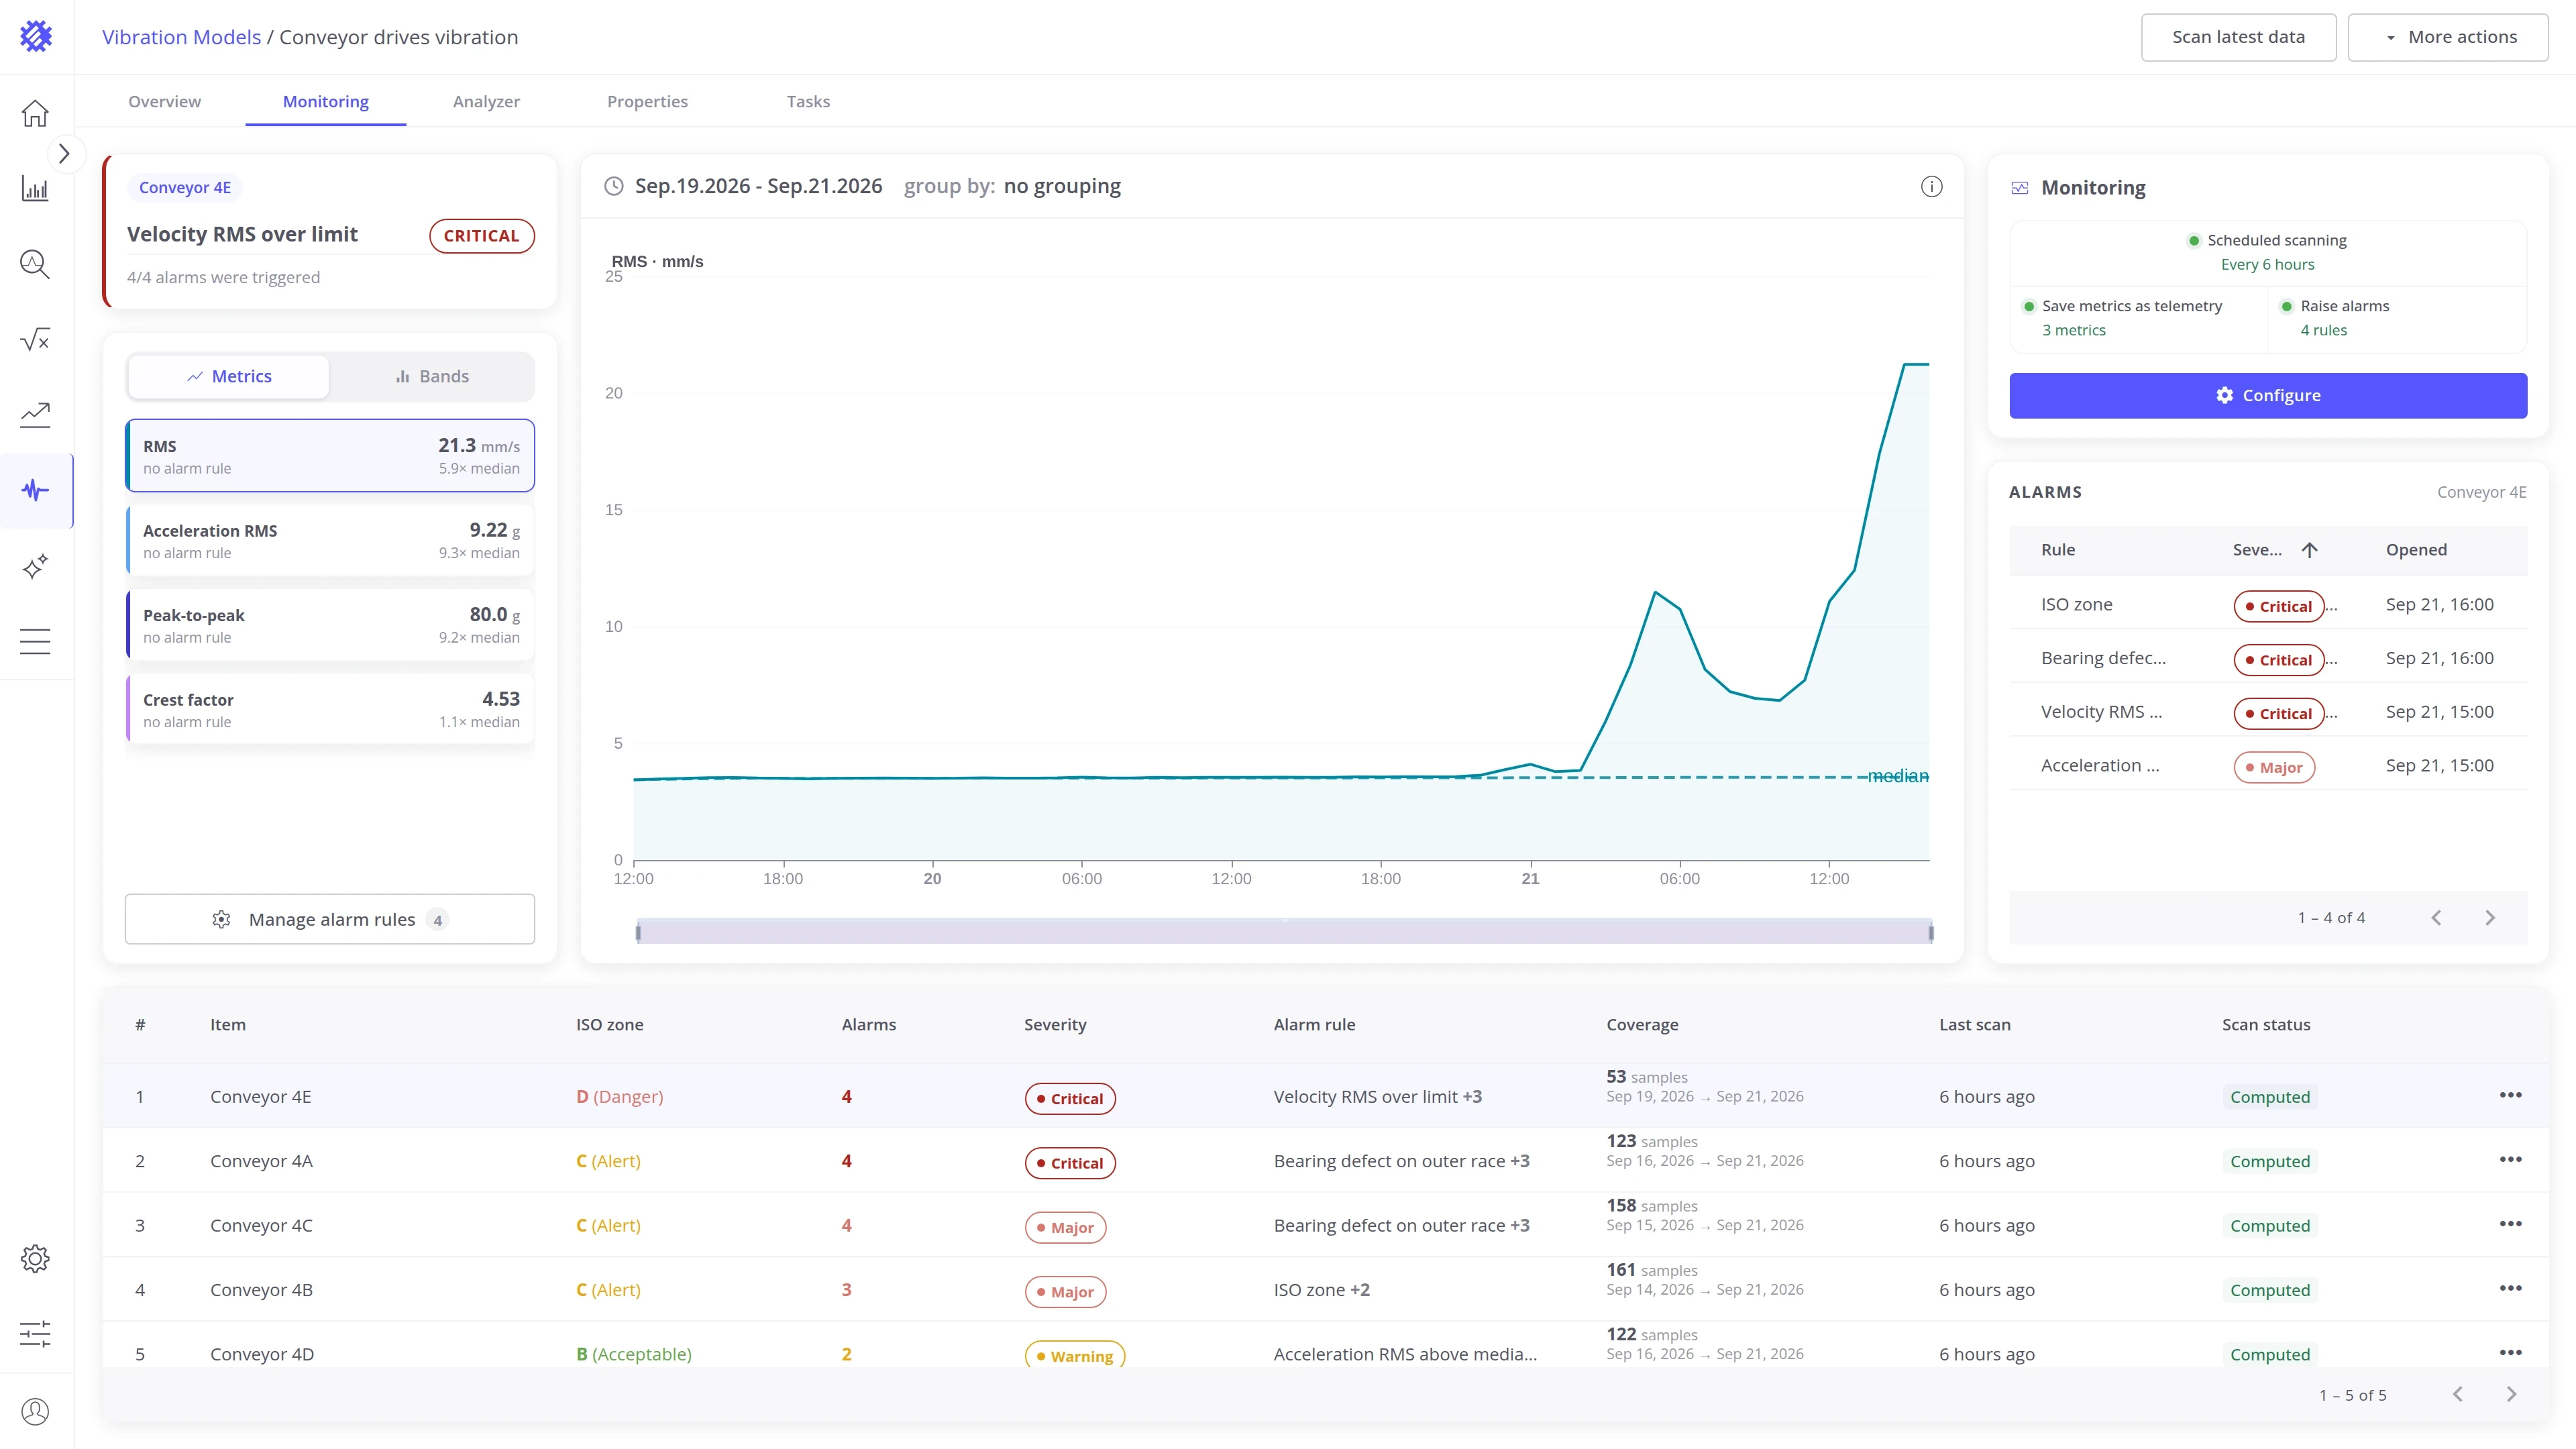
With these four rules on, the next scans found the degradation. On the Monitoring tab, all five conveyors have open alarms: Conveyor 4E and 4A are Critical, 4C and 4B are Major, and 4D is Warning. The same 17 alarms were created in ThingsBoard, one per machine and alarm type:
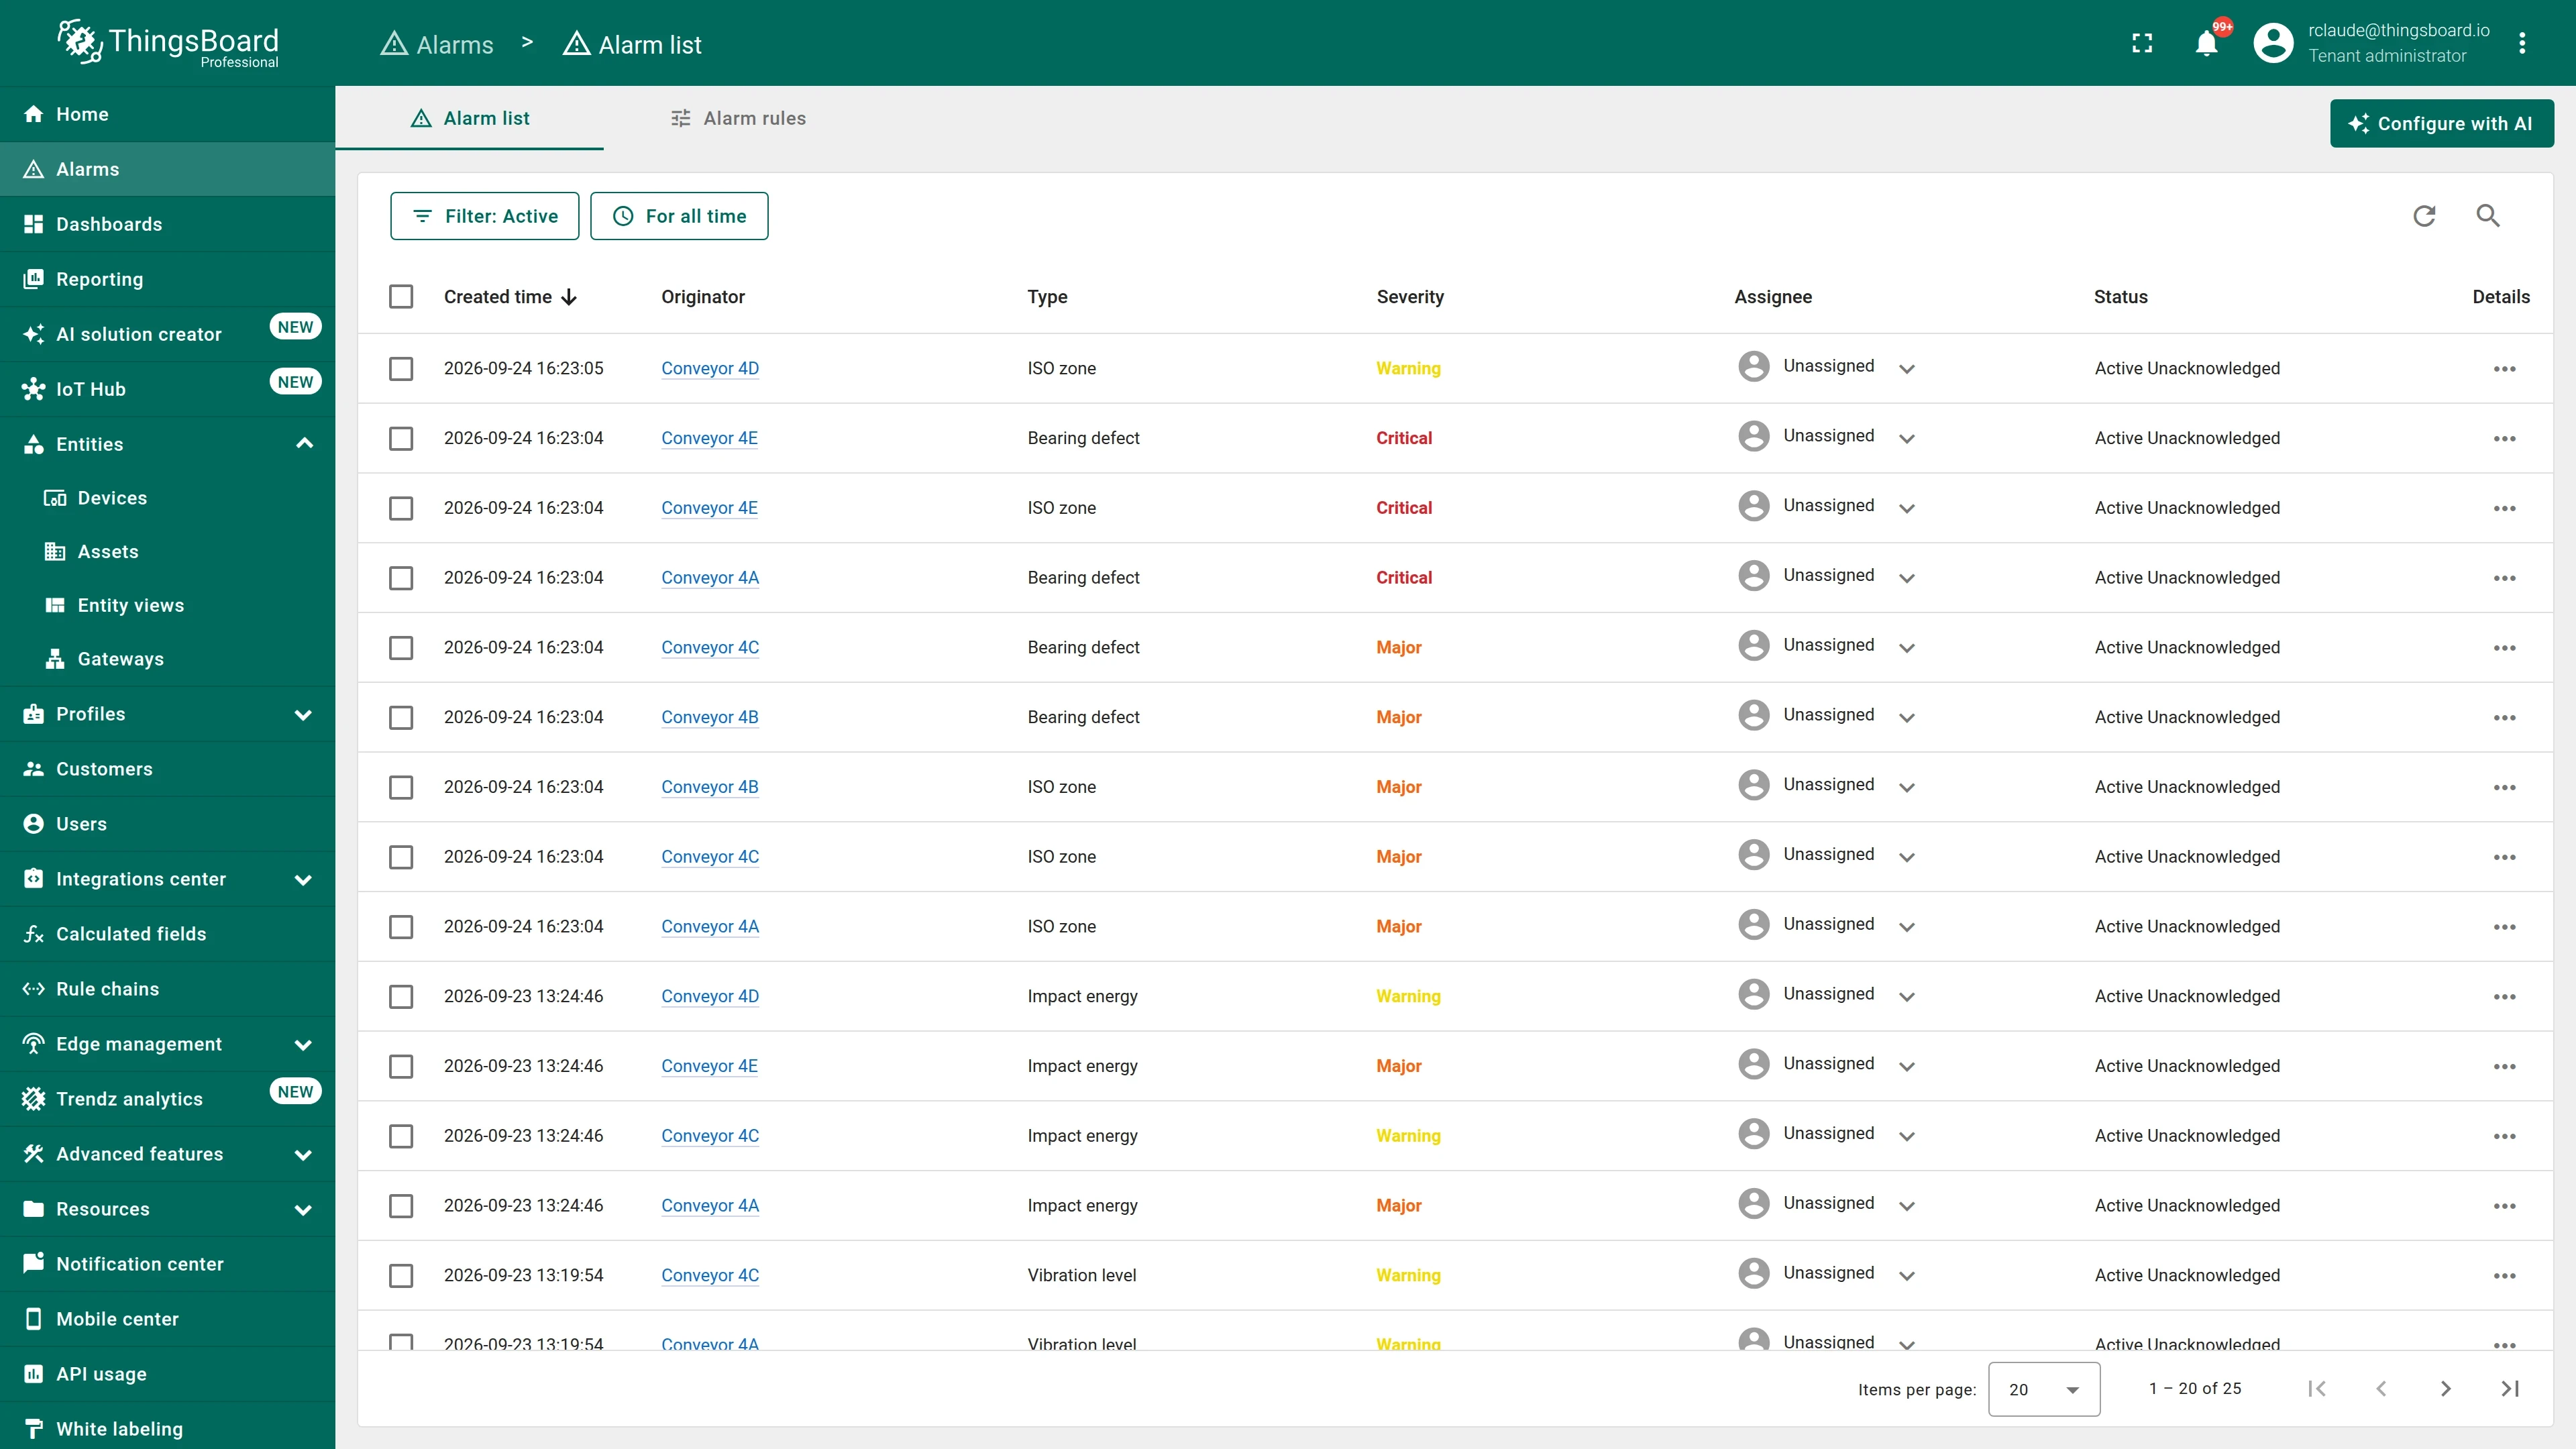
From there it is a normal ThingsBoard alarm: show it in alarm widgets, or forward it by email, SMS, or to a ticketing system with a rule chain. The Monitoring tab is described in detail in Monitoring tab below.
Early fault detection
Section titled “Early fault detection”Overall metrics react late. A bearing defect shows first at its own fault frequency, while RMS still looks normal. Trendz tracks both on every scan.
In the IMS bearing test, set 2, Bearing 1 failed with an outer race defect three days after this sample, while its outer race frequency (BPFO) was already 3 times its baseline:
- Metrics: on Feb 16 at 05:12, every metric is within ×1.13 of its median.
- Fault frequency: at the same moment, BPFO is already at ×3.1, and it keeps rising.
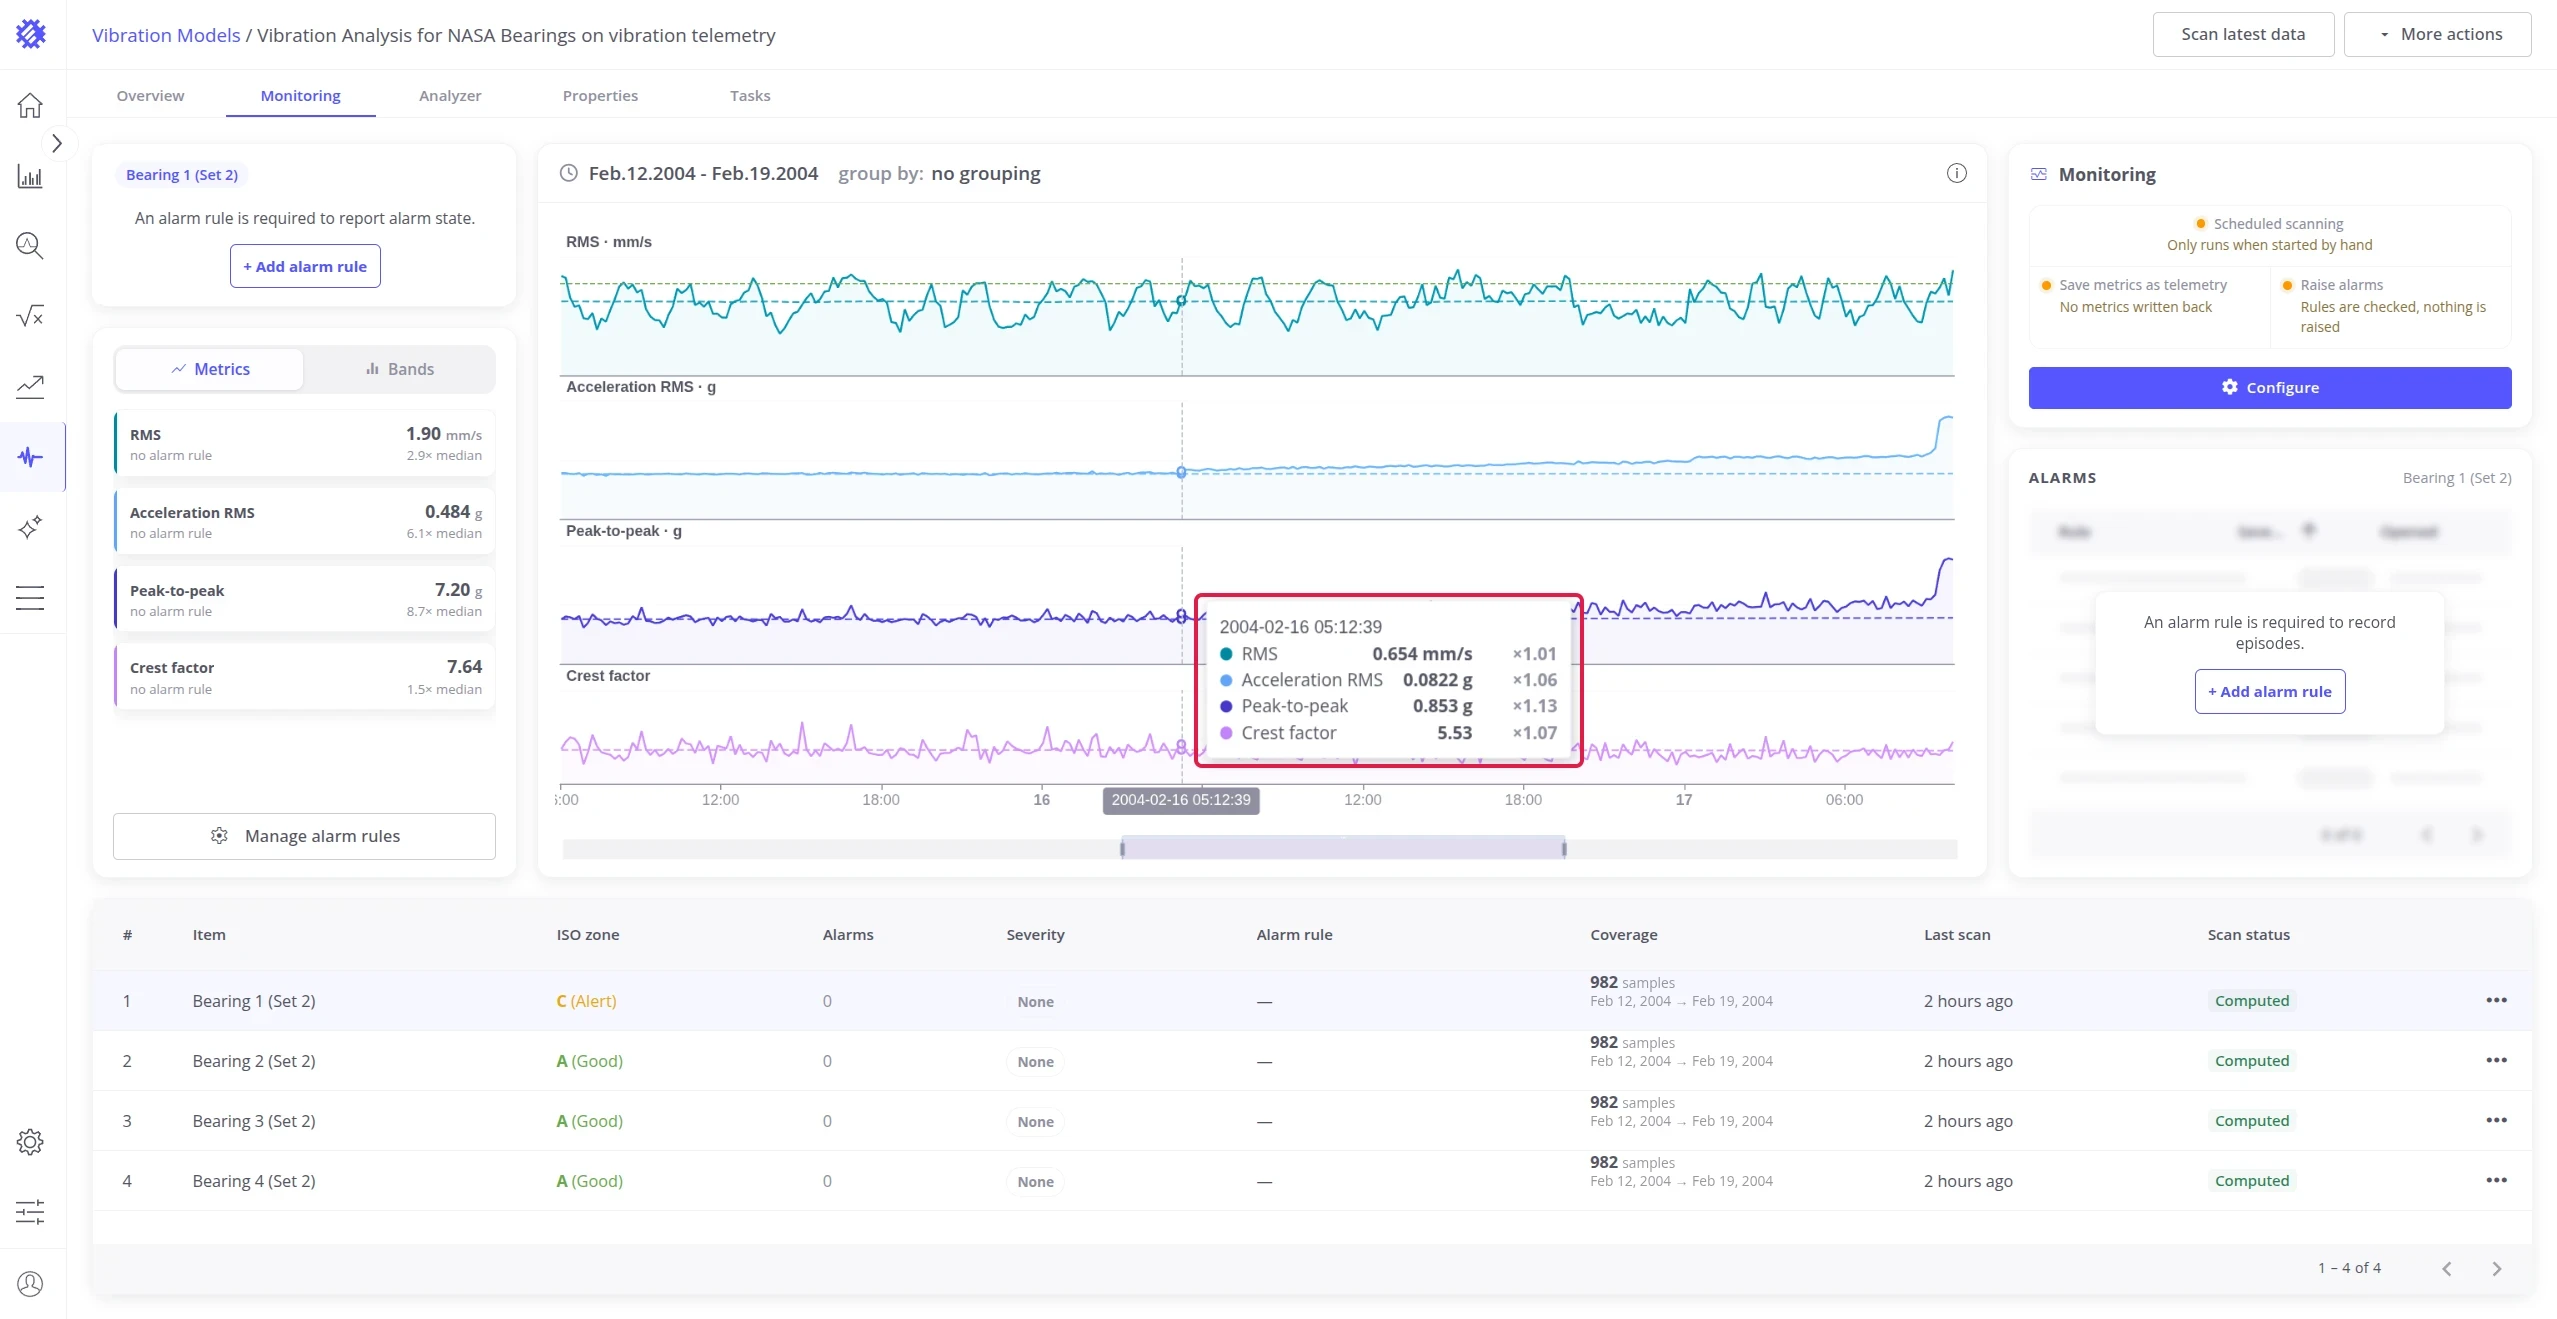
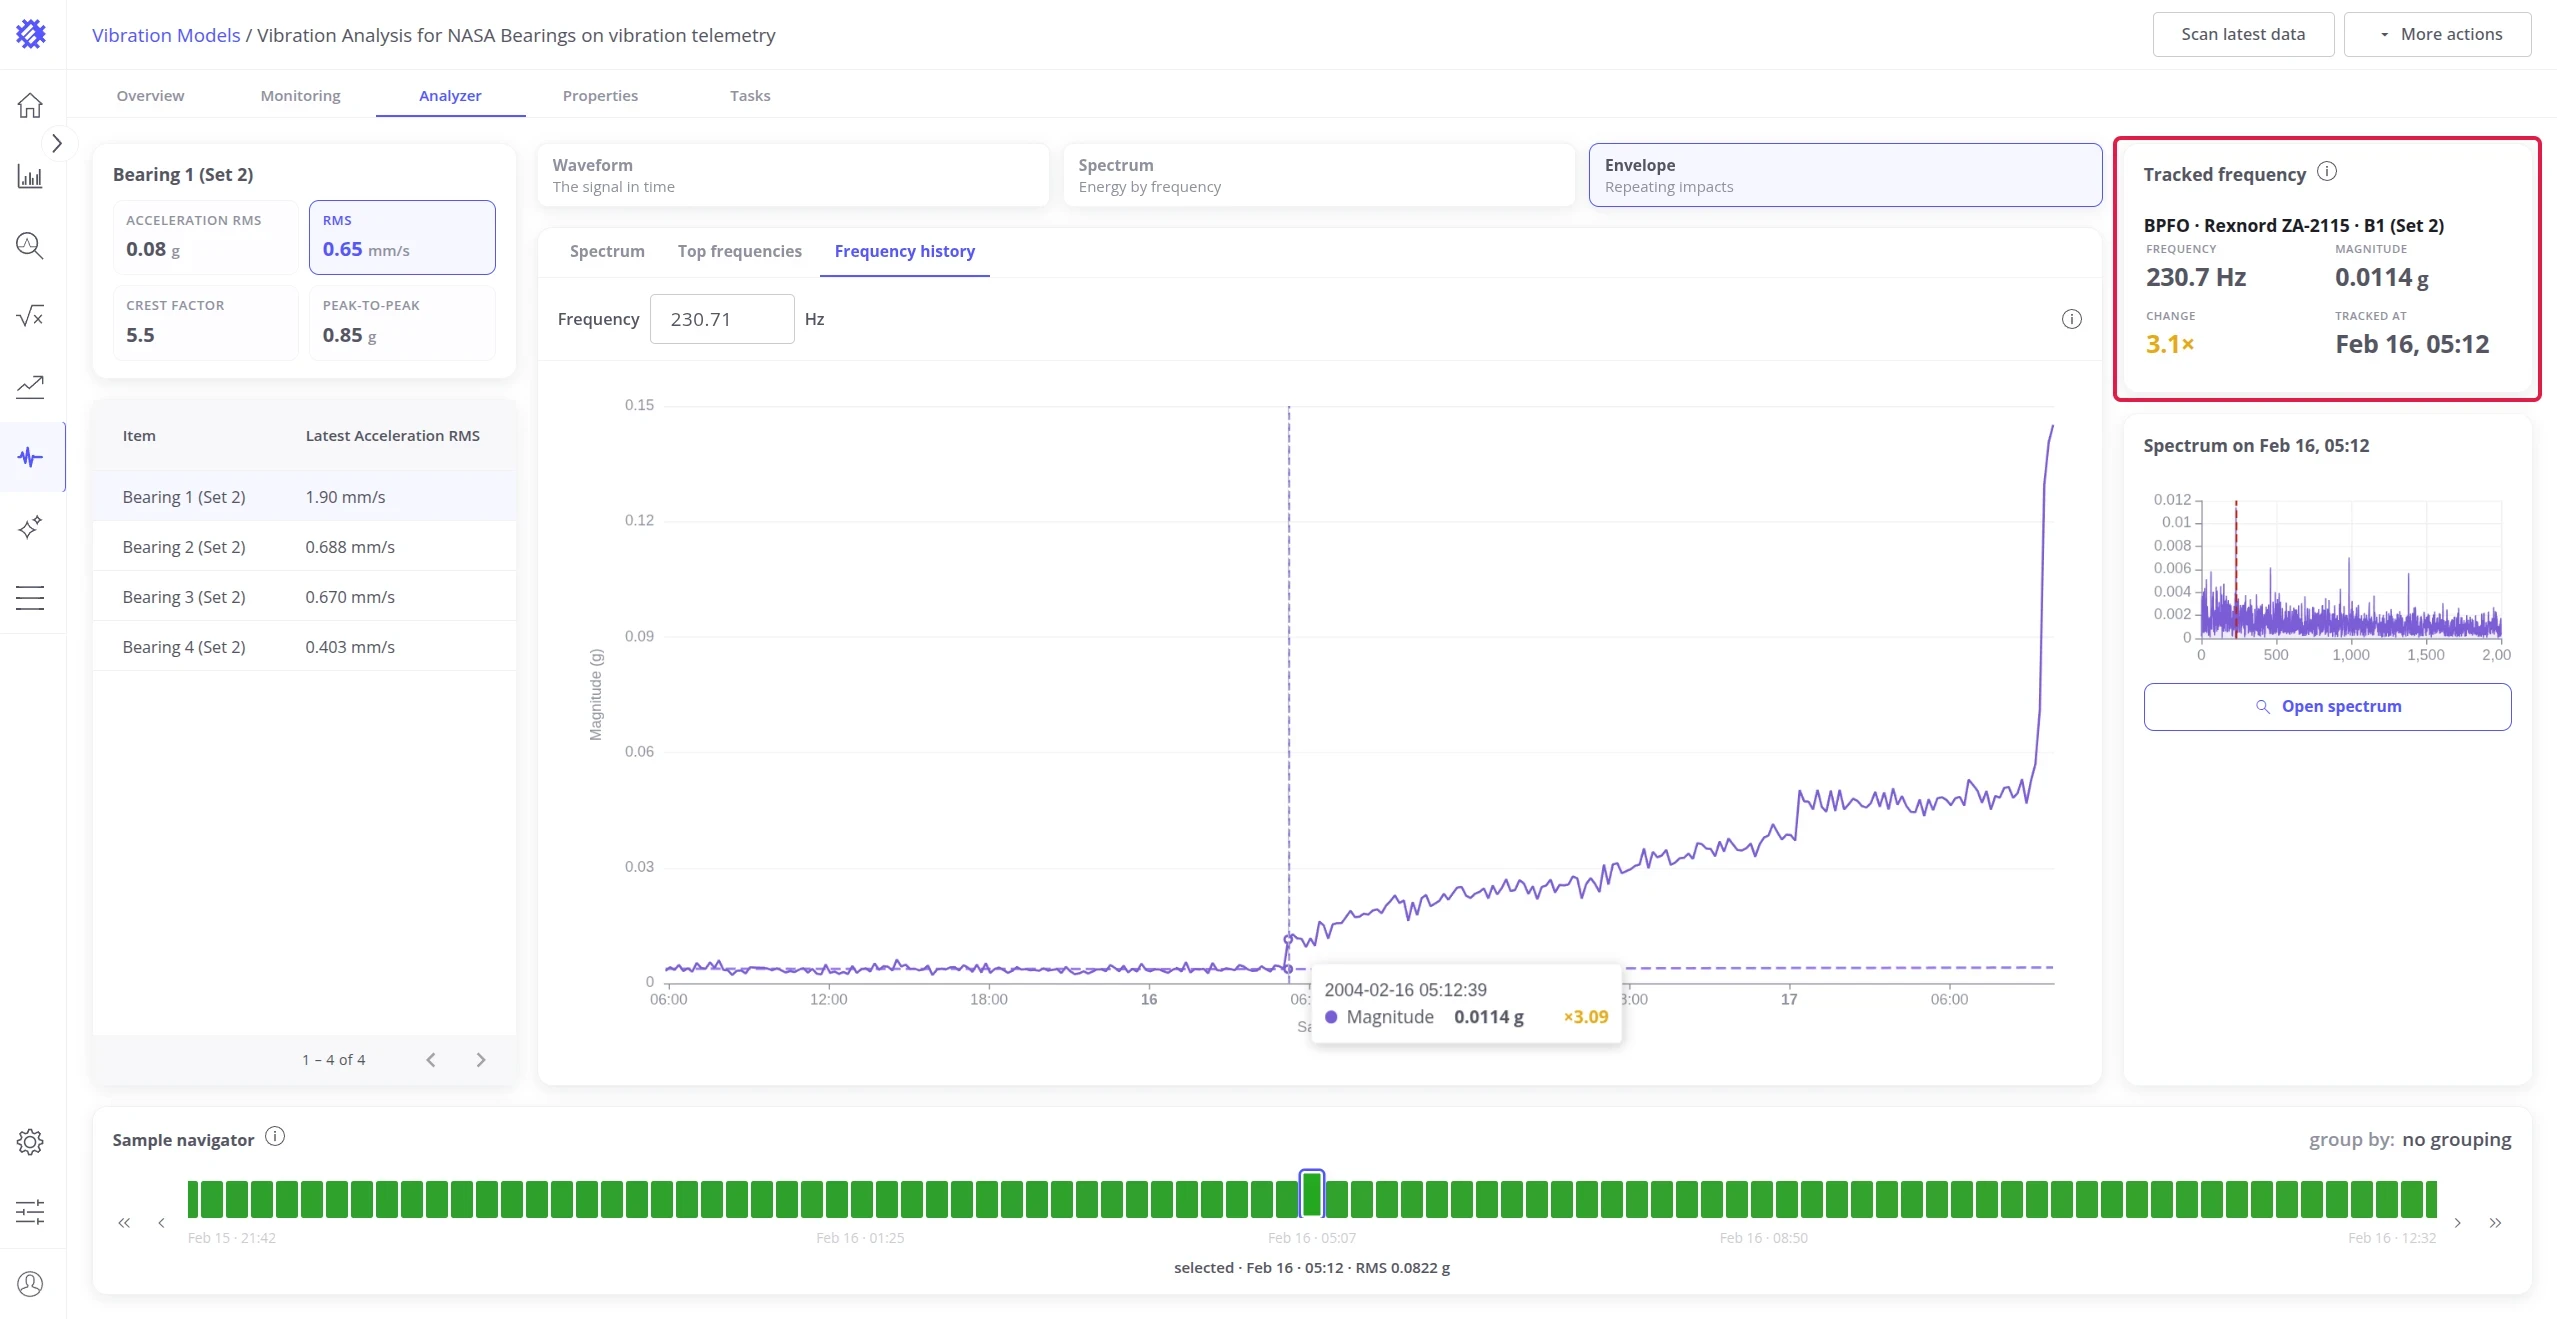
To get an alarm at this stage, add a Bearing defect rule.
Data: J. Lee, H. Qiu, G. Yu, J. Lin, and Rexnord Technical Services (2007). IMS, University of Cincinnati. “Bearing Data Set”, NASA Prognostics Data Repository, NASA Ames Research Center, Moffett Field, CA.
Monitoring tab
Section titled “Monitoring tab”On the Monitoring tab of the model you can follow the alarms your rules raise and manage the alarm rules:
- Alarms: the Alarms card on the right lists the open alarms of the selected machine, with their rule, severity, and when they opened. The items table below shows the alarms of every machine.
- Manage alarm rules: the button opens the rule editor, with the number of rules the model has.
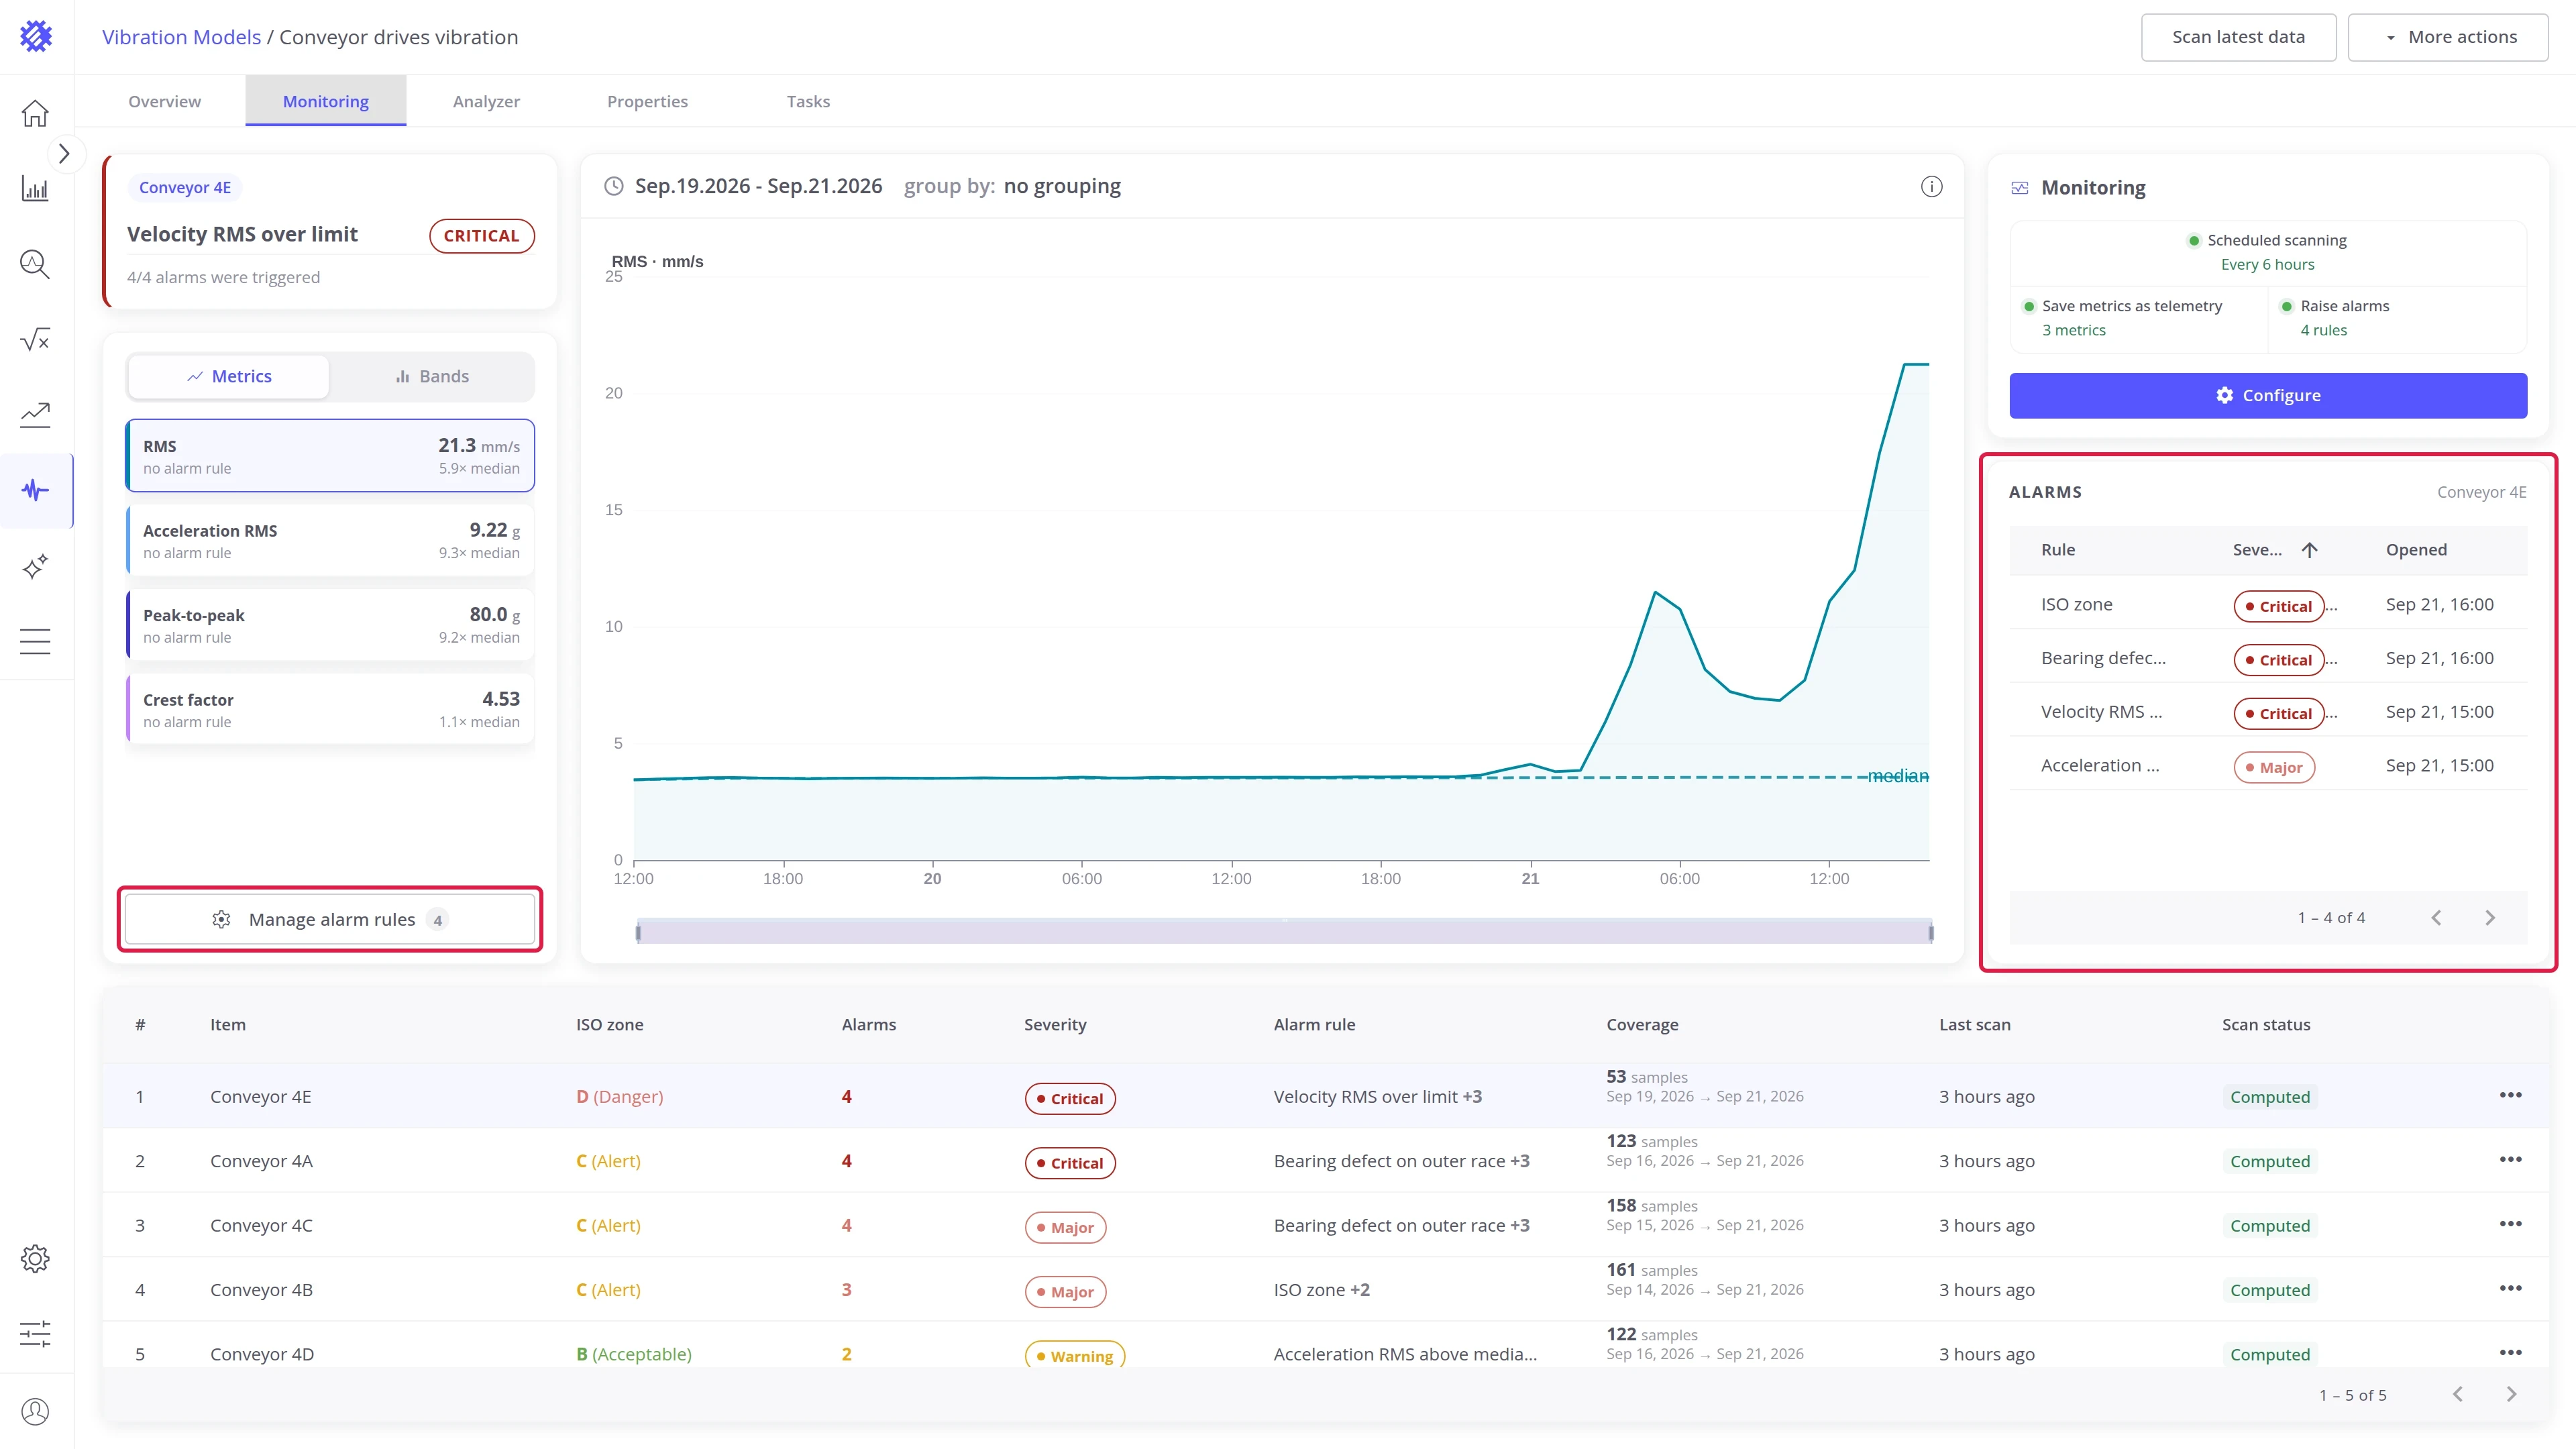
Read more about the tab in Monitoring tab.
Vibration View Field
Section titled “Vibration View Field”Each vibration model adds a field, named after the model, to its profile’s business entity. Use it to chart vibration in Trendz views next to the machine’s other data. With monitoring on, every scan adds new values to it.
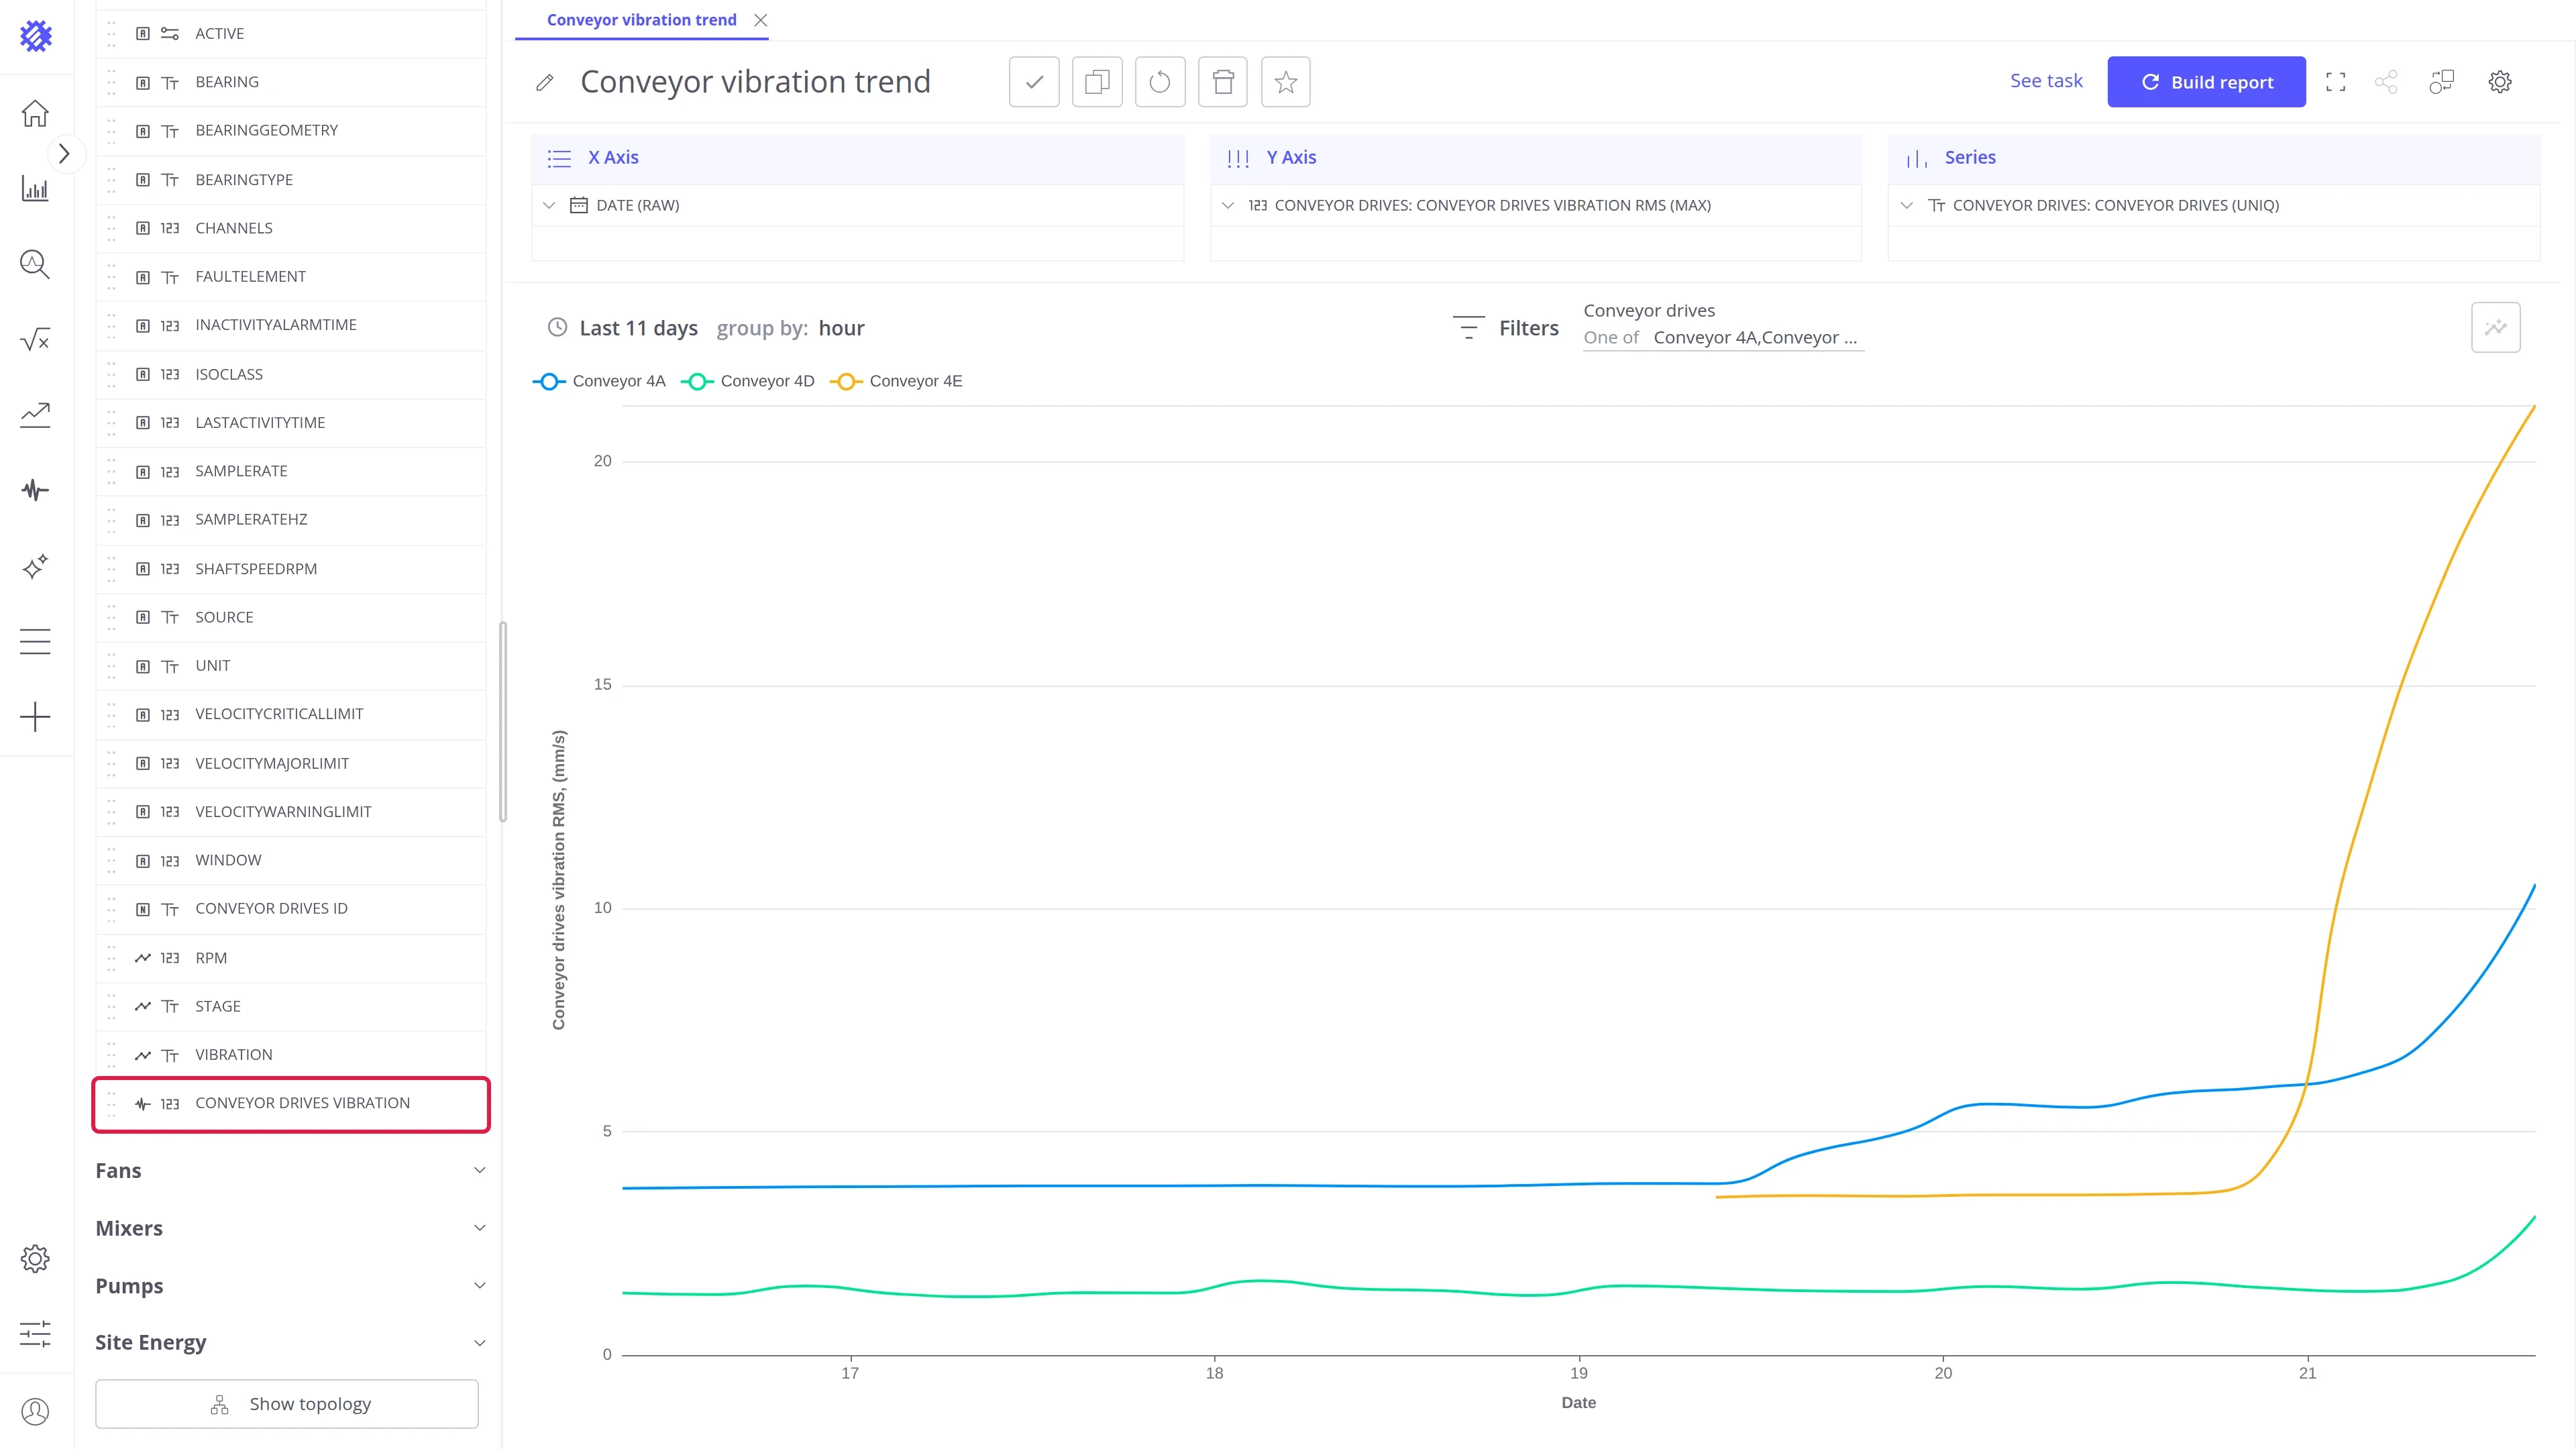
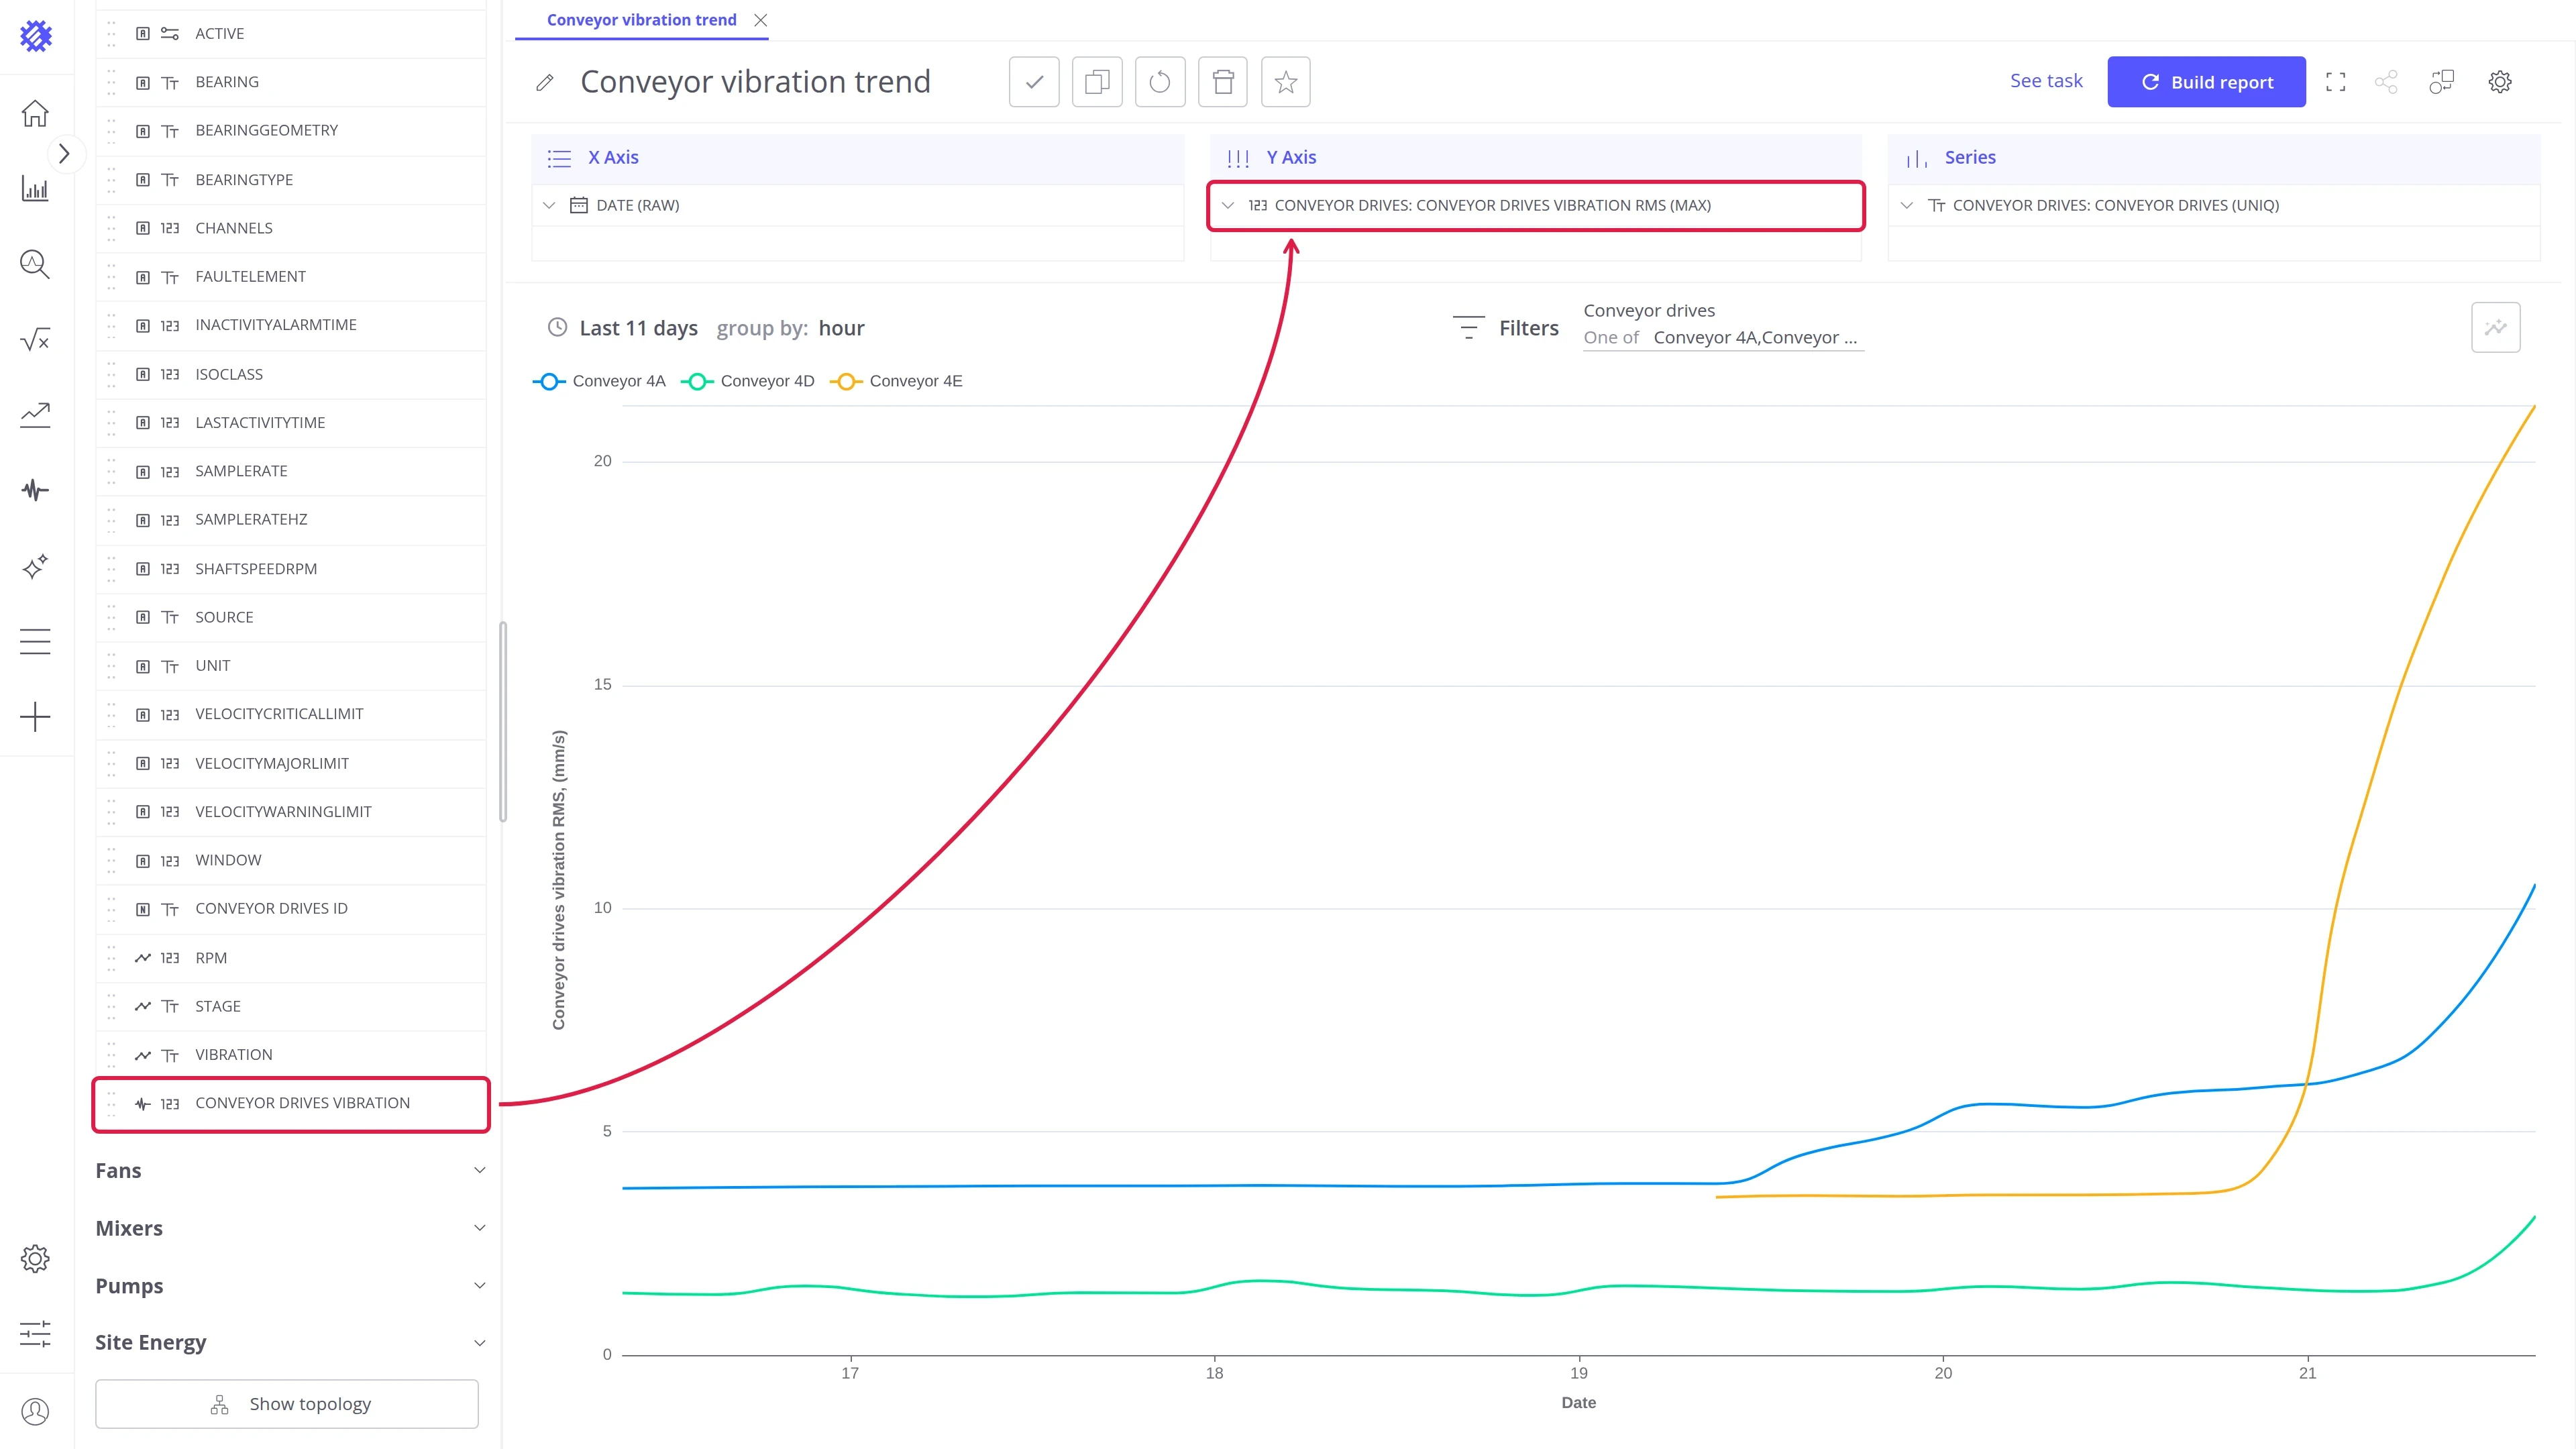
To chart it, drag the field onto the Y axis of a view, with Date on the X axis and the device on Series. Use a line chart rather than a bar chart: each machine becomes one line over time, so a rising trend is easy to see.
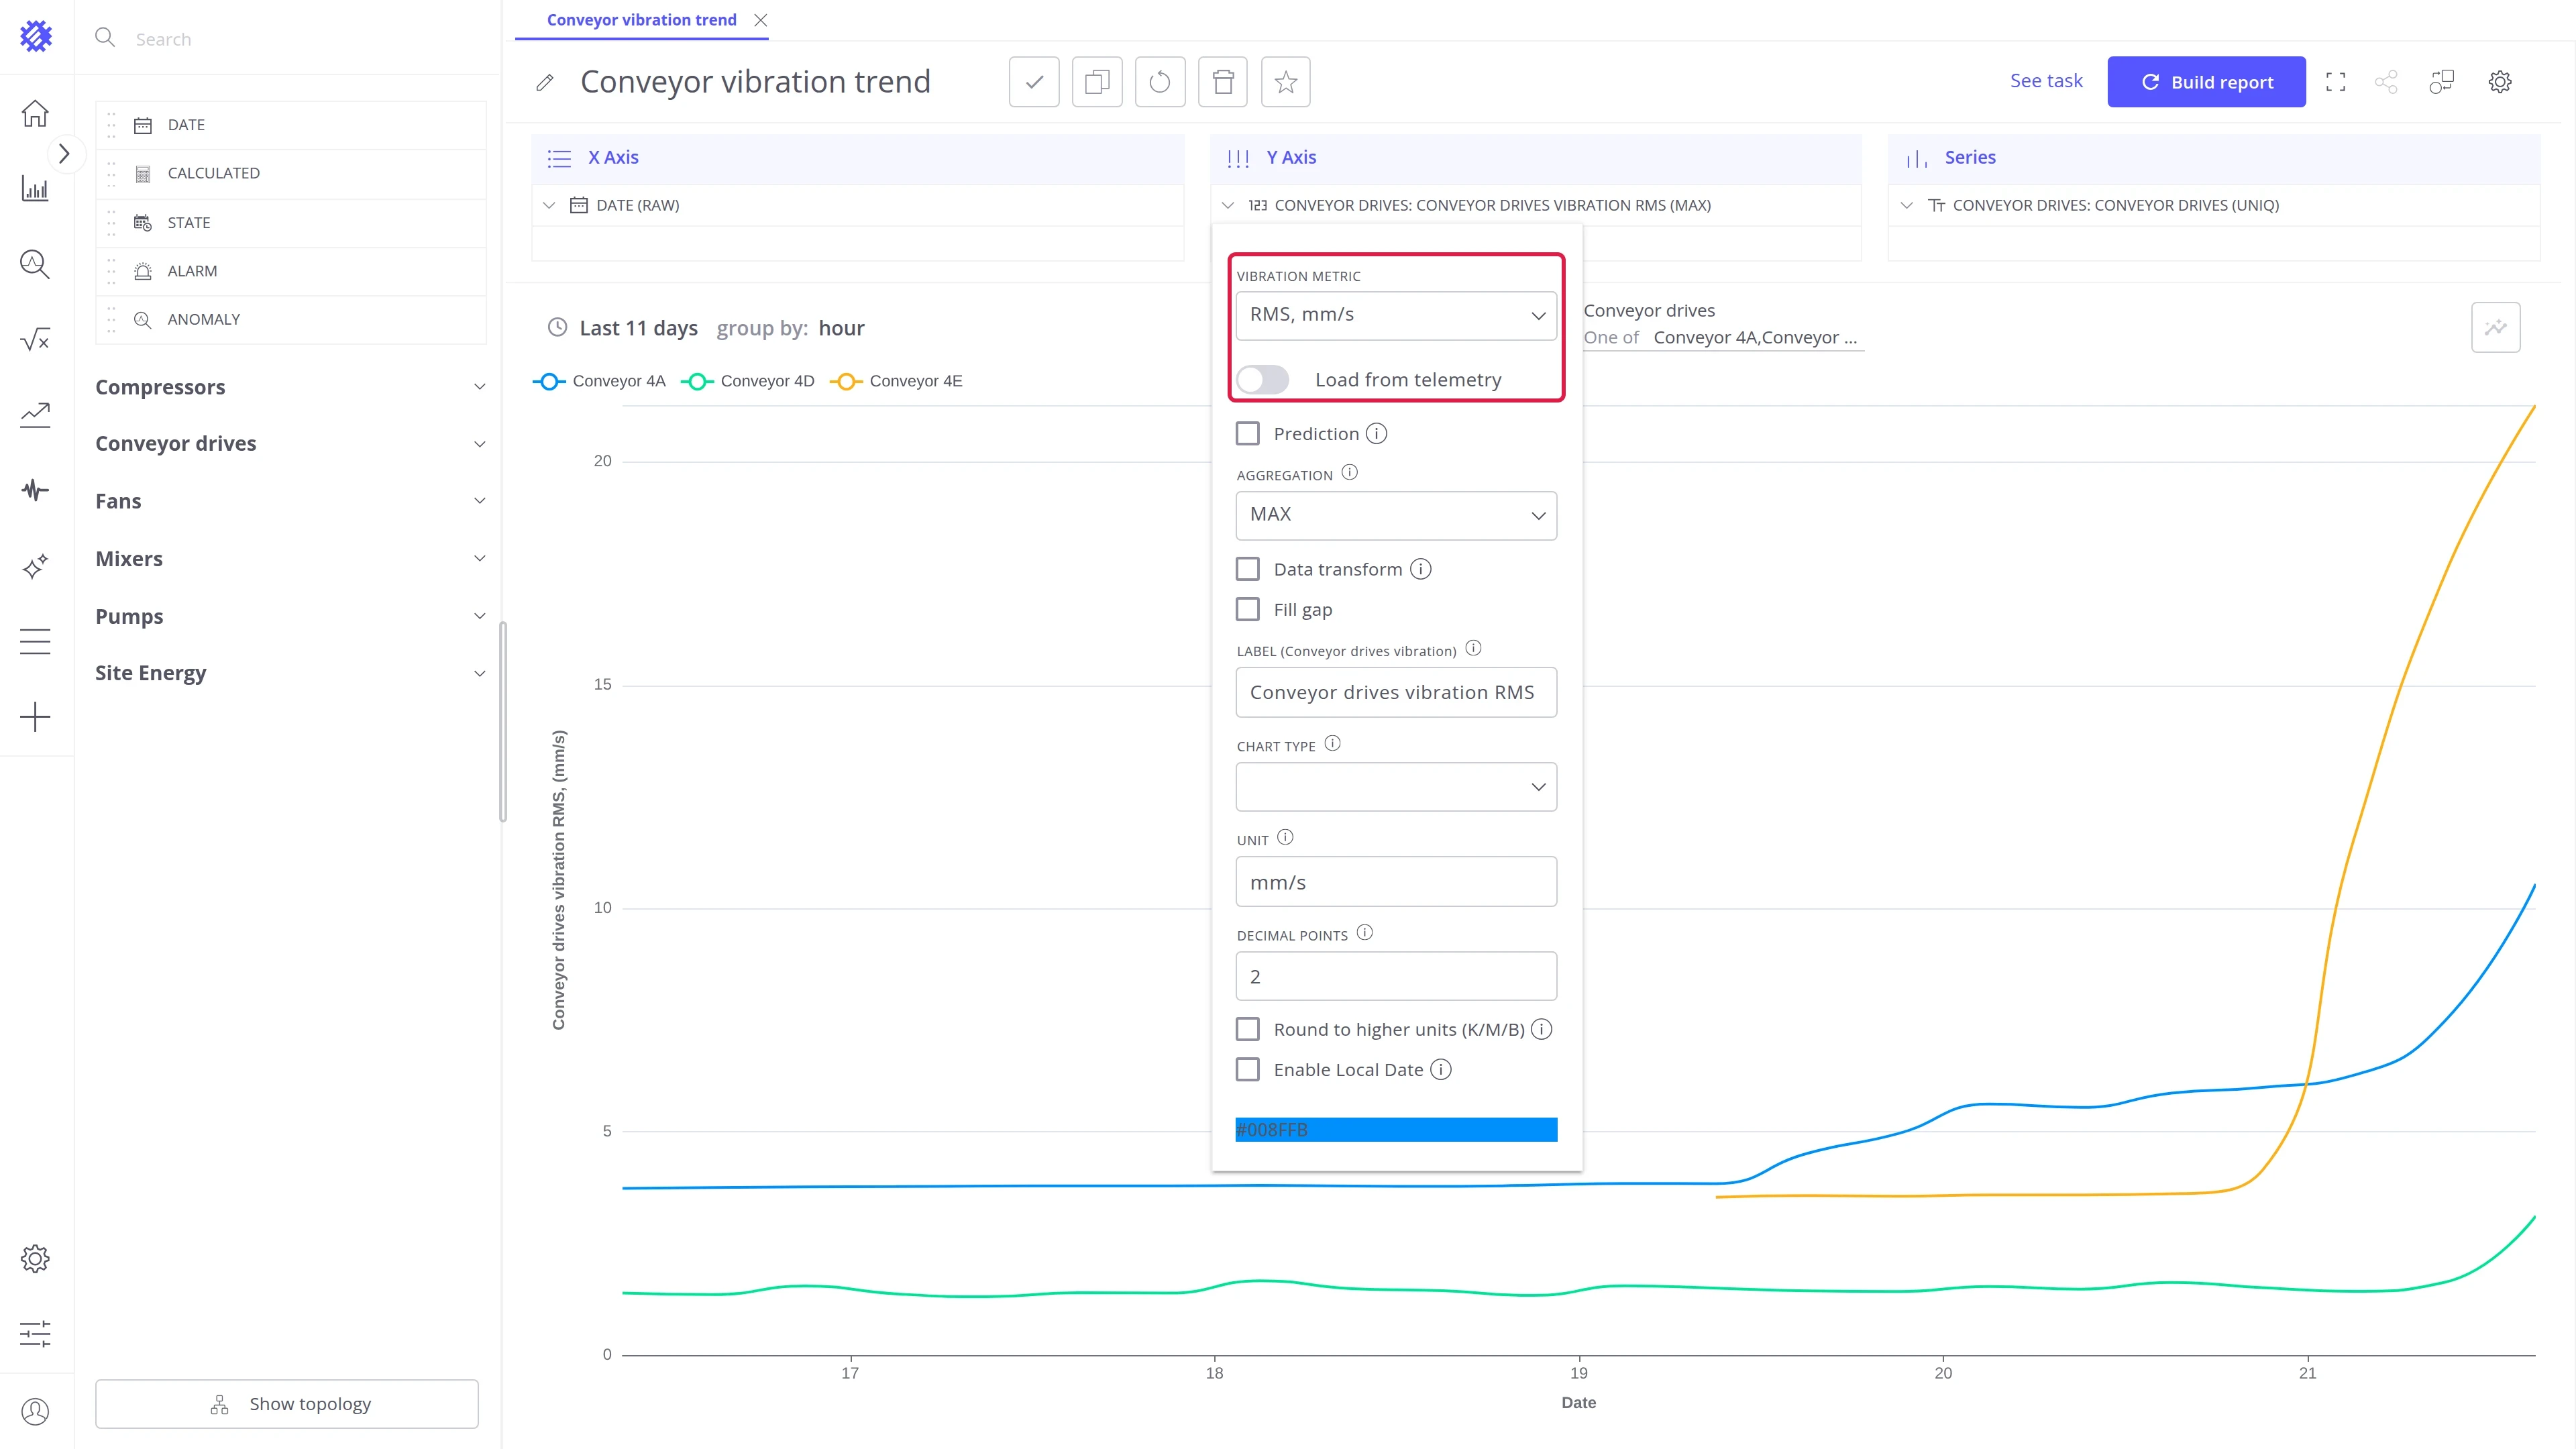
Click the field on the axis to change what it reads:
| Setting | Description |
|---|---|
| Vibration metric | Which metric the field returns: RMS, acceleration RMS, peak-to-peak, or crest factor, with its unit |
| Axis | Which axis to read, on a model that has more than one |
| Load from telemetry | Off reads the metrics stored by scans; on reads the _EVD_ keys exported to ThingsBoard |
A view built this way can be filtered, grouped, and compared like any other, and embedded in a ThingsBoard dashboard with the Trendz widget.
Was this helpful?