Vibration Models Workspace
Vibration Models in the left menu is where you create, open, and manage vibration models. One model reads the vibration samples of the machines in one device or asset profile, and turns every sample it scans into results: metrics, spectra, an ISO zone, and the most likely shaft and bearing problems.
Layout
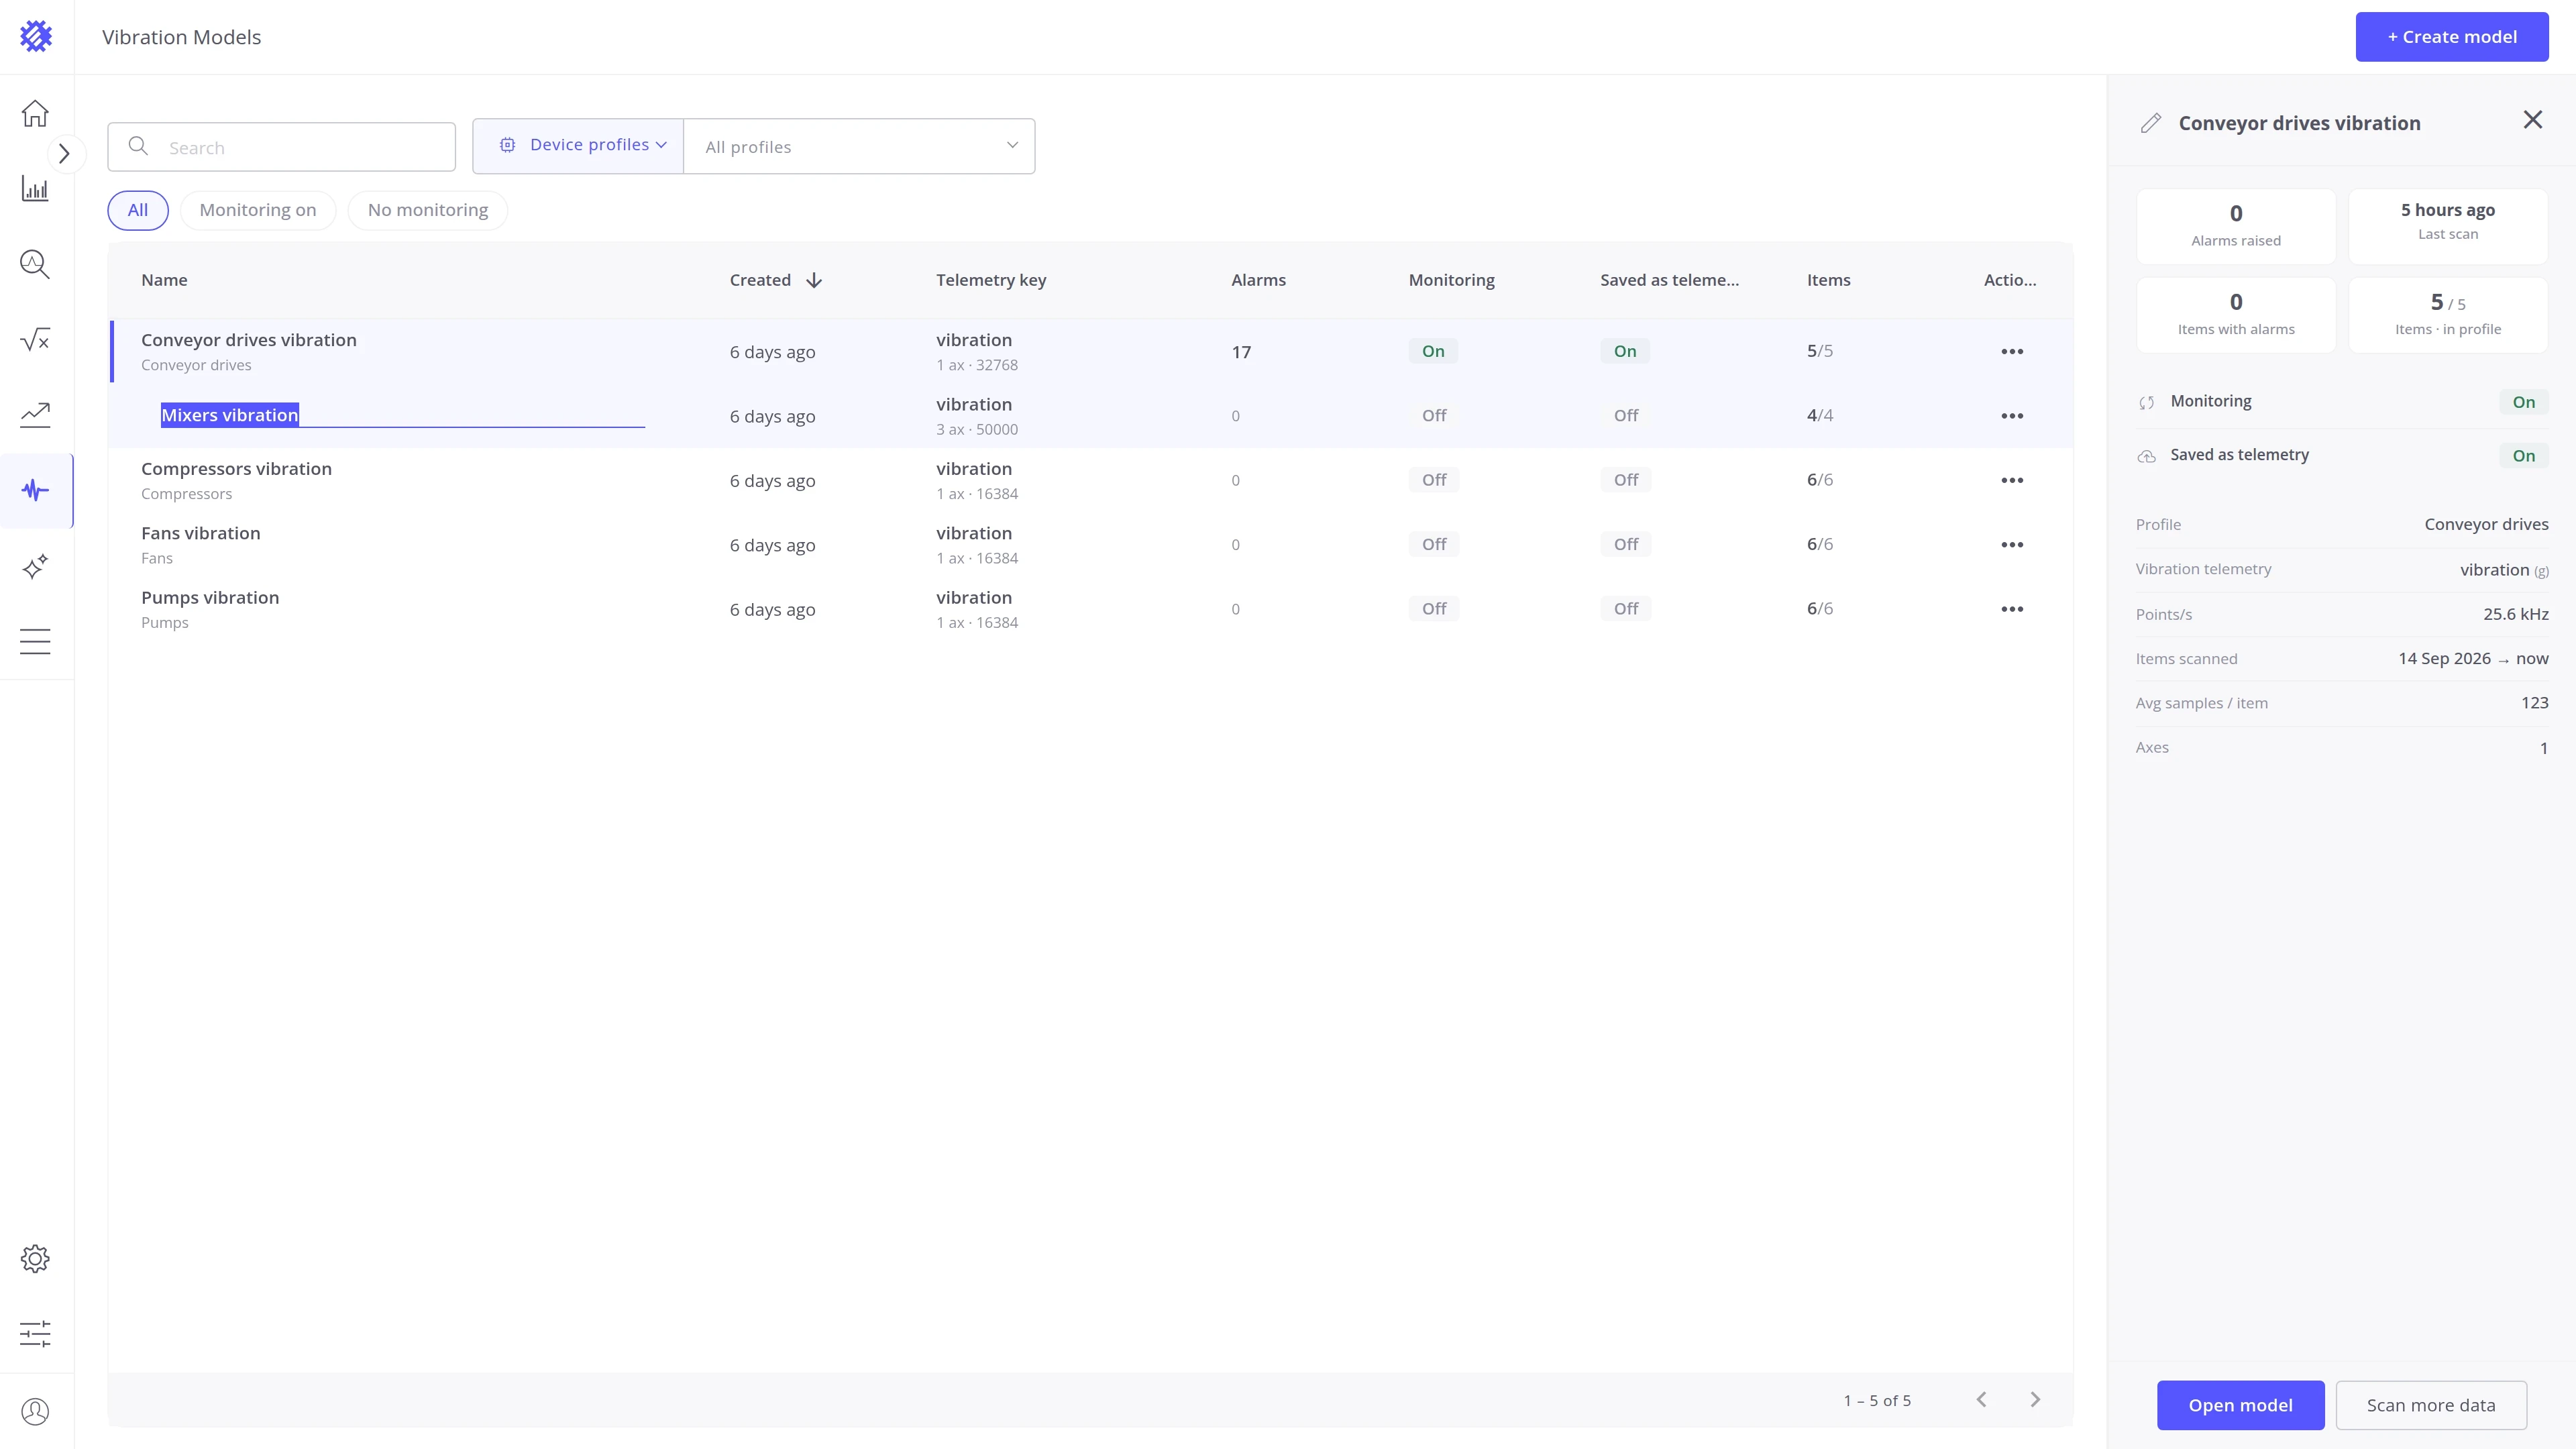
Section titled “Layout”You work with two screens. The Vibration Models list shows every model of the tenant. Click a model to see its details beside the table, then open it.
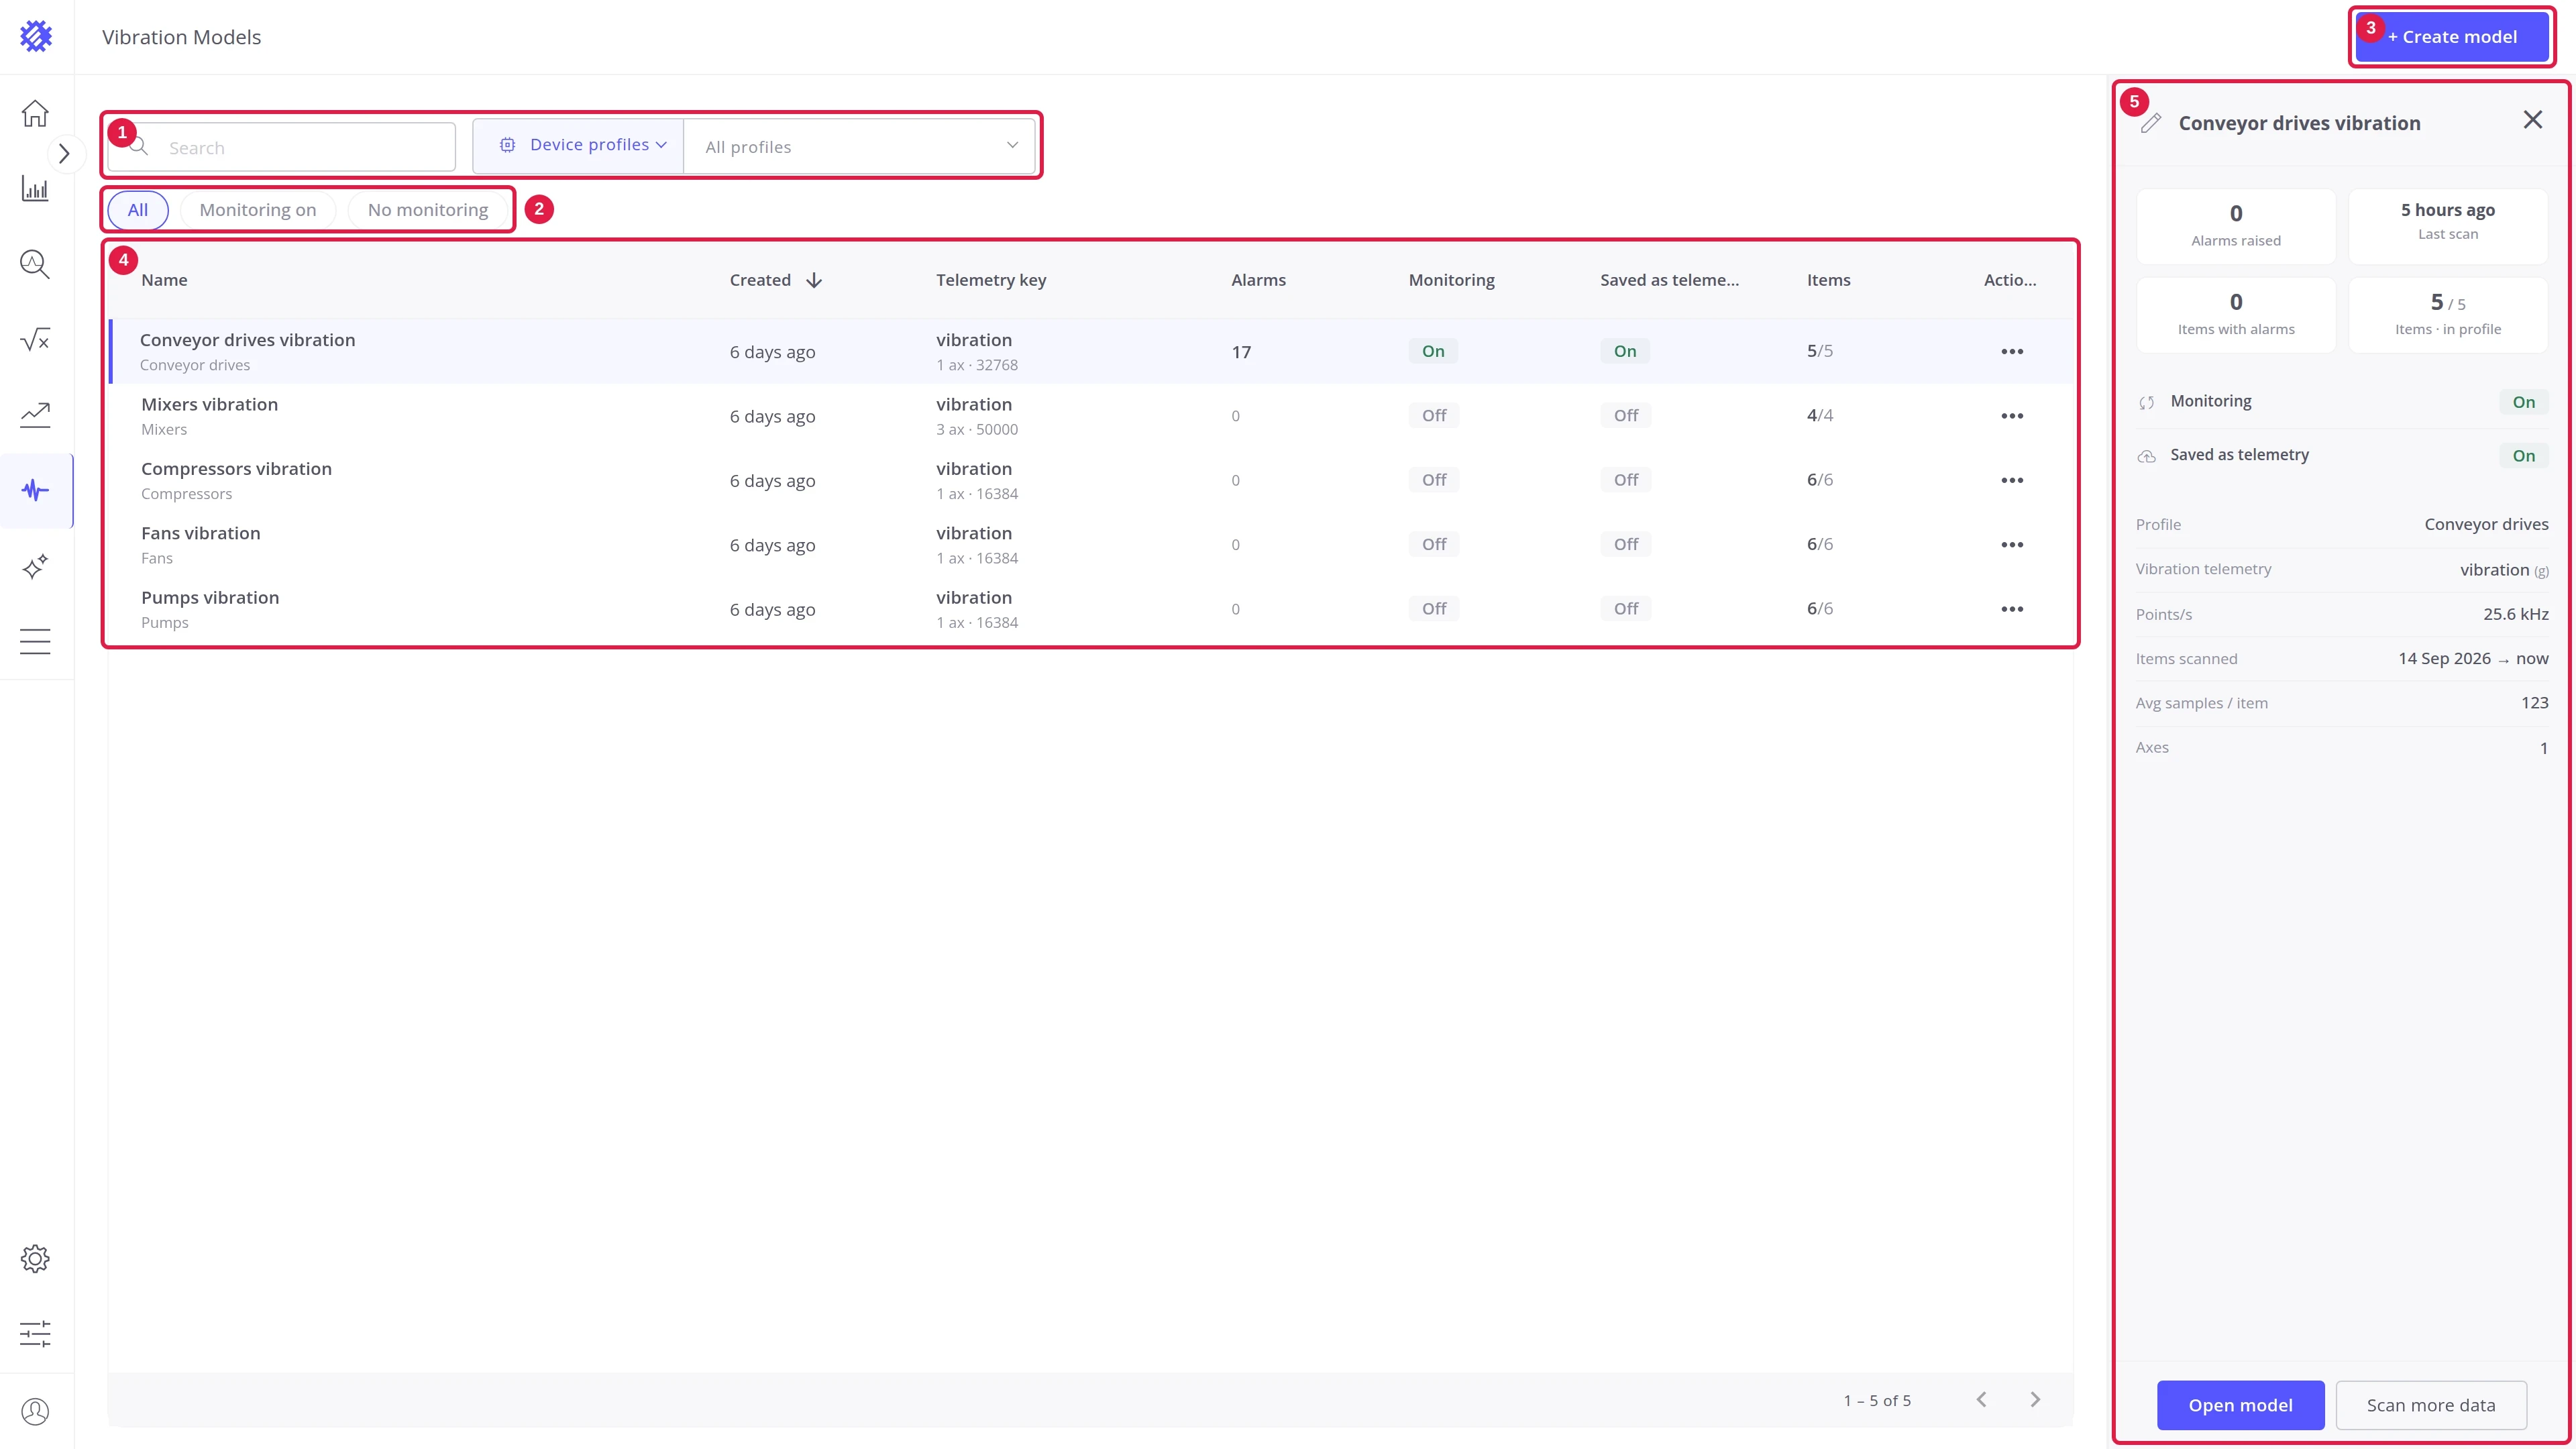
| # | Area | Contents |
|---|---|---|
| 1 | Search and profile filter | Find a model by name, or show the models of one profile |
| 2 | Chips | Show all models, or only those with or without monitoring |
| 3 | Create model | Opens the wizard, described in Getting Started |
| 4 | Models | Every model with what it reads and what it writes back. The row menu renames or deletes a model |
| 5 | Detail panel | The selected model at a glance, with Open model and Scan more data |
The model page shows one model. Its tabs show the results, and its actions scan new data.
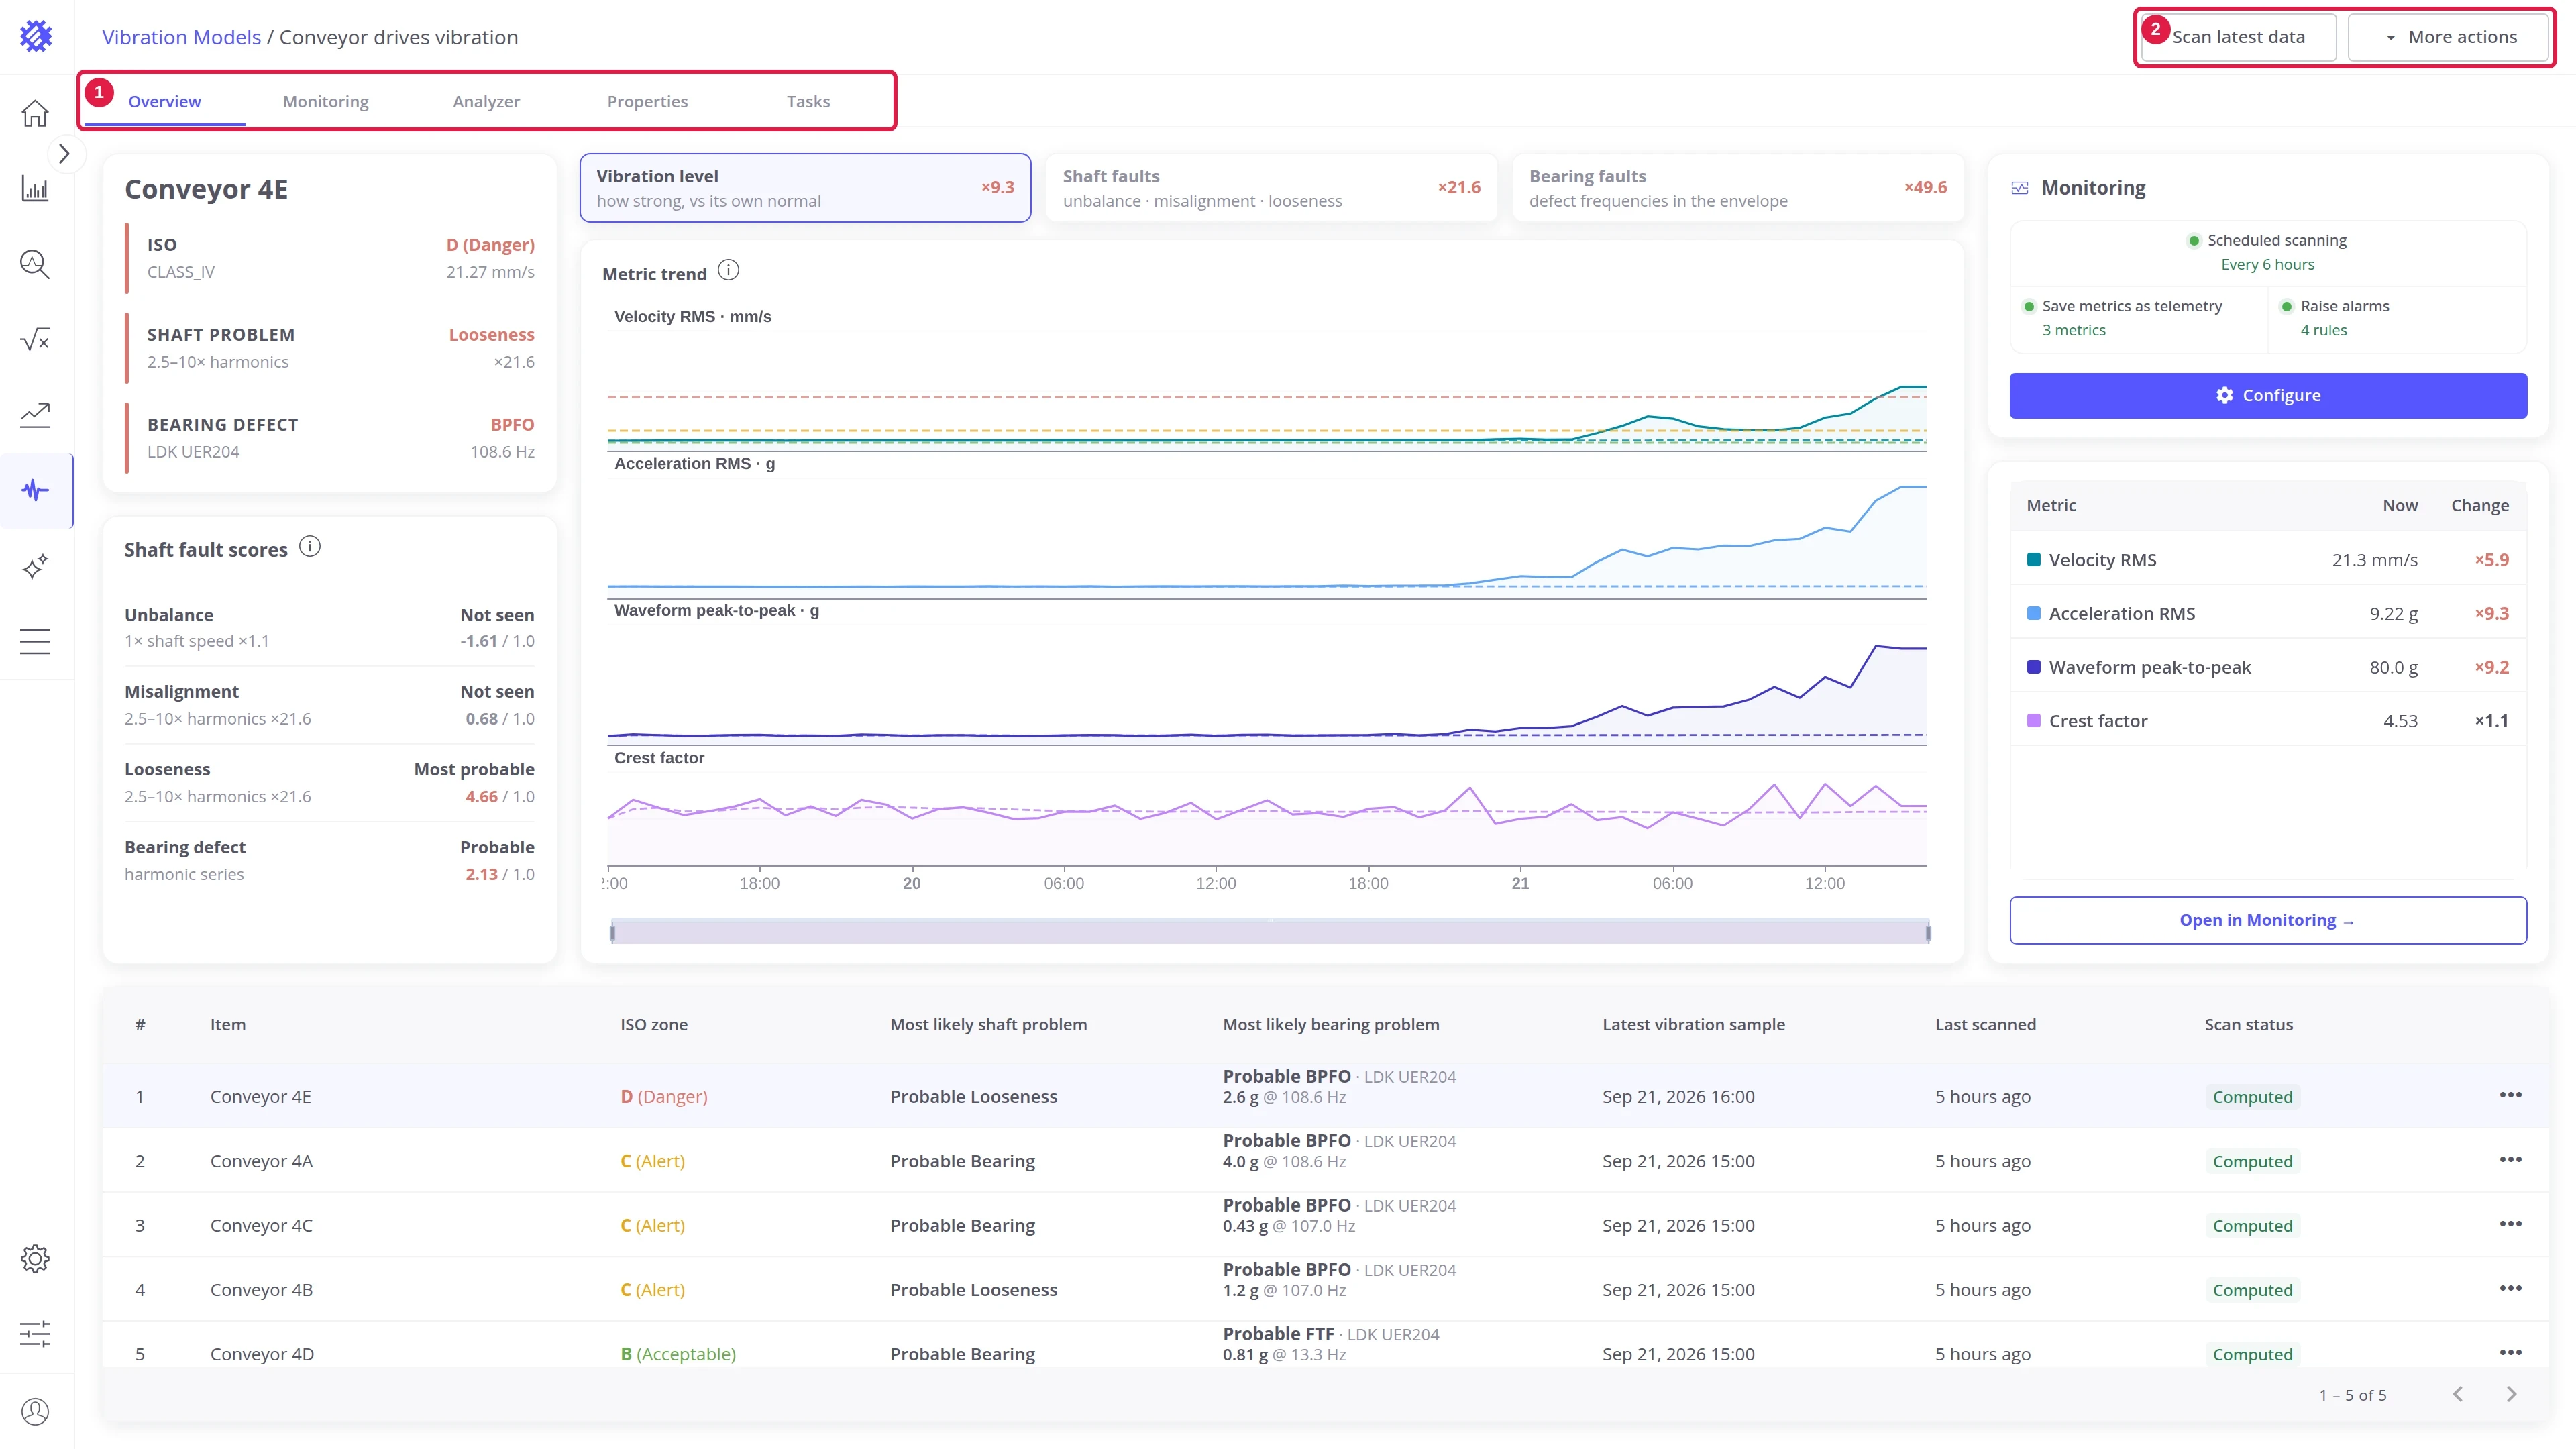
| # | Area | Contents |
|---|---|---|
| 1 | Tabs | Overview, Monitoring, Analyzer, Properties, and Tasks, each showing one side of the model |
| 2 | Actions | Scan latest data and More actions, which work on the whole model |
Vibration Models list
Section titled “Vibration Models list”The list opens on every model of the tenant, newest first. Create model opens the wizard, described in Getting Started.
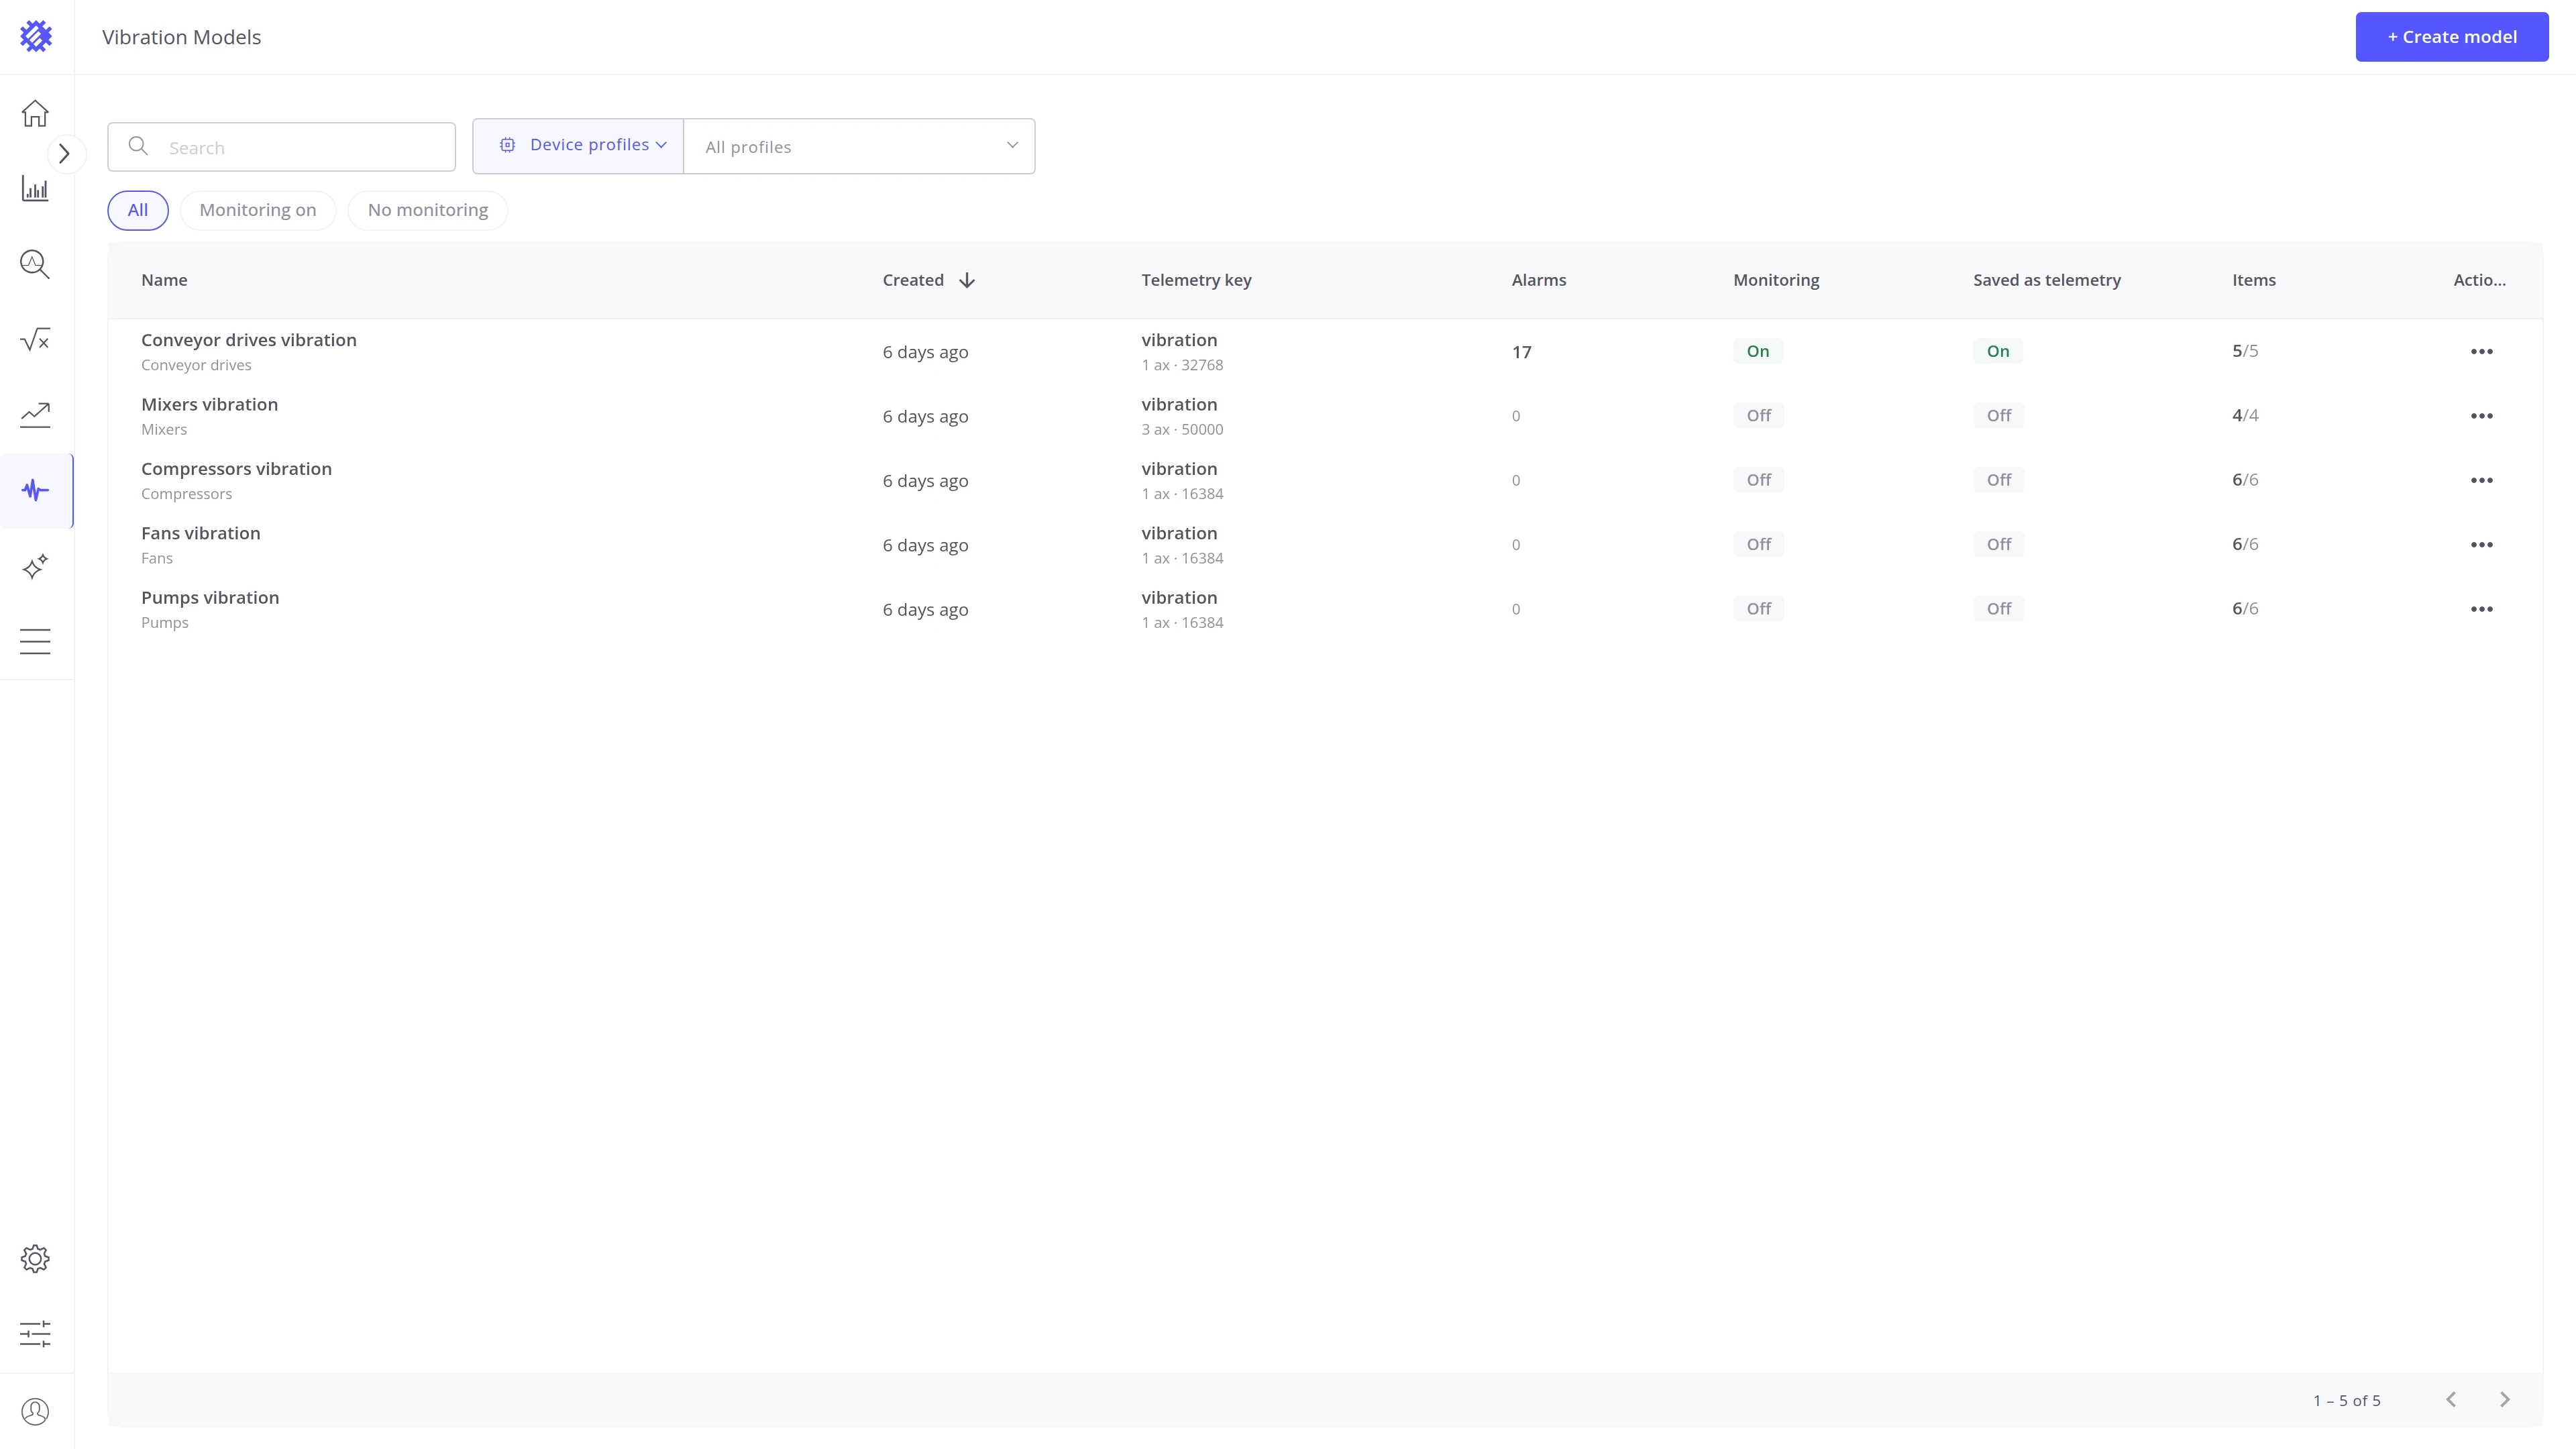
Each row in the table shows:
| Column | Description |
|---|---|
| Name | Model name and the profile it reads |
| Created | When the model was created |
| Telemetry key | The key that holds the waveform, with the axis count and the points per sample |
| Alarms | Open alarms raised by this model’s rules |
| Monitoring | Whether scheduled scanning is enabled |
| Saved as telemetry | Whether each scan writes the selected metrics back to ThingsBoard |
| Items | Machines scanned, out of the machines the profile holds |
Filtering models
Section titled “Filtering models”By profile. The left select switches between Device profiles and Asset profiles, the right one picks a single profile. Every profile is listed with the number of items it holds:
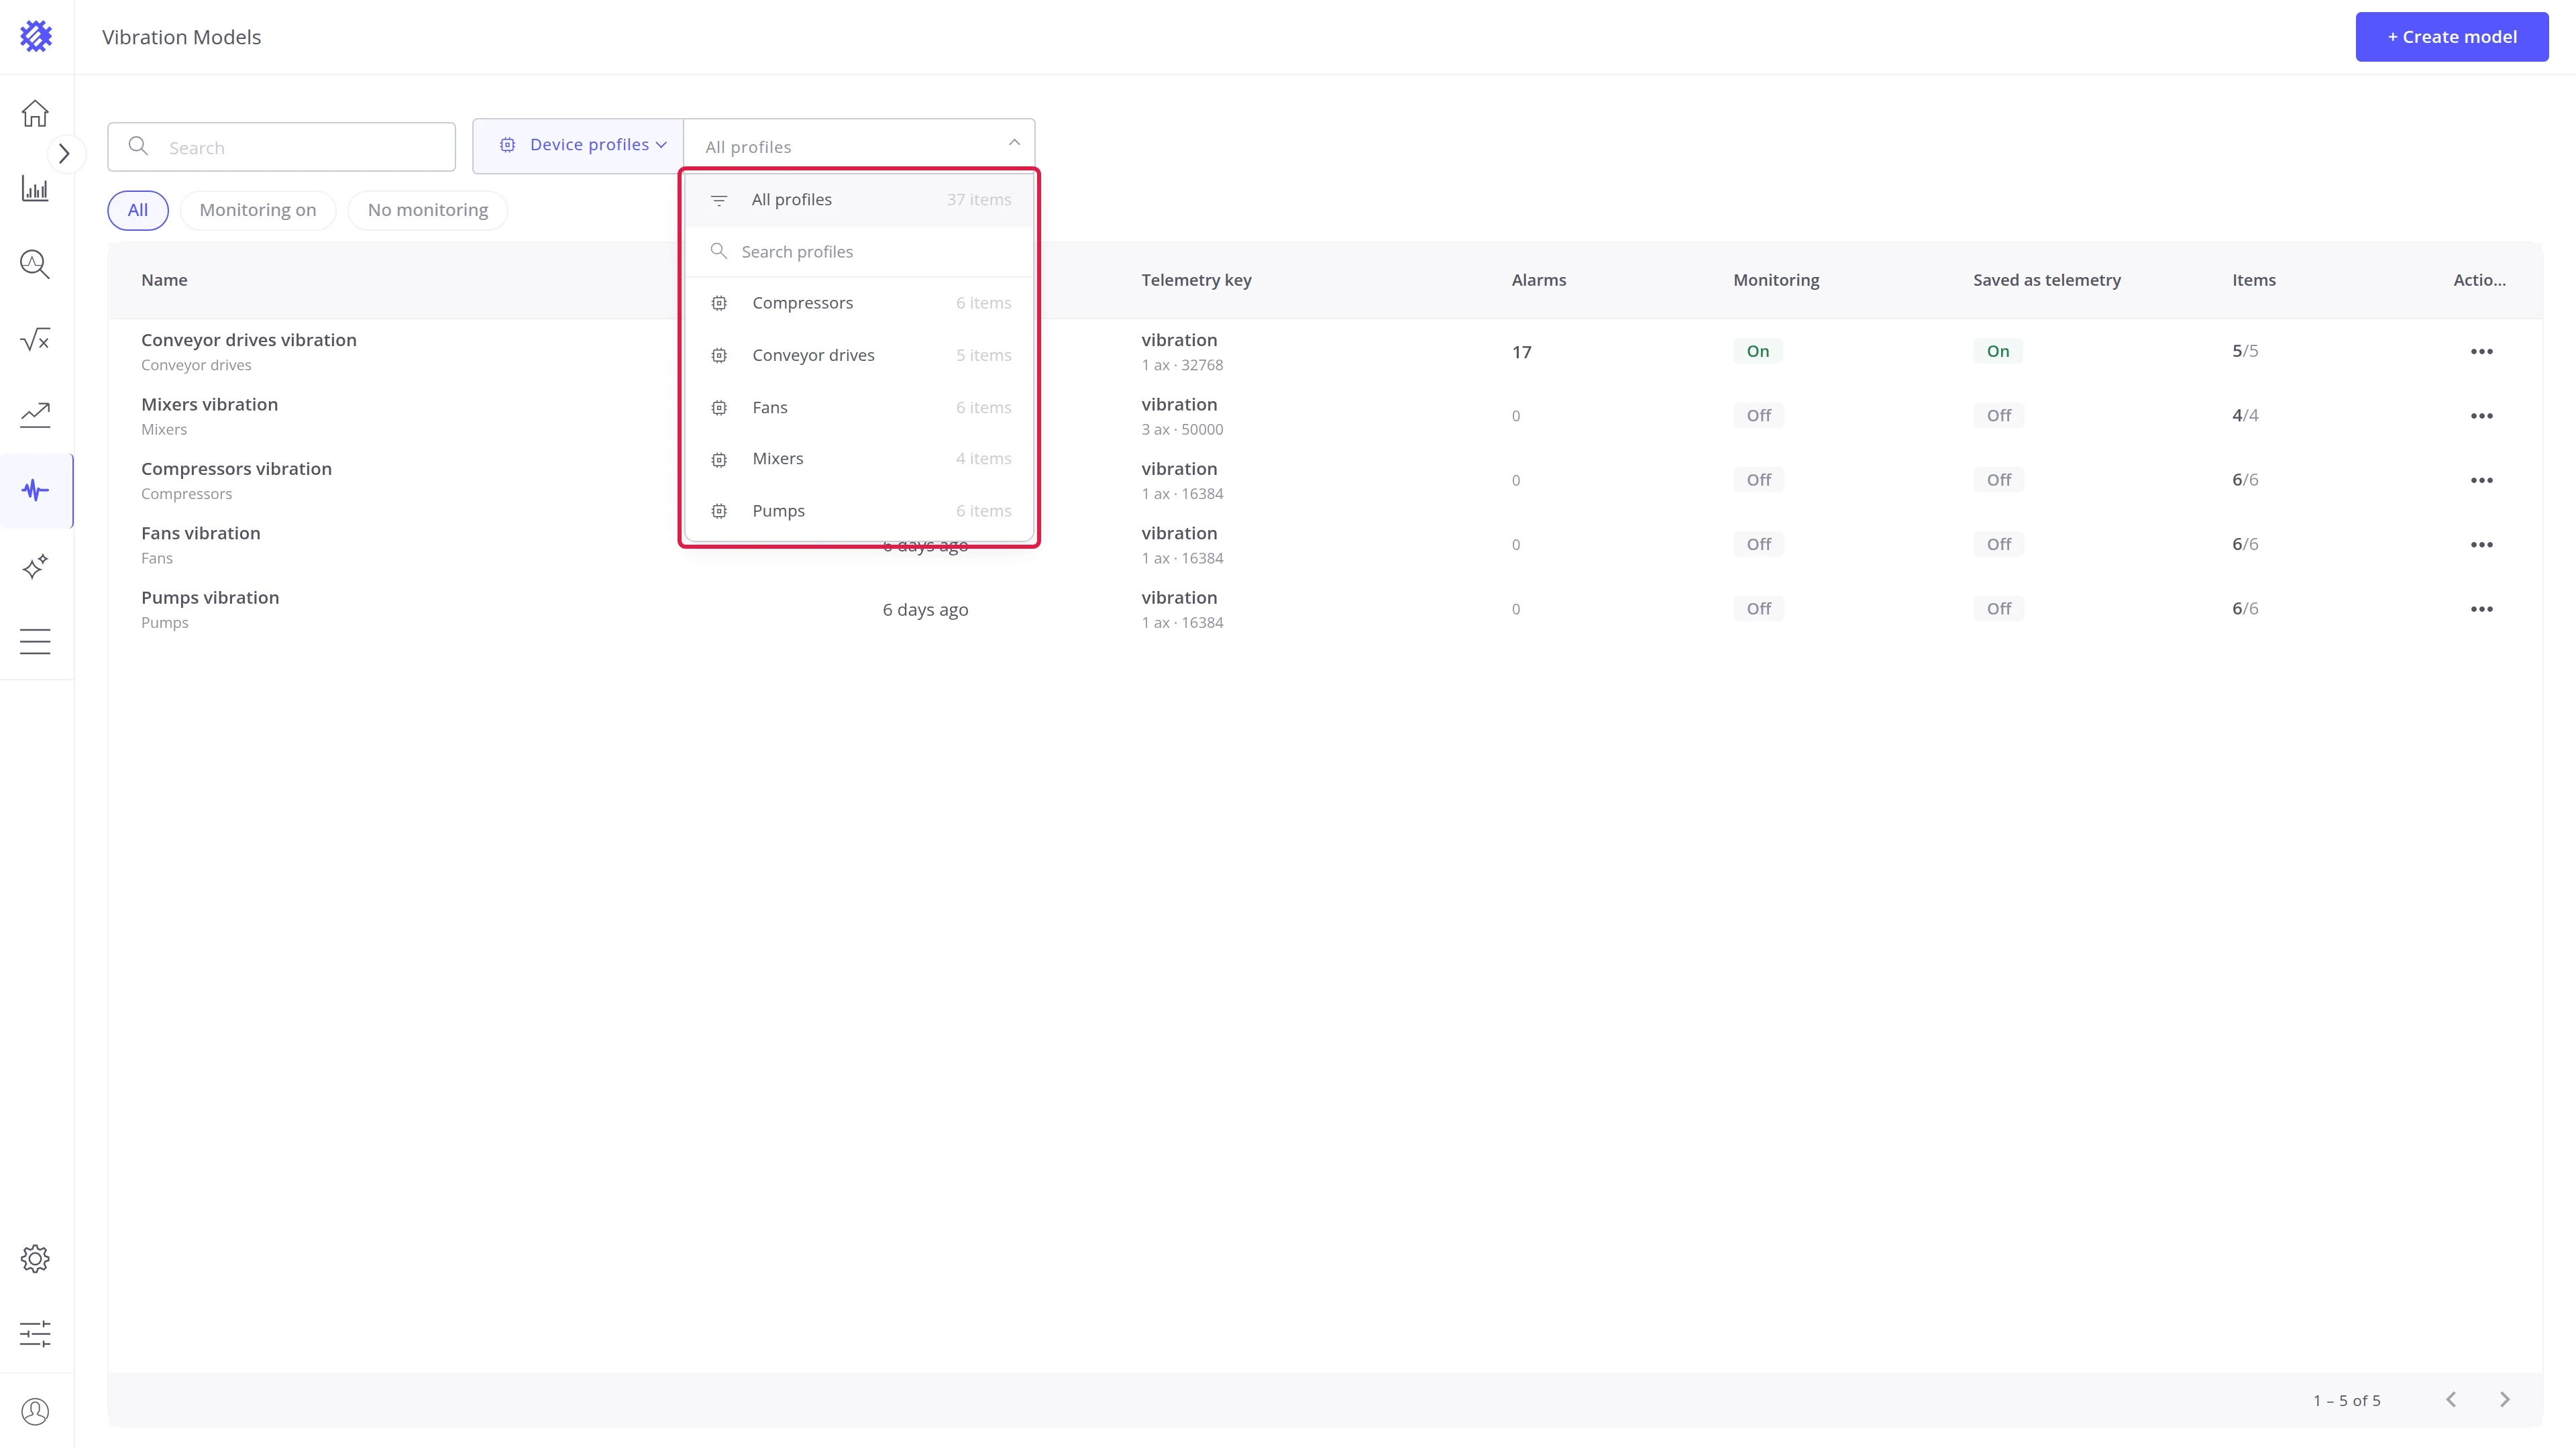
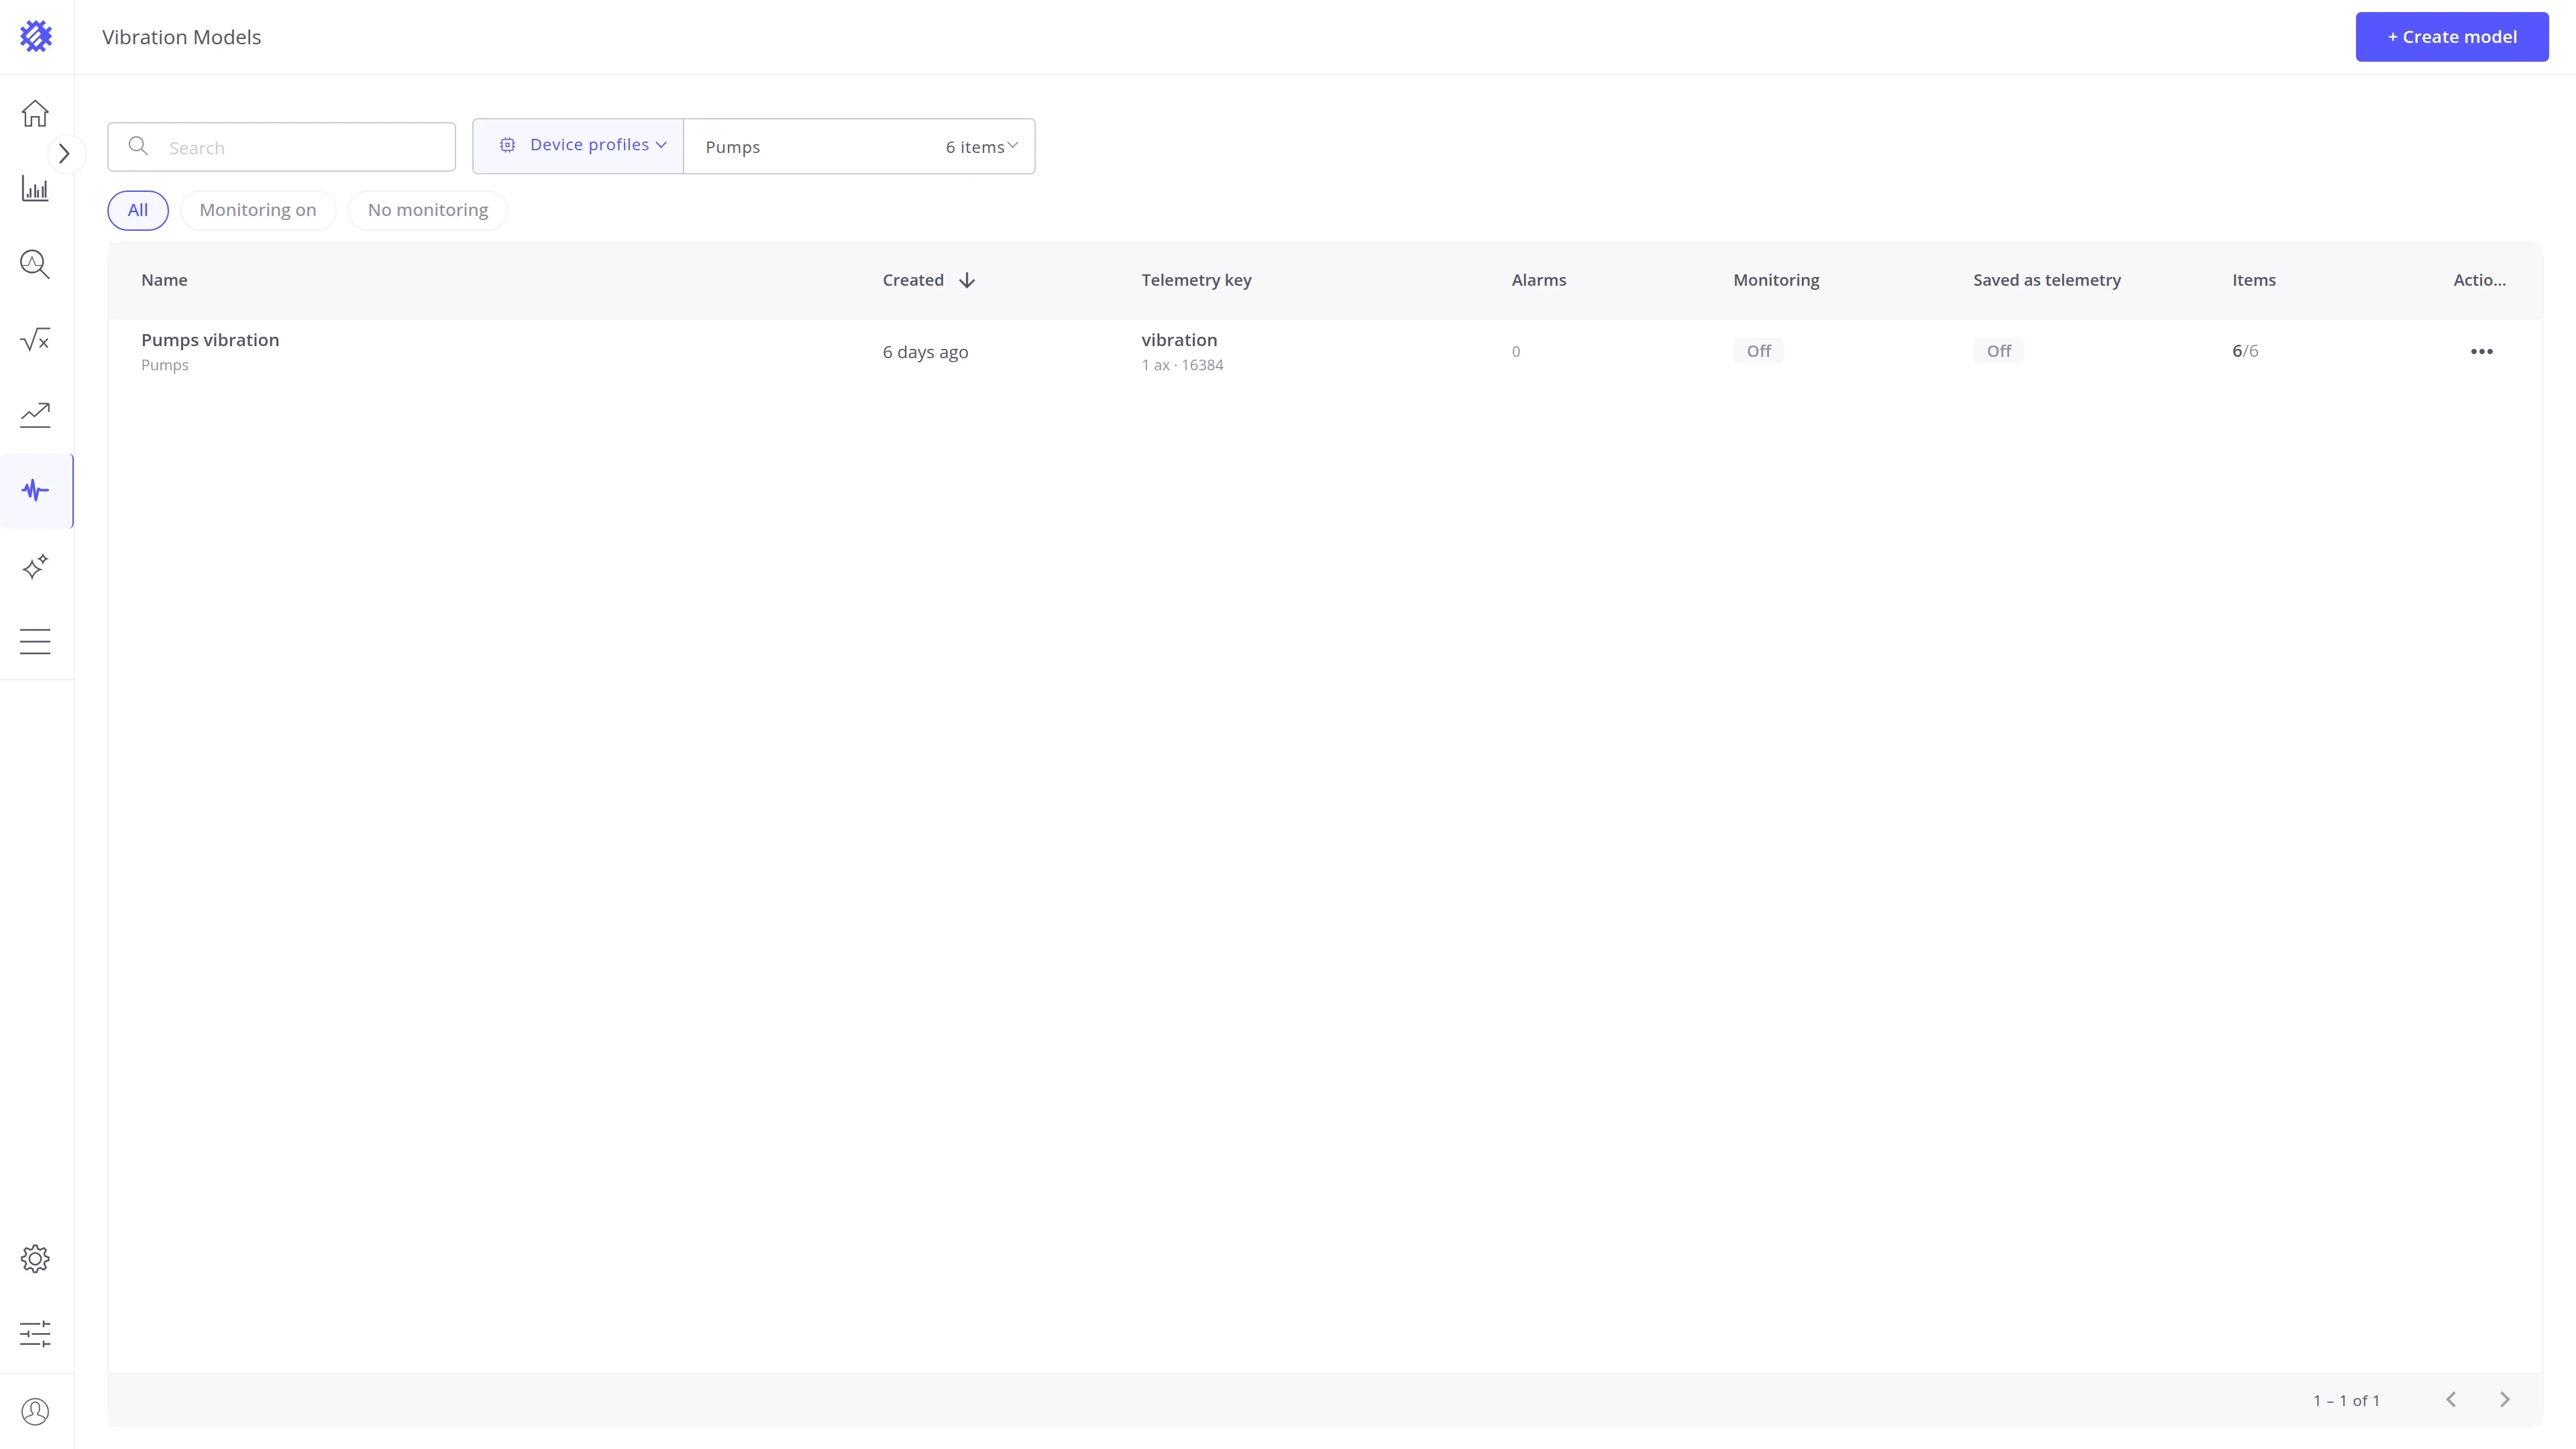
By schedule. The chips under the toolbar narrow the list to models with or without scheduled scanning:
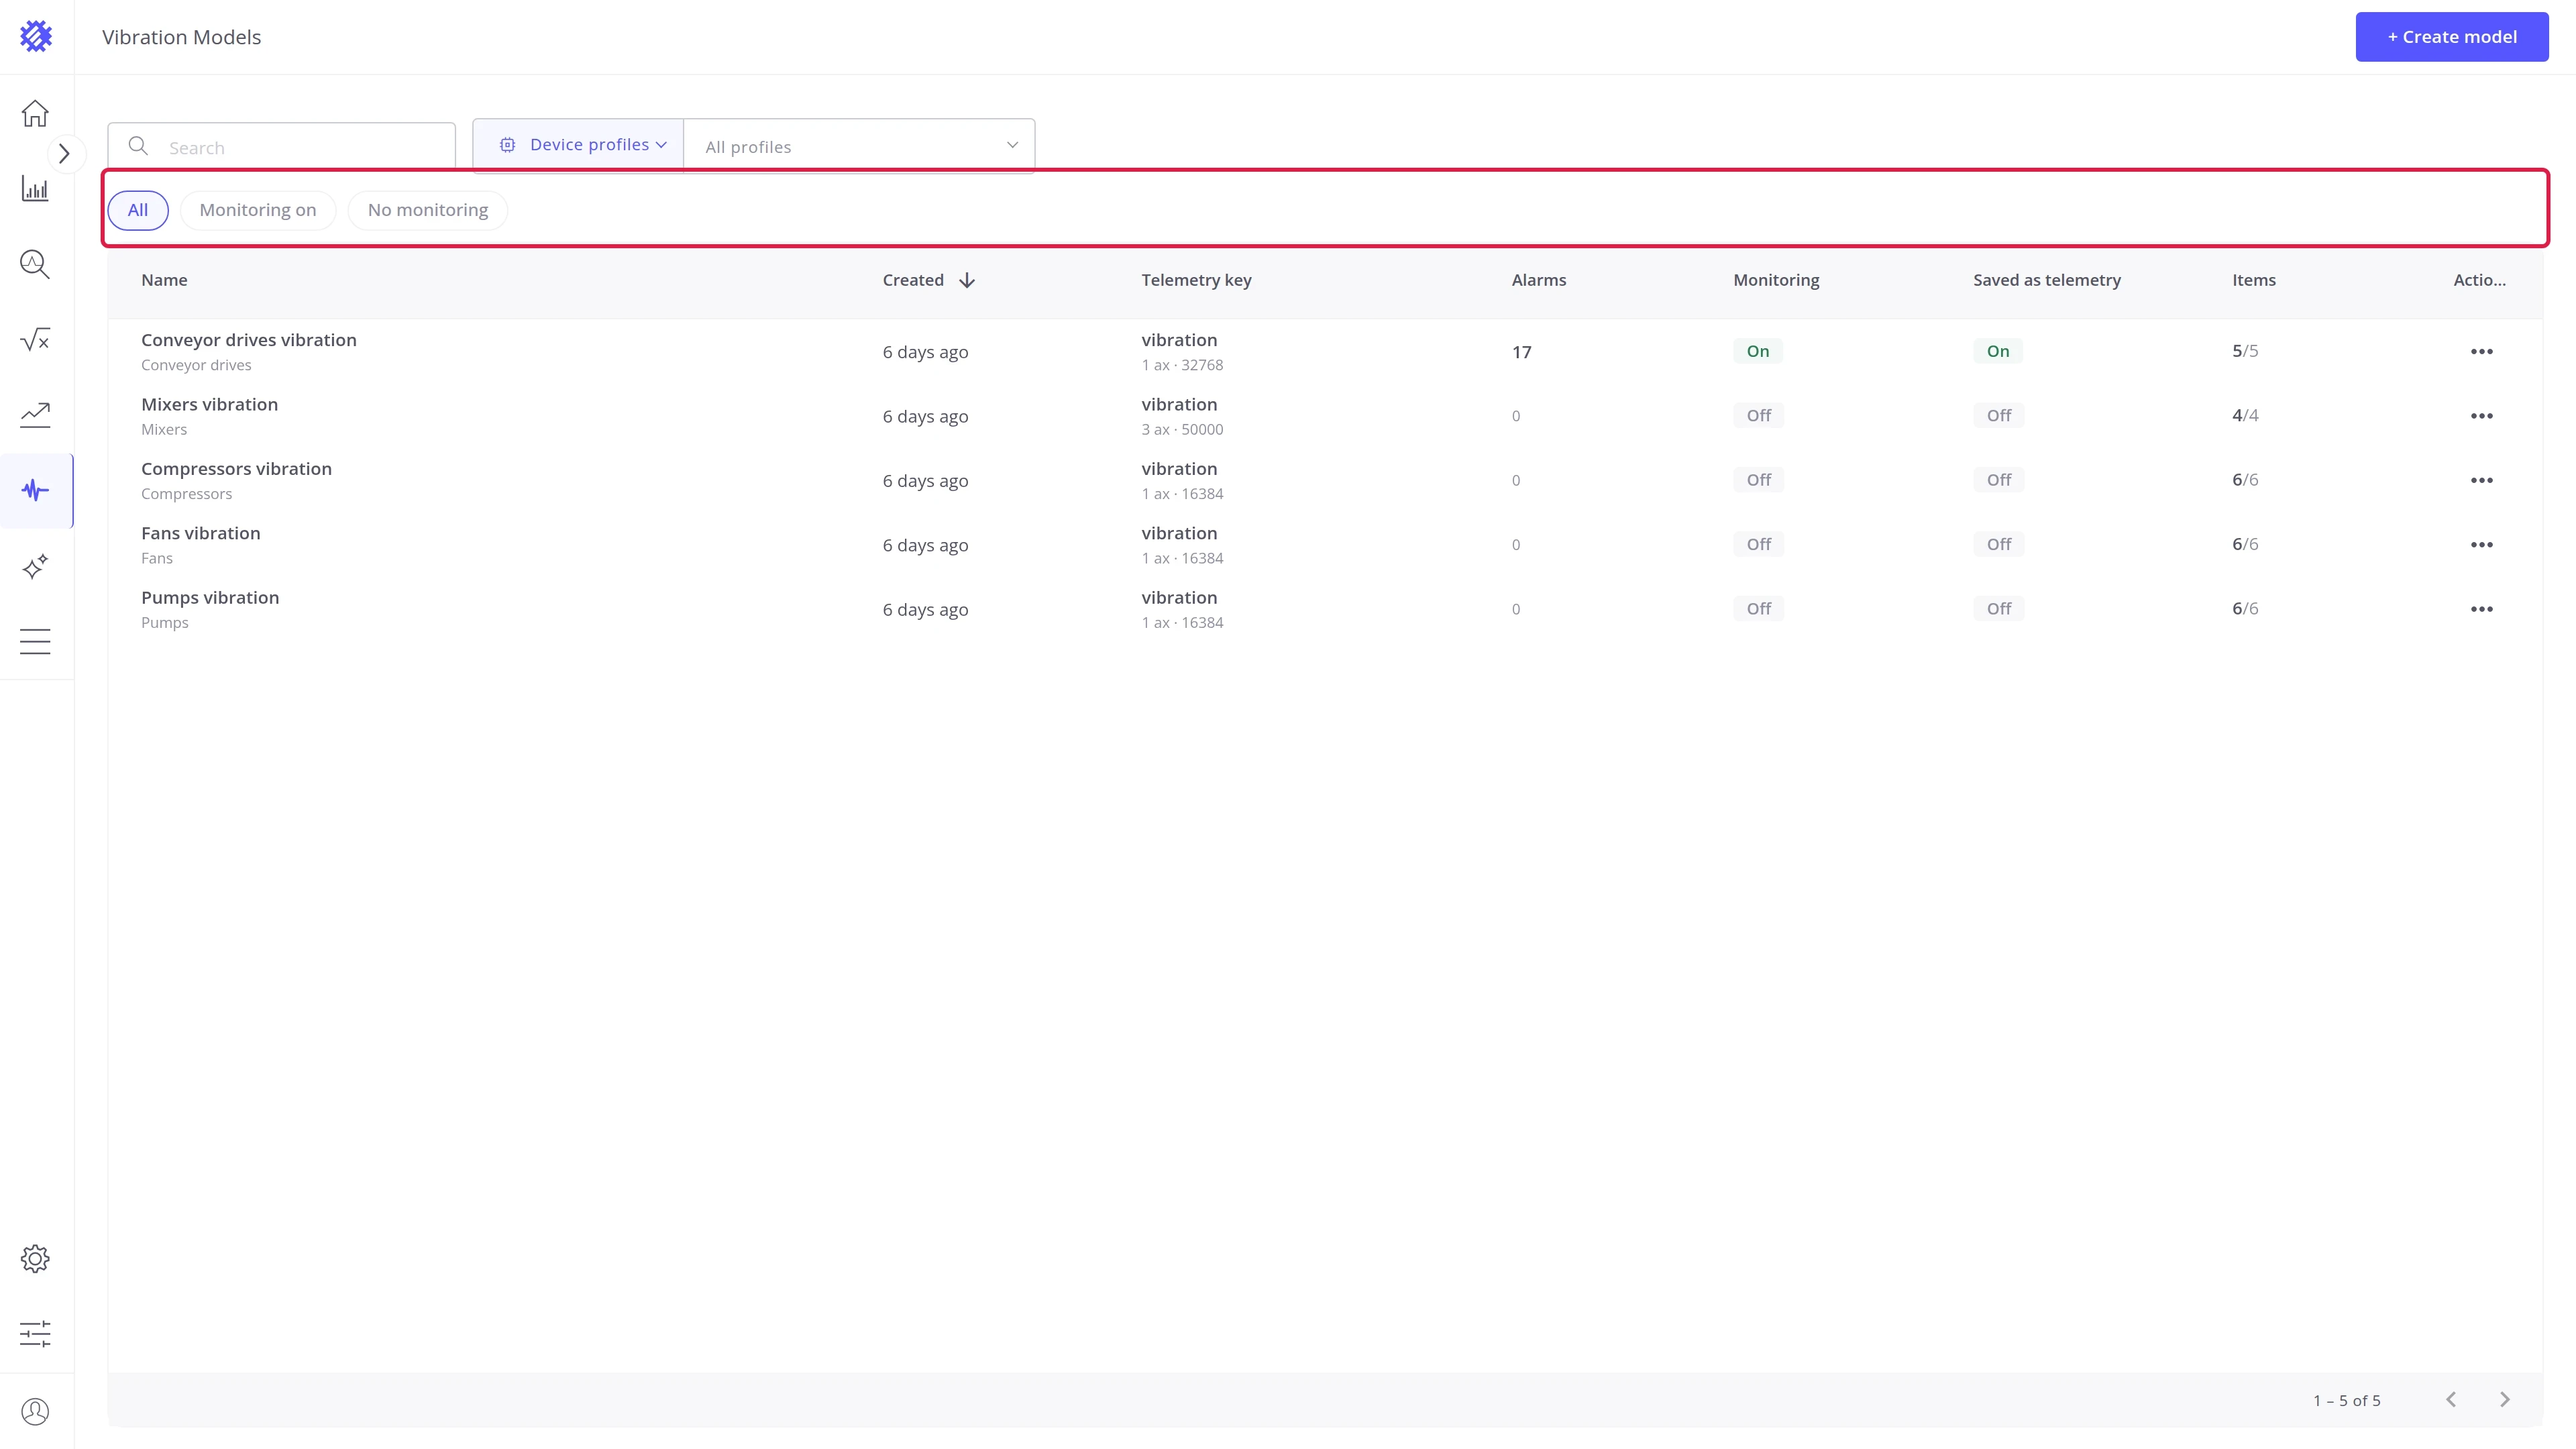
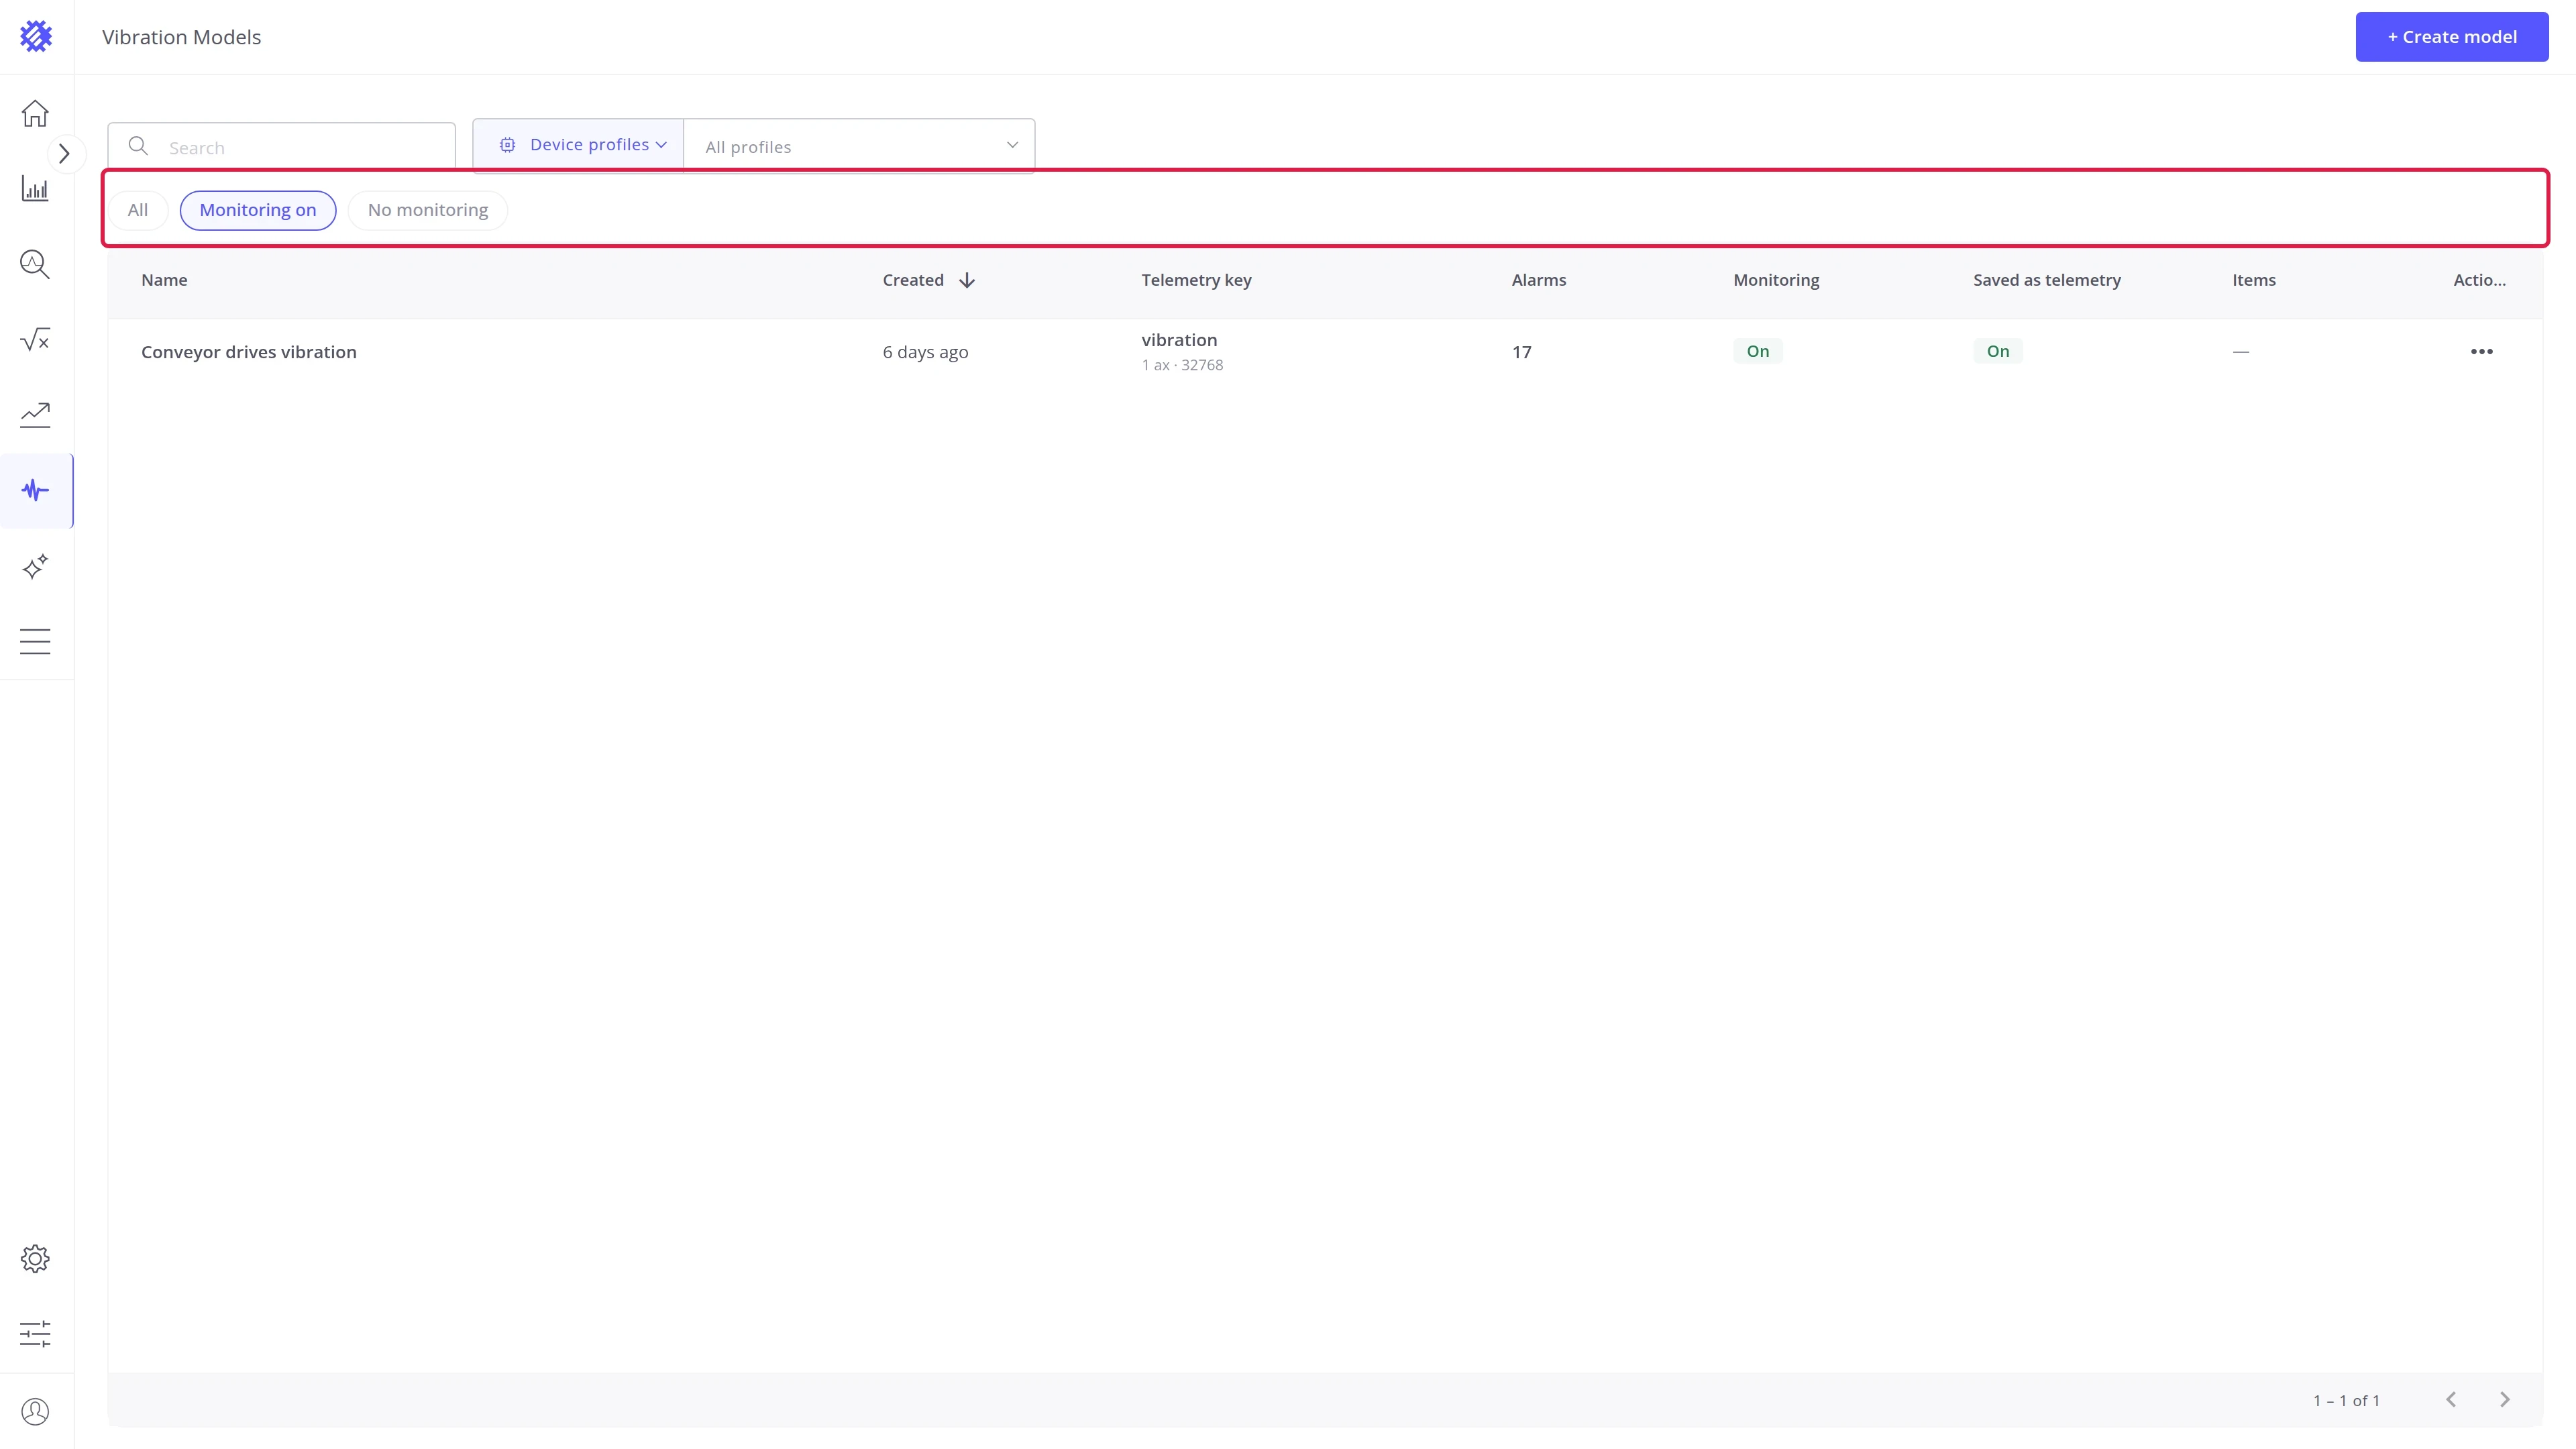
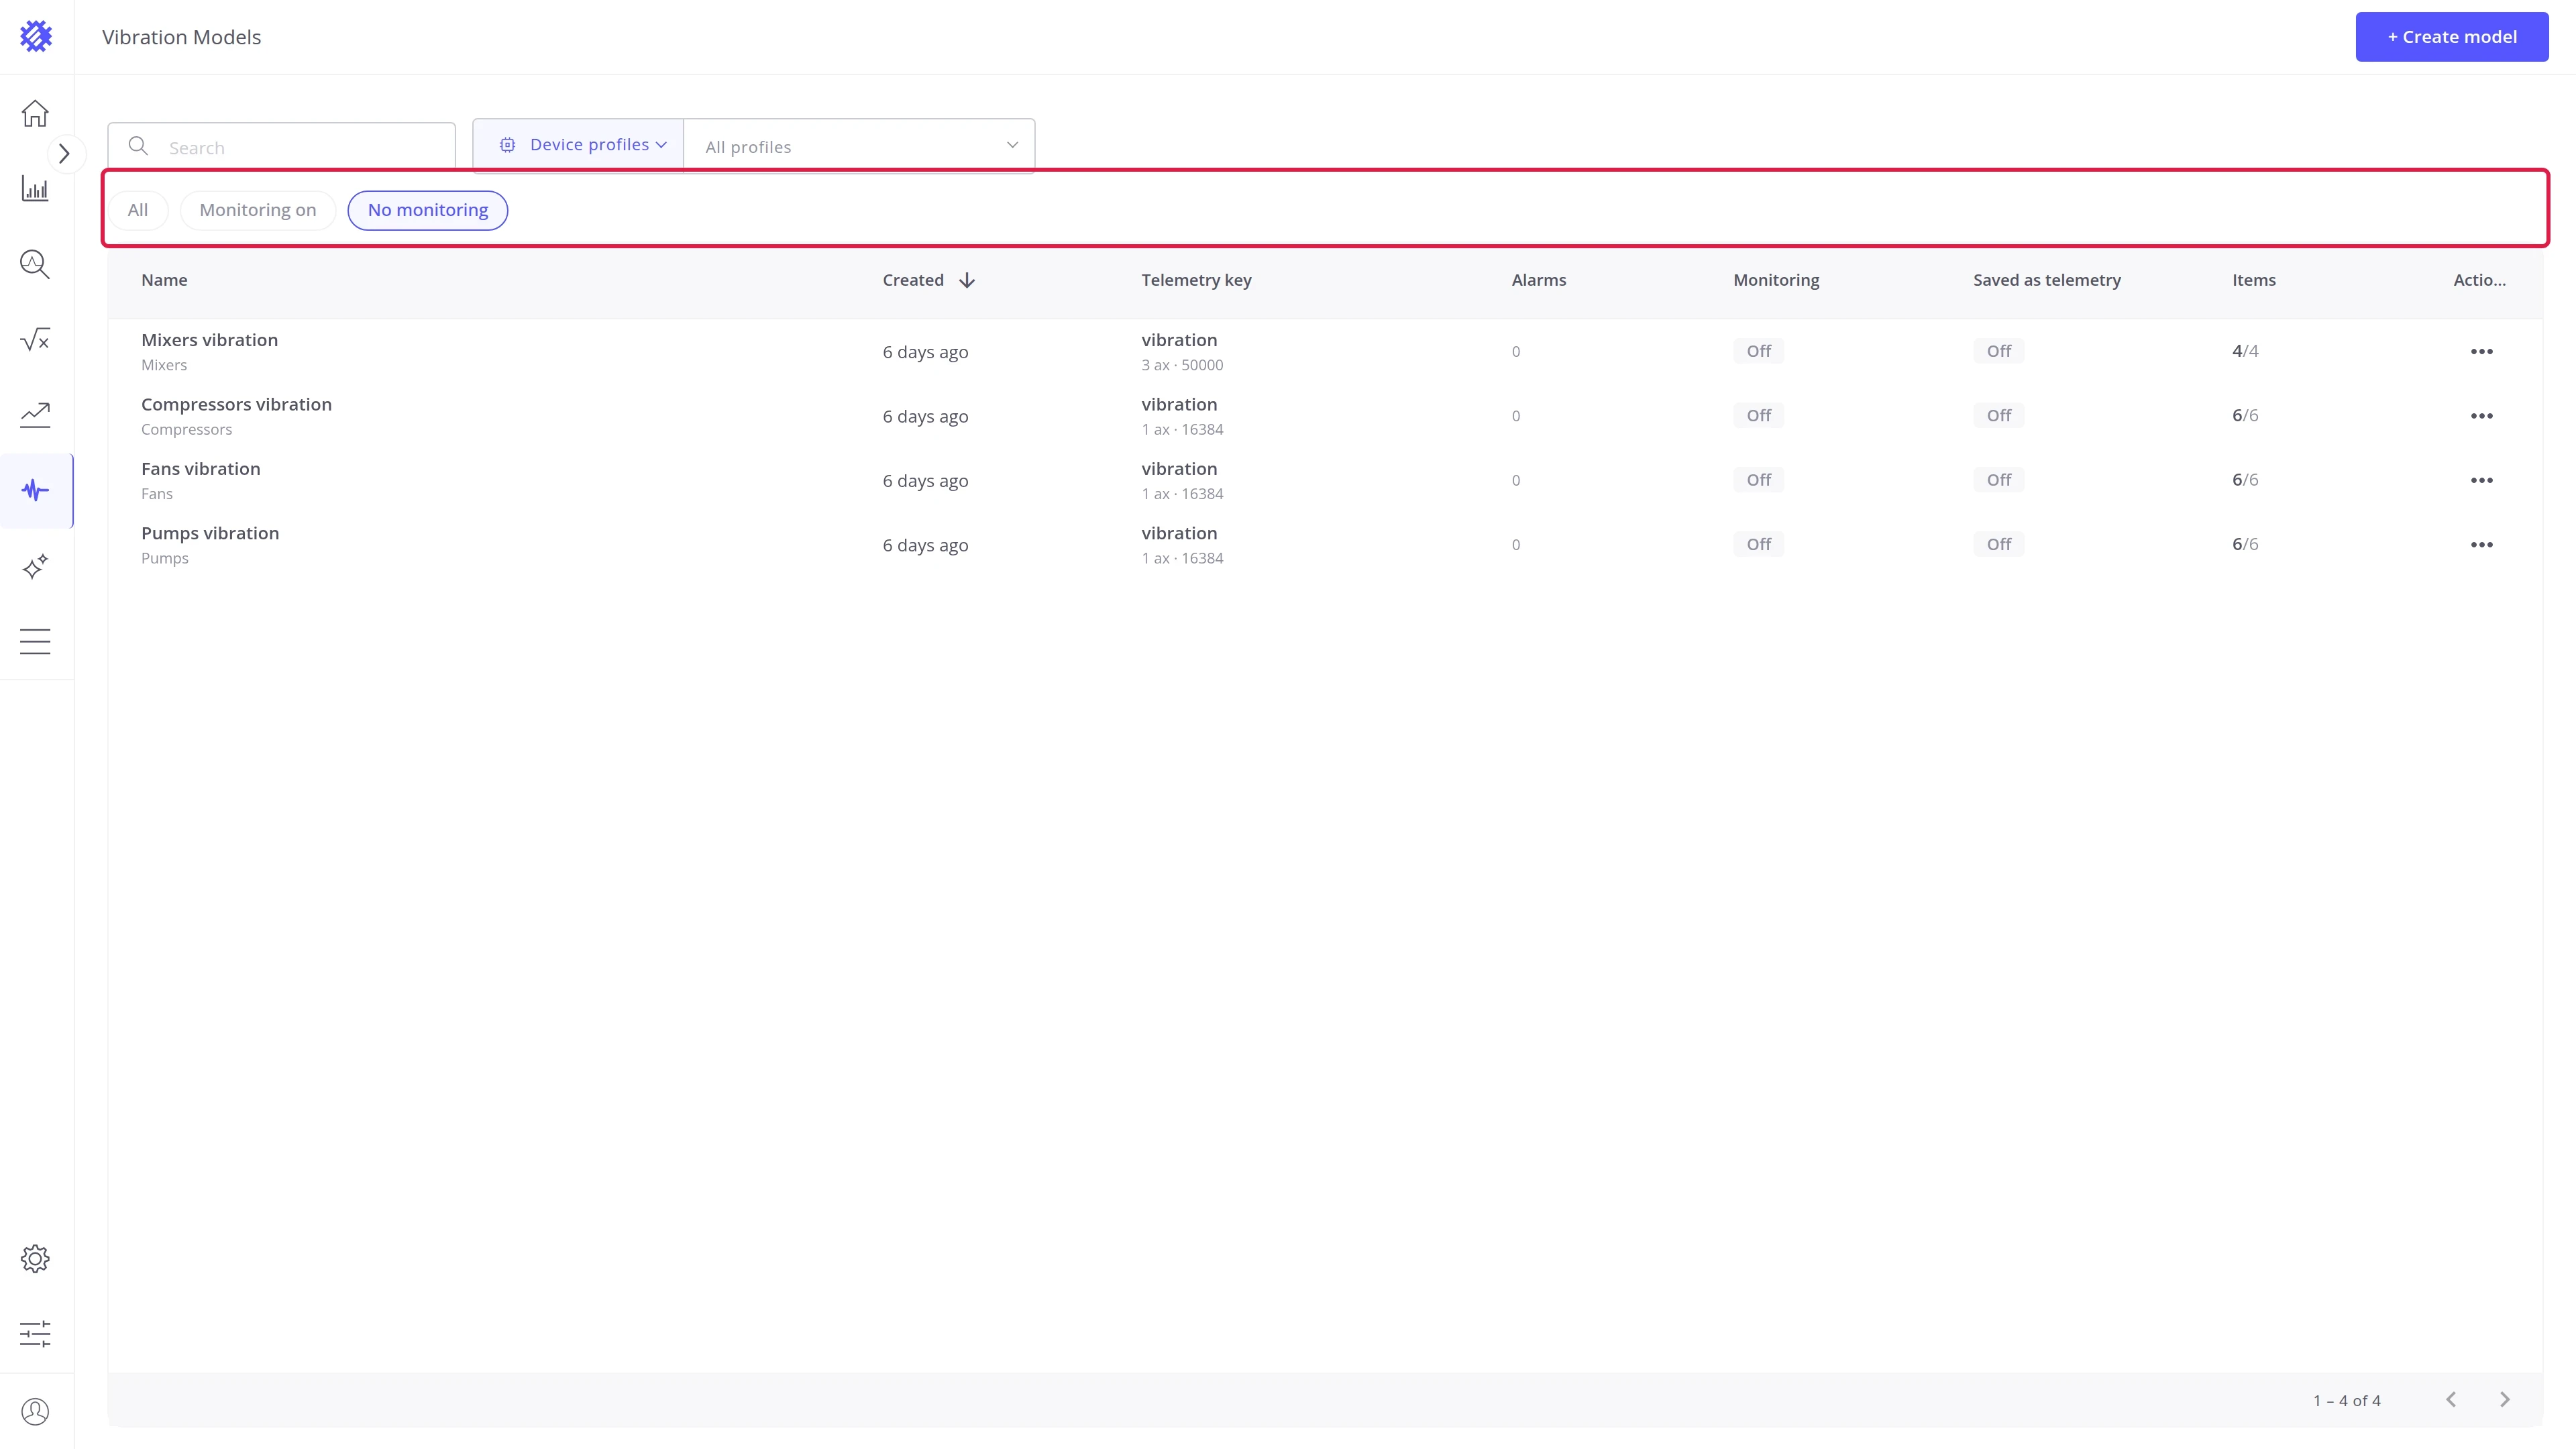
| Chip | Shows |
|---|---|
| All | Every model |
| Monitoring on | Models with scheduled scanning |
| No monitoring | Models that scan only when started by hand |
Search matches the model name as you type, and combines with both filters.
Model detail panel
Section titled “Model detail panel”Click any model row to describe it beside the table, without opening it:
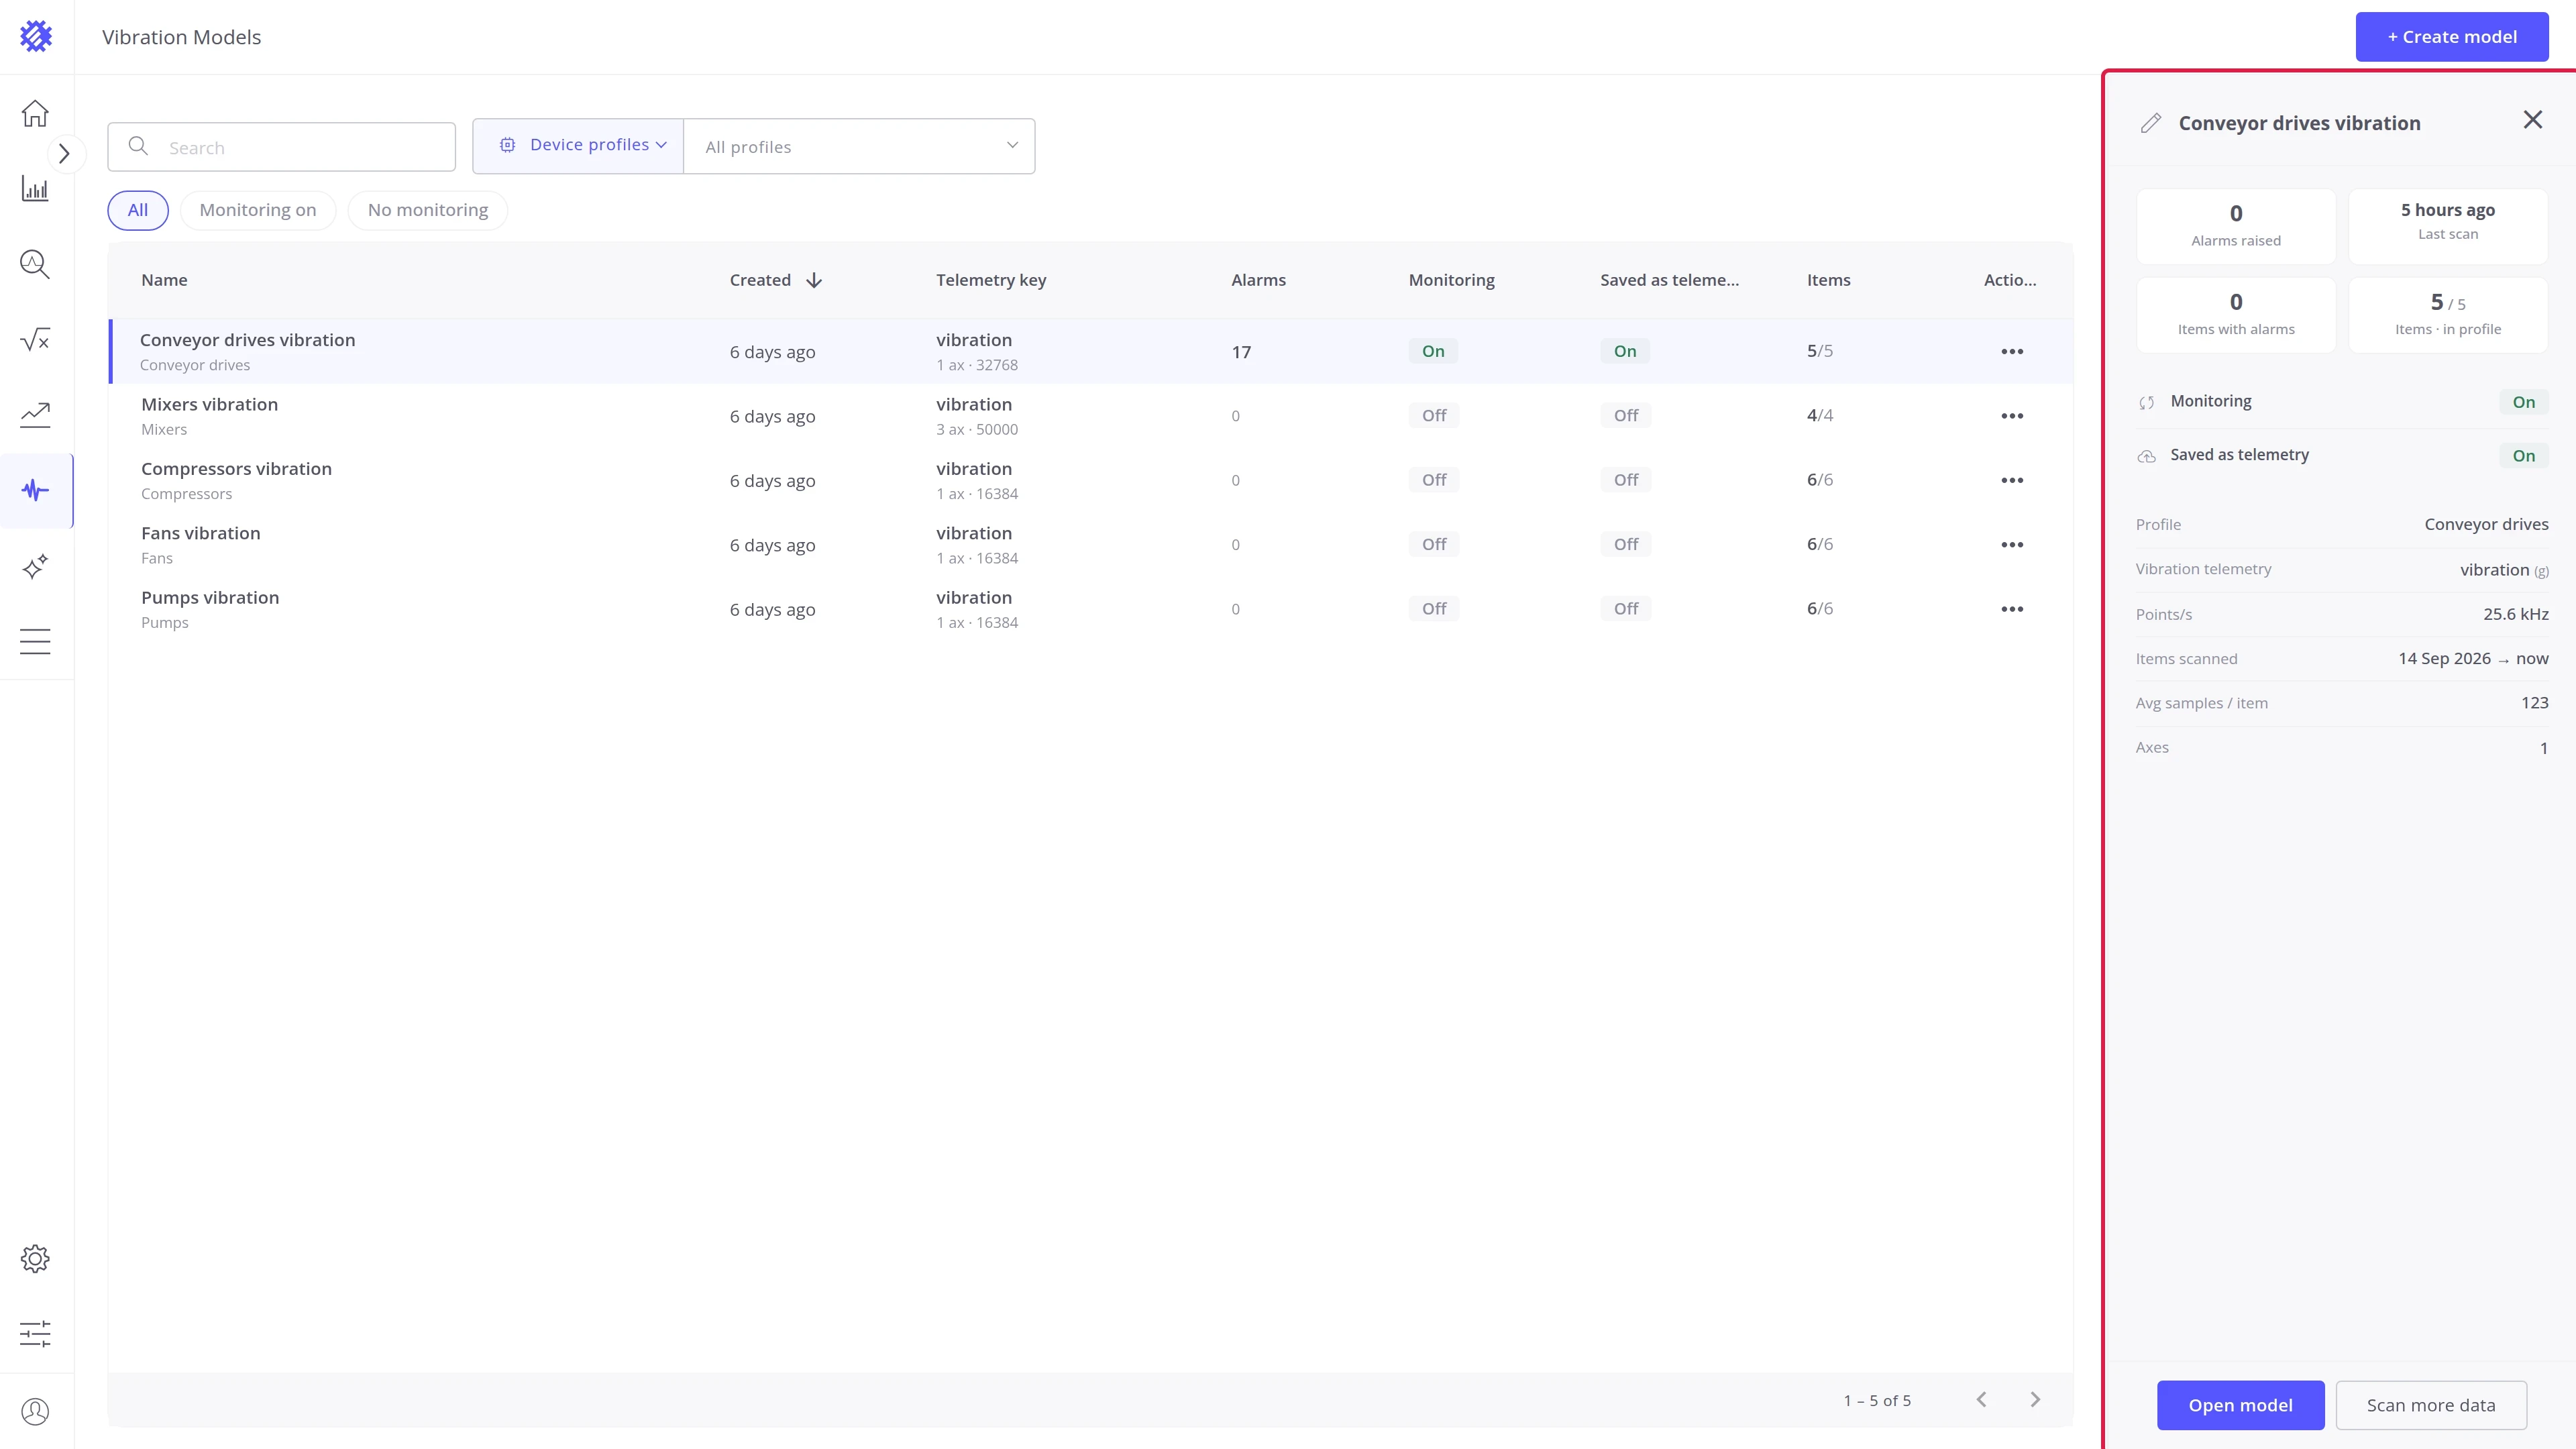
| Field | Description |
|---|---|
| Alarms raised | How many alarms the model has raised |
| Last scan | How long ago the model last scanned new samples |
| Items with alarms | How many machines have at least one alarm |
| Items | Machines the model covers, out of all machines in the profile, for example 5 / 5 |
| Monitoring | On when the model scans new samples on a schedule, Off when it scans only when you start a scan |
| Saved as telemetry | On when the model writes its metrics back to ThingsBoard as telemetry, Off when it does not |
| Profile | The device or asset profile the model reads |
| Vibration telemetry | The telemetry key that holds the waveform, and its unit, for example vibration (g) |
| Points/s | The sample rate of the sensor: how many points it records per second, for example 25.6 kHz is 25 600 points per second. Set on the model, or read per machine from an attribute |
| Items scanned | The period the stored results cover, from the earliest scanned sample to the latest |
| Avg samples / item | How many samples the model has stored per machine, on average |
| Axes | How many axes each sample holds, for example 1 for a single-axis sensor |
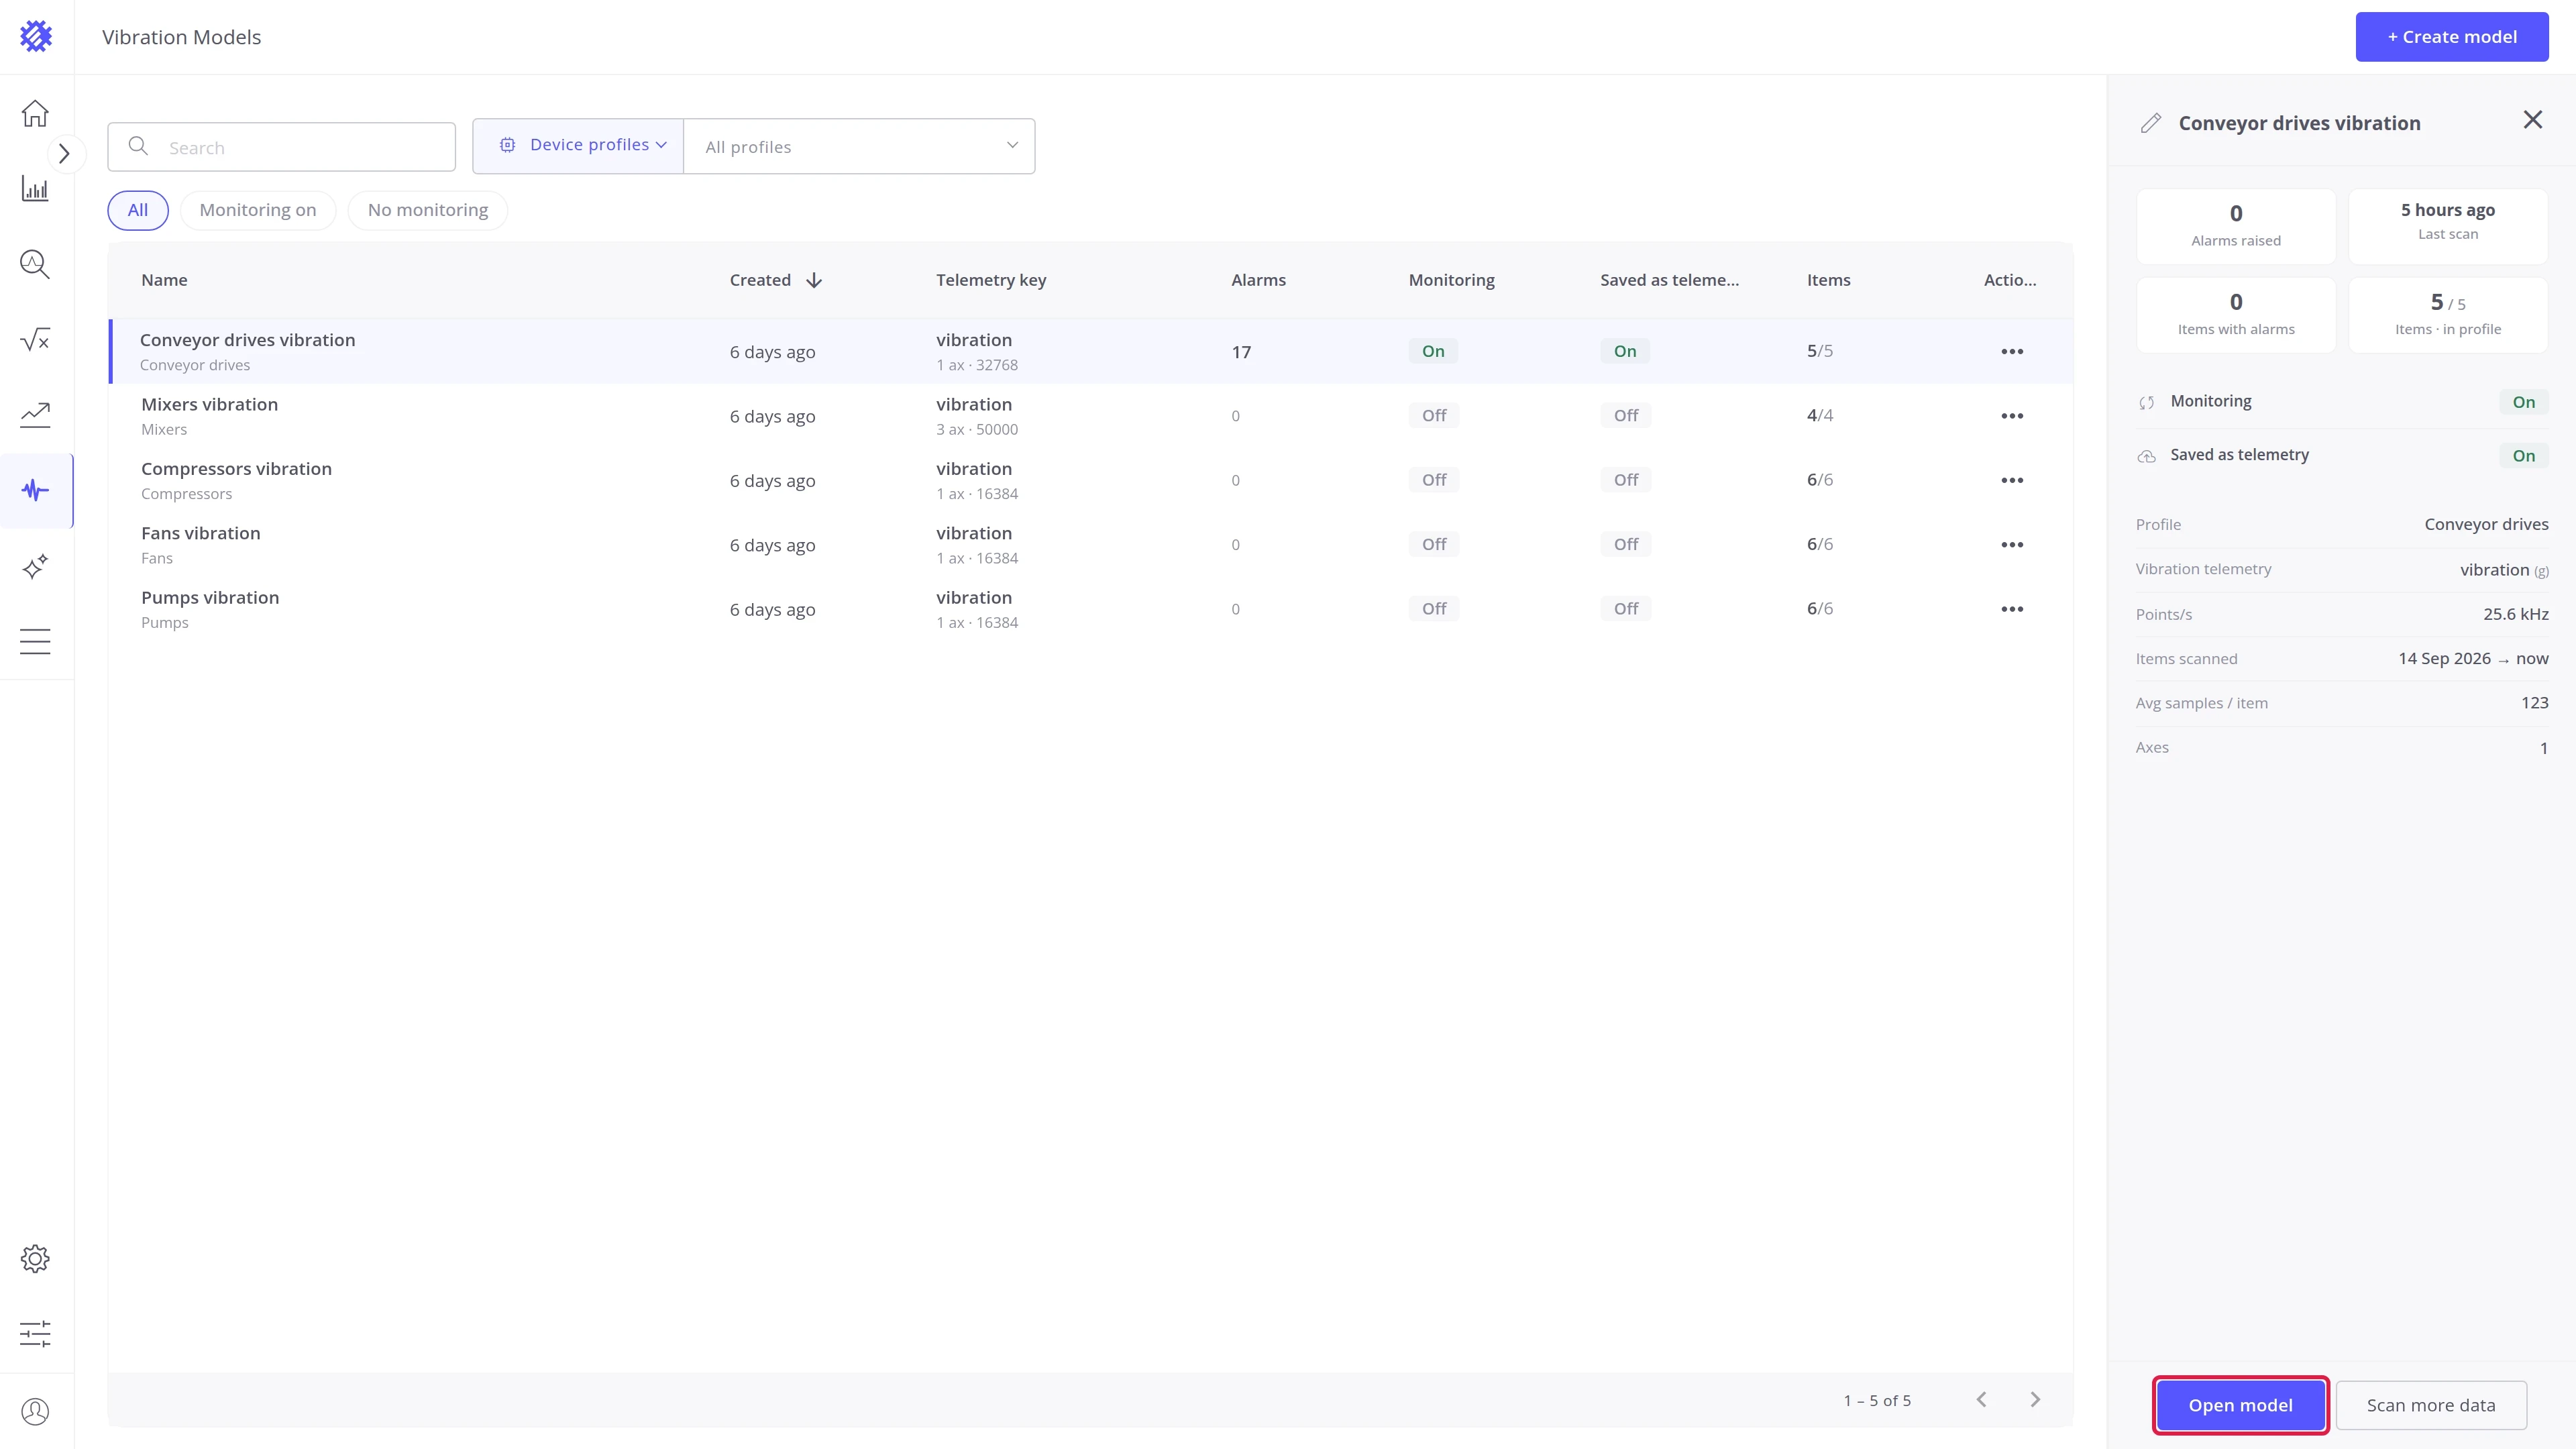
The panel has two actions.
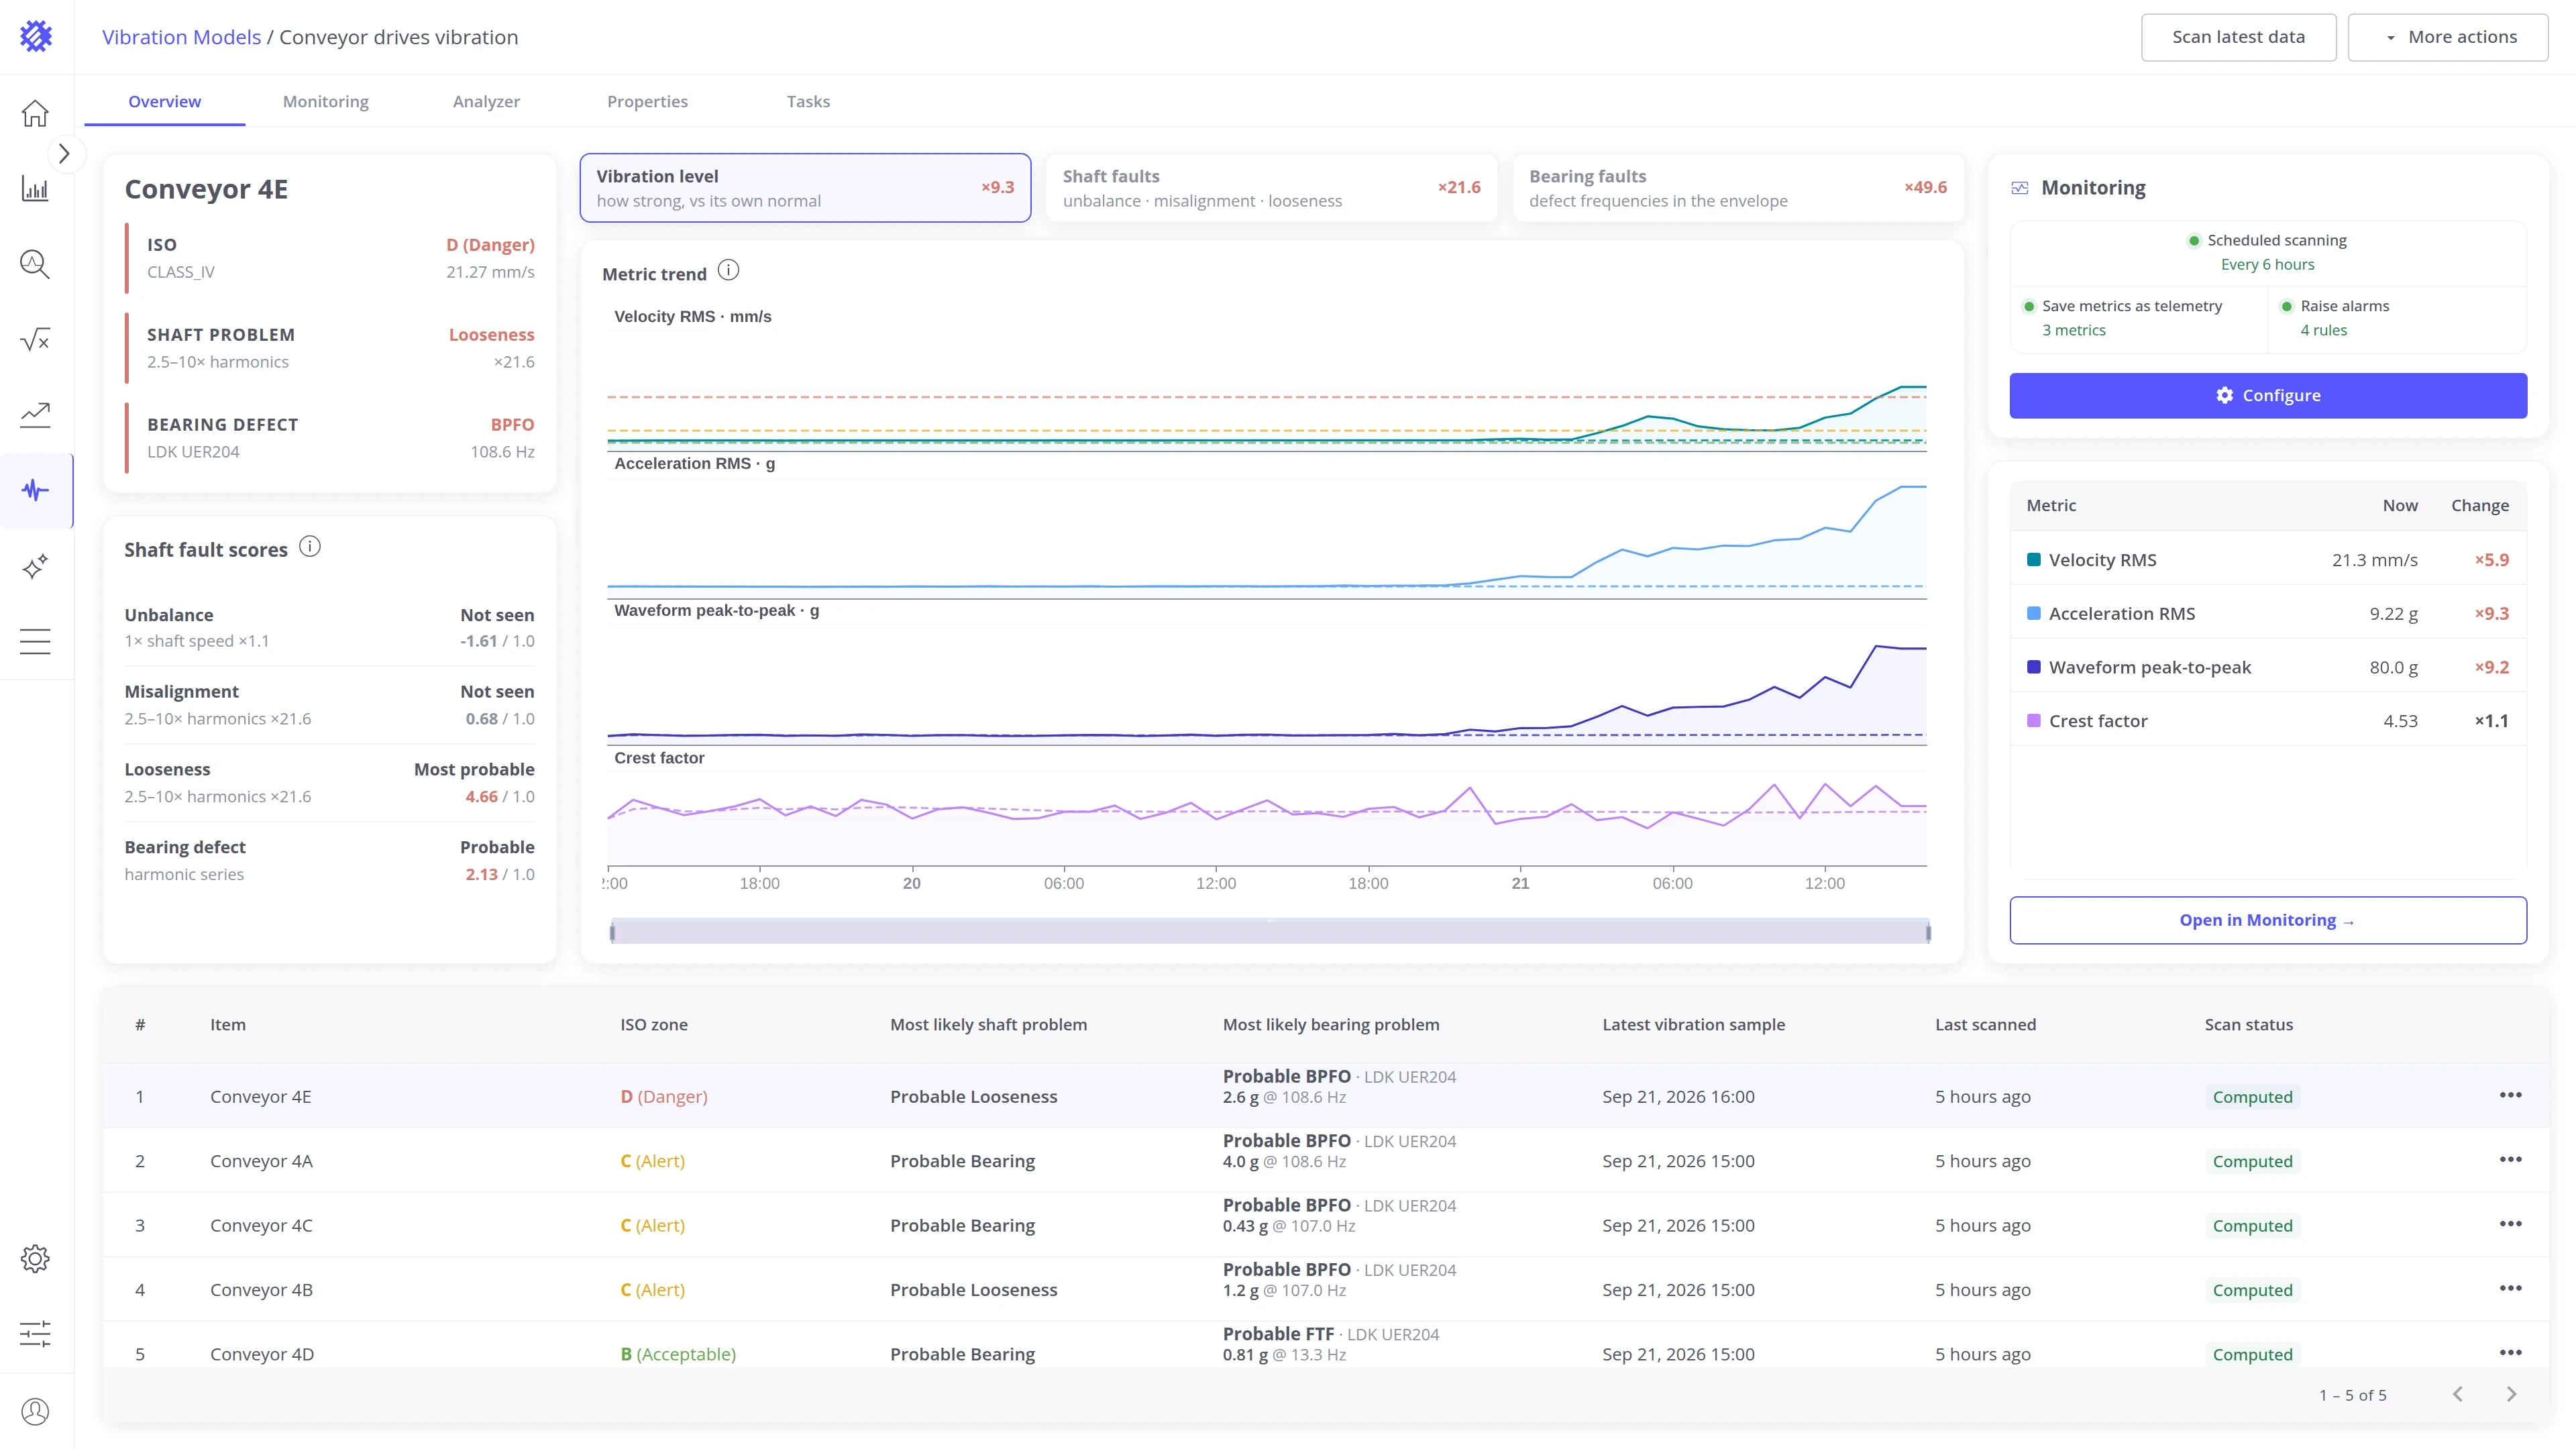
Open model opens the model page on its Overview tab.
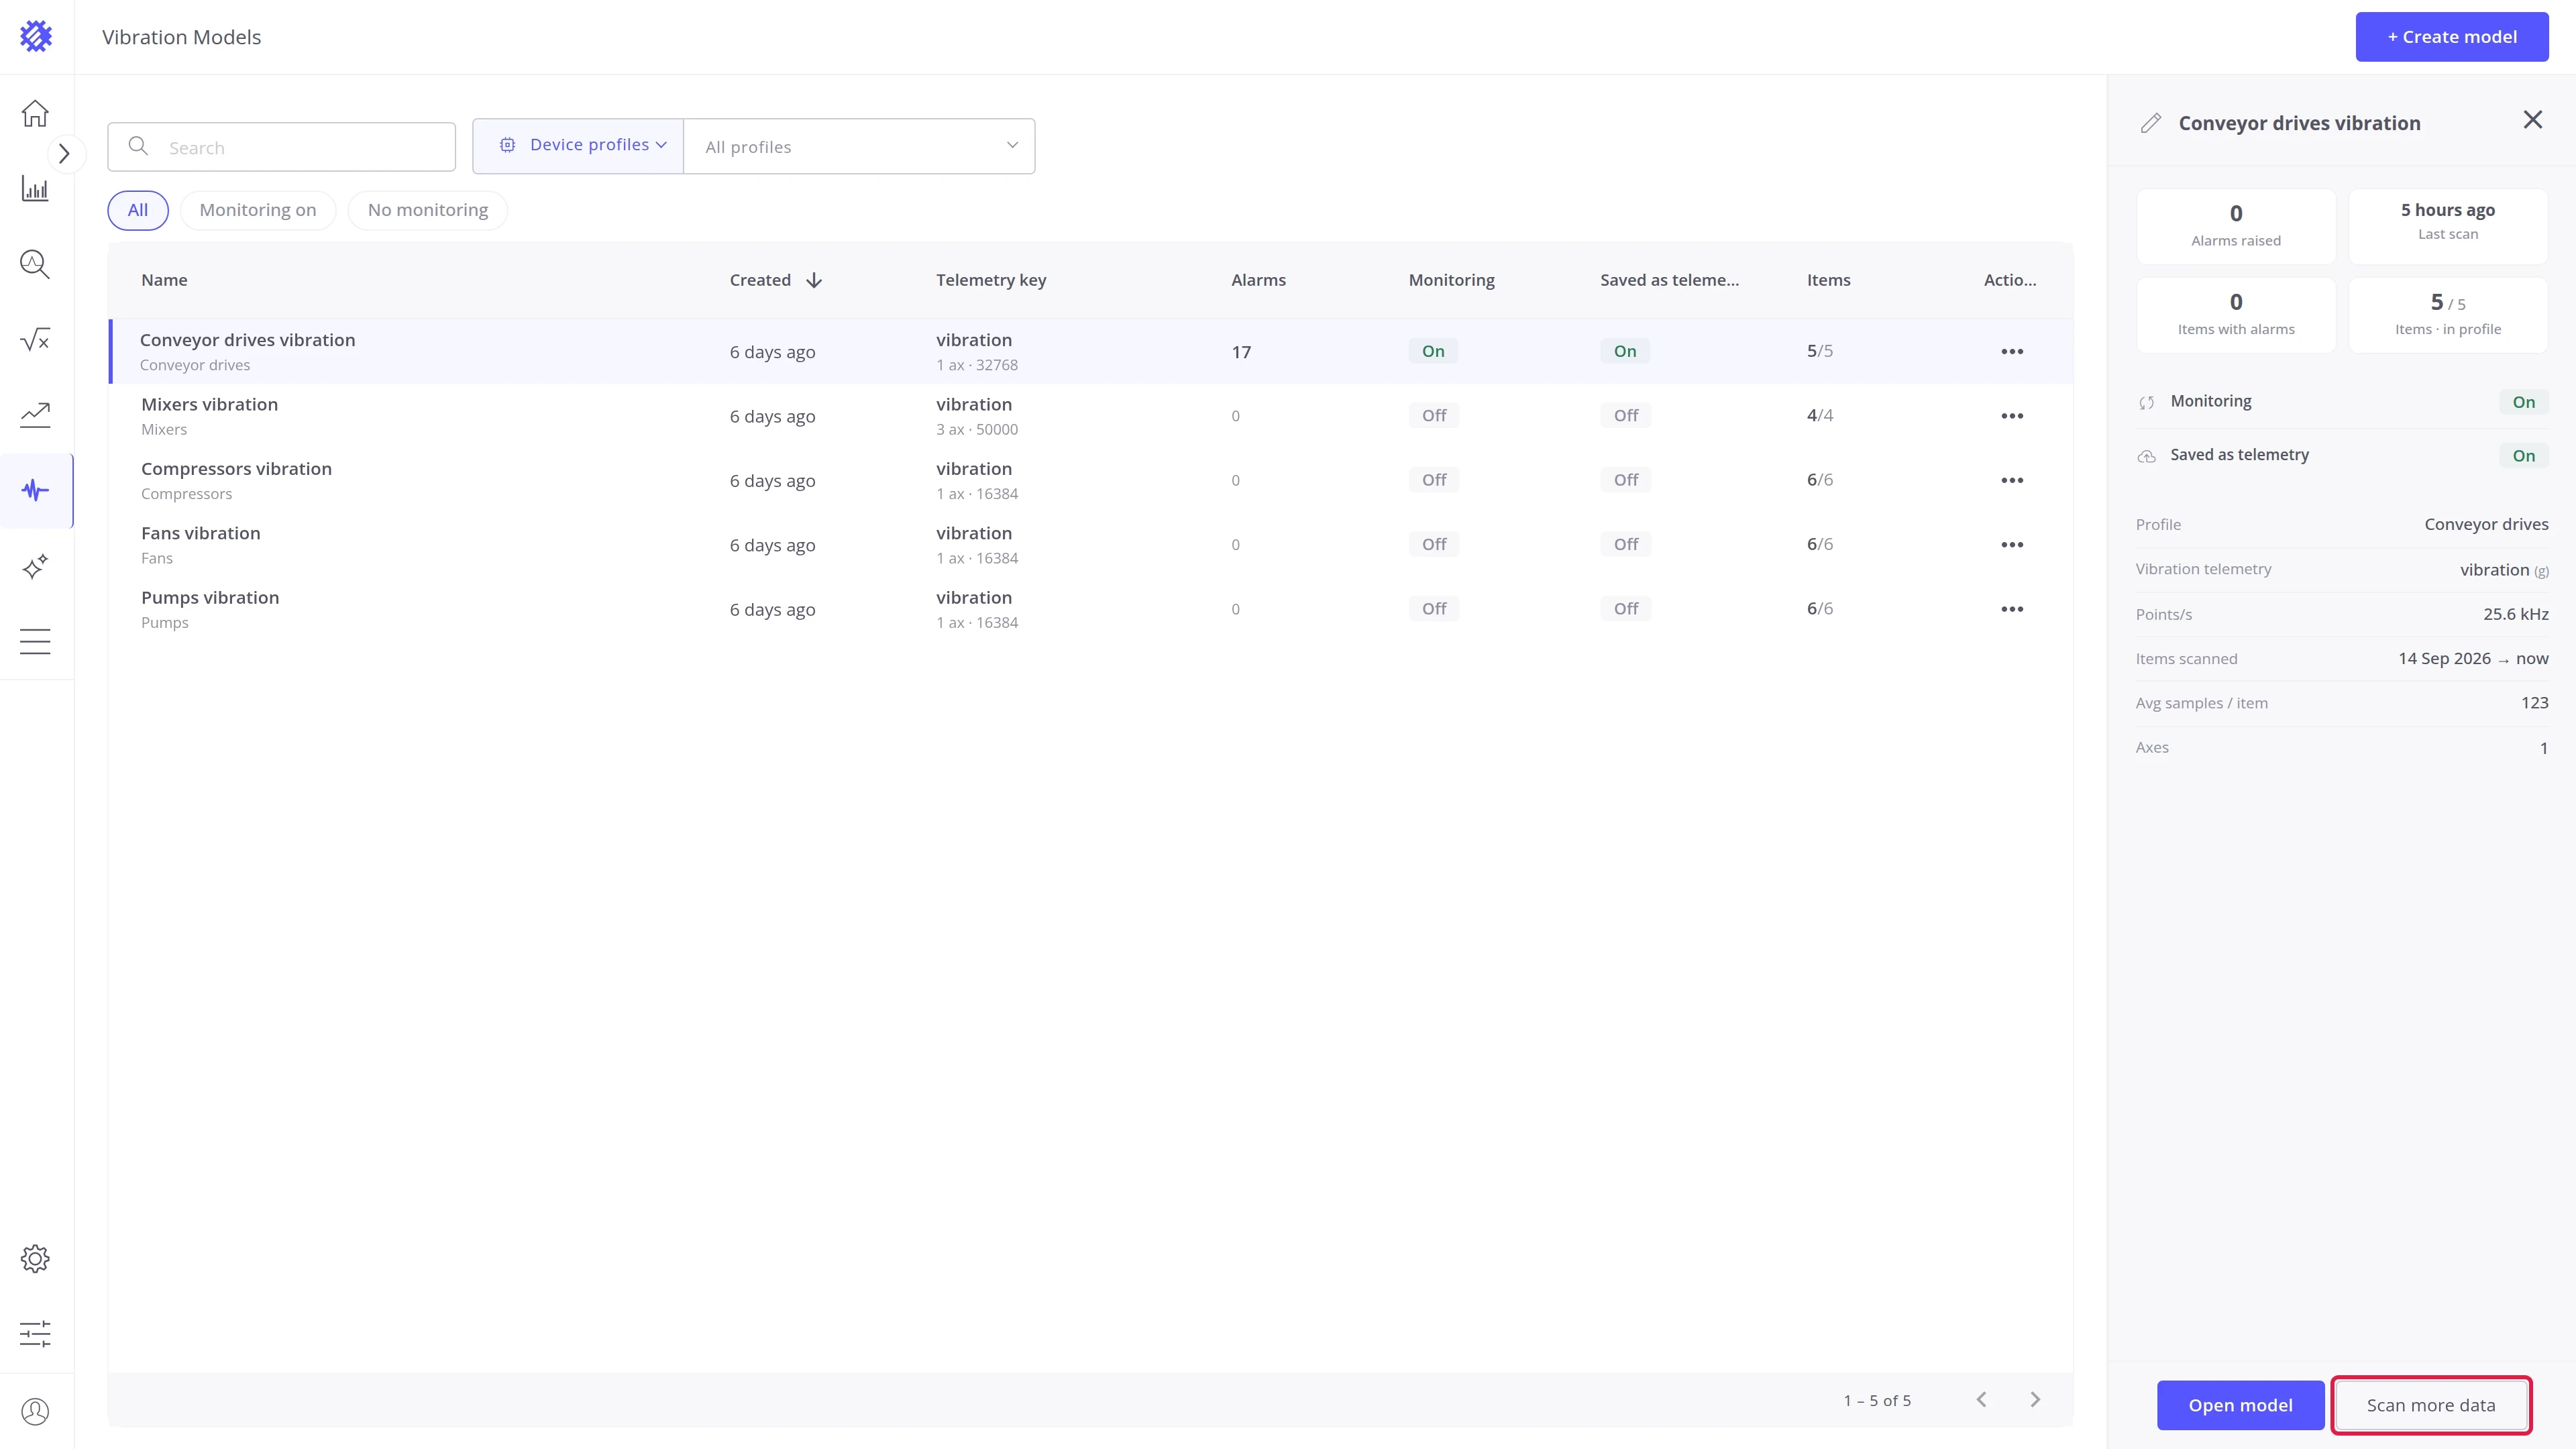
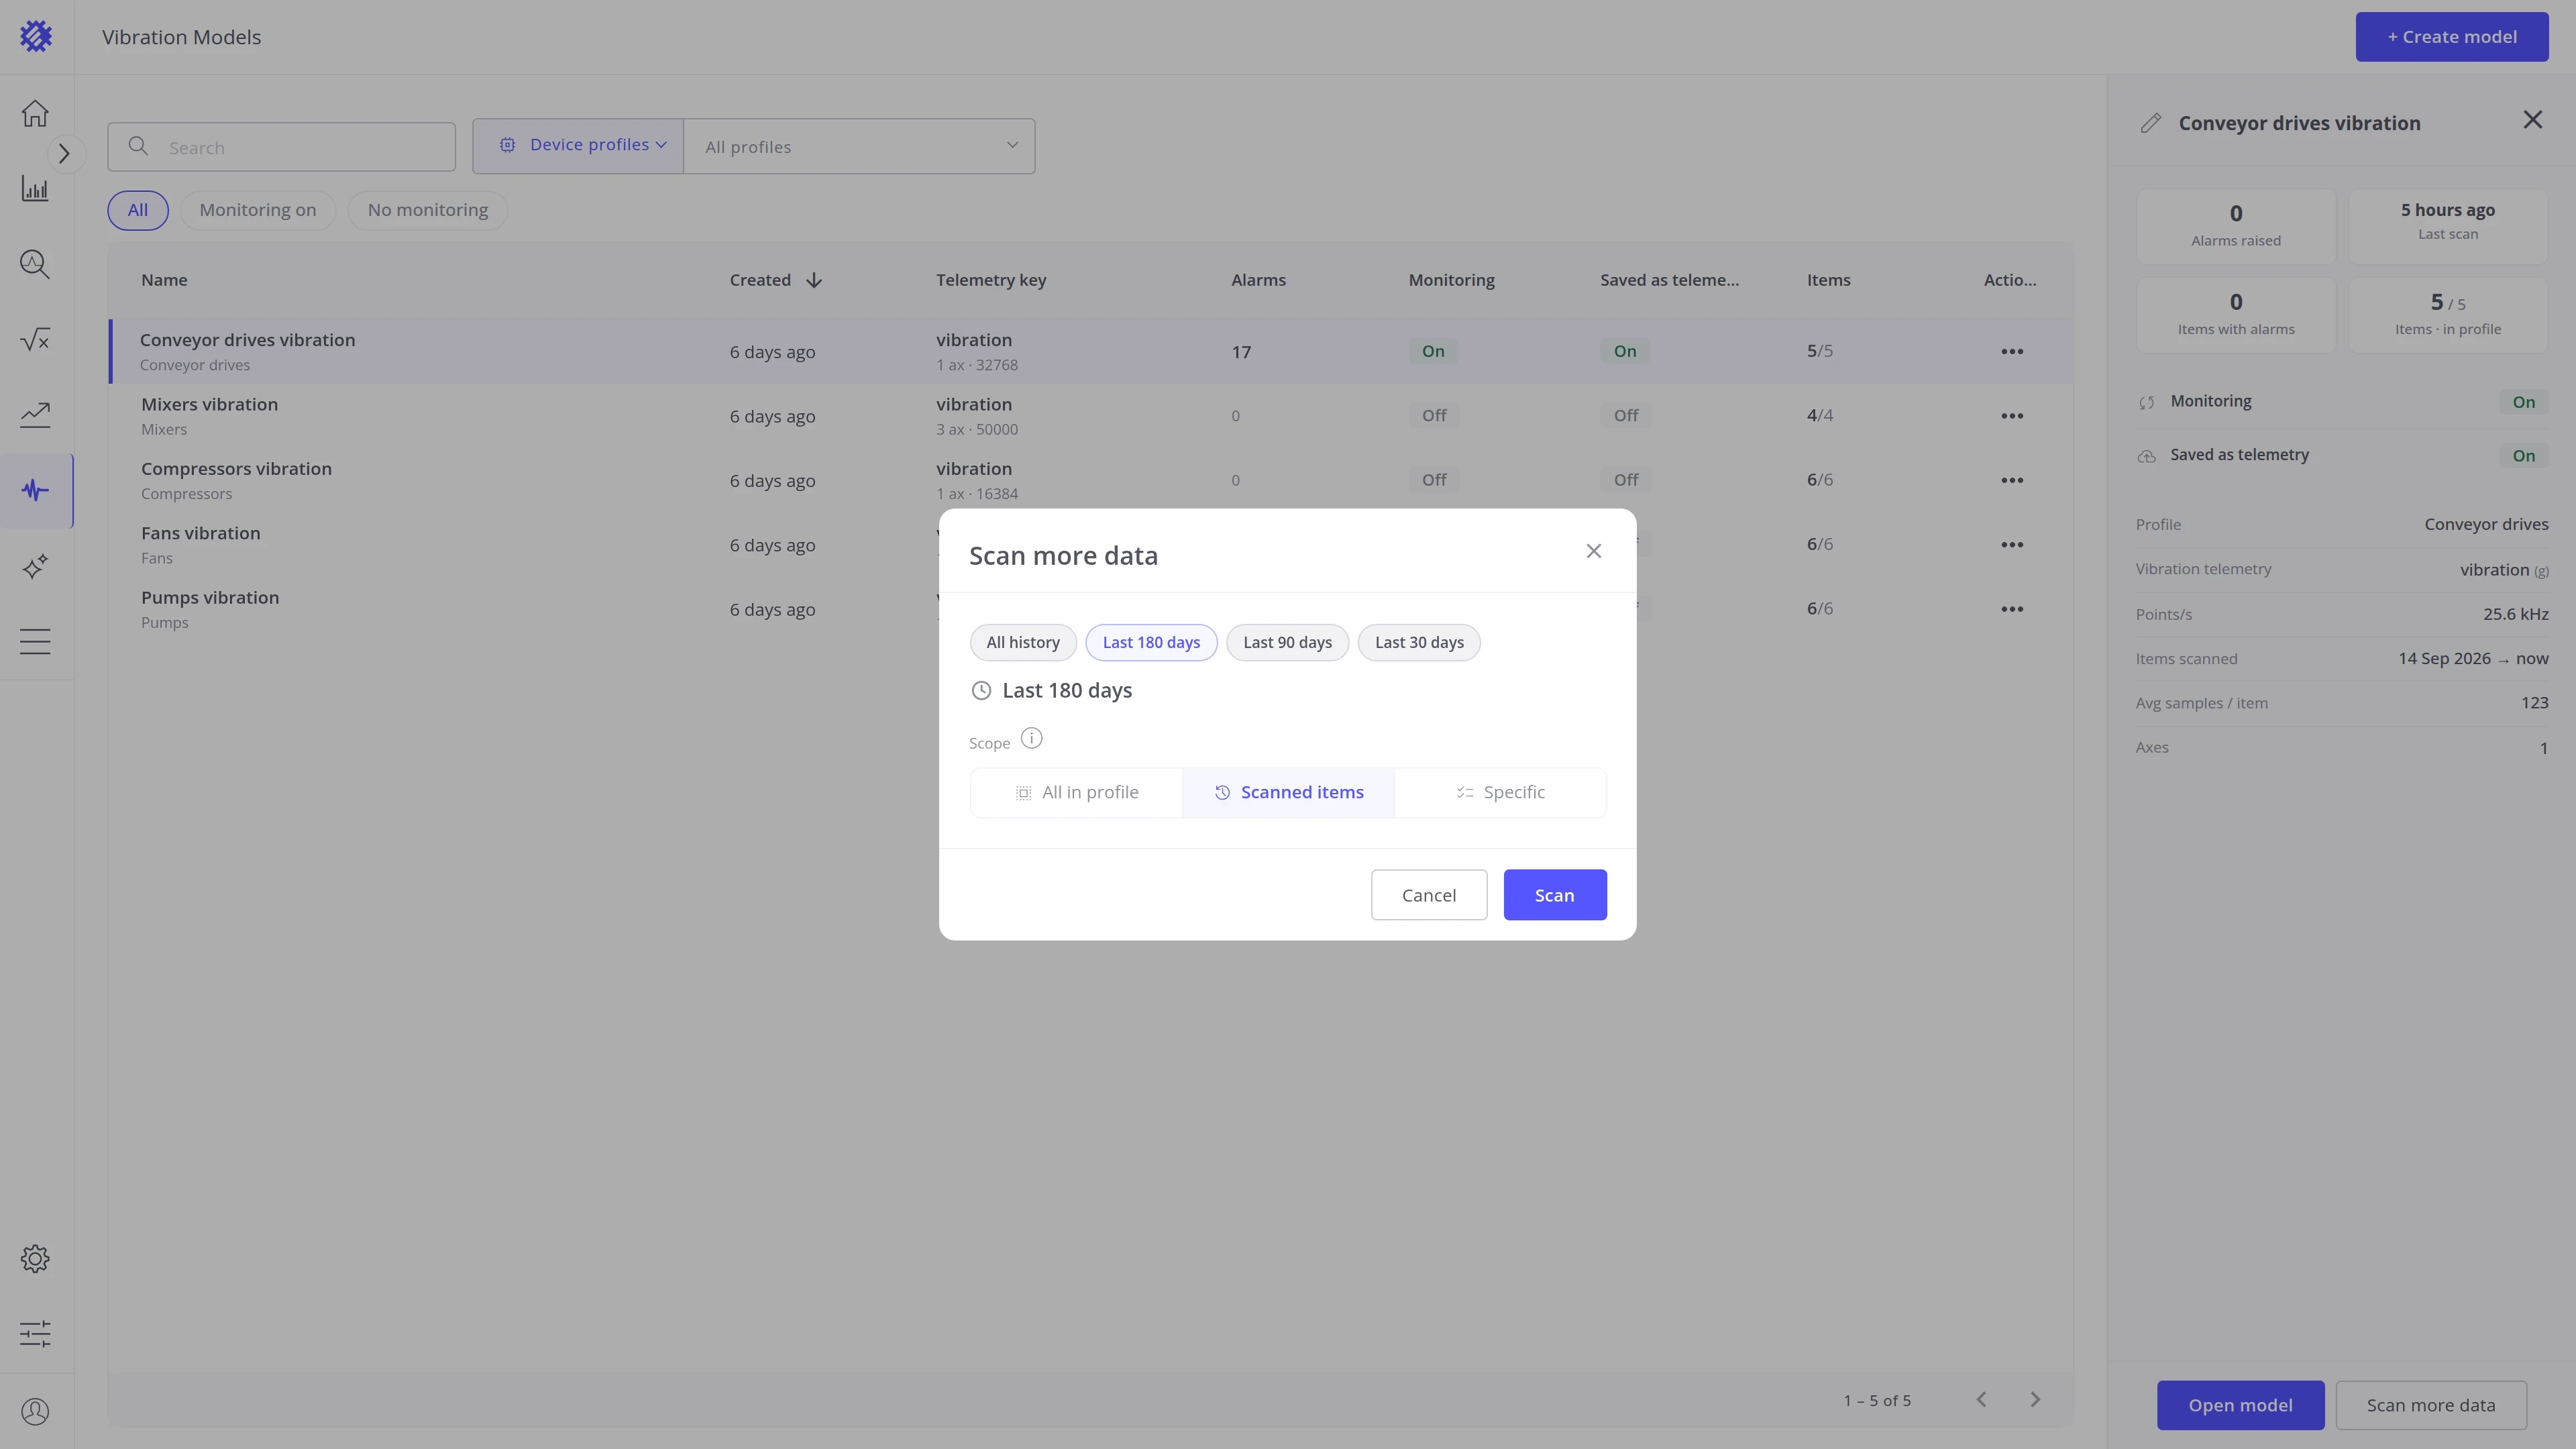
Scan more data opens a dialog to scan a period you choose, for example to fill history or add machines. It is the same scan as Scan more data in the model’s actions.
Renaming and deleting
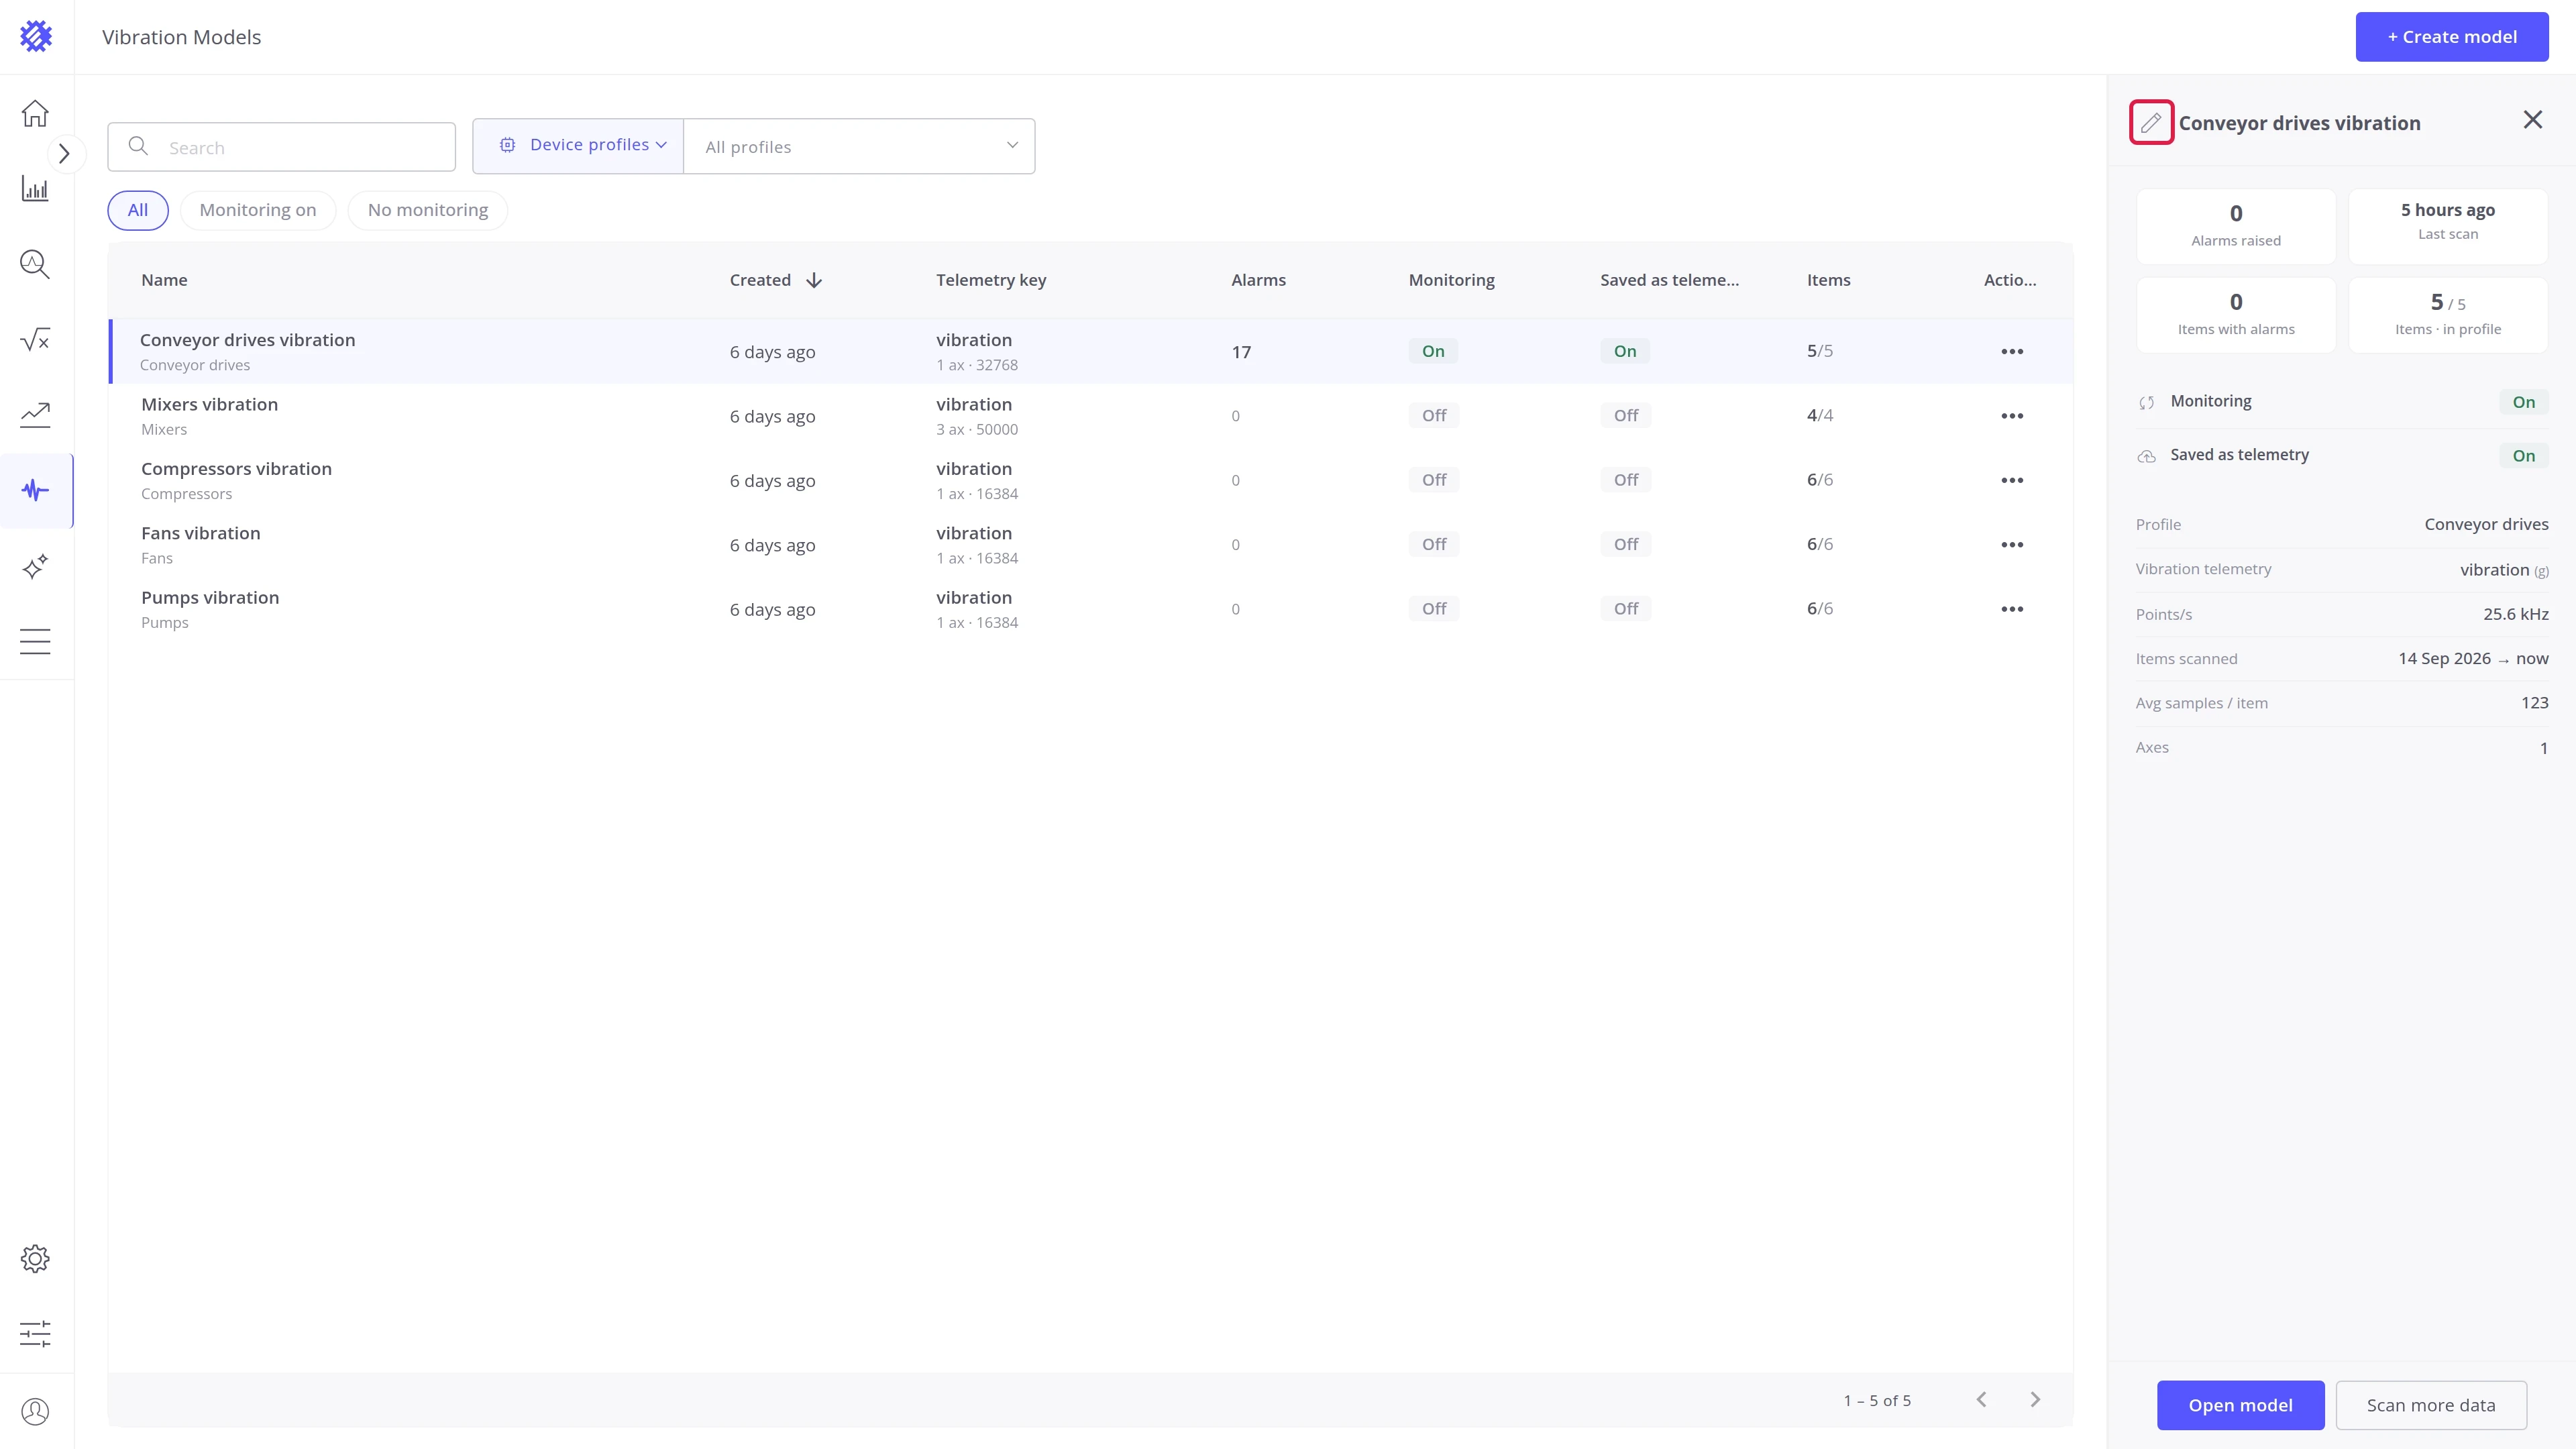
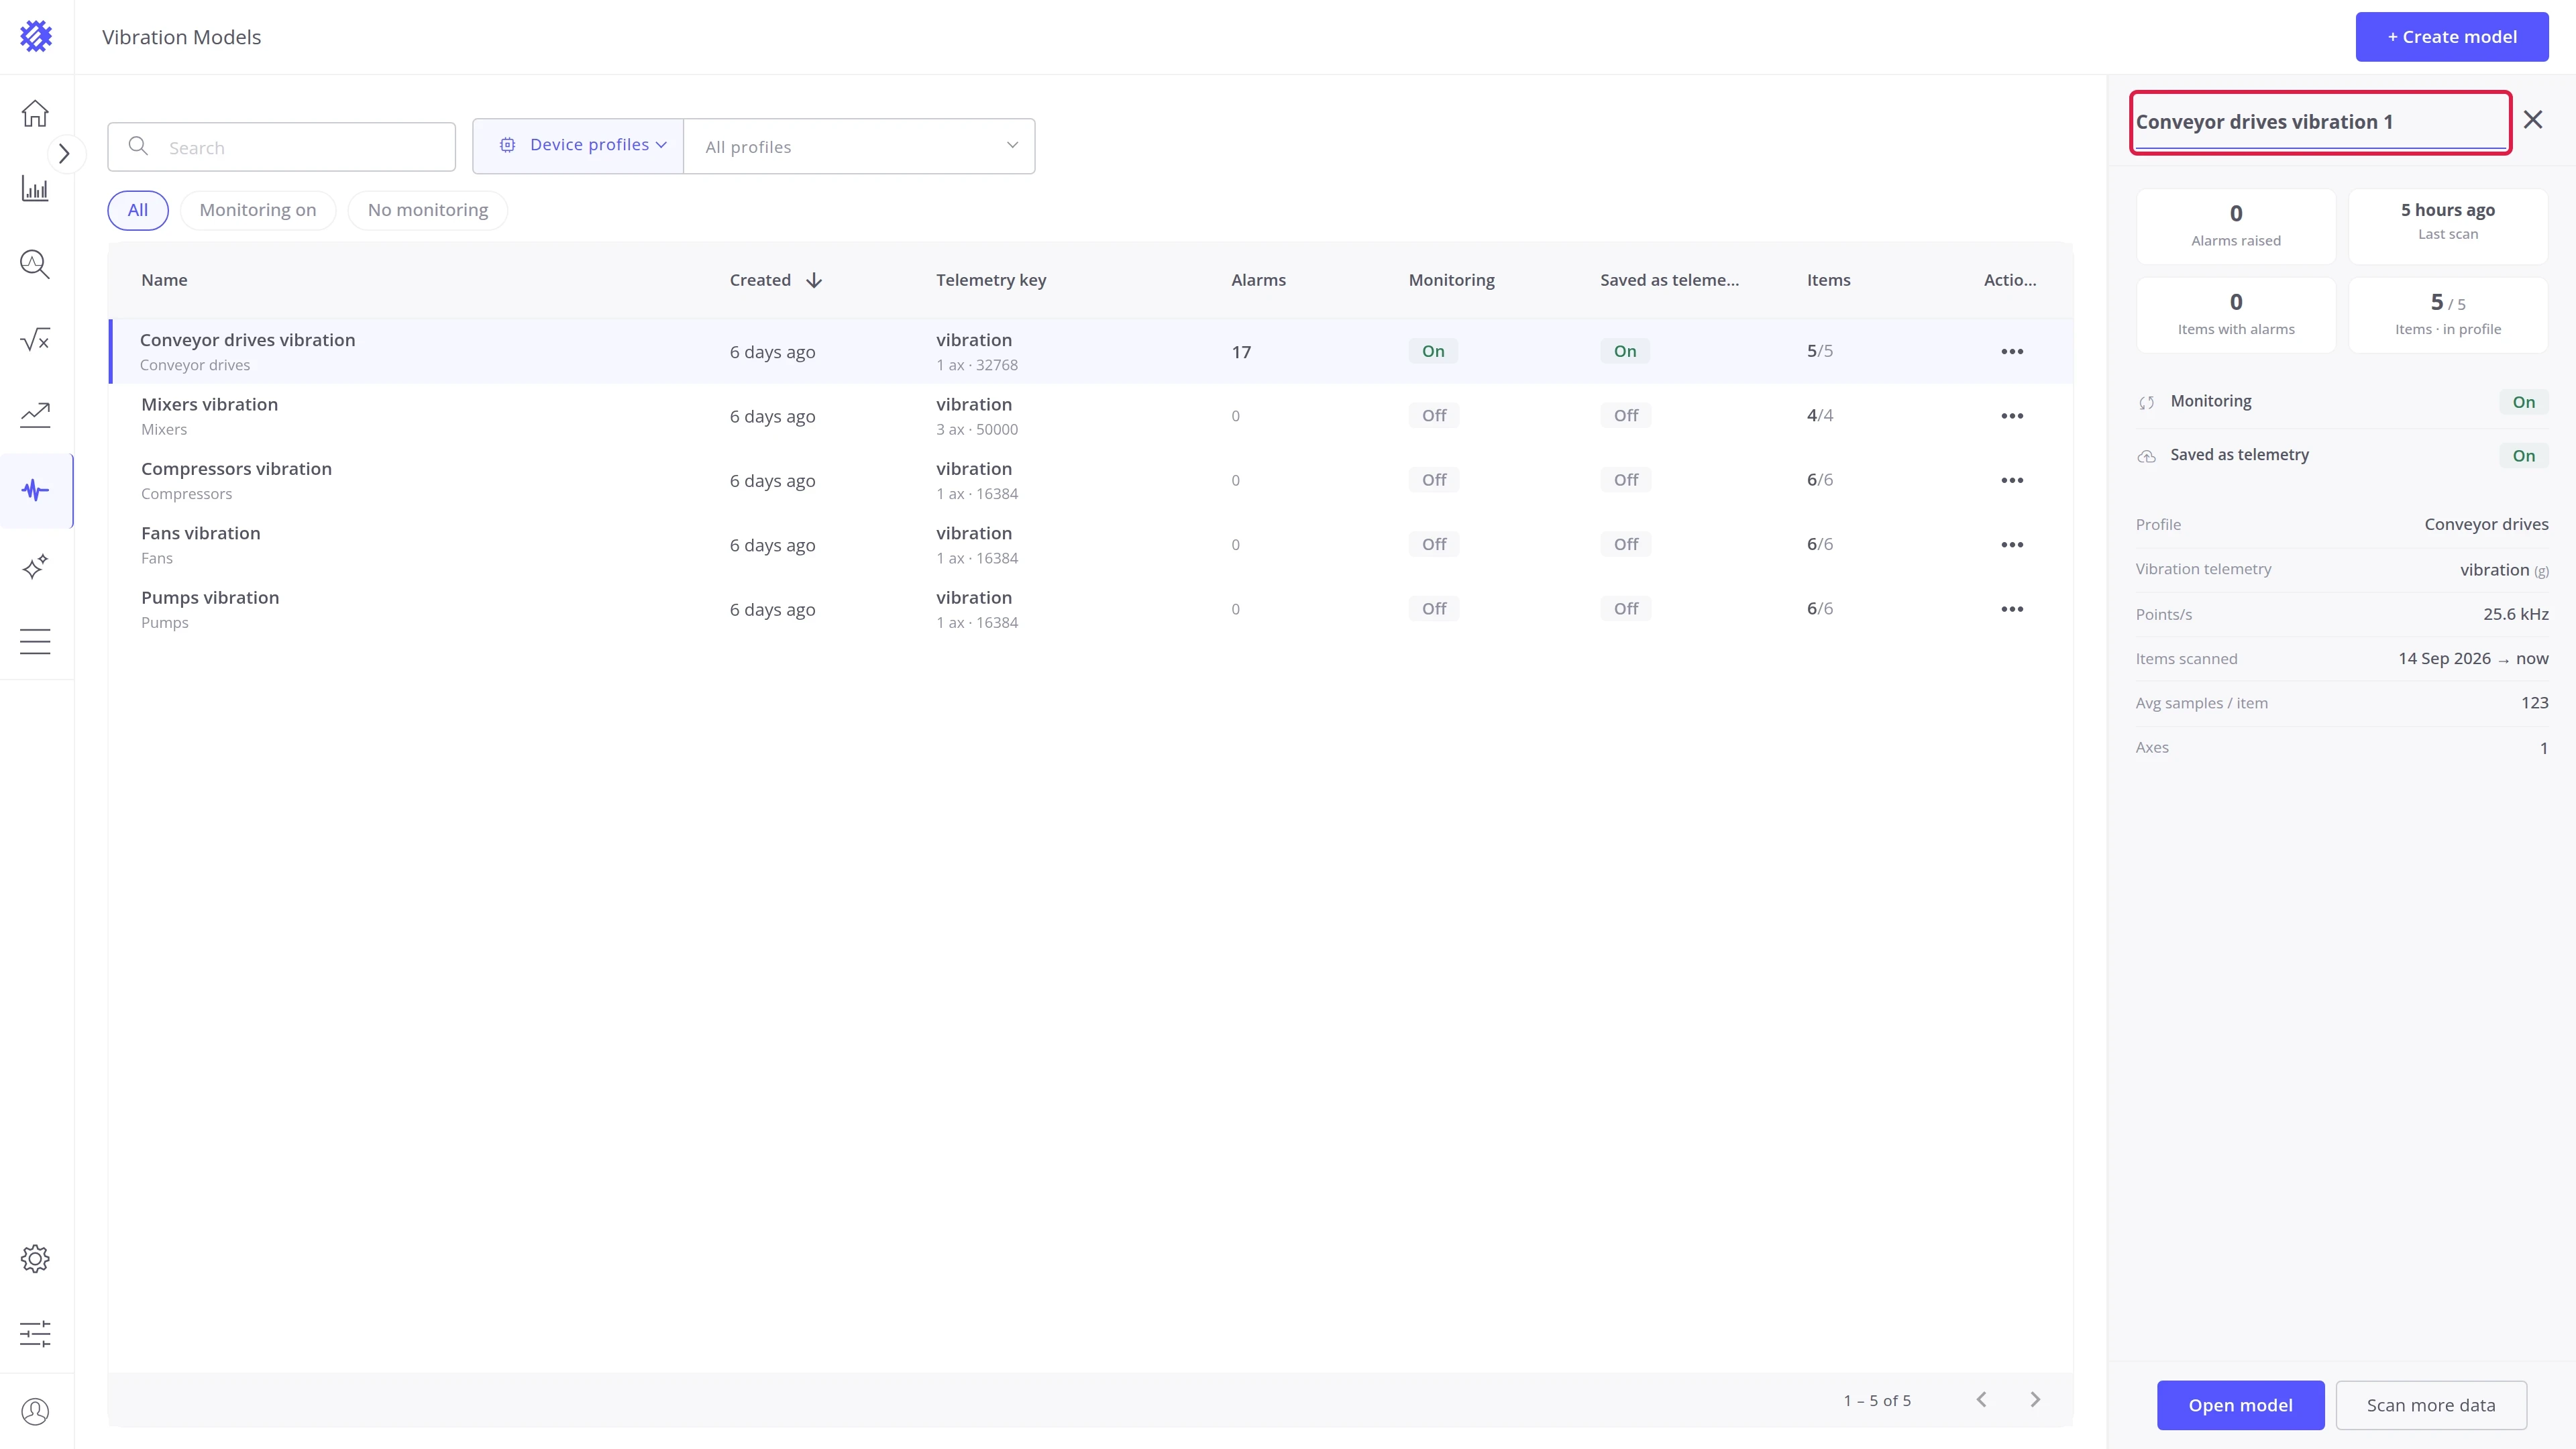
Section titled “Renaming and deleting”Rename from the panel. Click the pencil beside the model name in the detail panel. The name becomes editable: type the new name and press Enter to save, or Escape to cancel.
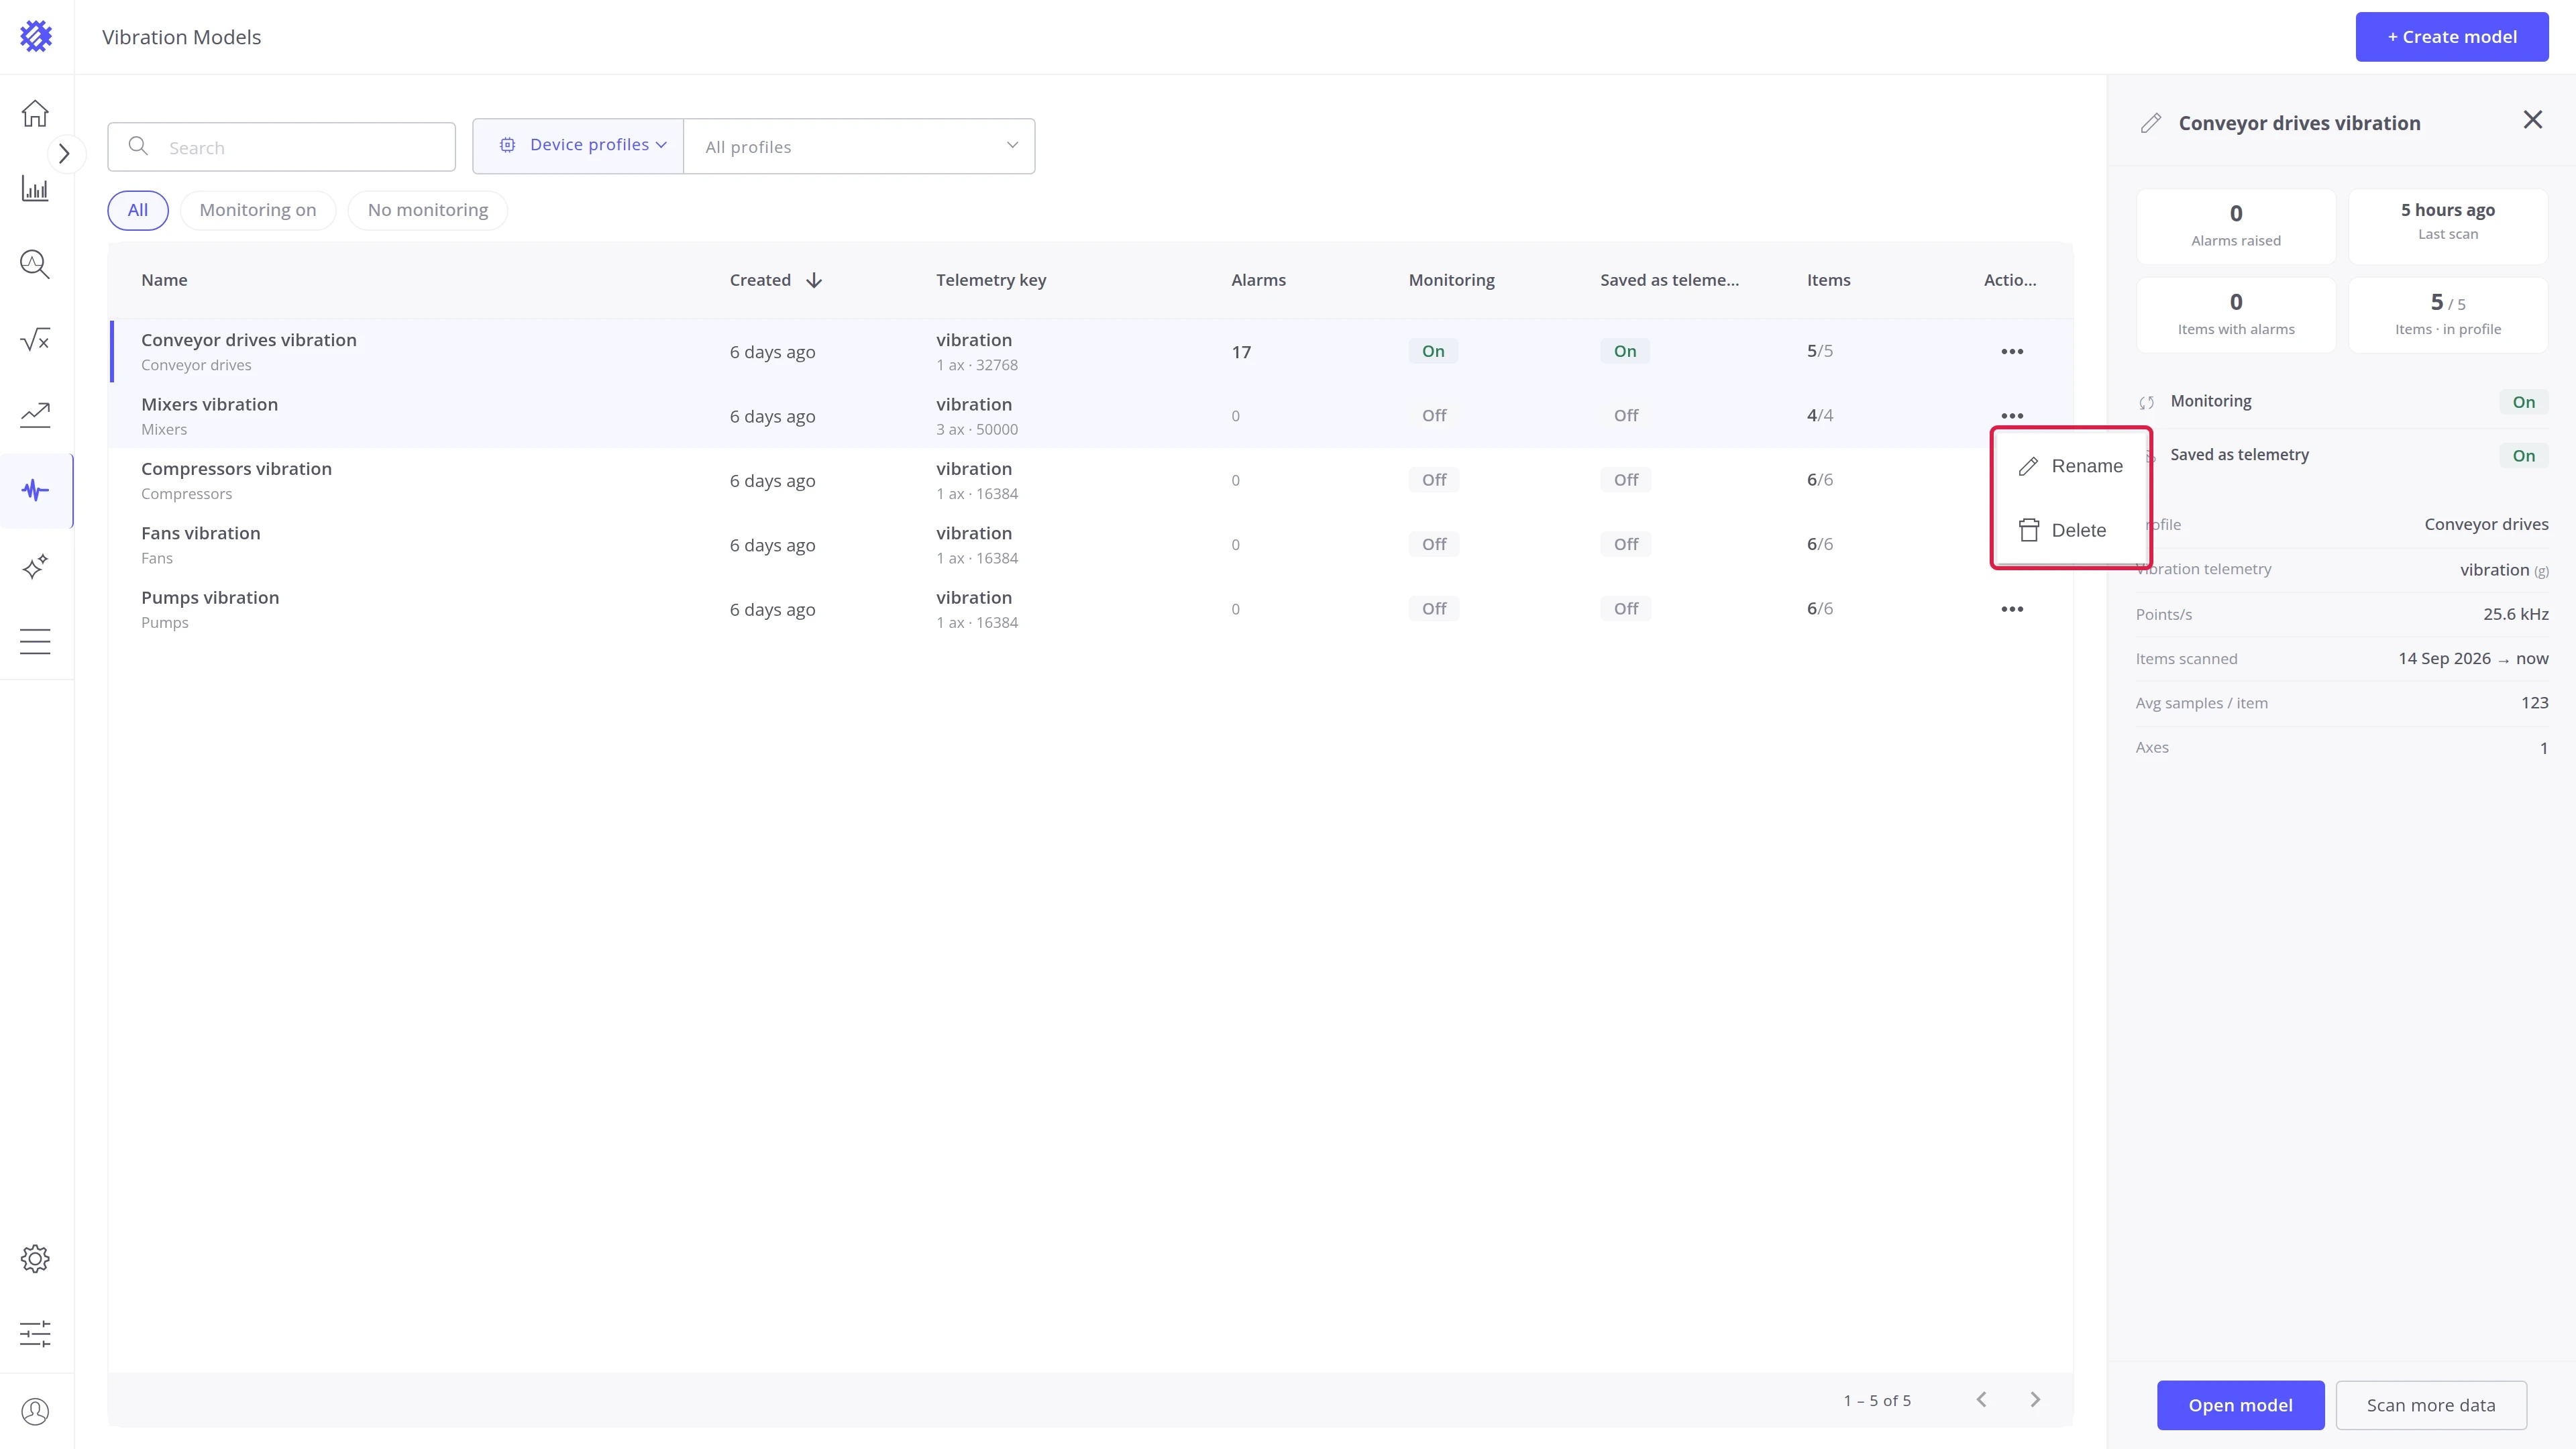
Rename or delete from the table. Click the … at the end of a row:
- Rename makes the name editable in the table. Type the new name and press Enter.
- Delete removes the model with everything it has computed, after a confirmation.
The model page has five tabs. Click a tab name to switch to it.
- Overview, Monitoring, and Analyzer show the results of the model’s scans: the verdict for each machine, how it changes over time, and one sample in detail.
- Properties shows how the model is set up, and lets you change it.
- Tasks shows the scans the model has run.
Each tab is described in detail on its own page, linked below.
Overview tab
Section titled “Overview tab”The verdict for each machine: its ISO zone, the shaft problem, and the bearing defect that fits best.
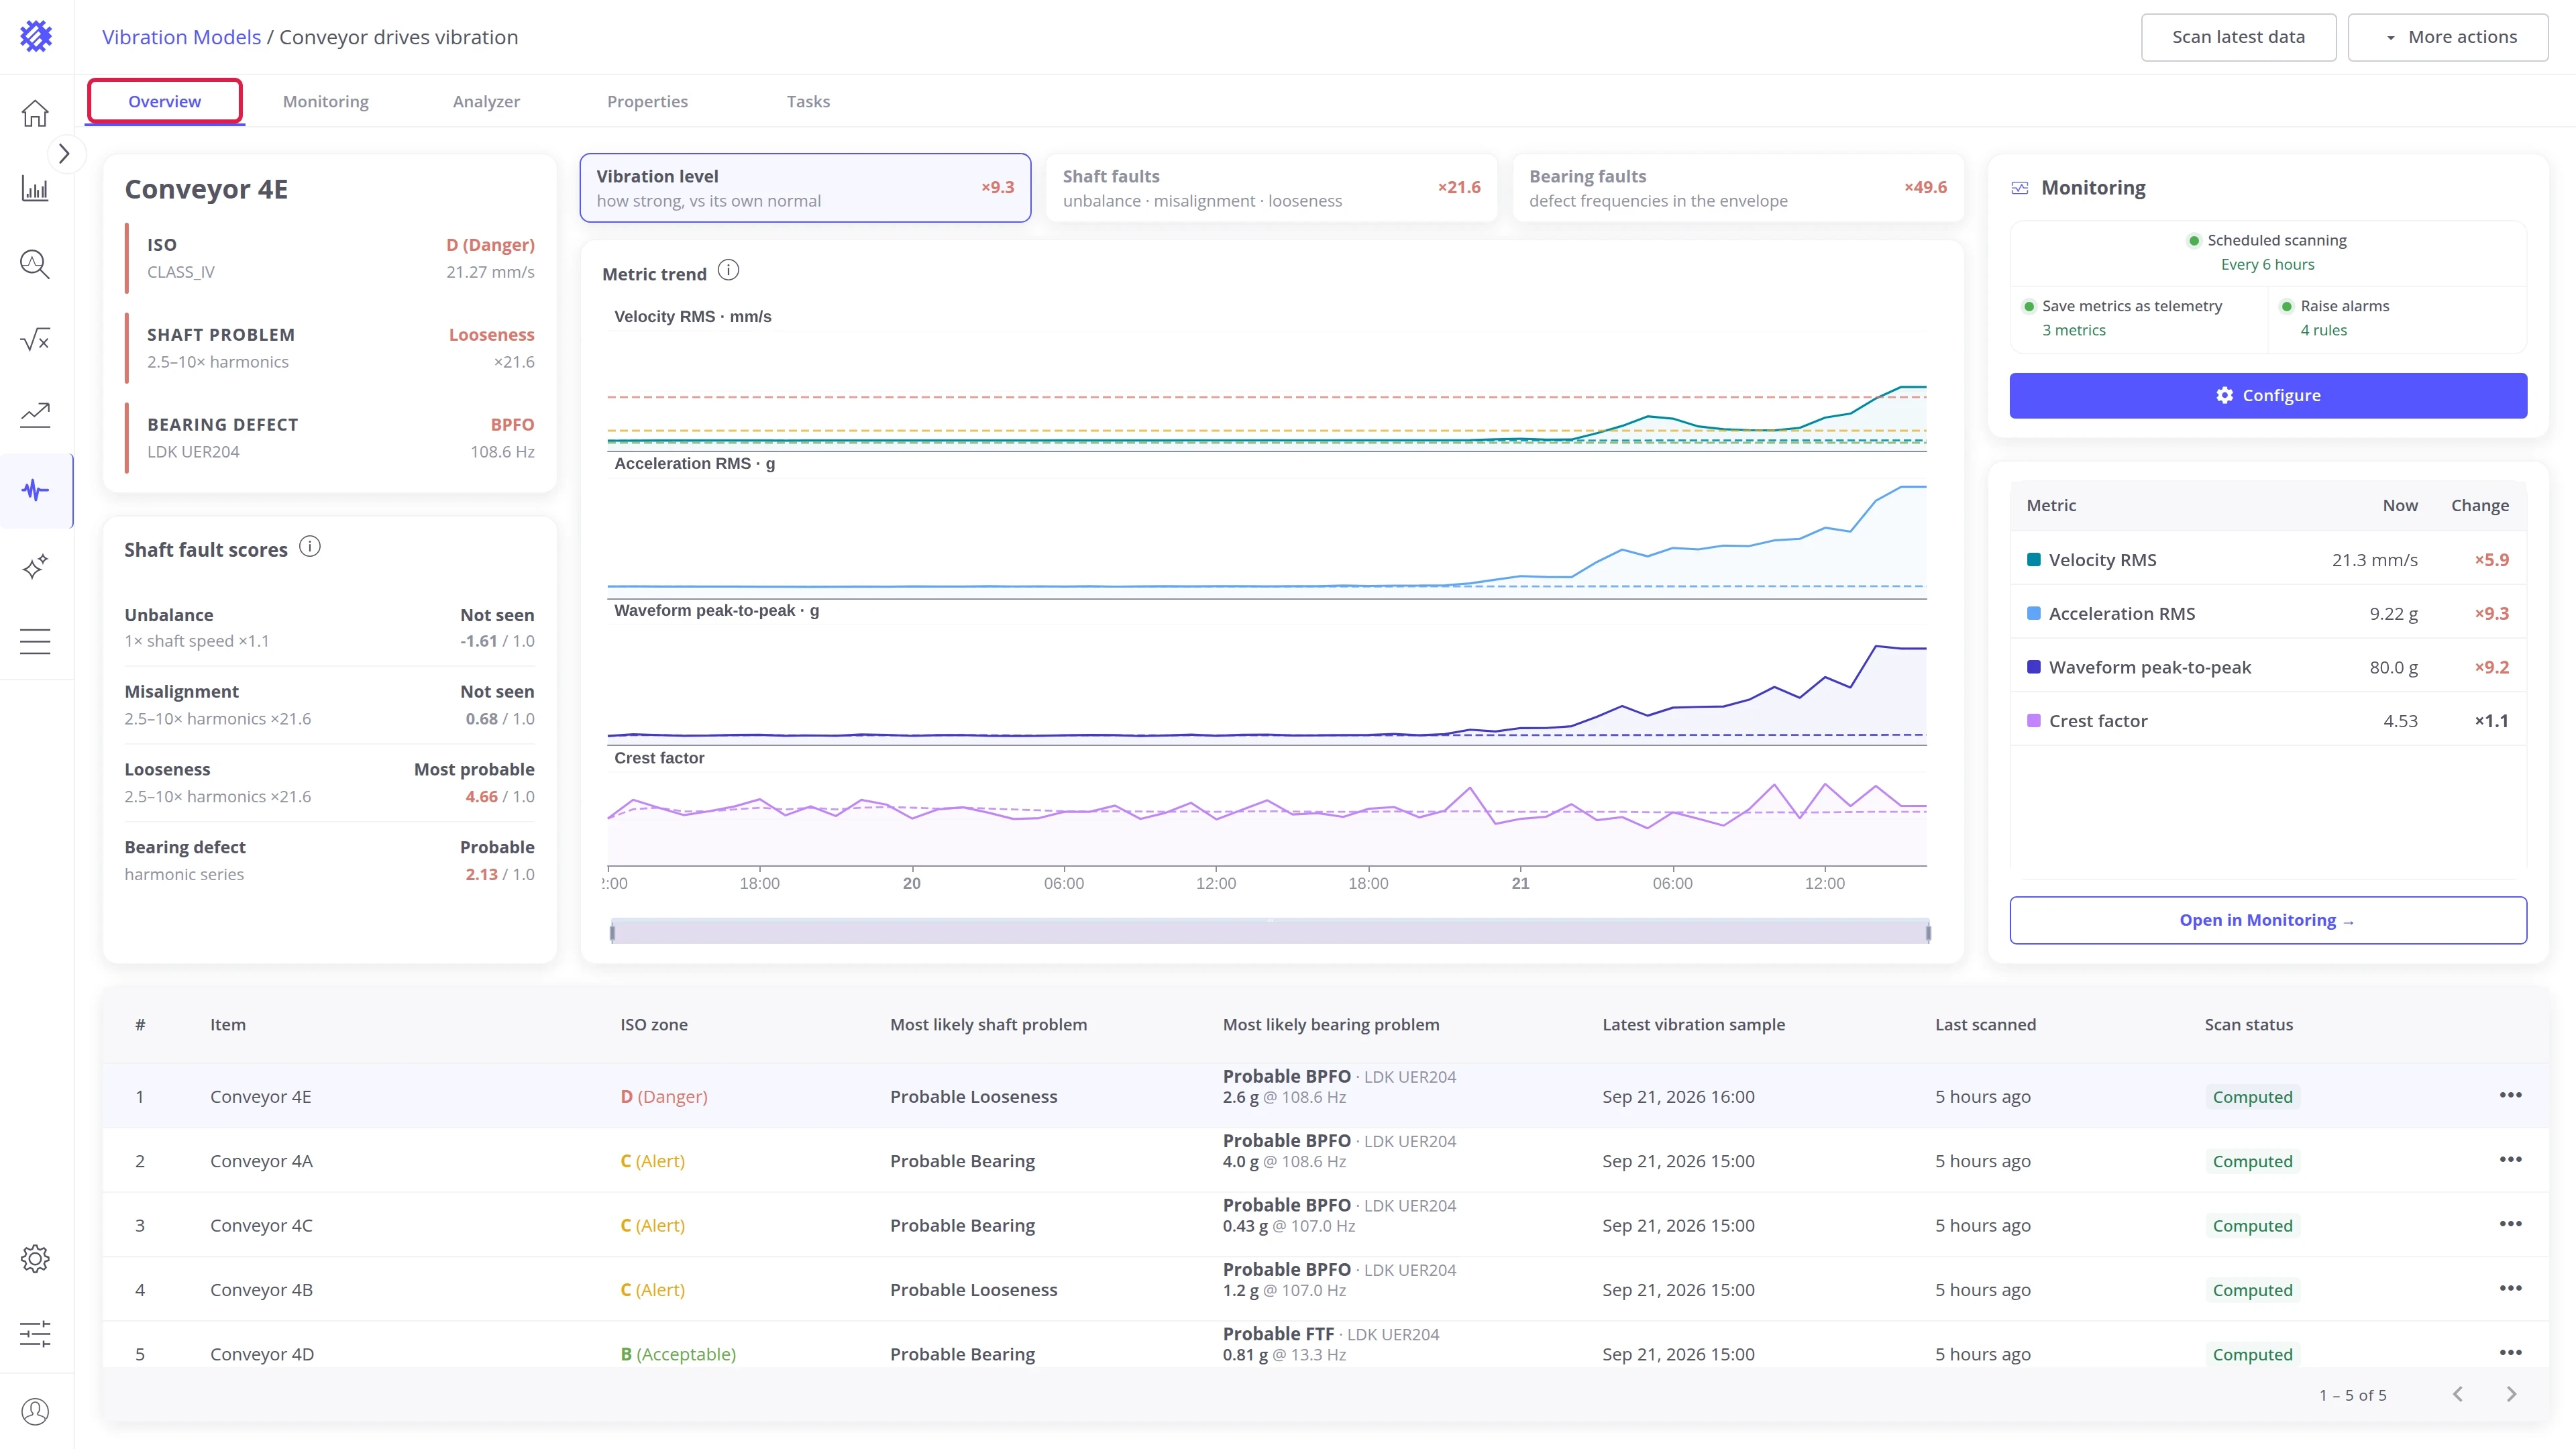
See Overview tab.
Monitoring tab
Section titled “Monitoring tab”The model over time: the alarm state of each machine, its metric trends, and the alarms raised.
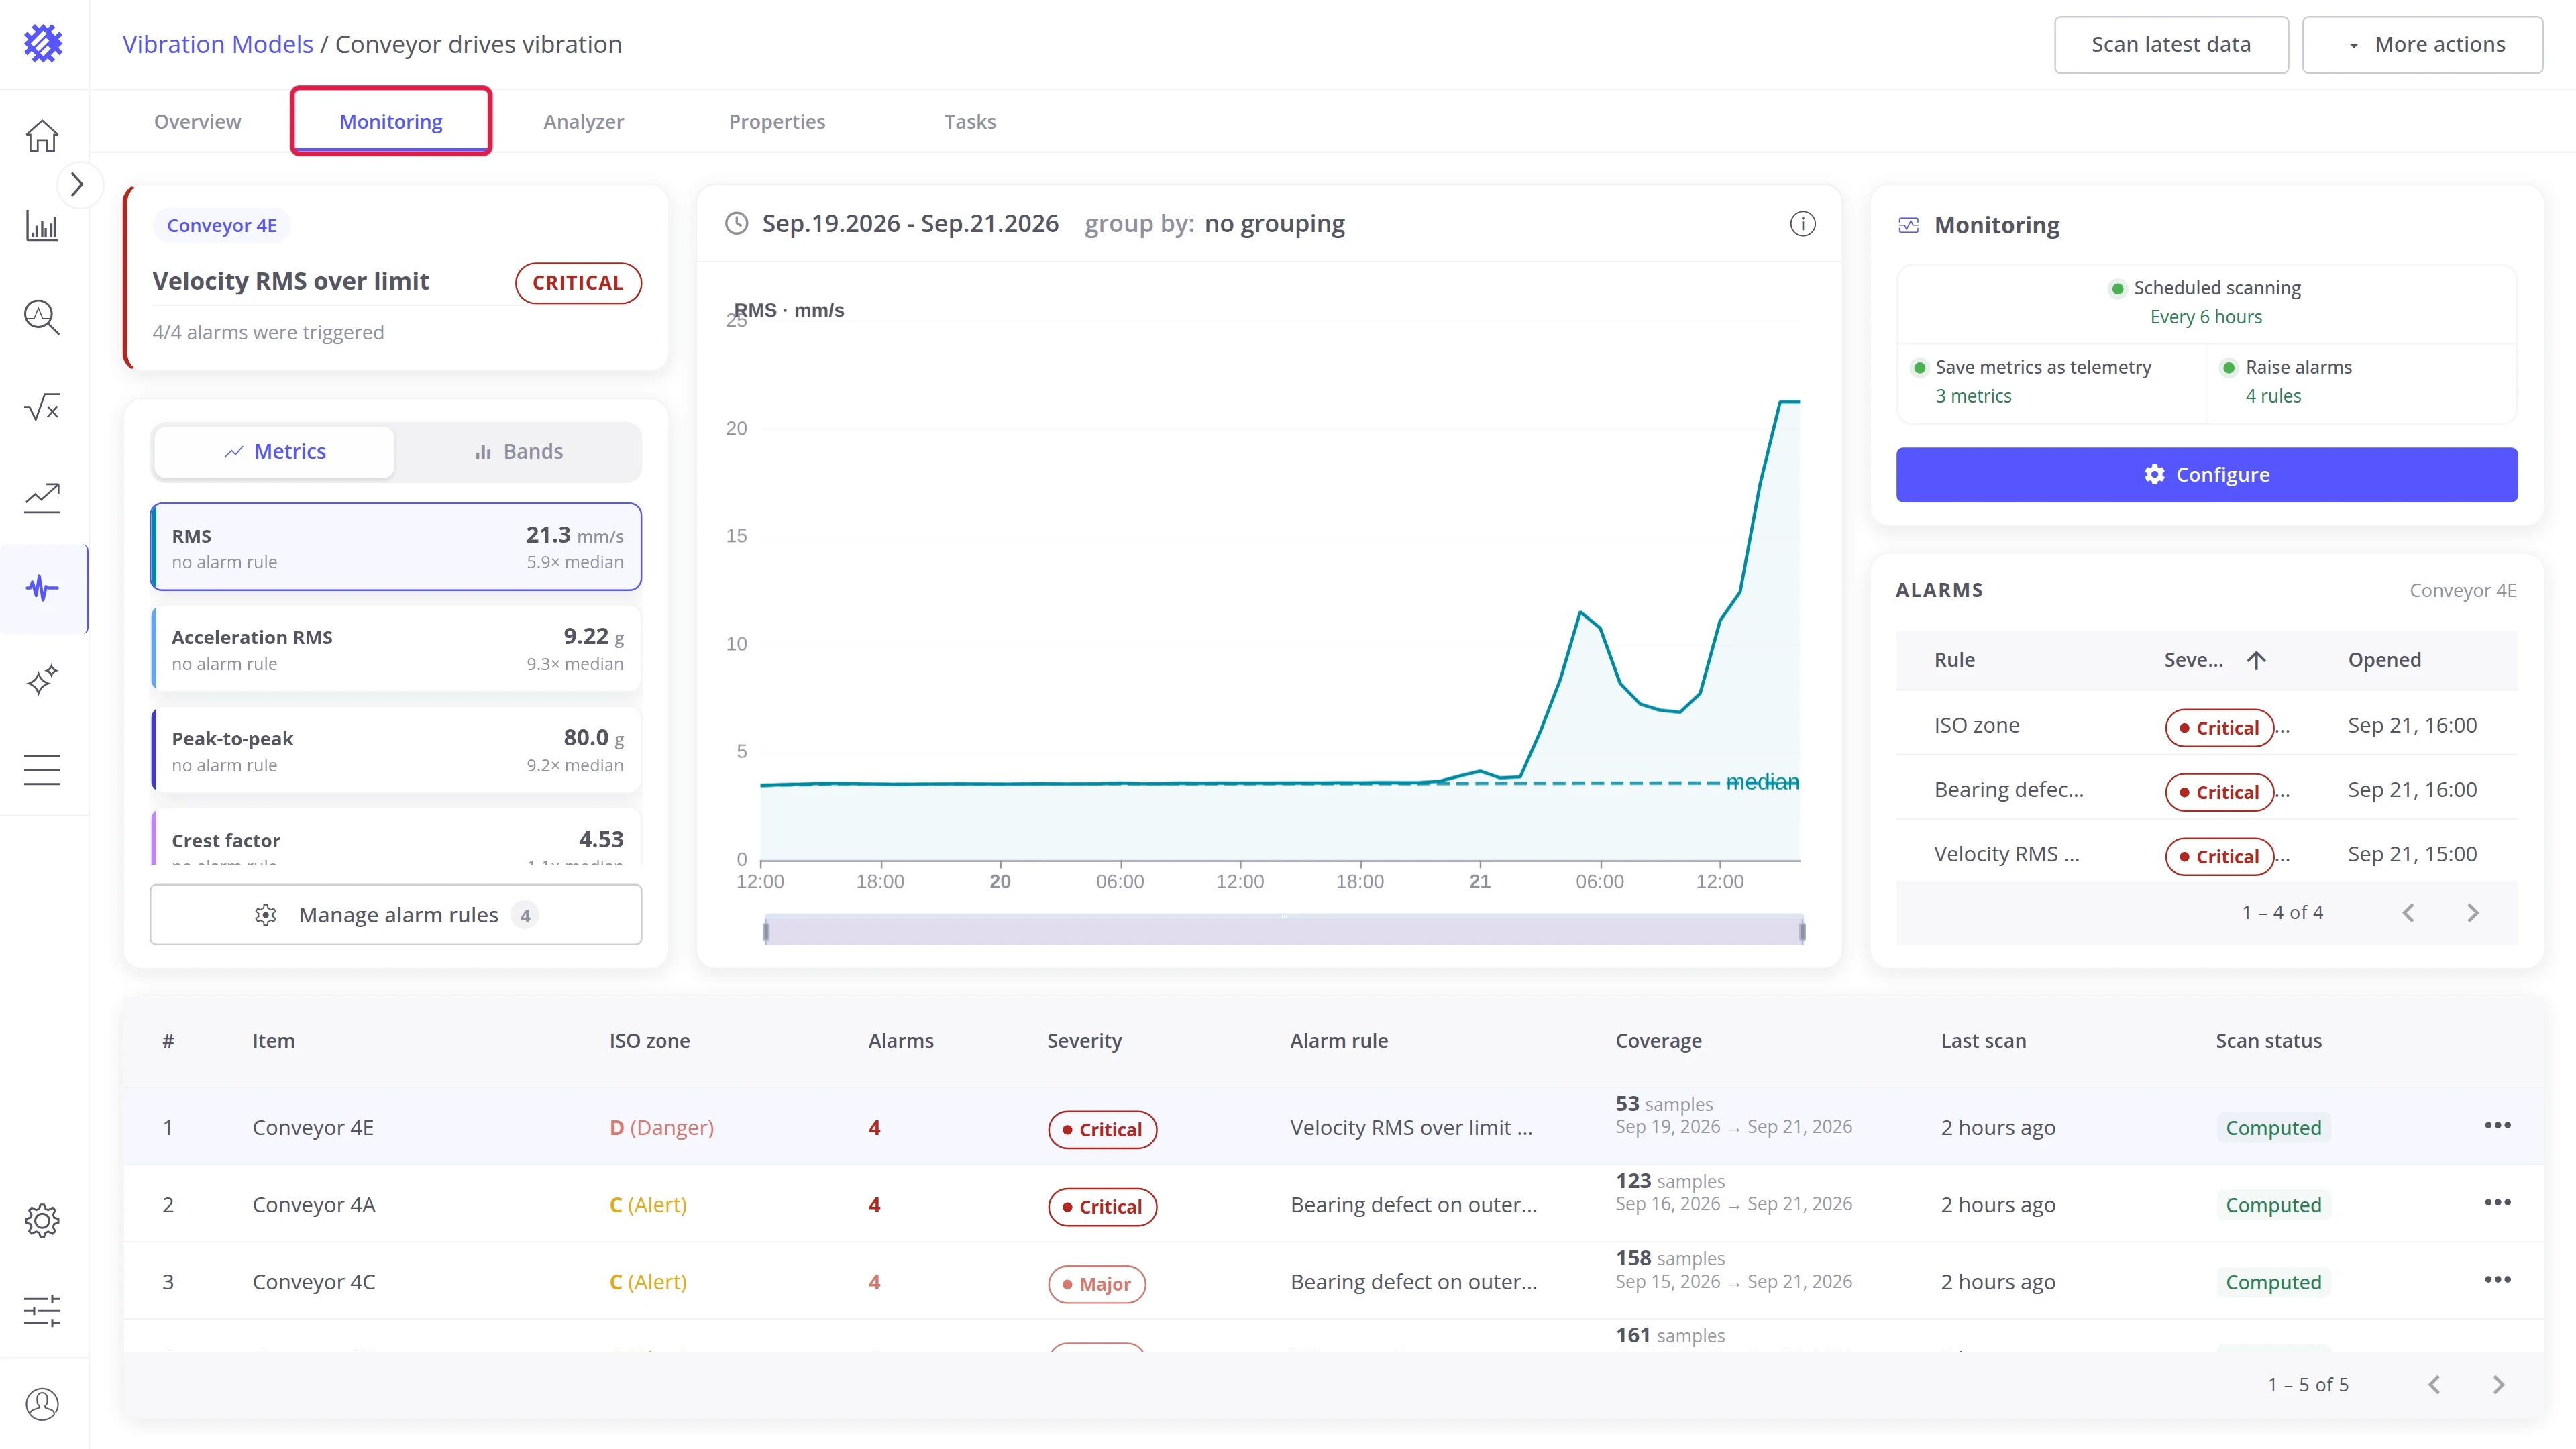
See Monitoring tab.
Analyzer tab
Section titled “Analyzer tab”One stored sample in detail: its waveform, spectrum, and envelope spectrum.
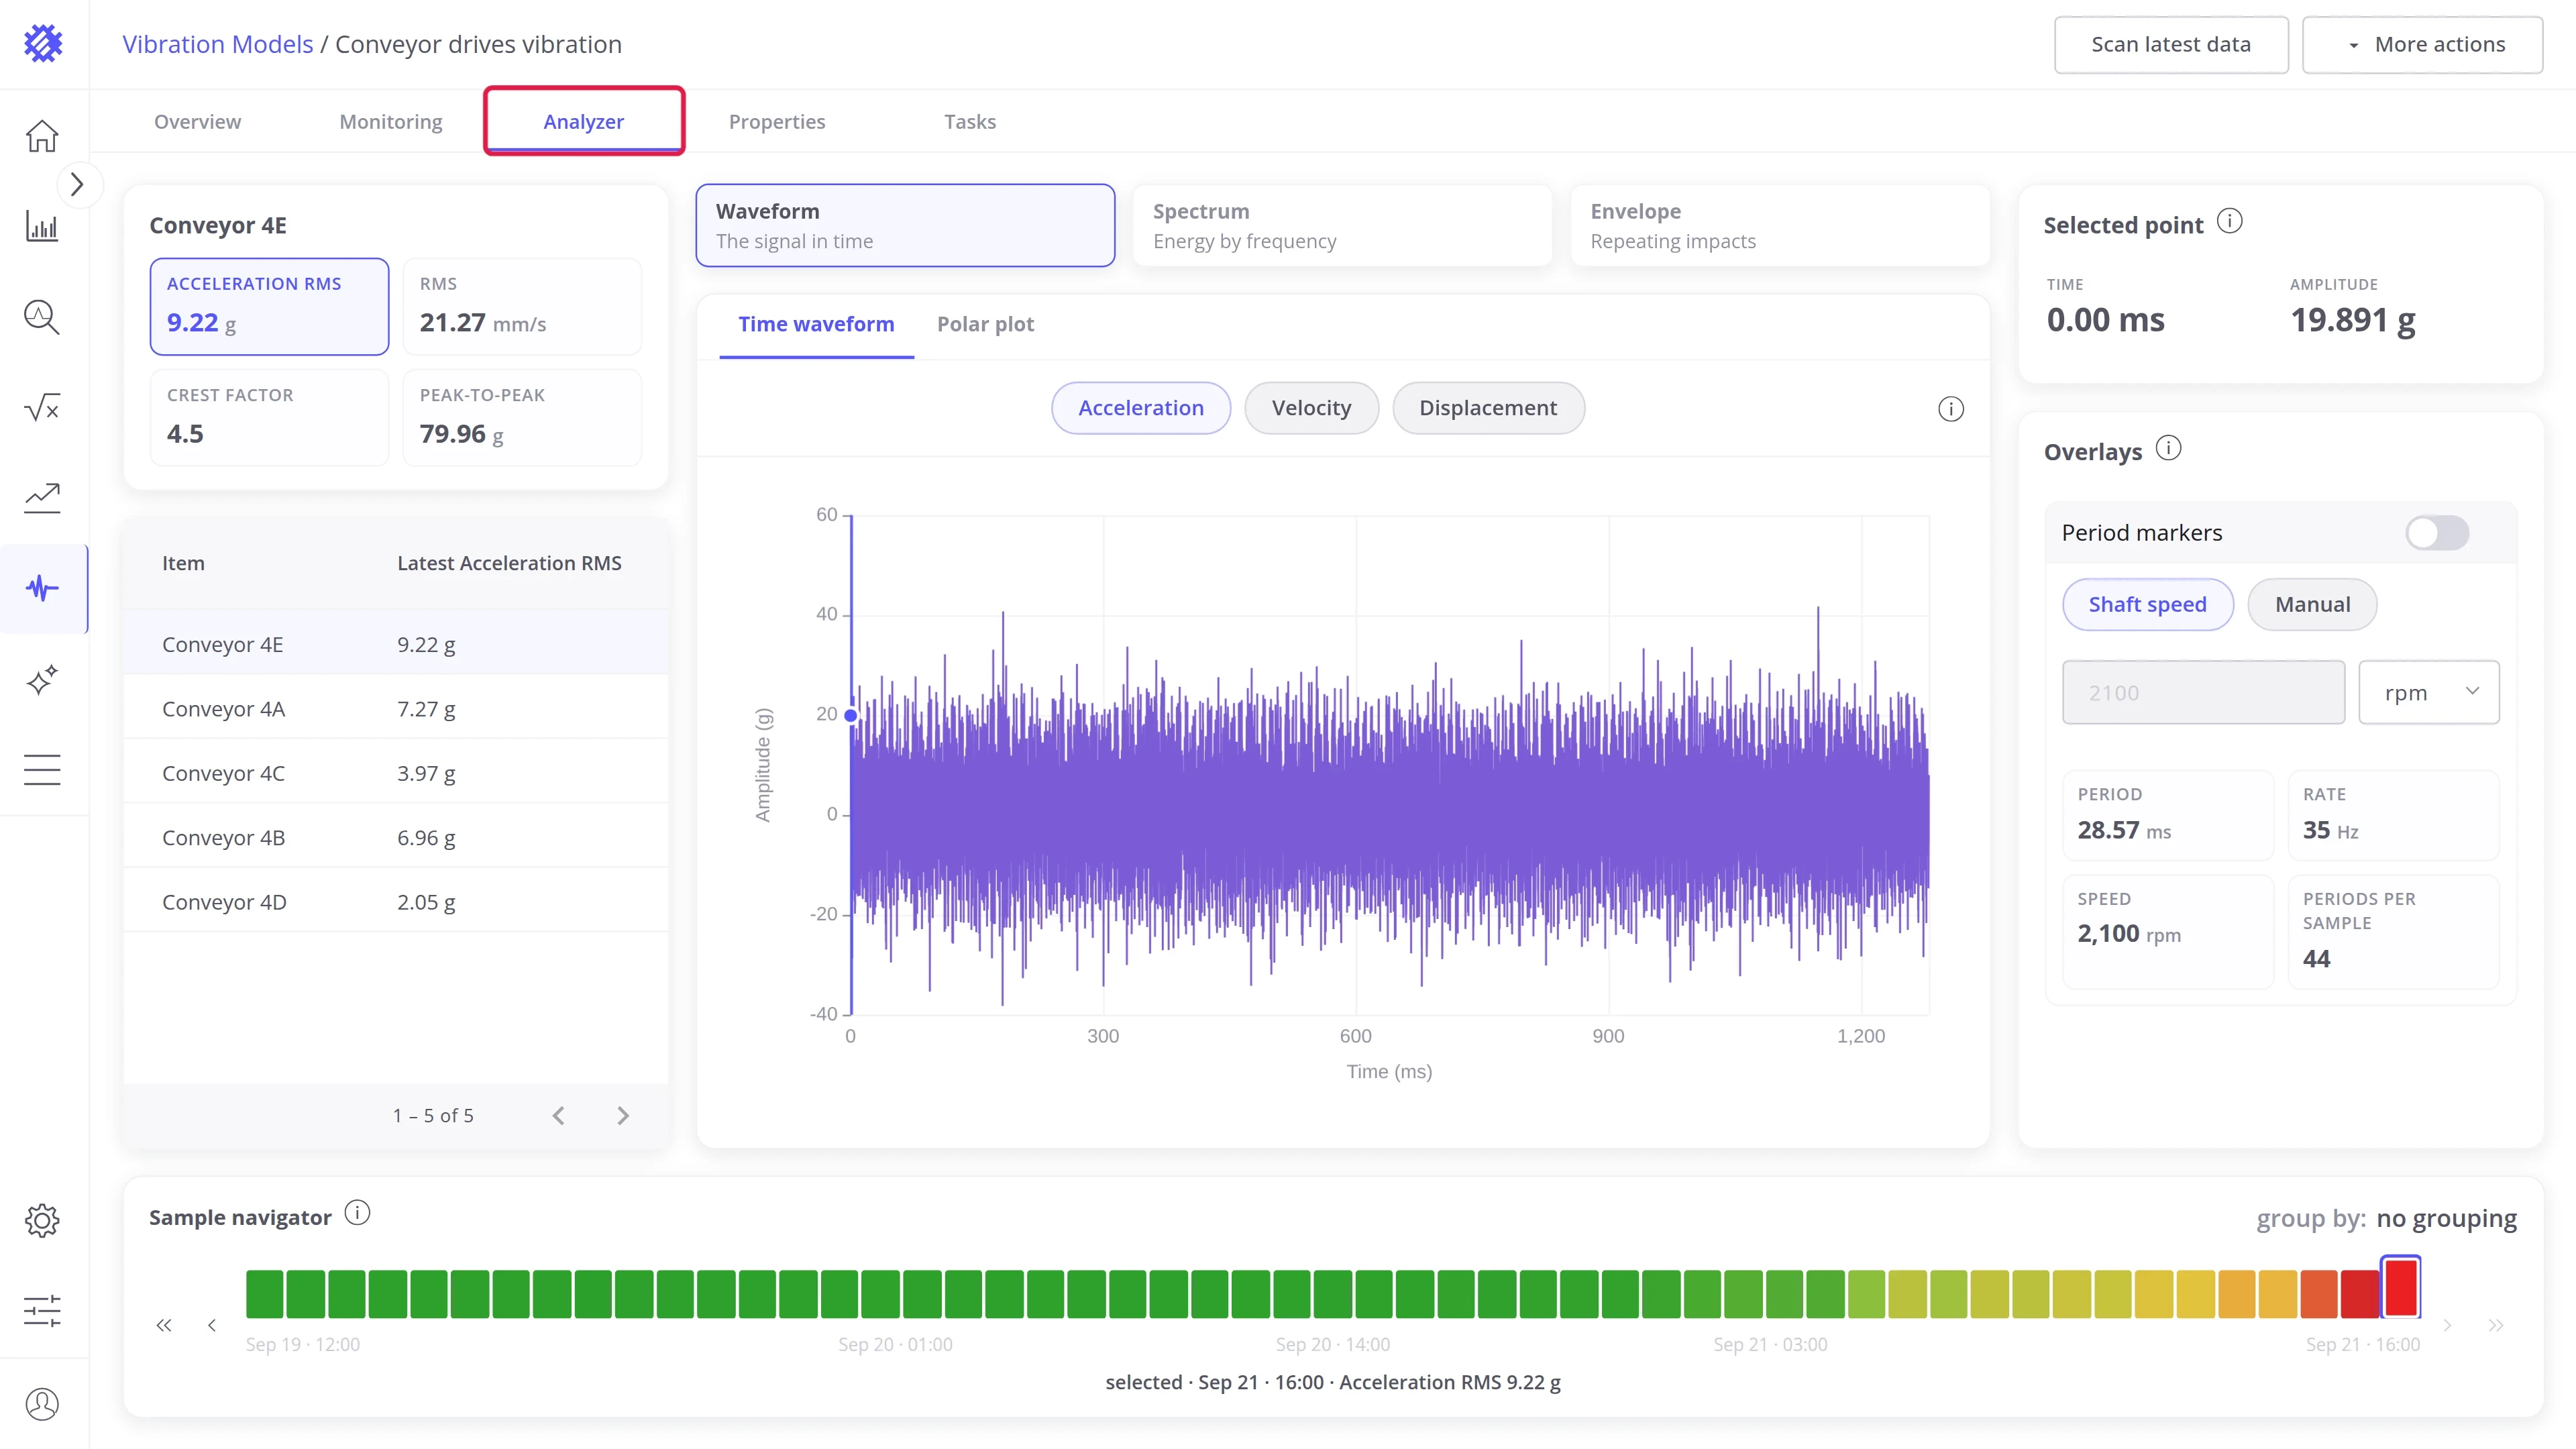
See Analyzer tab.
Properties tab
Section titled “Properties tab”Everything the model is configured with: what it reads, how it scans, and the machine details.
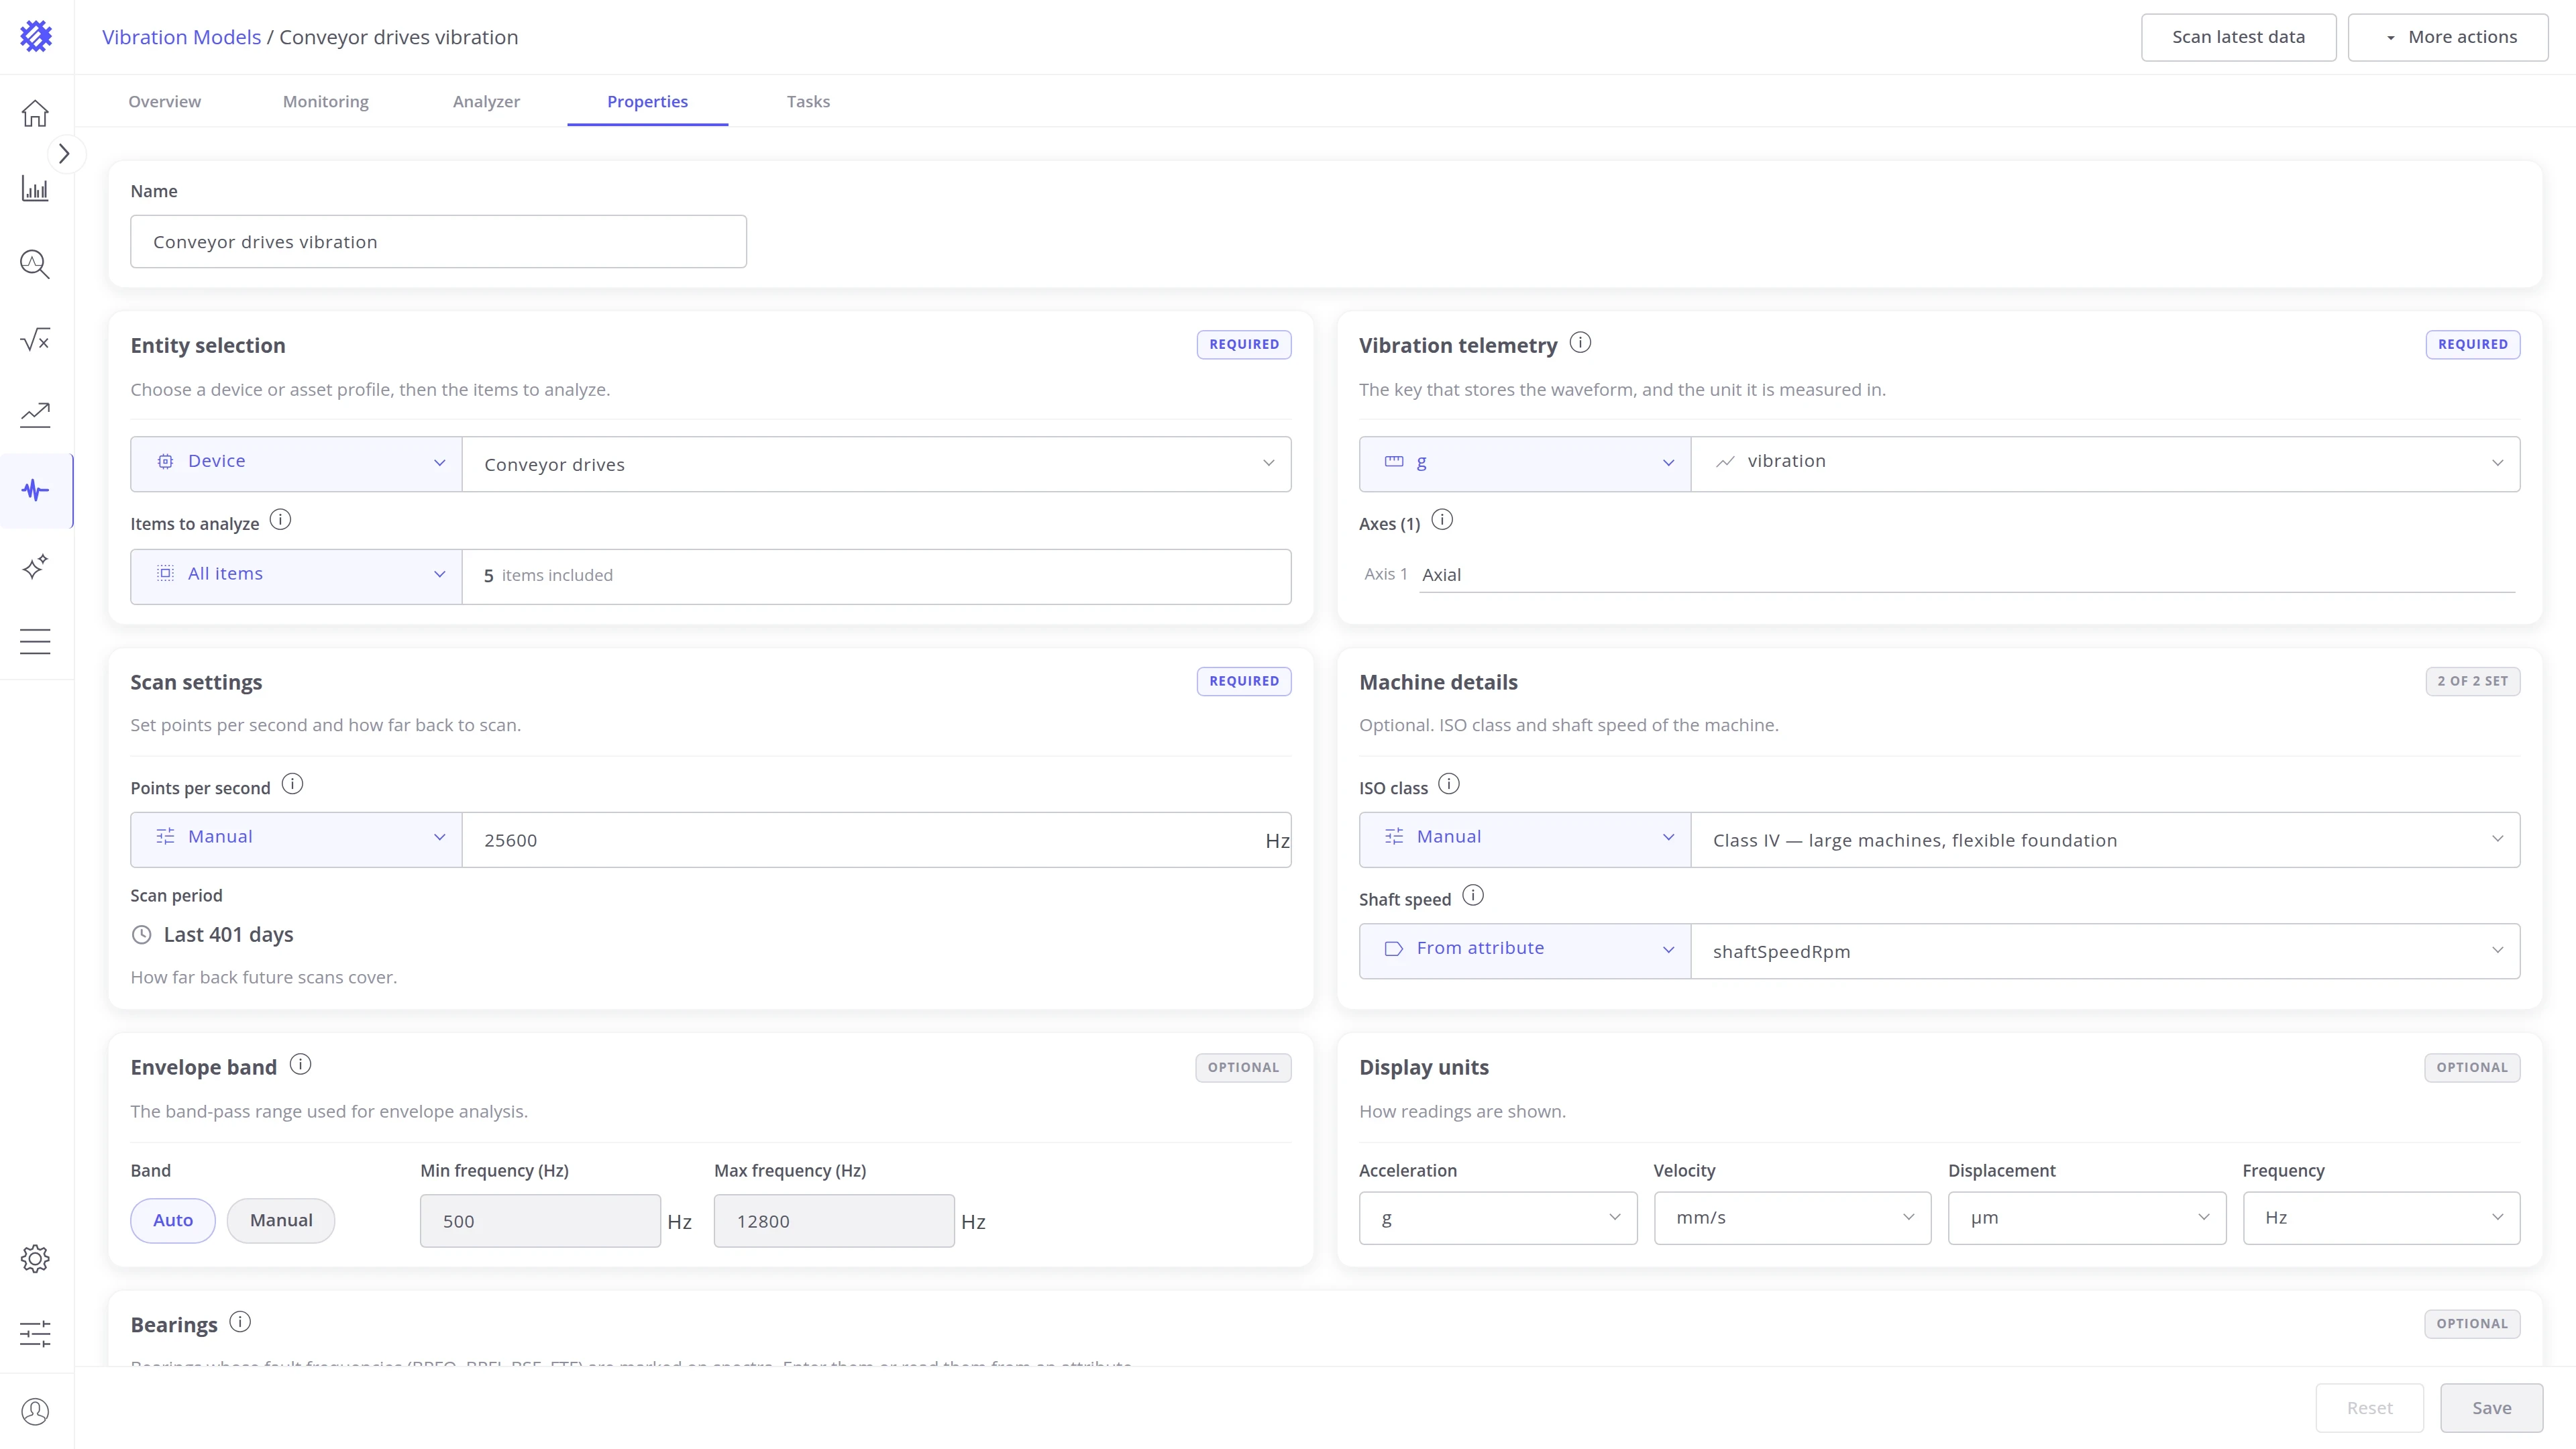
See Properties tab.
Tasks tab
Section titled “Tasks tab”A vibration model has one Trendz task, and every scan runs as an execution of it: the scheduled ones and those you start by hand. The Tasks tab shows that task, so you can check when each scan ran, whether it finished, and how long it took.
Tasks list
The model’s task, under Vibration model tasks.
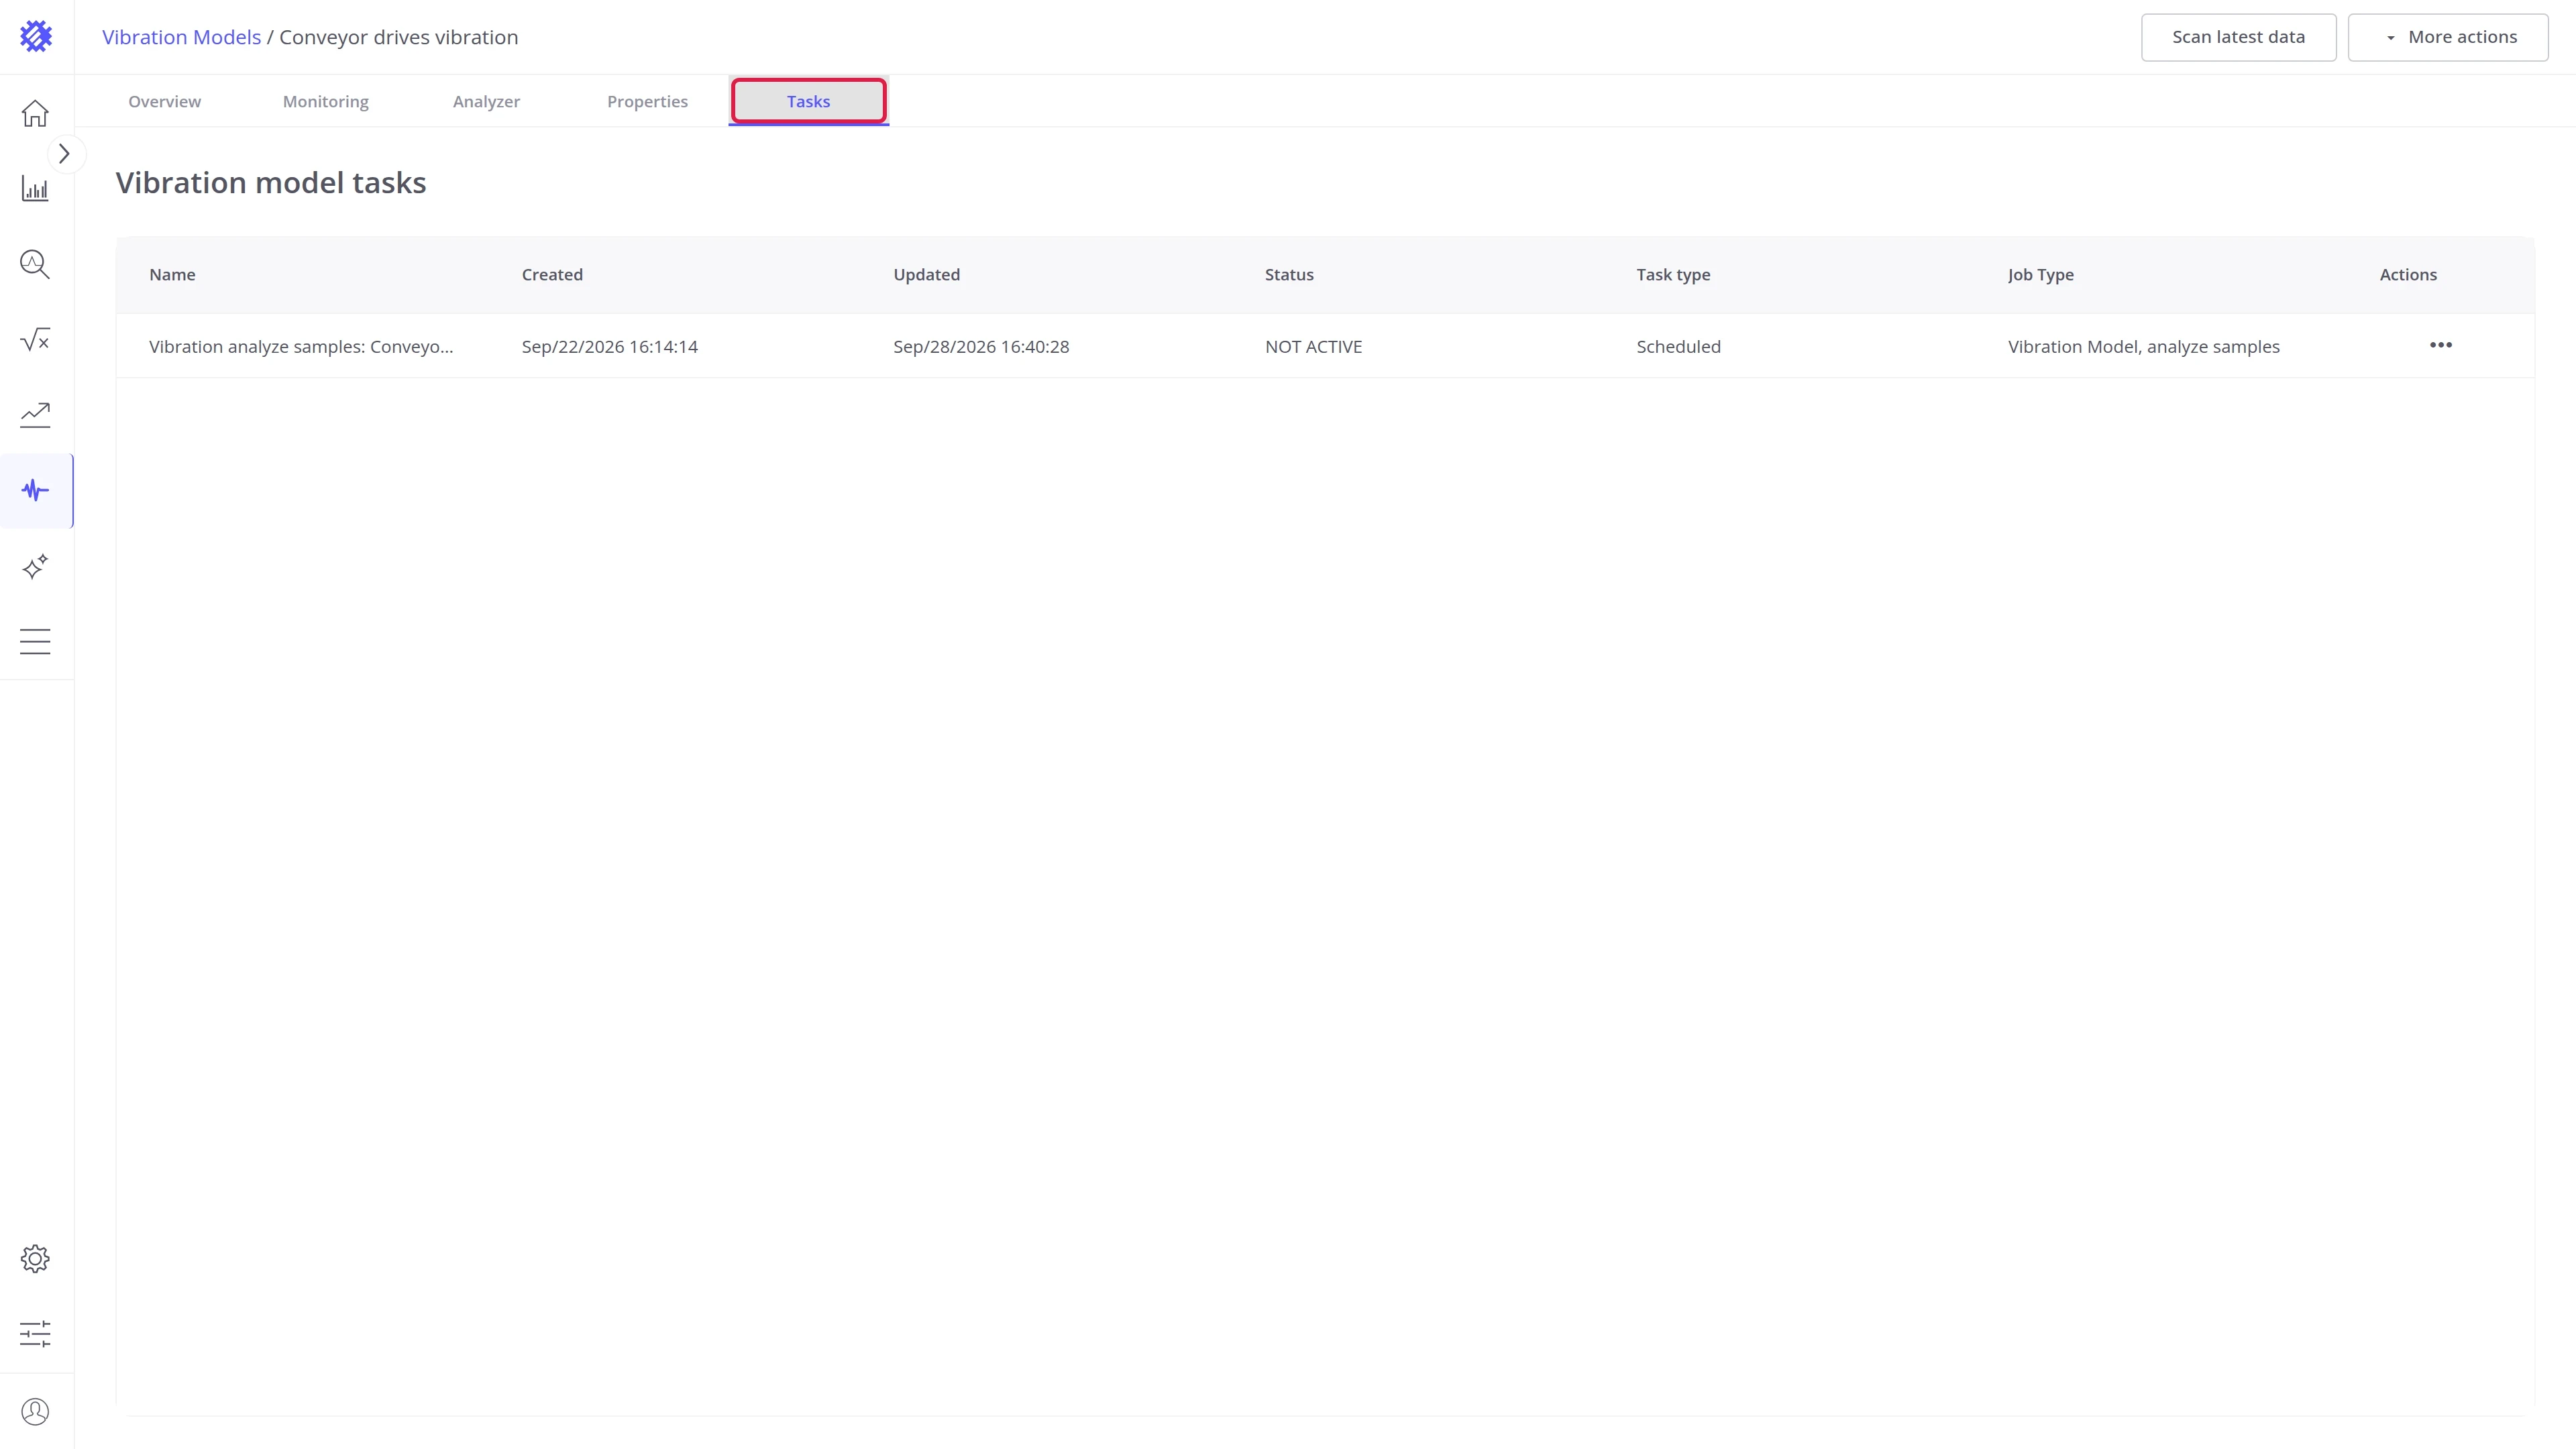
| Column | Description |
|---|---|
| Name | The task name: Vibration analyze samples and the model name |
| Created | When the task was created |
| Updated | When the task last changed |
| Status | RUNNING while an execution is in progress, NOT ACTIVE between runs |
| Task type | Scheduled while scheduled scanning is on, Run Once while it is off |
| Job Type | Always Vibration Model, analyze samples |
| Actions | The row menu |
Row menu
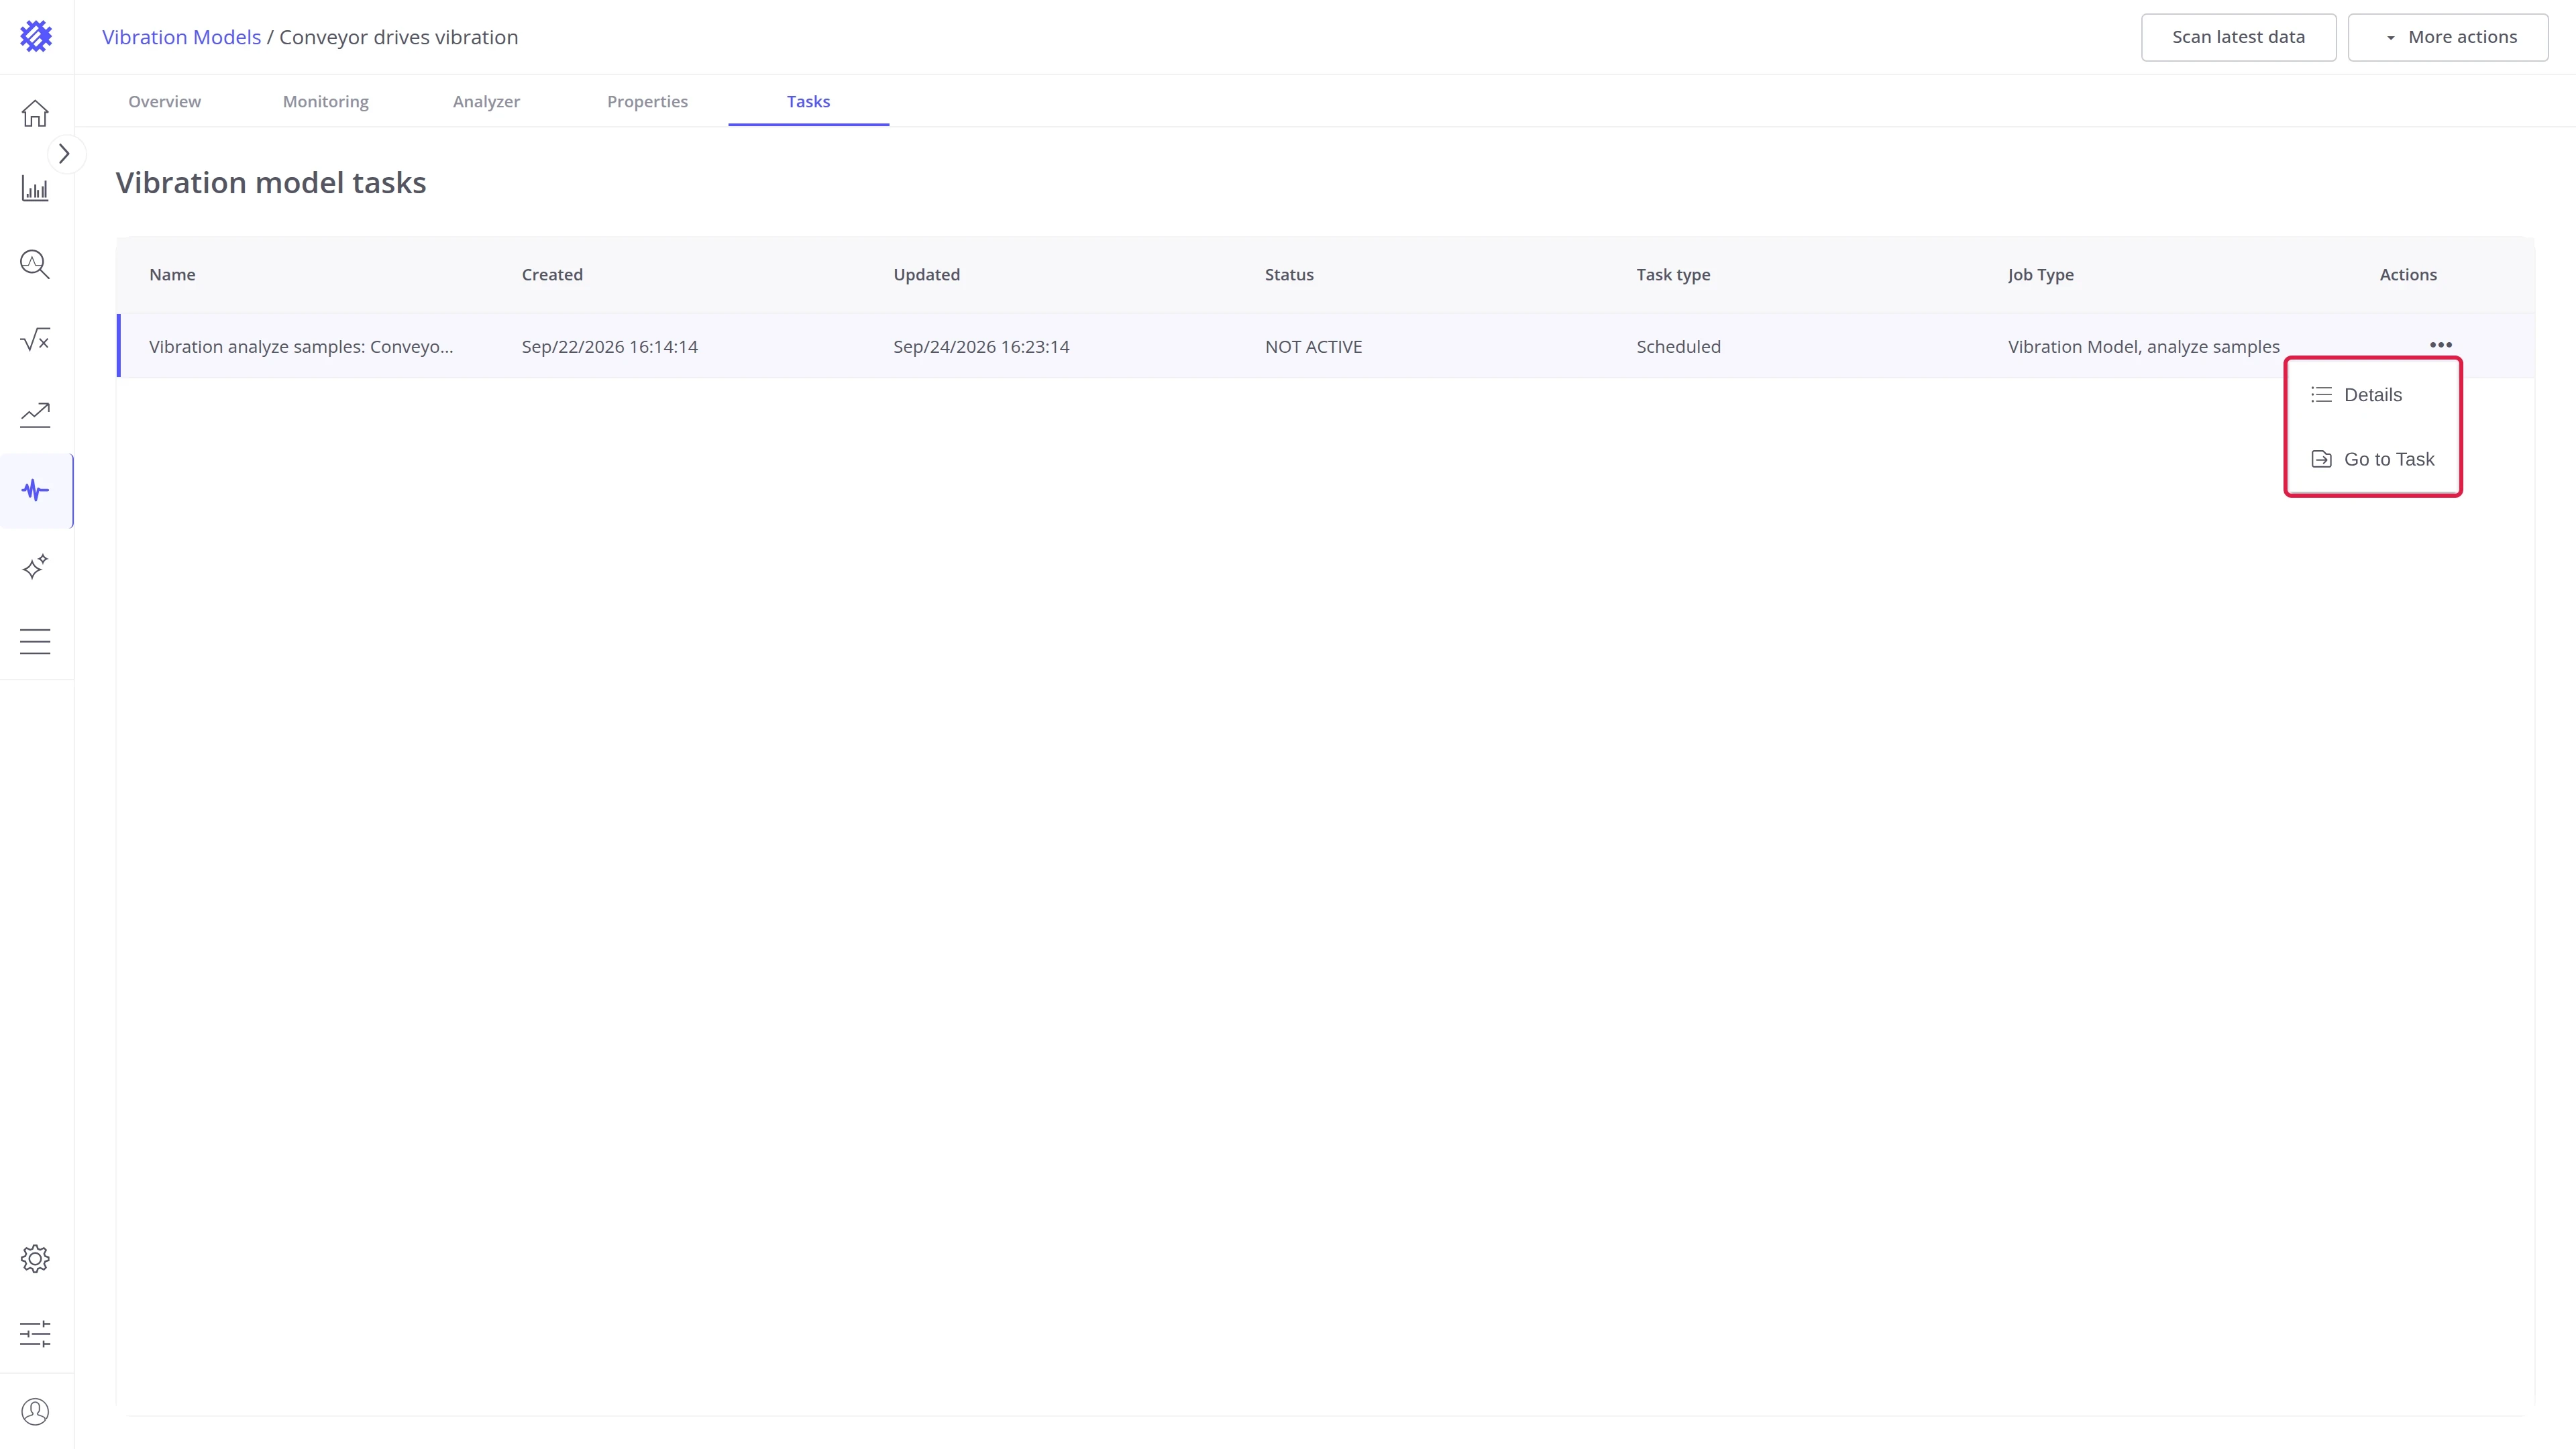
The ⋯ menu at the end of a row holds two actions:
- Details opens the executions of the task. Clicking the row does the same.
- Go to Task opens the task on the global Tasks page, in a new browser tab. The page is described in Tasks service.
Task executions
Details opens Task Executions: one row per scan, newest first.
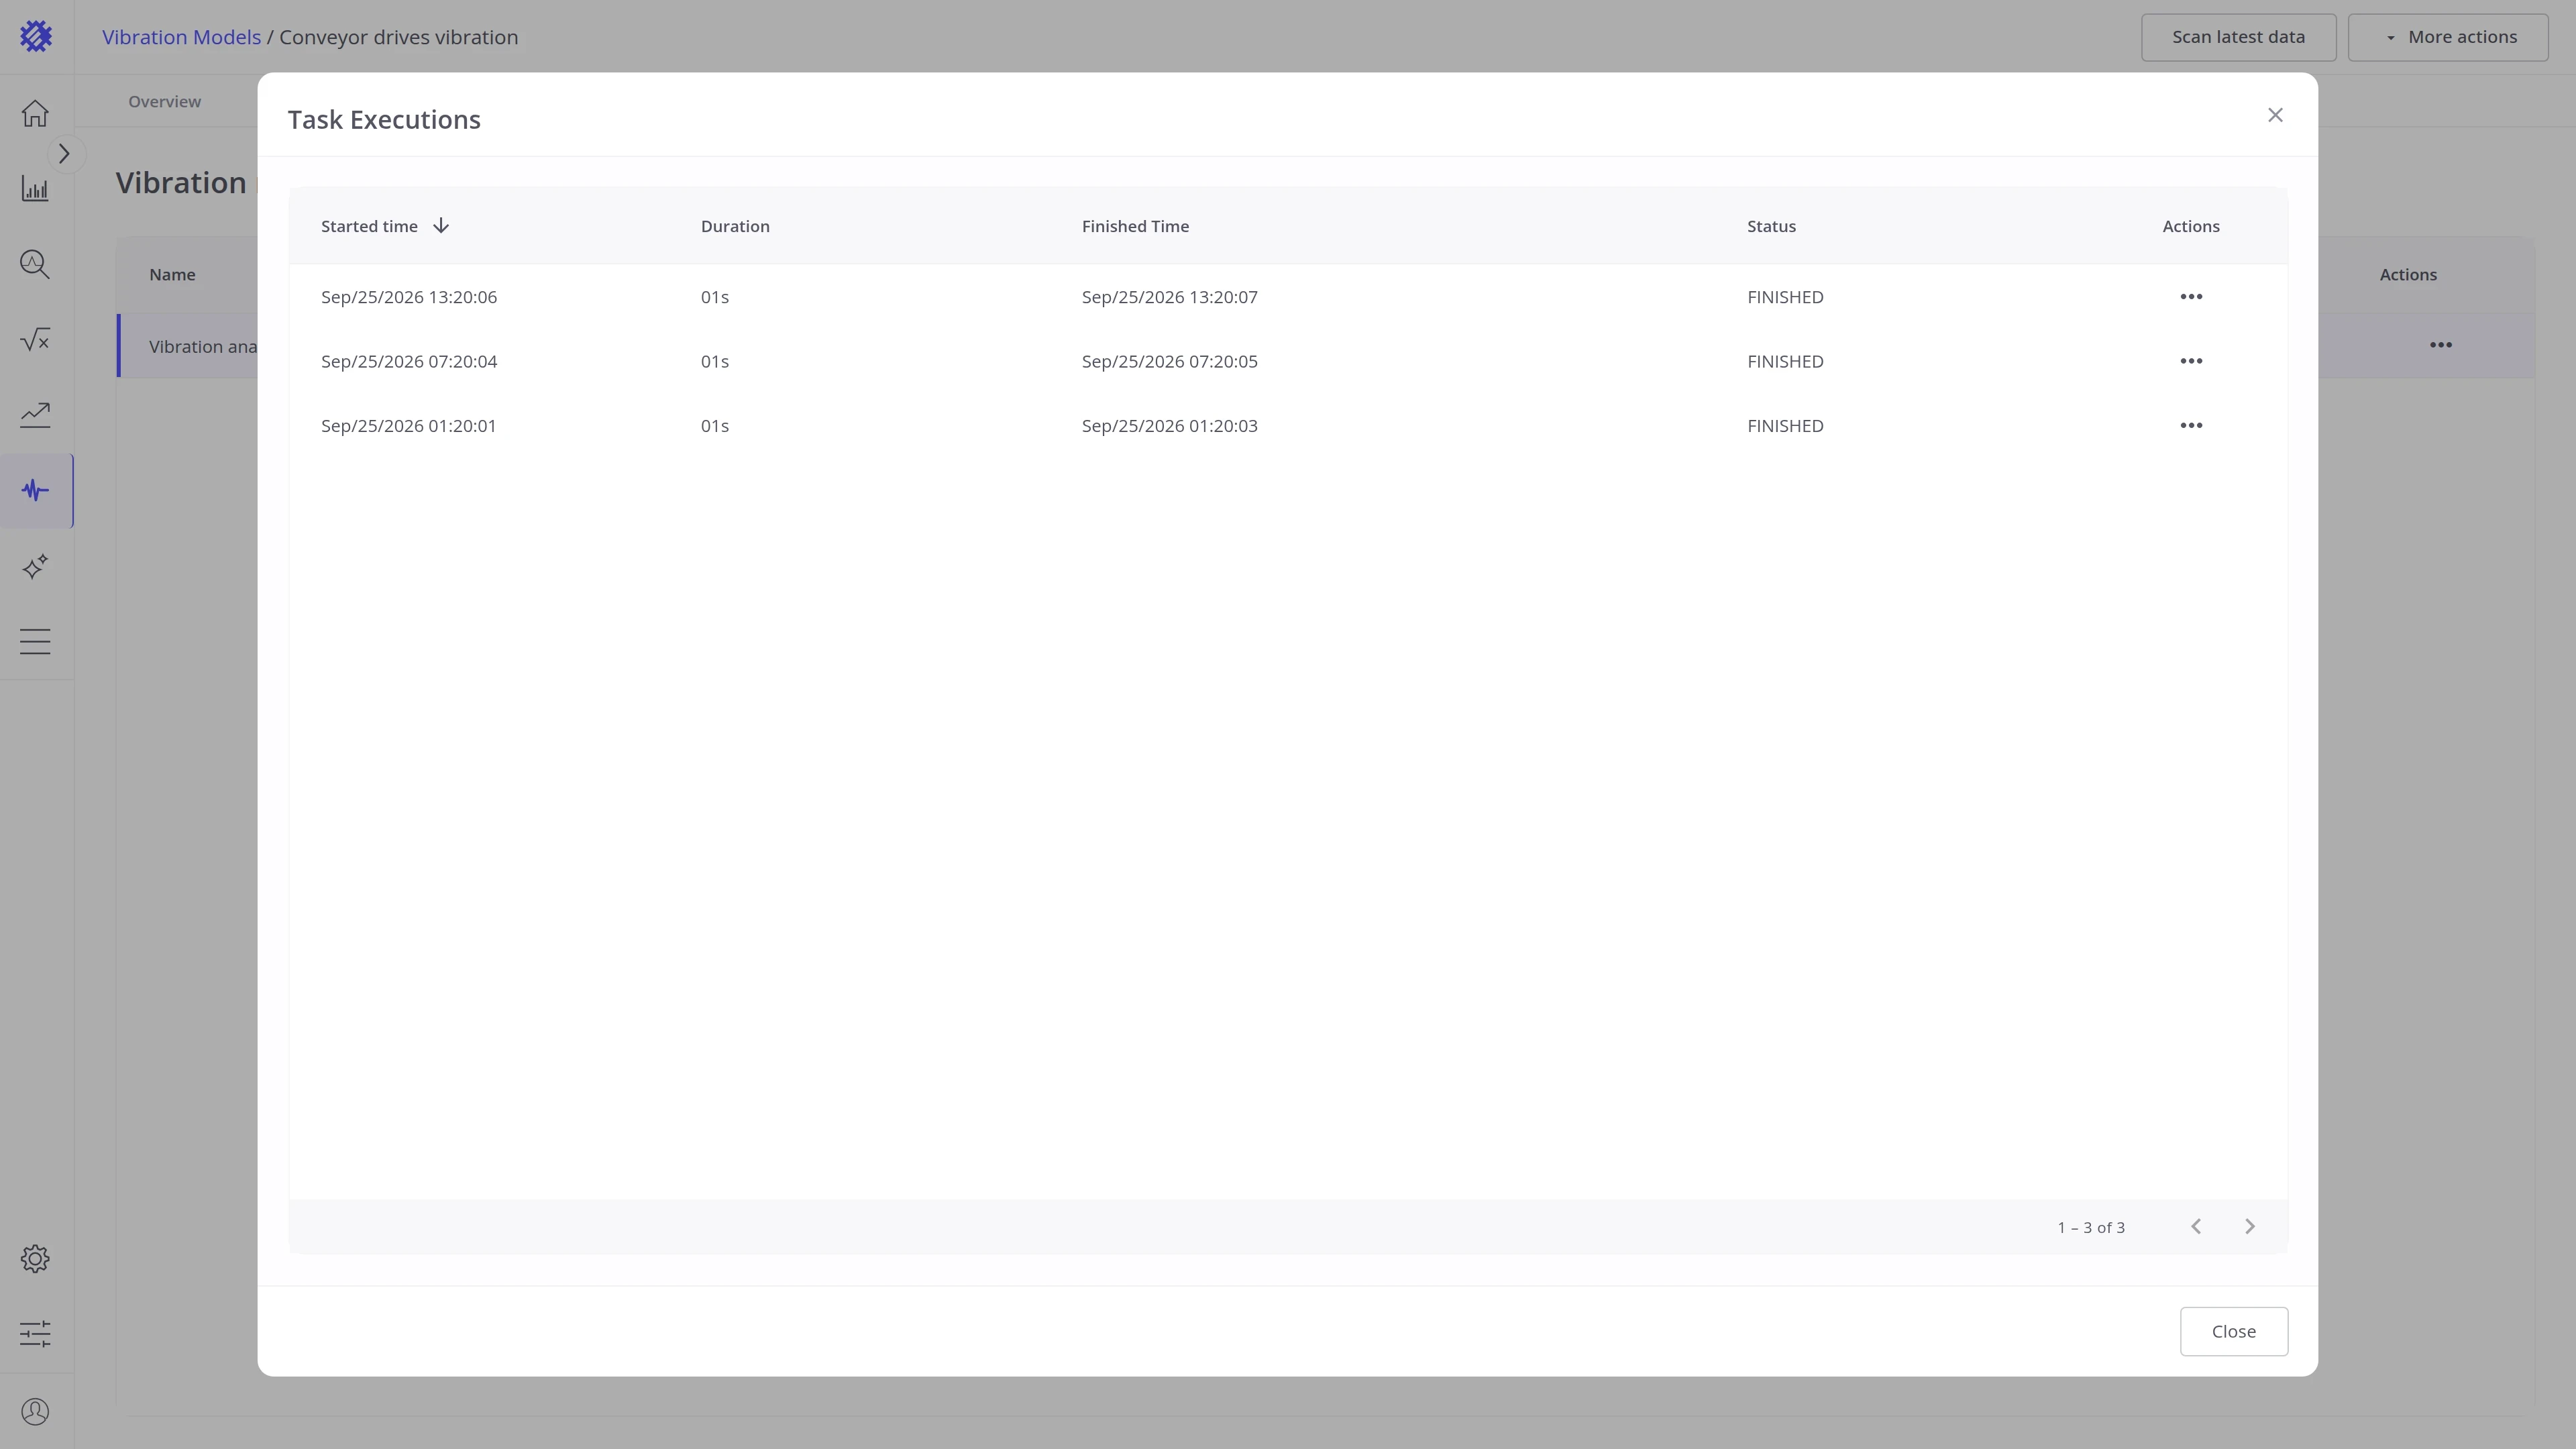
| Column | Description |
|---|---|
| Started time | When the run started |
| Duration | How long it took |
| Finished Time | When it ended |
| Status | CREATED, RUNNING, FINISHED, FAILED, CANCELED, or LOST |
| Actions | Stop cancels a run that is still going |
Click a finished or failed row to open its result. A failed run shows the error that stopped it.
Optional details
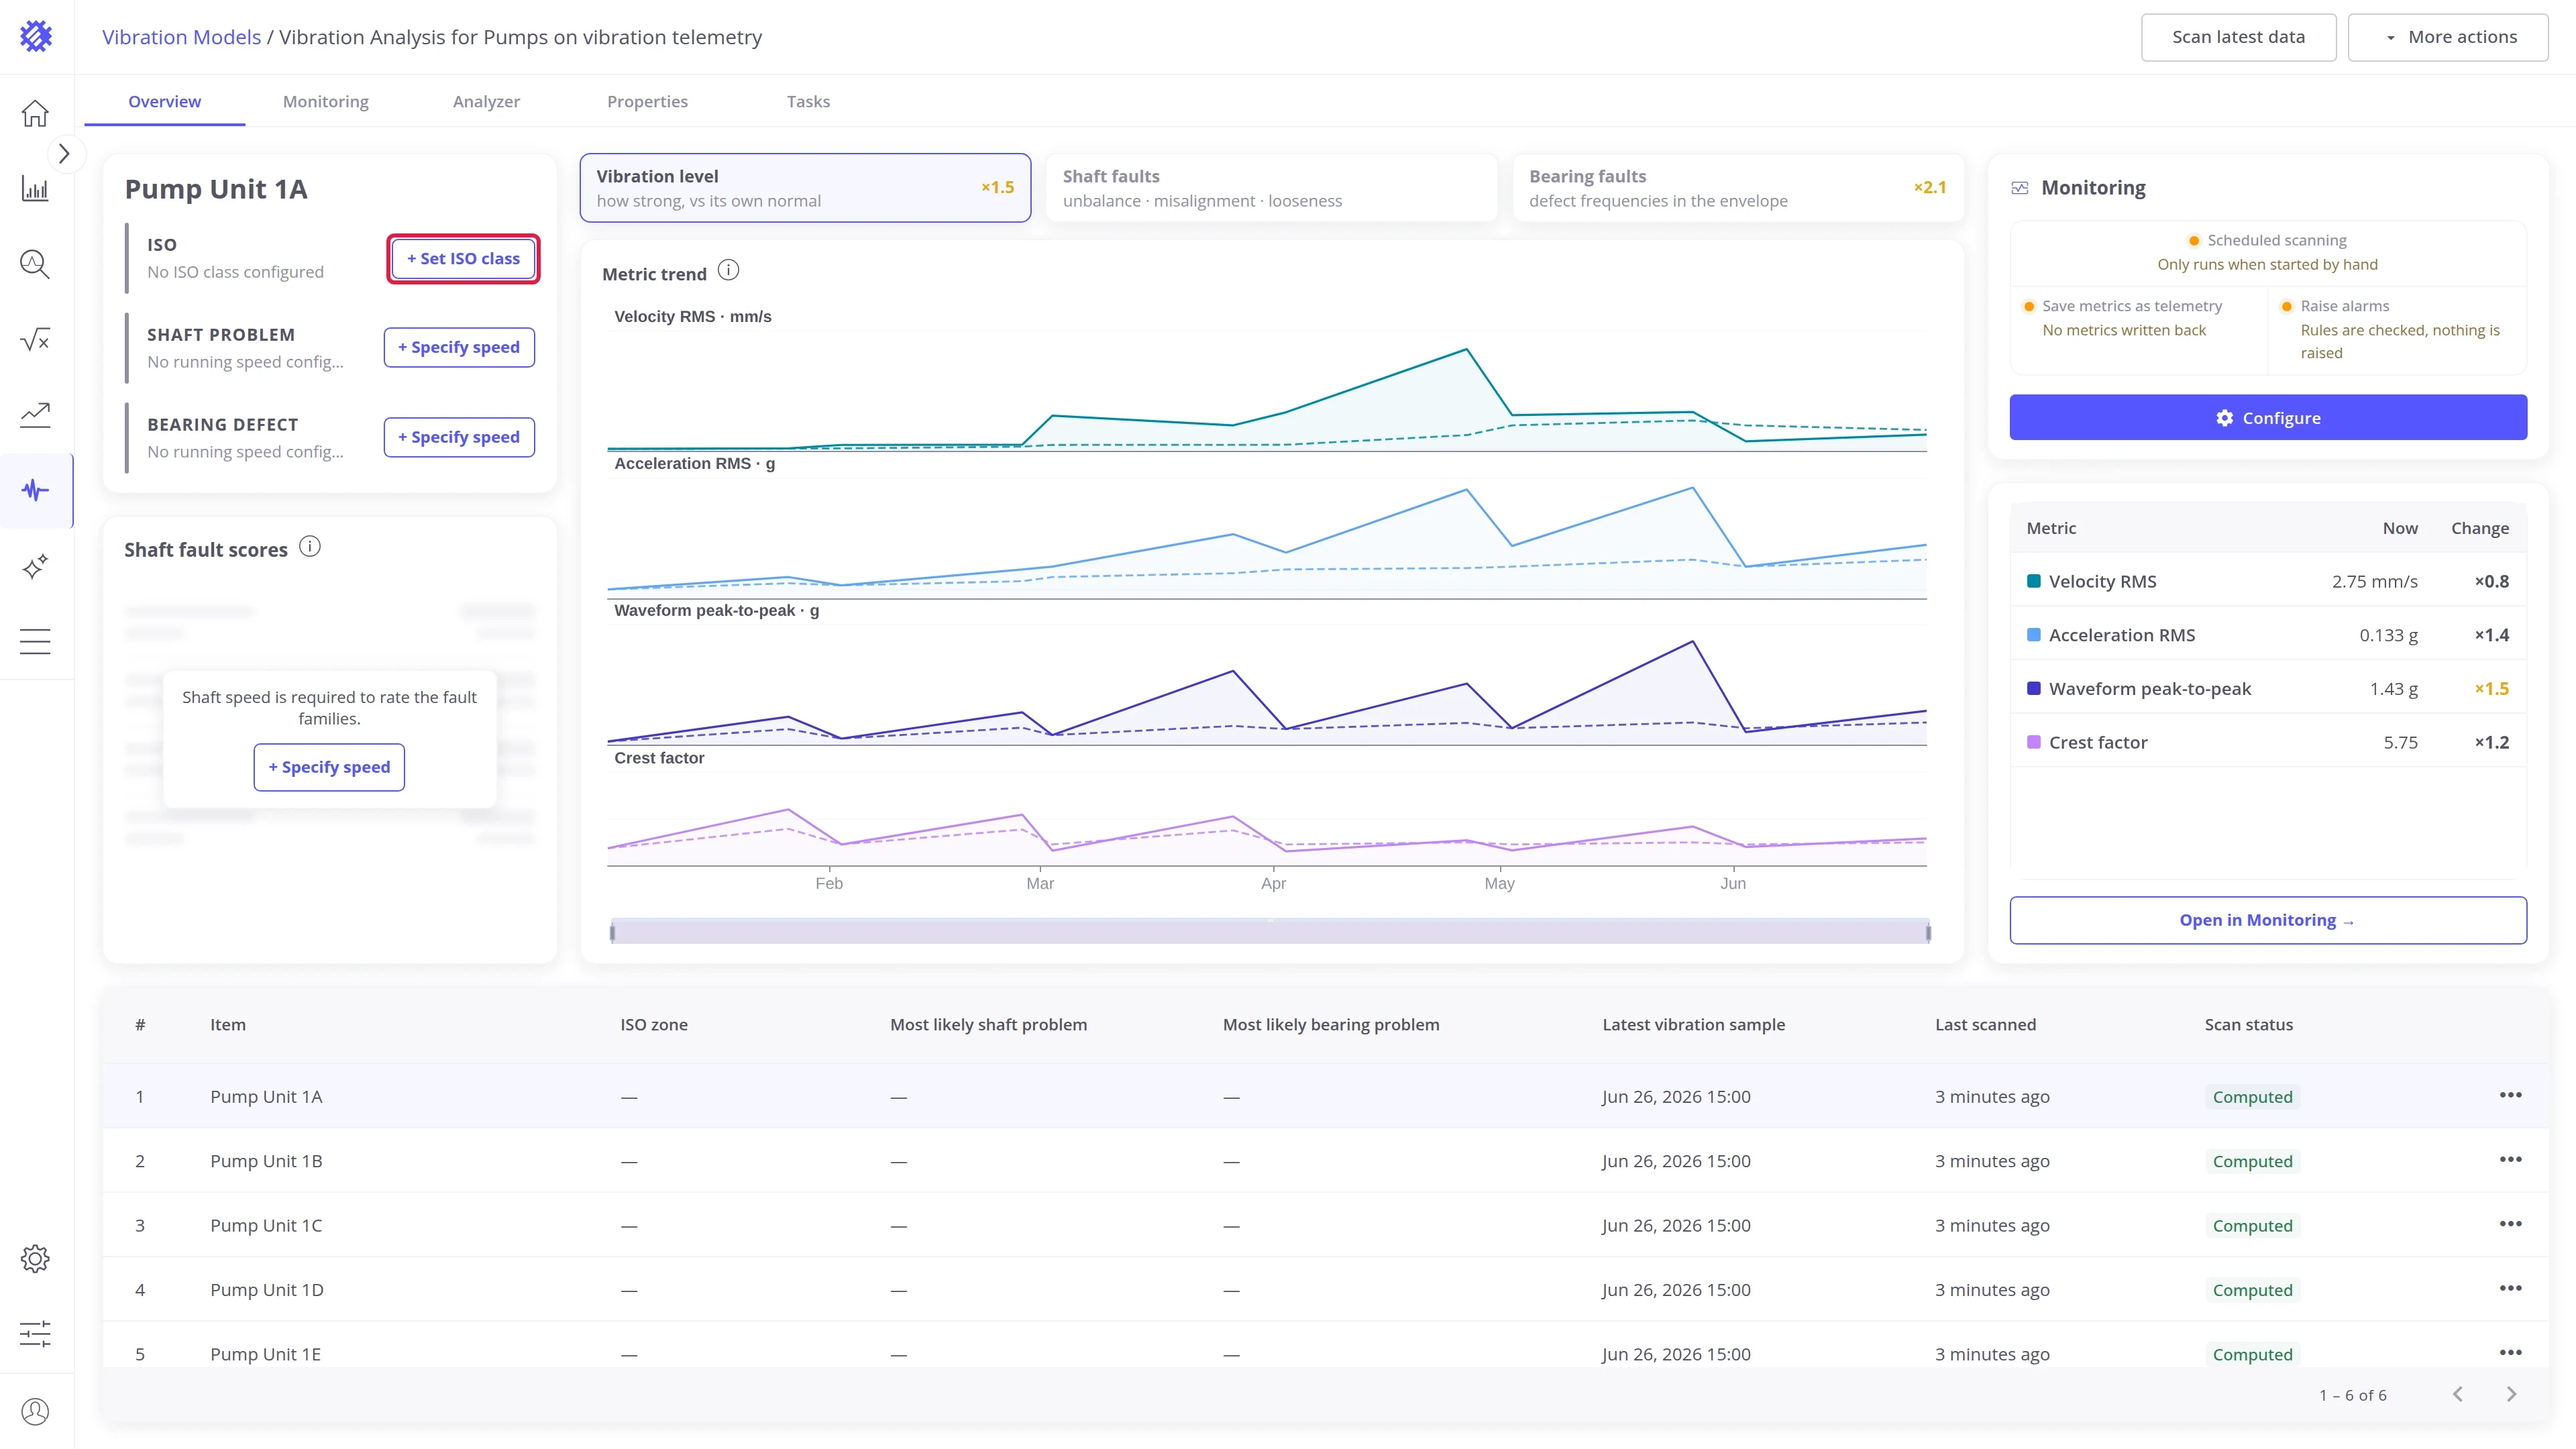
Section titled “Optional details”A model runs without ISO class, shaft speed, and bearings, but each one adds results. While one is missing, the status card on the Overview tab shows a button for it. The button opens a short dialog, and Save applies it to the model. The same settings are on the Properties tab.
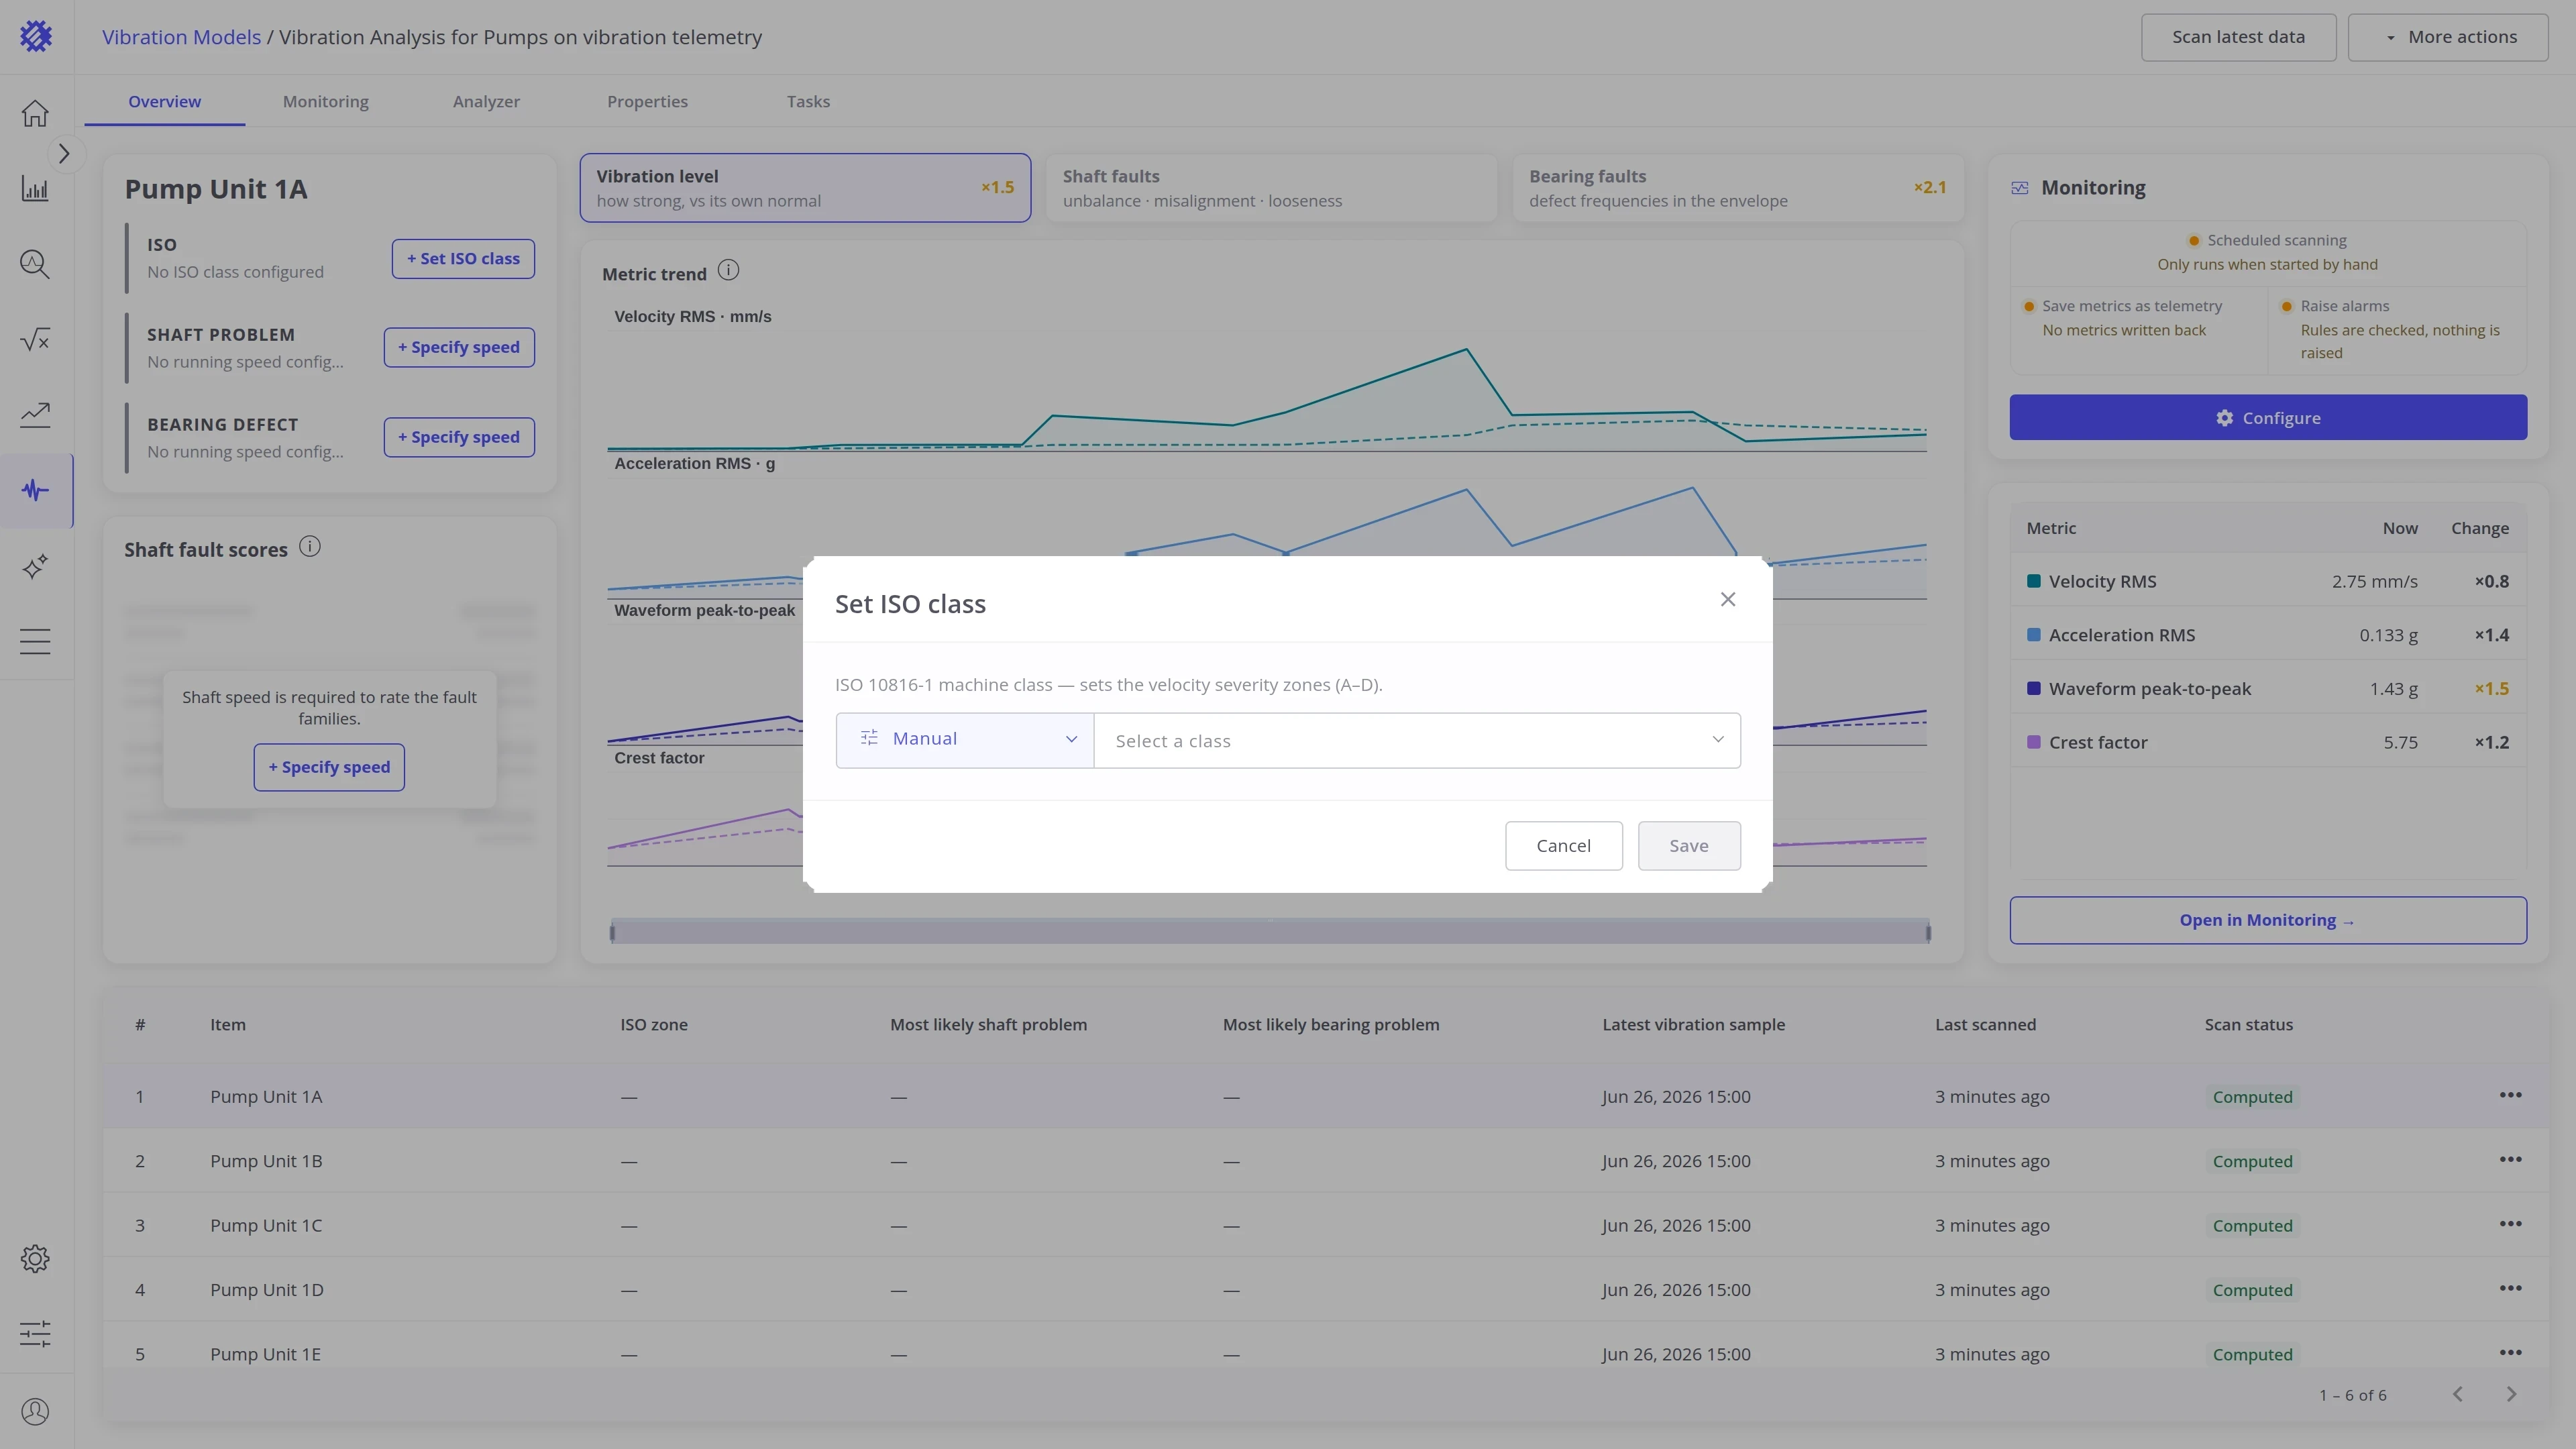
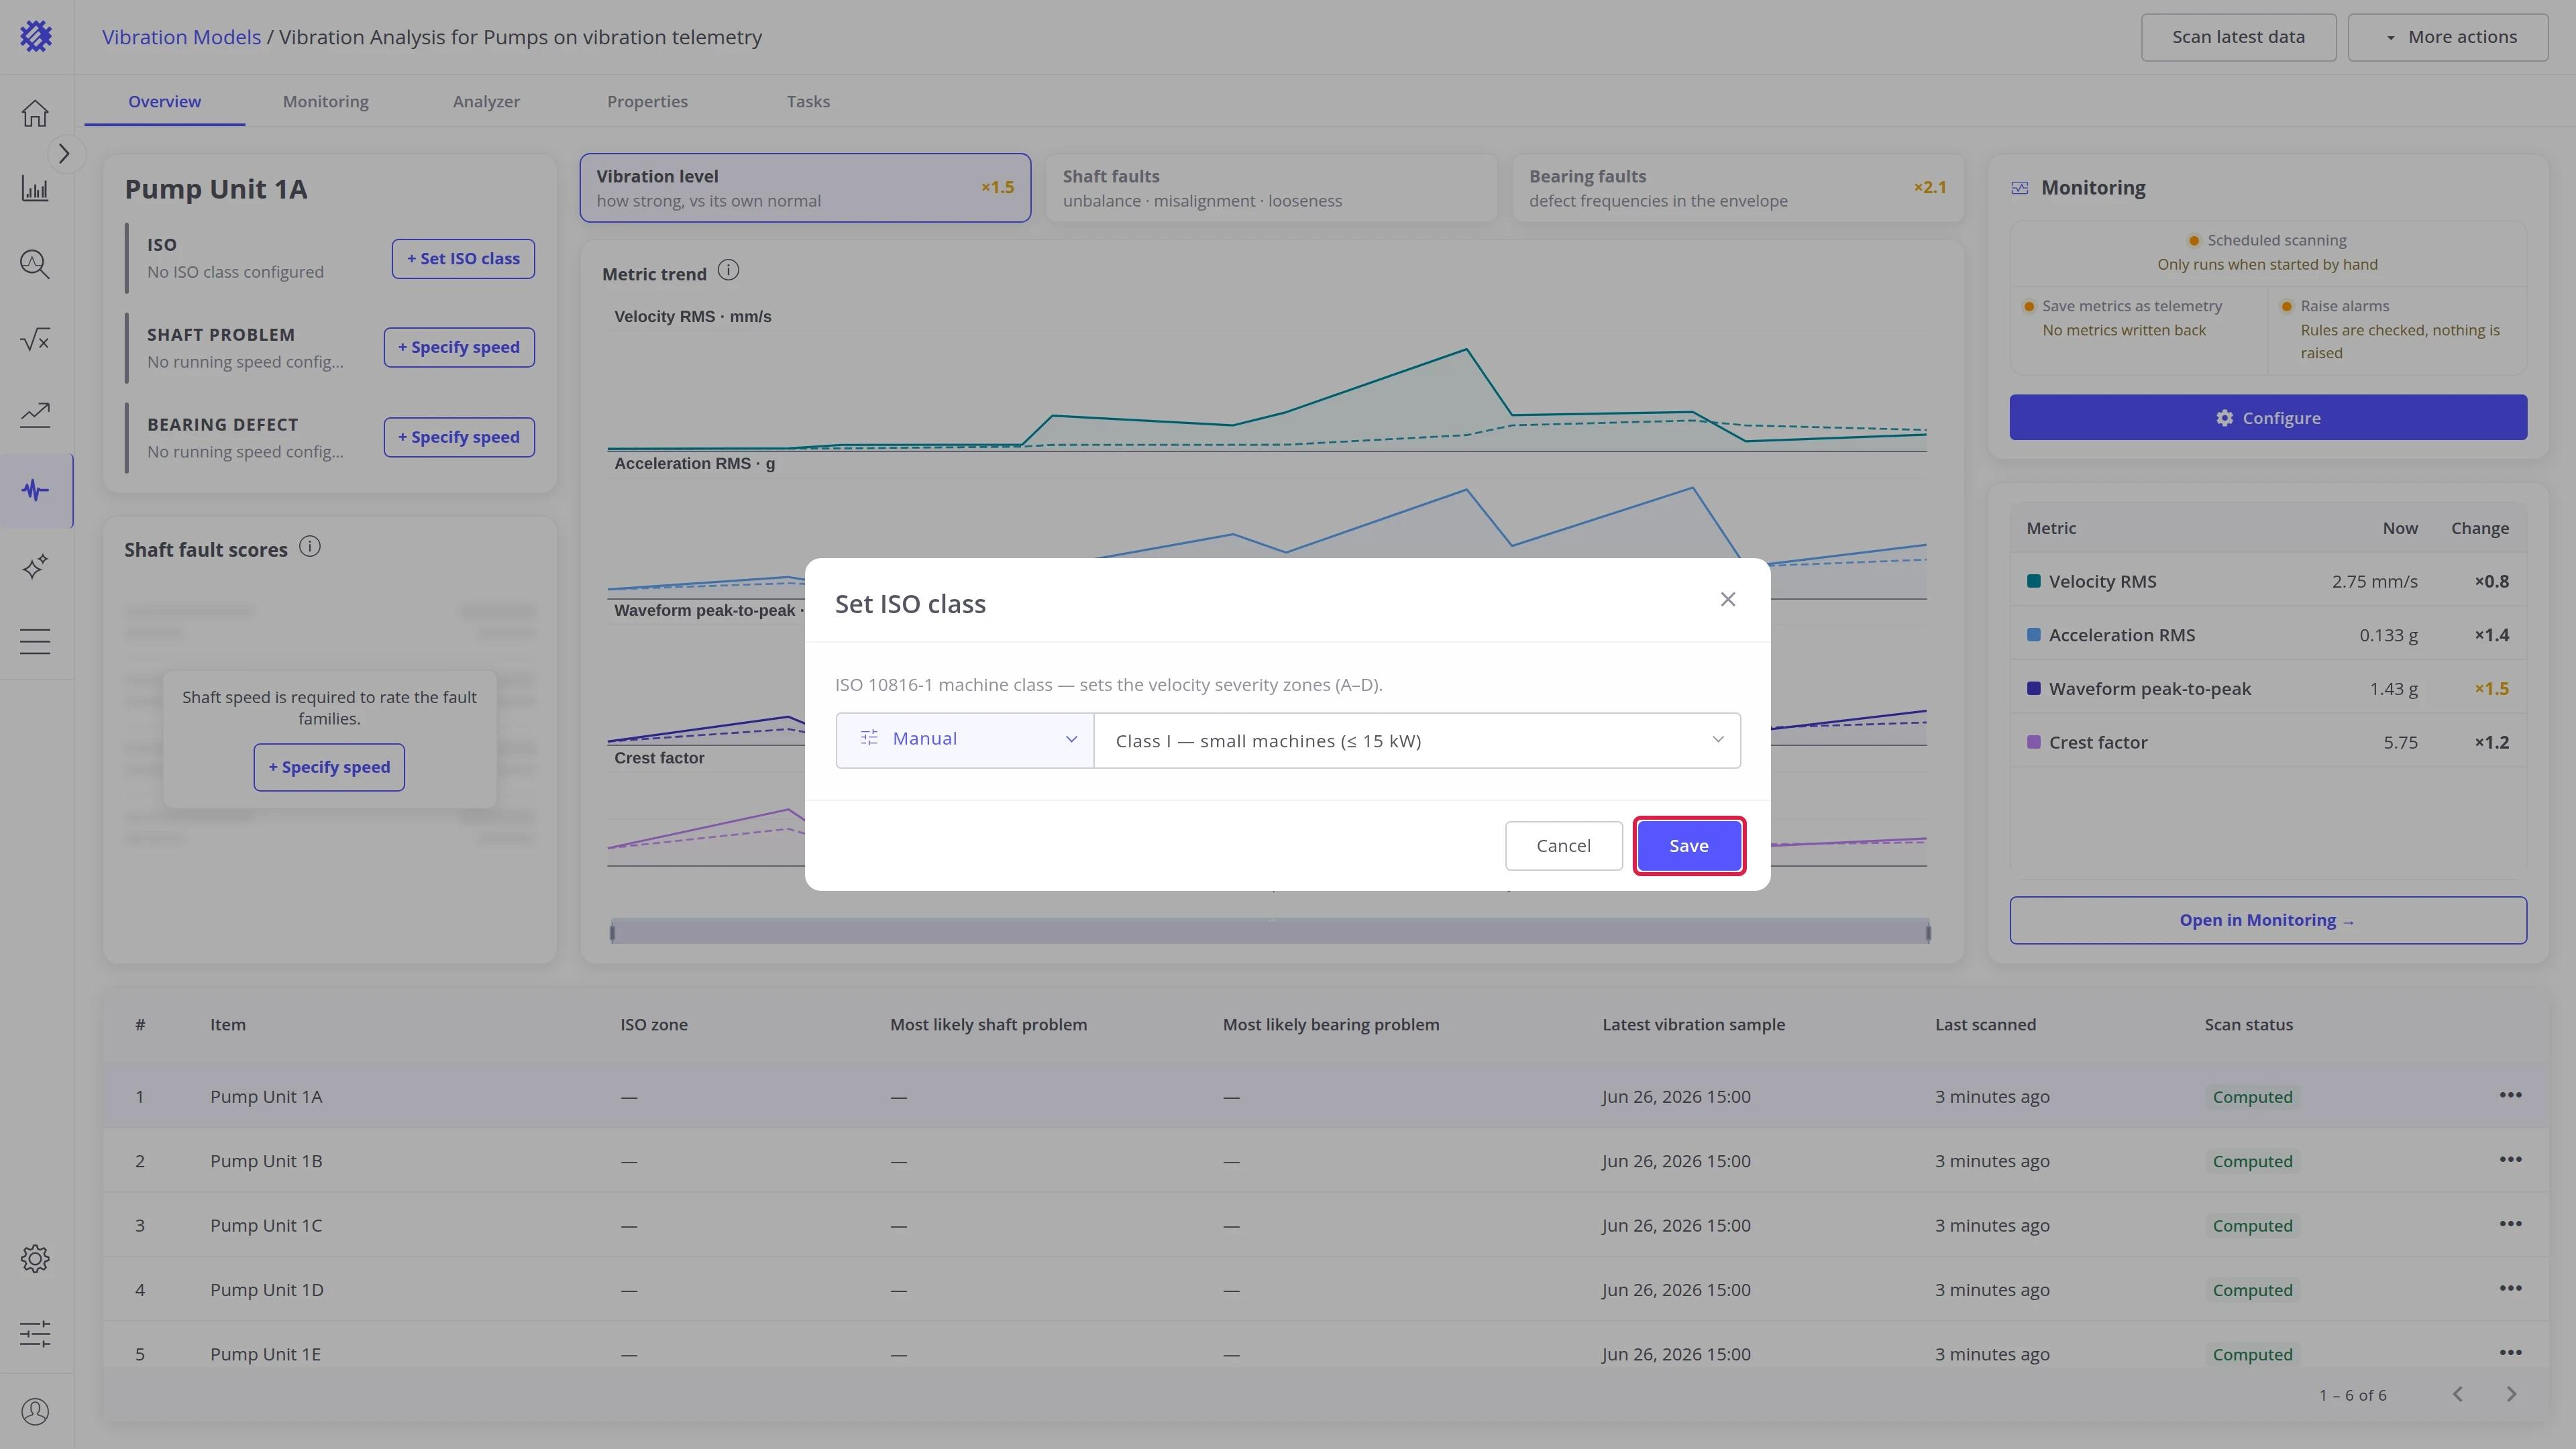
ISO class grades each machine into the ISO zones A to D. Click + Set ISO class, pick the class, and click Save. More options are described in Machine details.
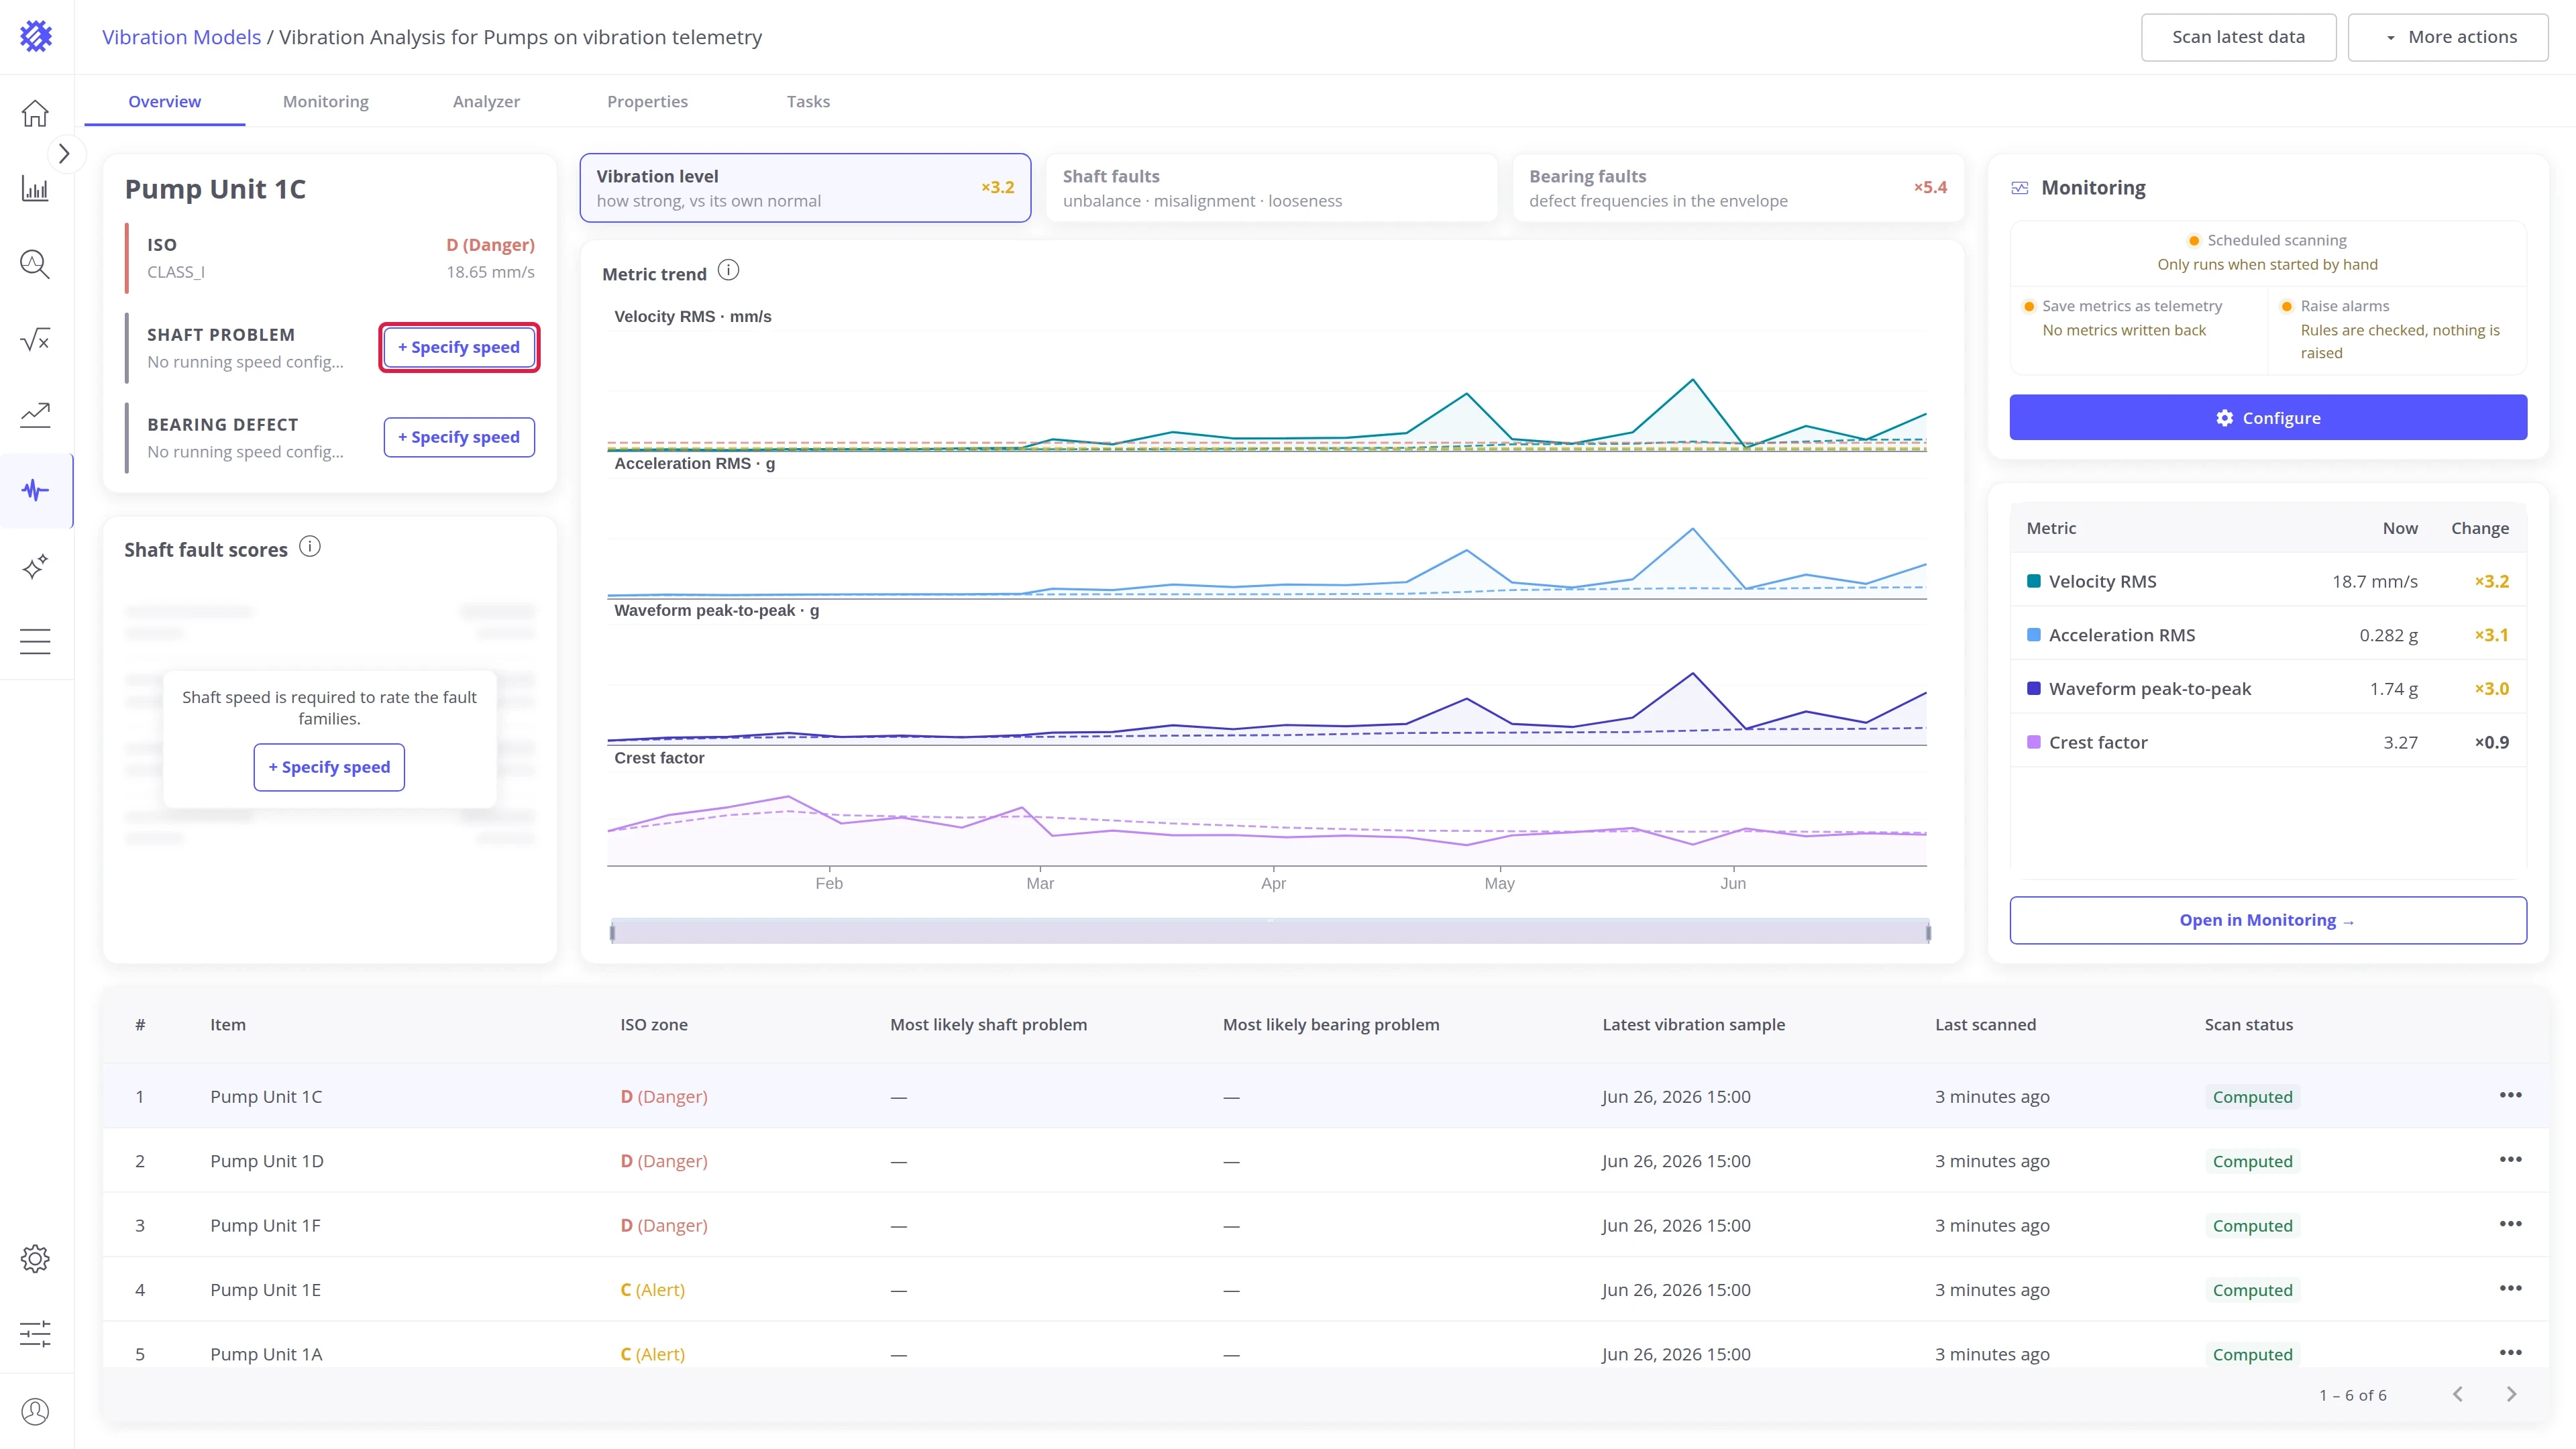
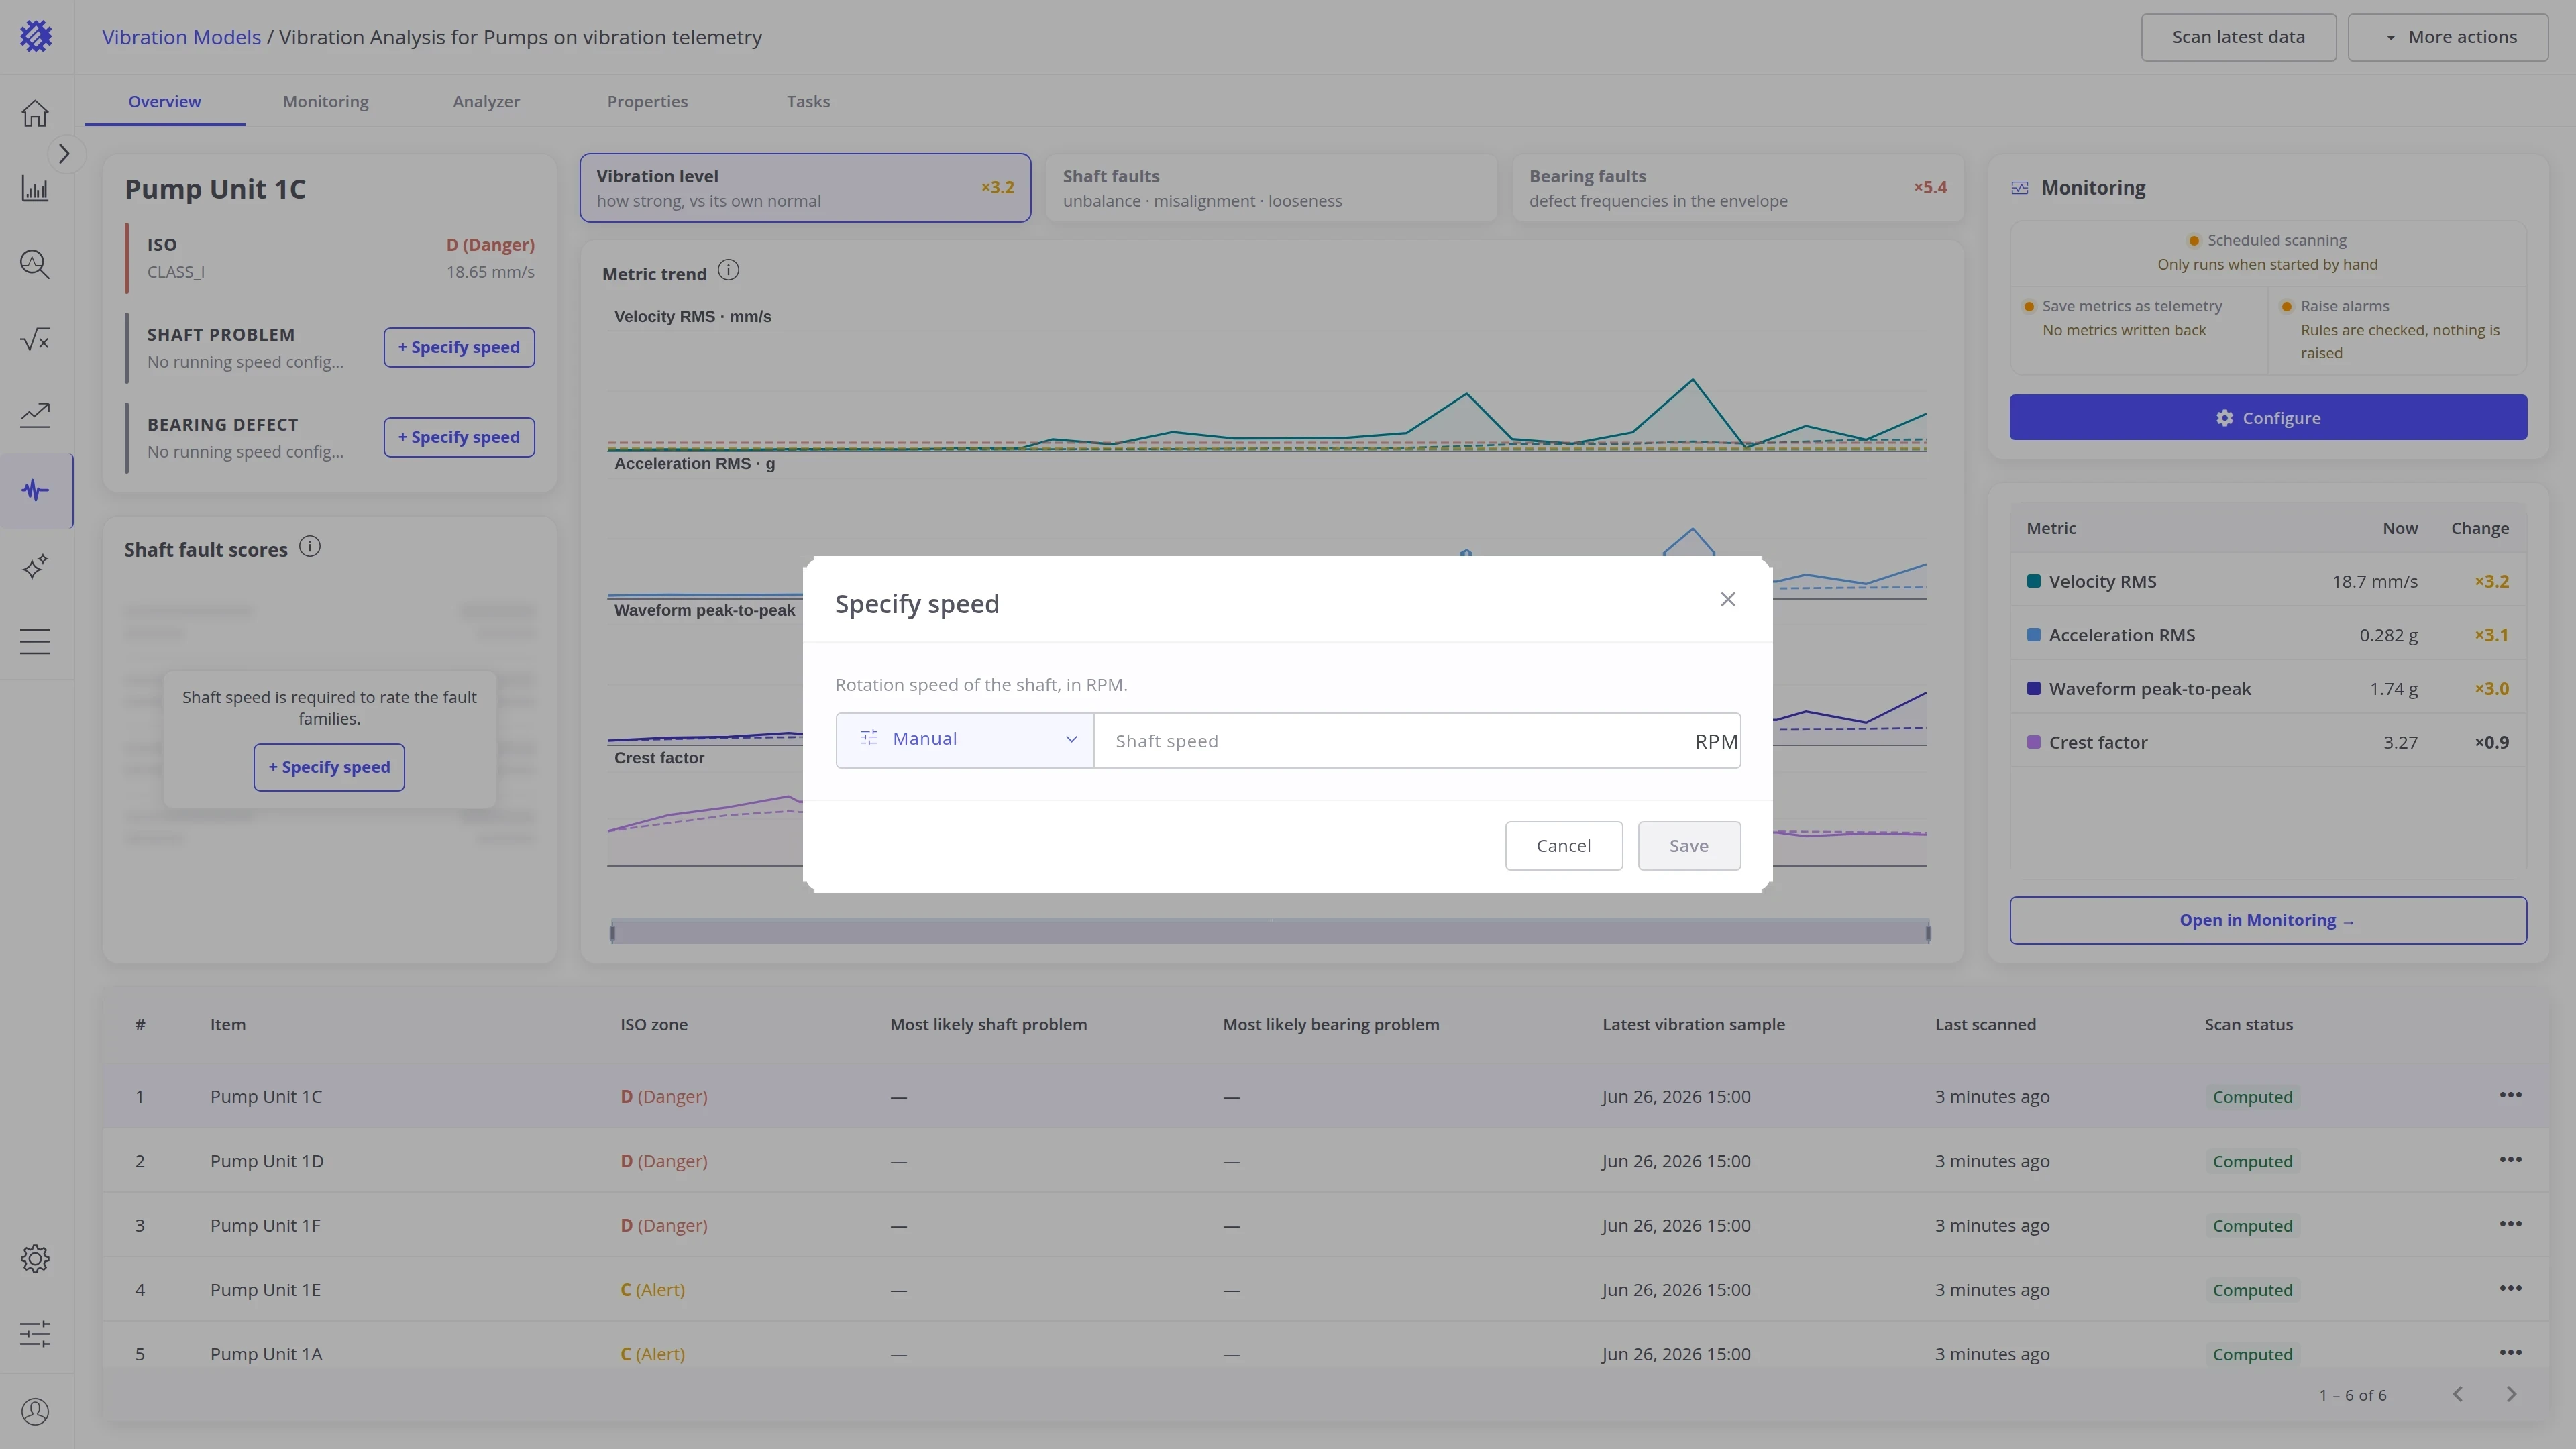
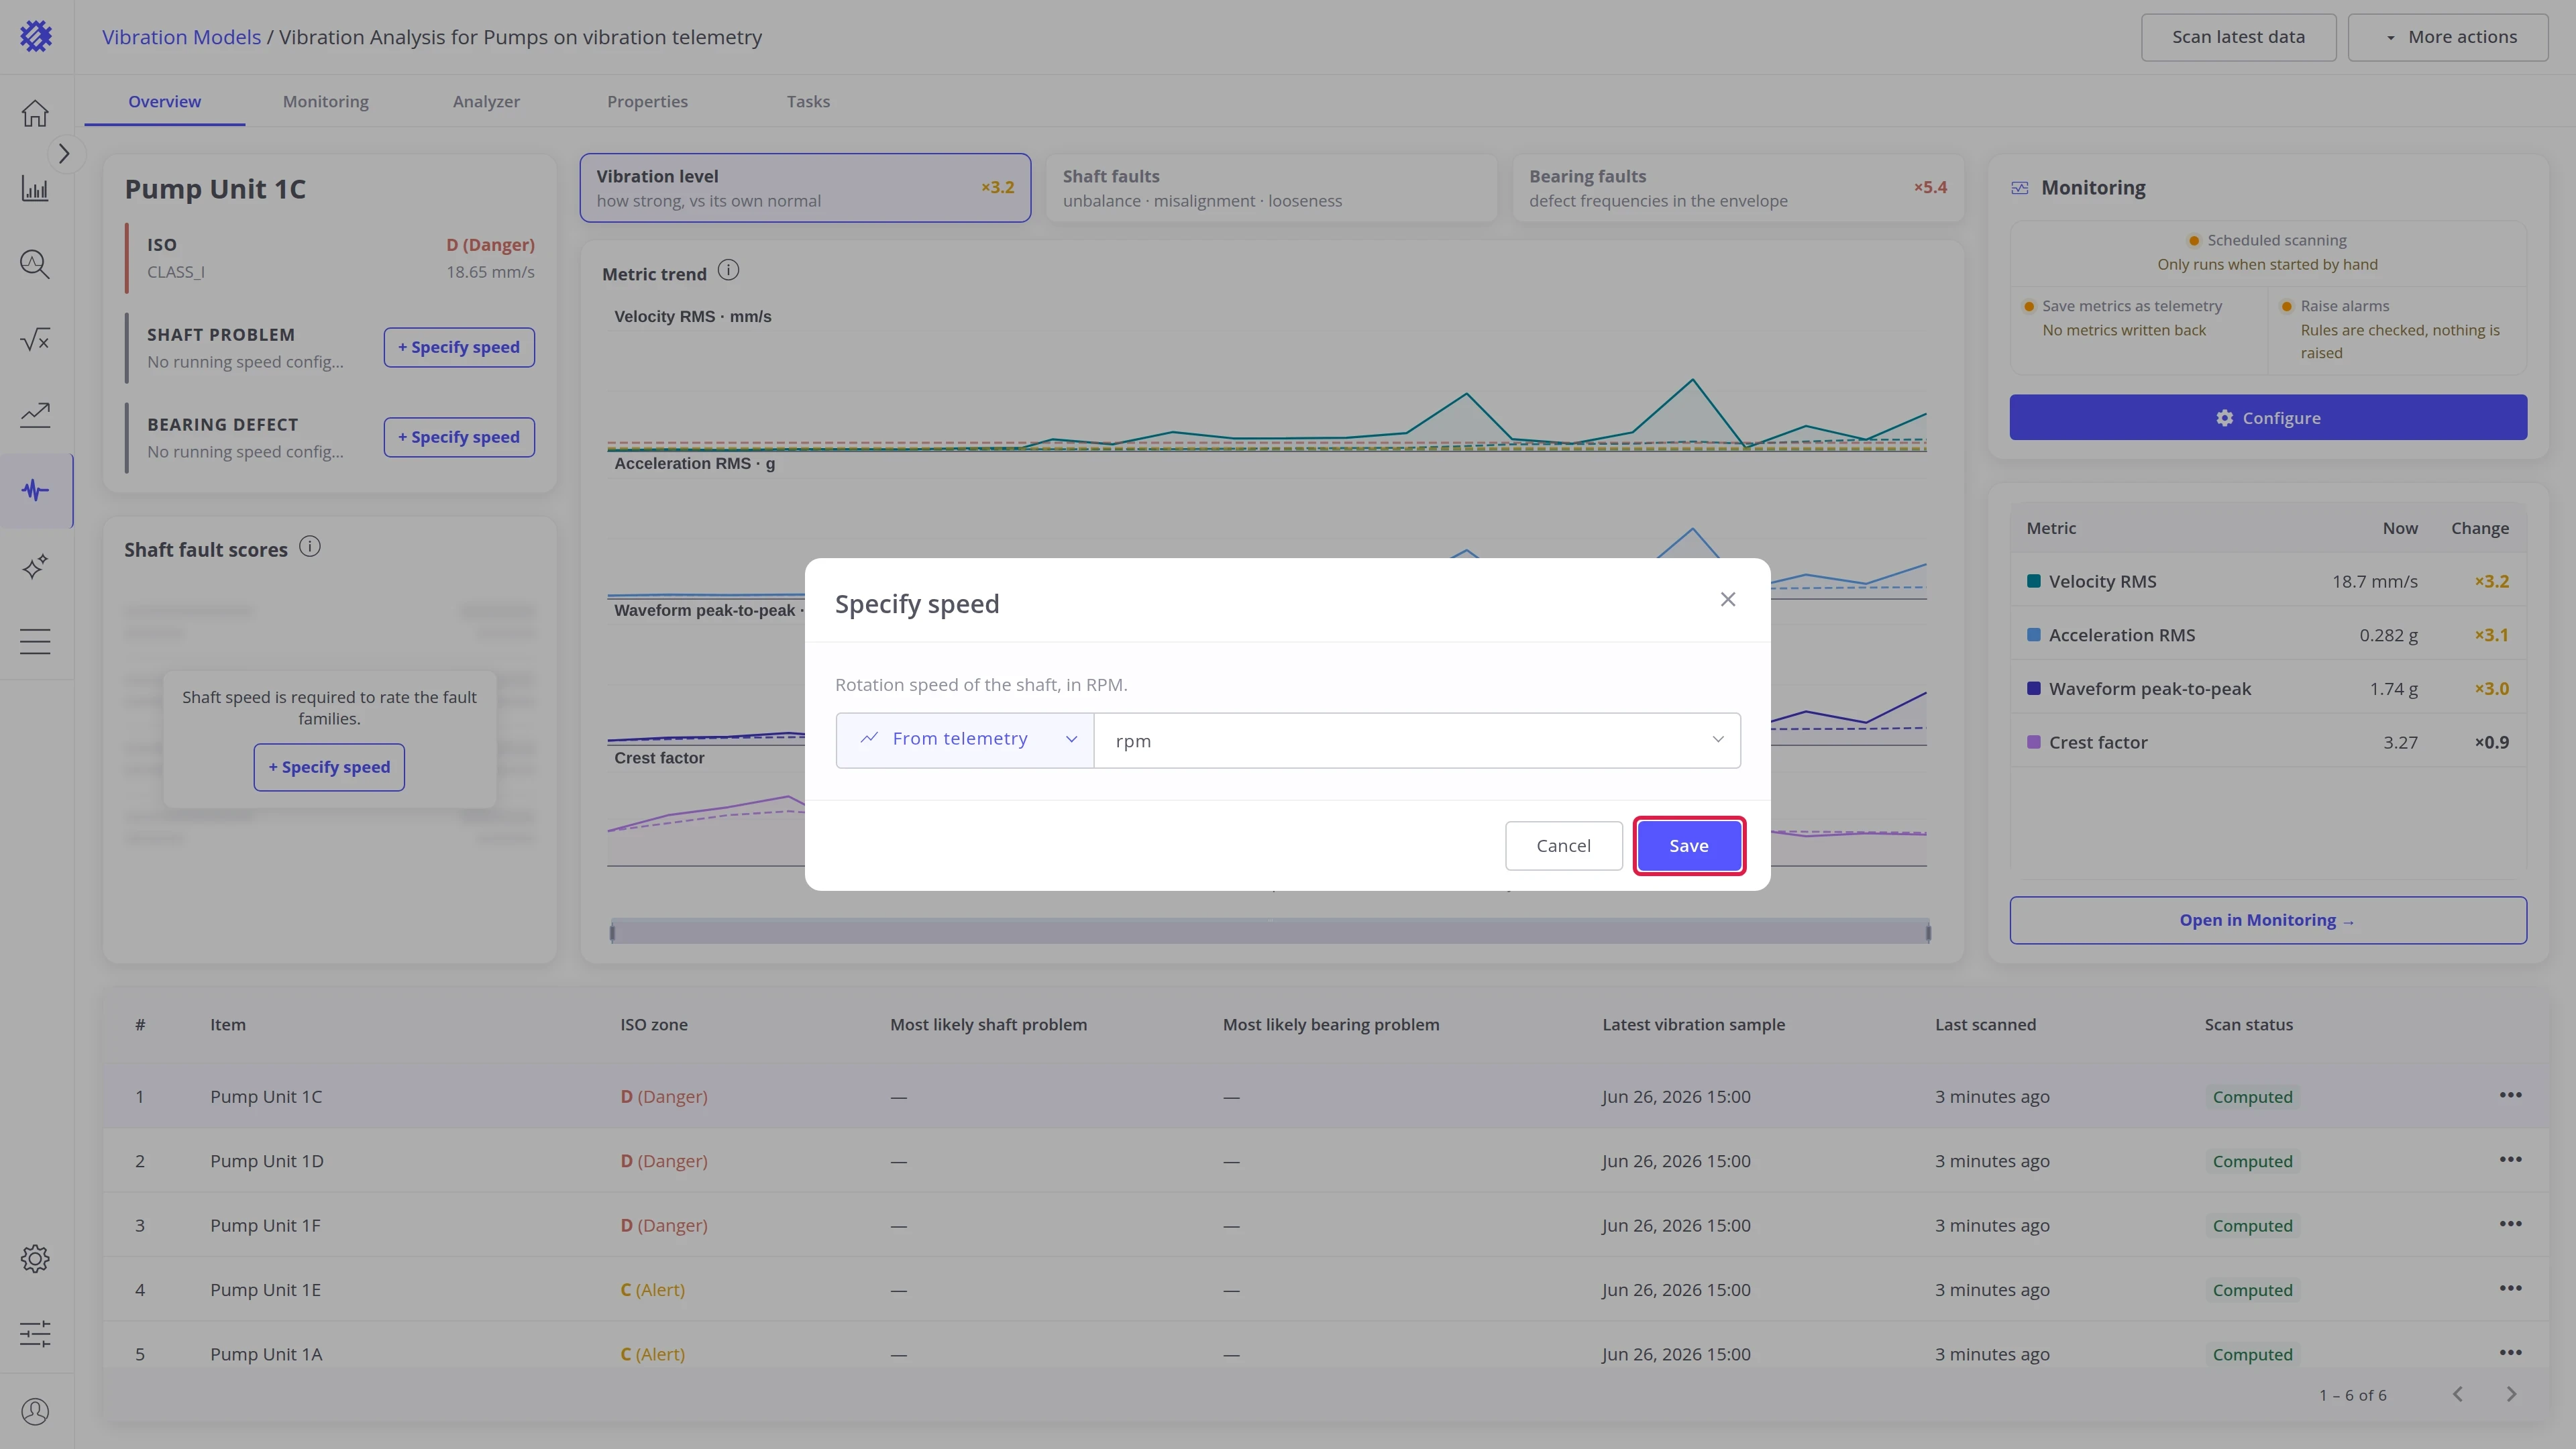
Shaft speed enables the frequency bands, the shaft fault scores, and the bearing fault frequencies in hertz. Click + Specify speed, enter the speed in RPM or read it from an attribute or a telemetry key, and click Save. More options are described in Machine details.
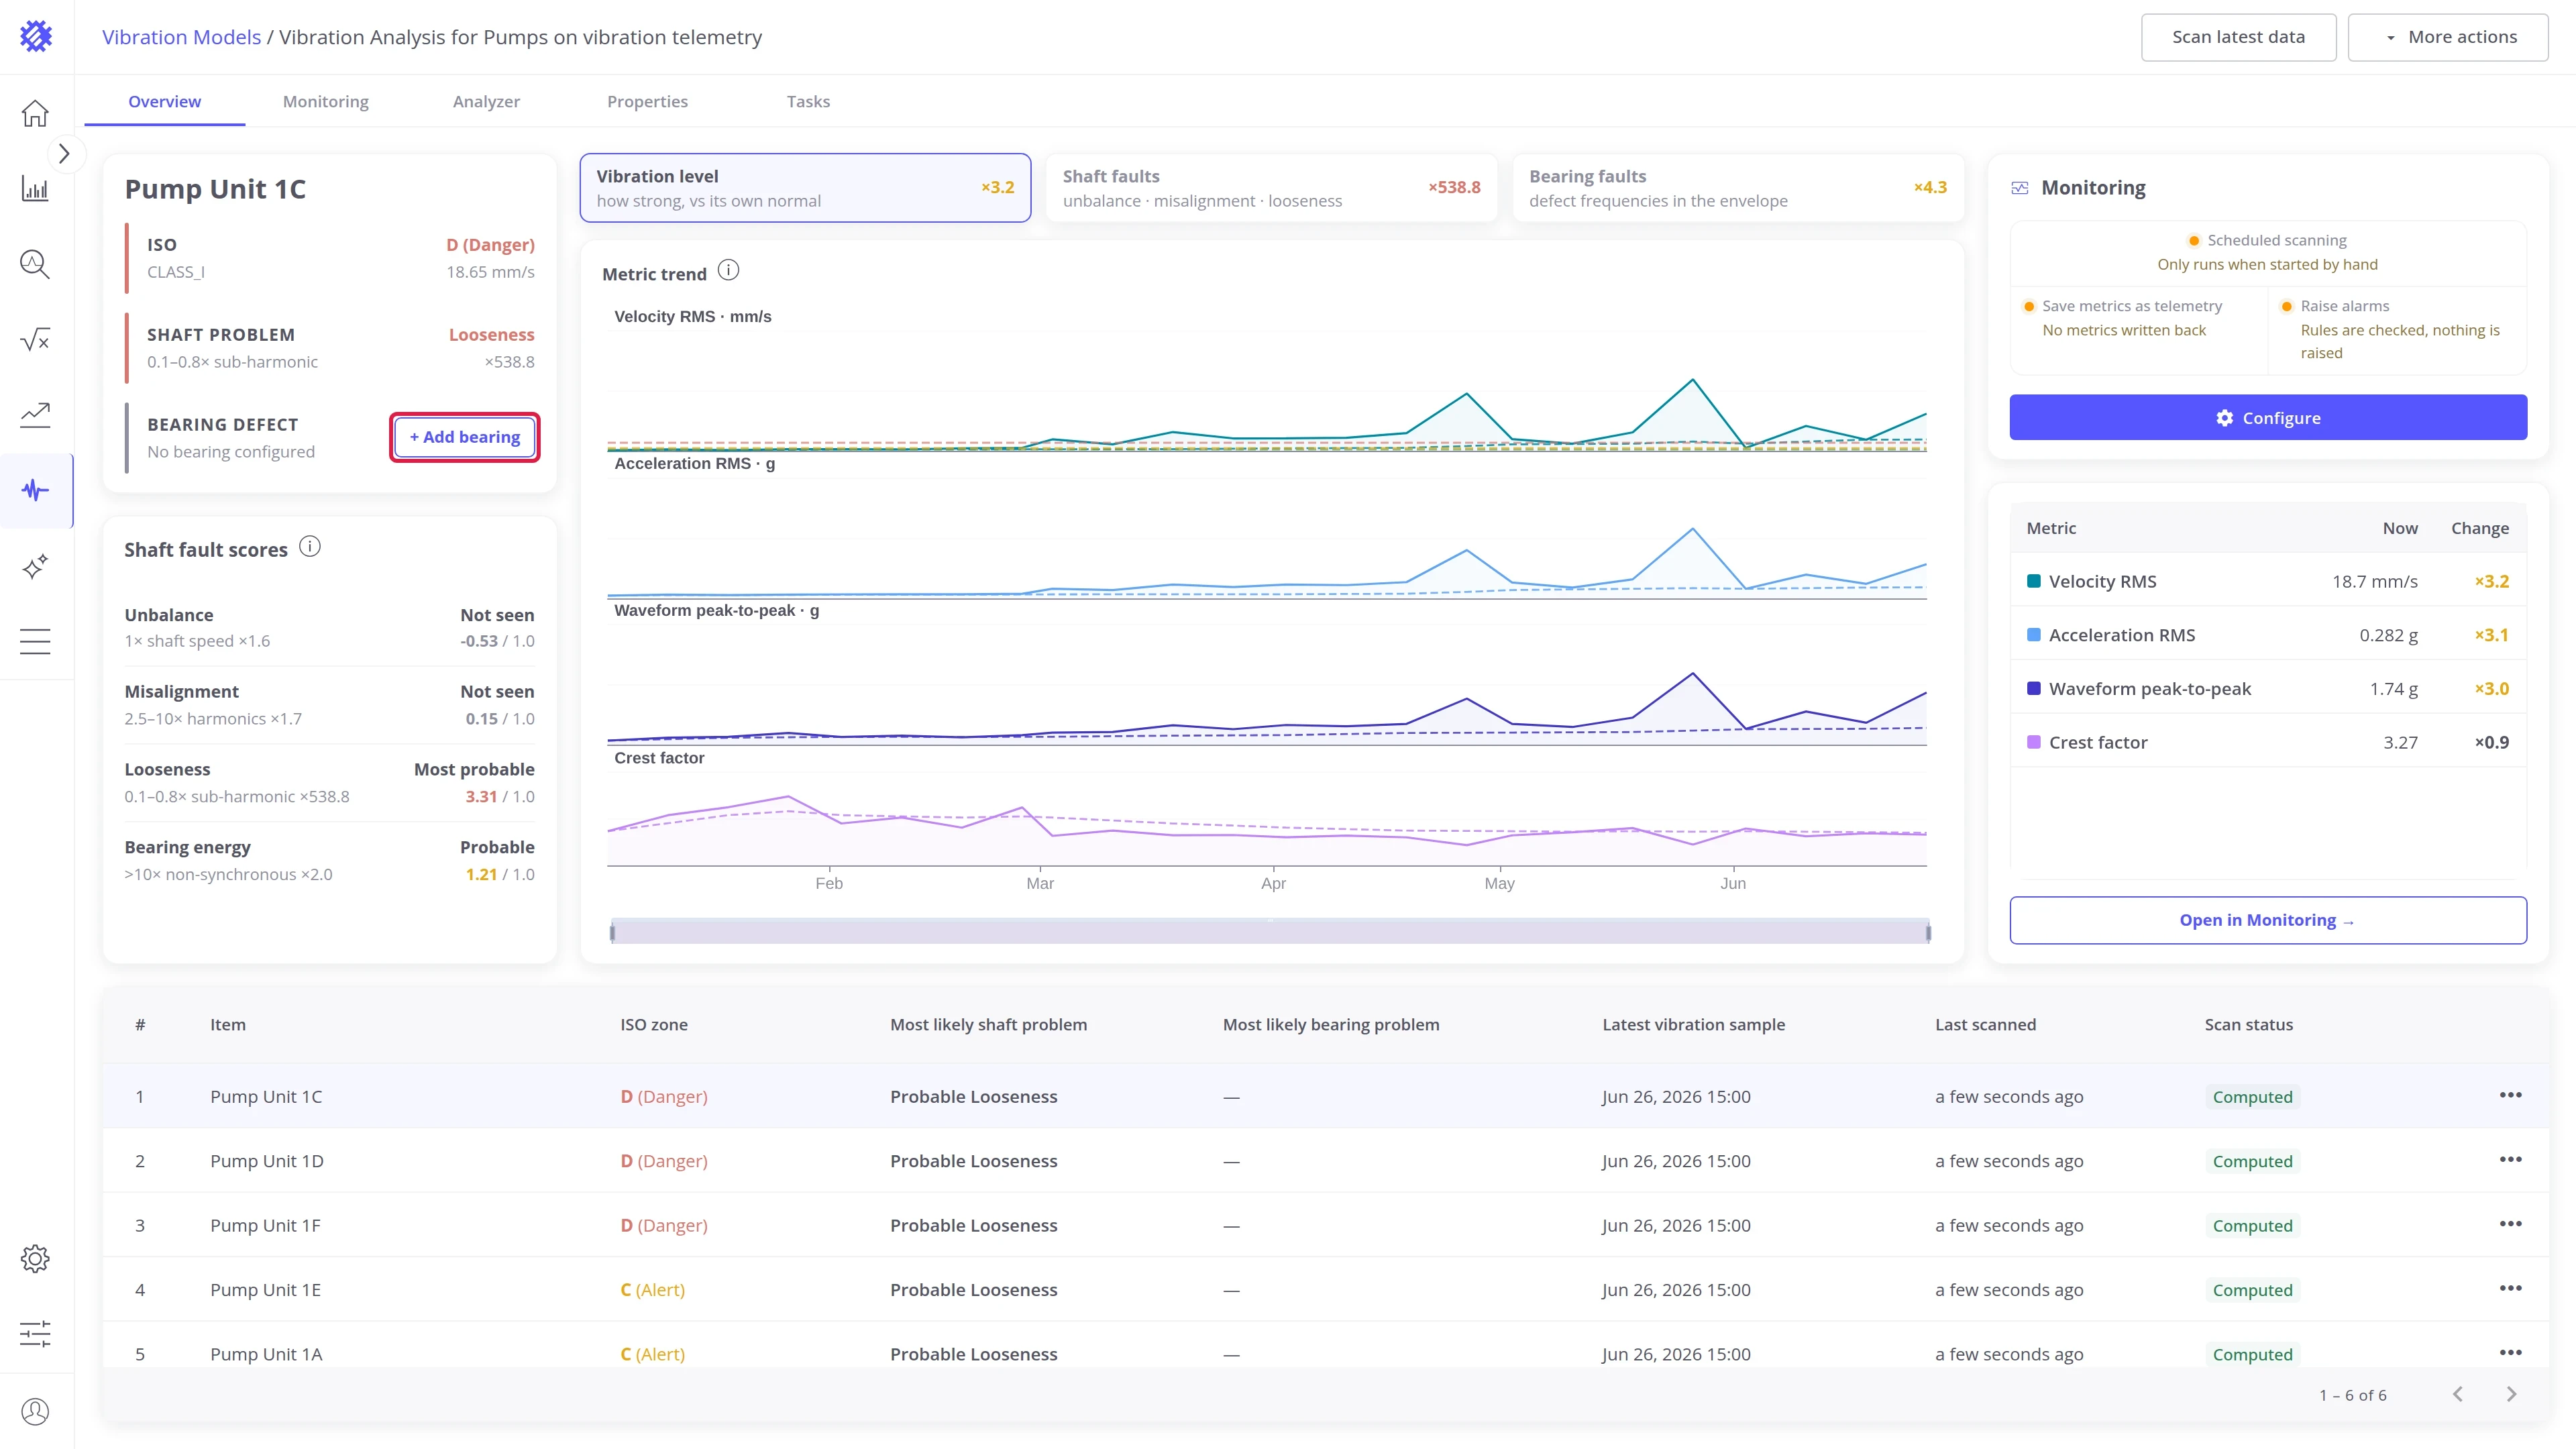
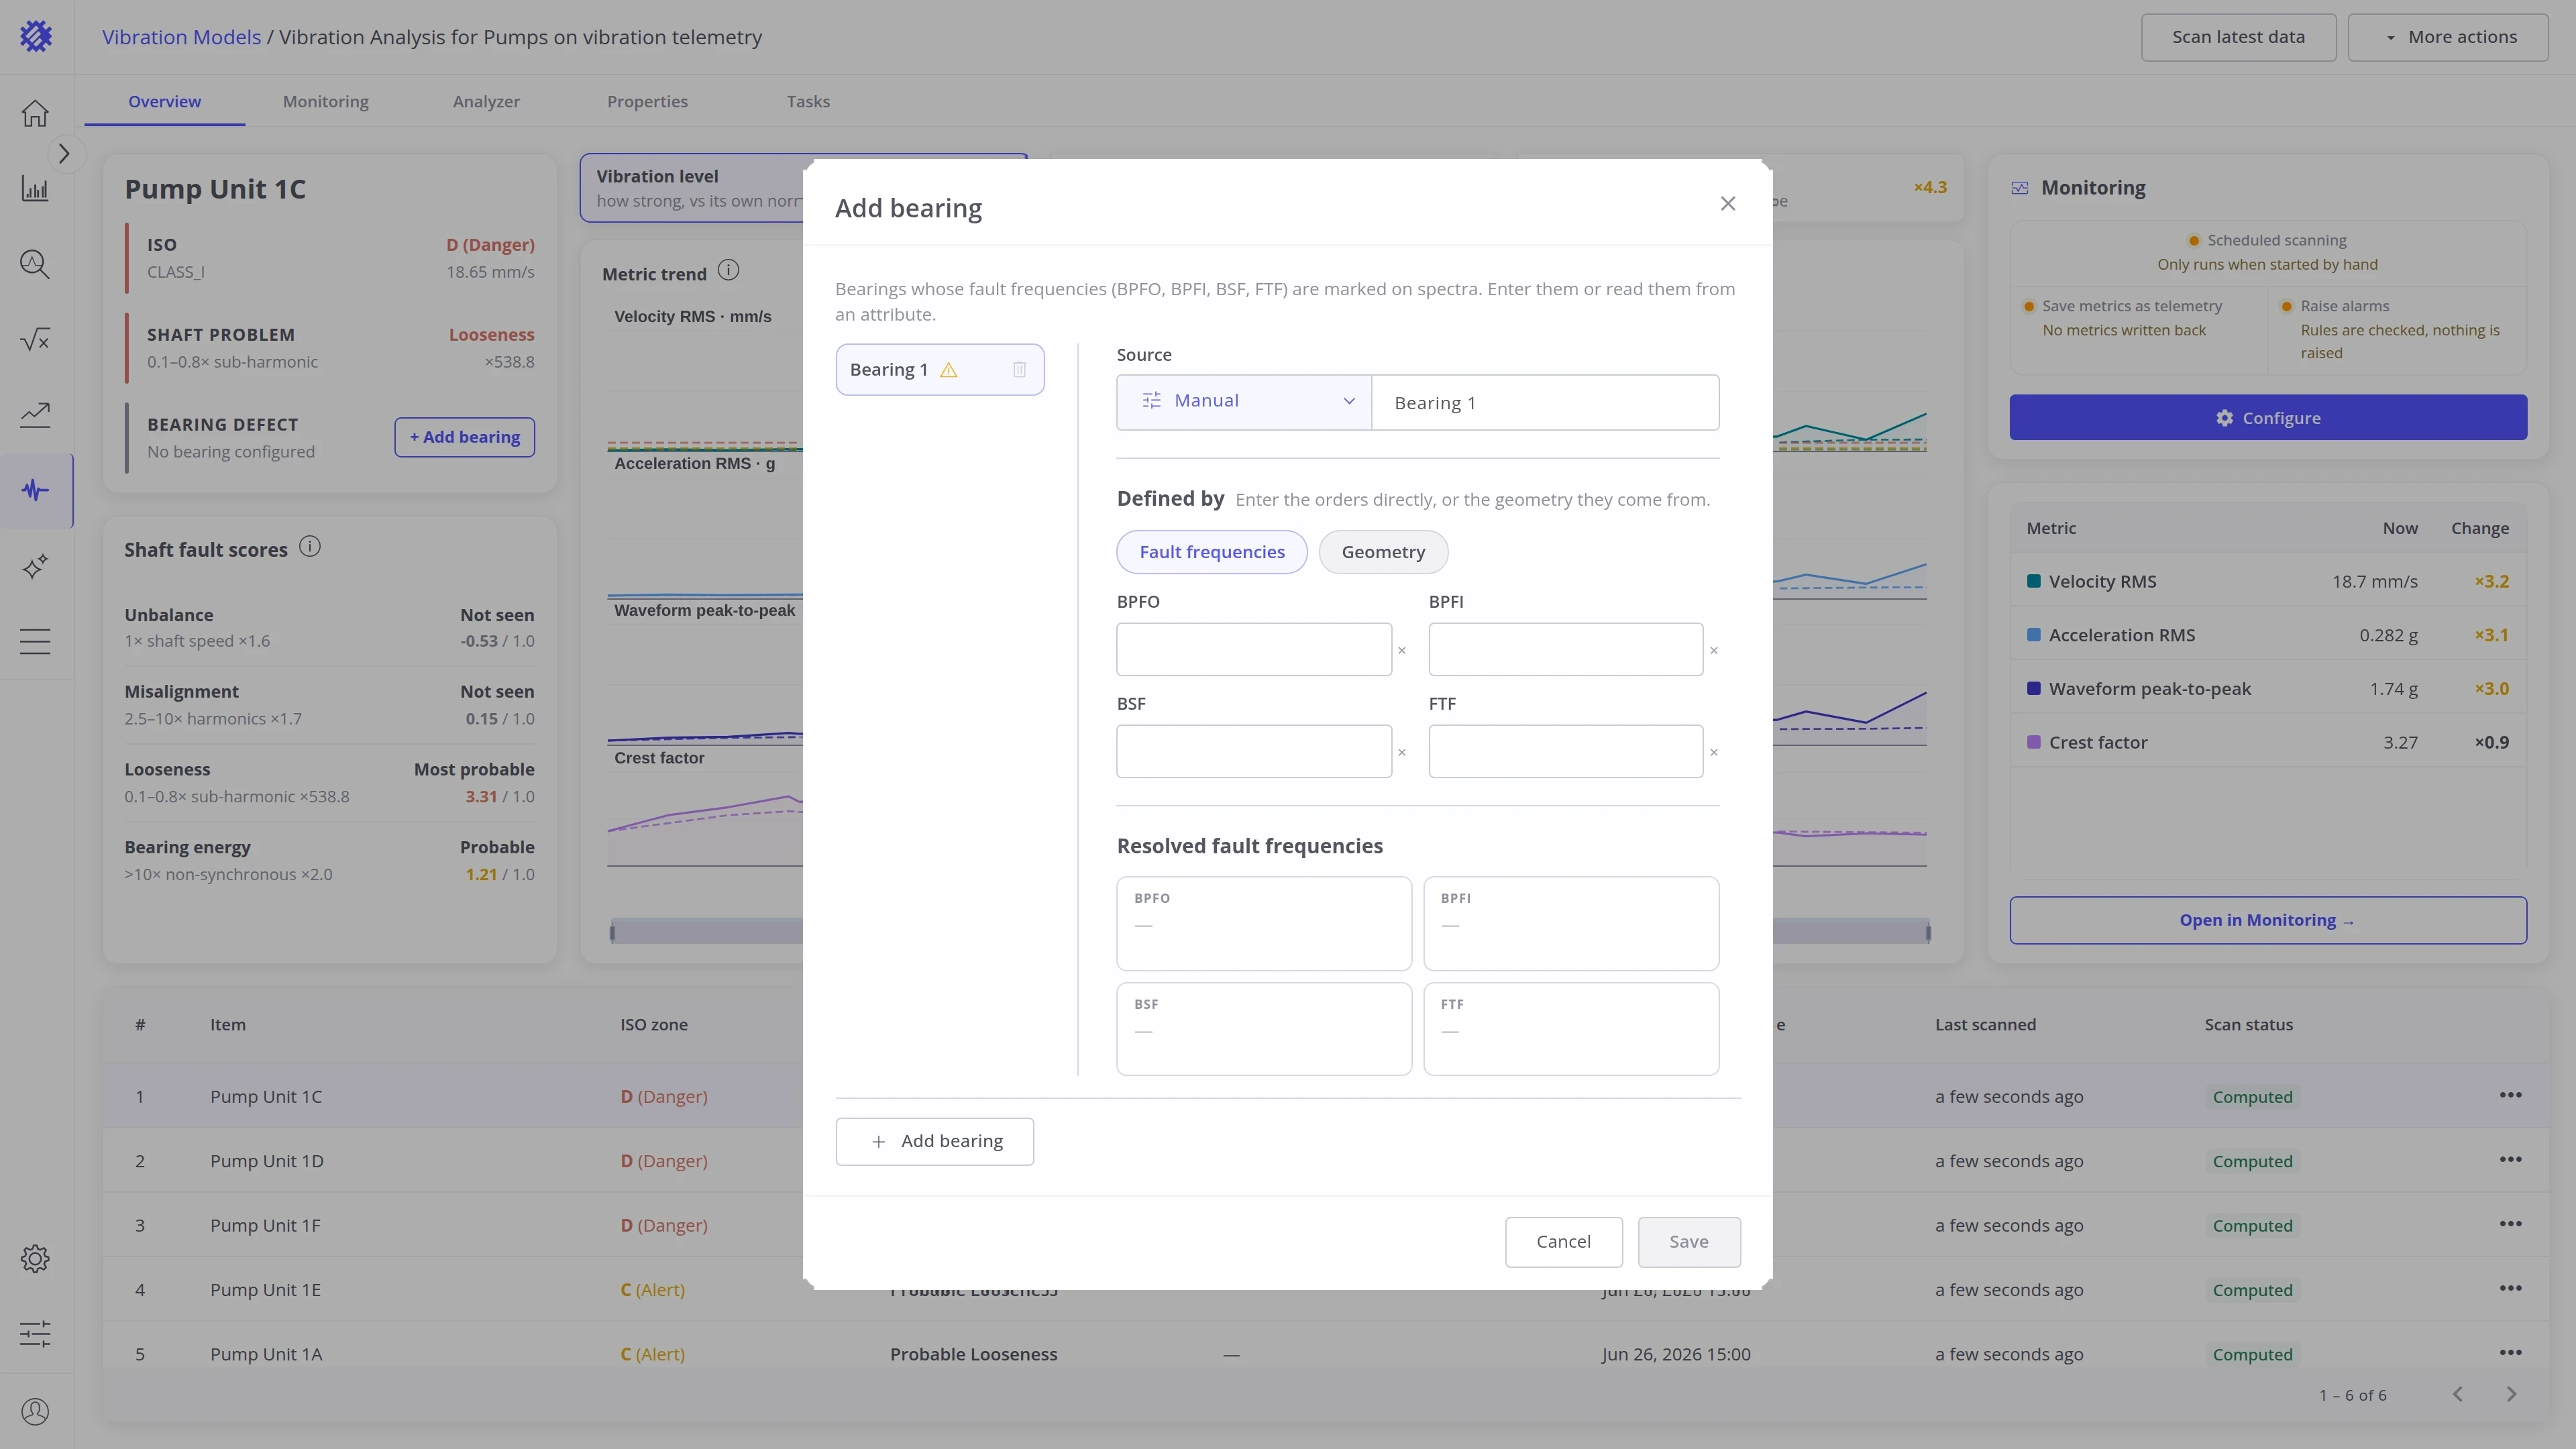
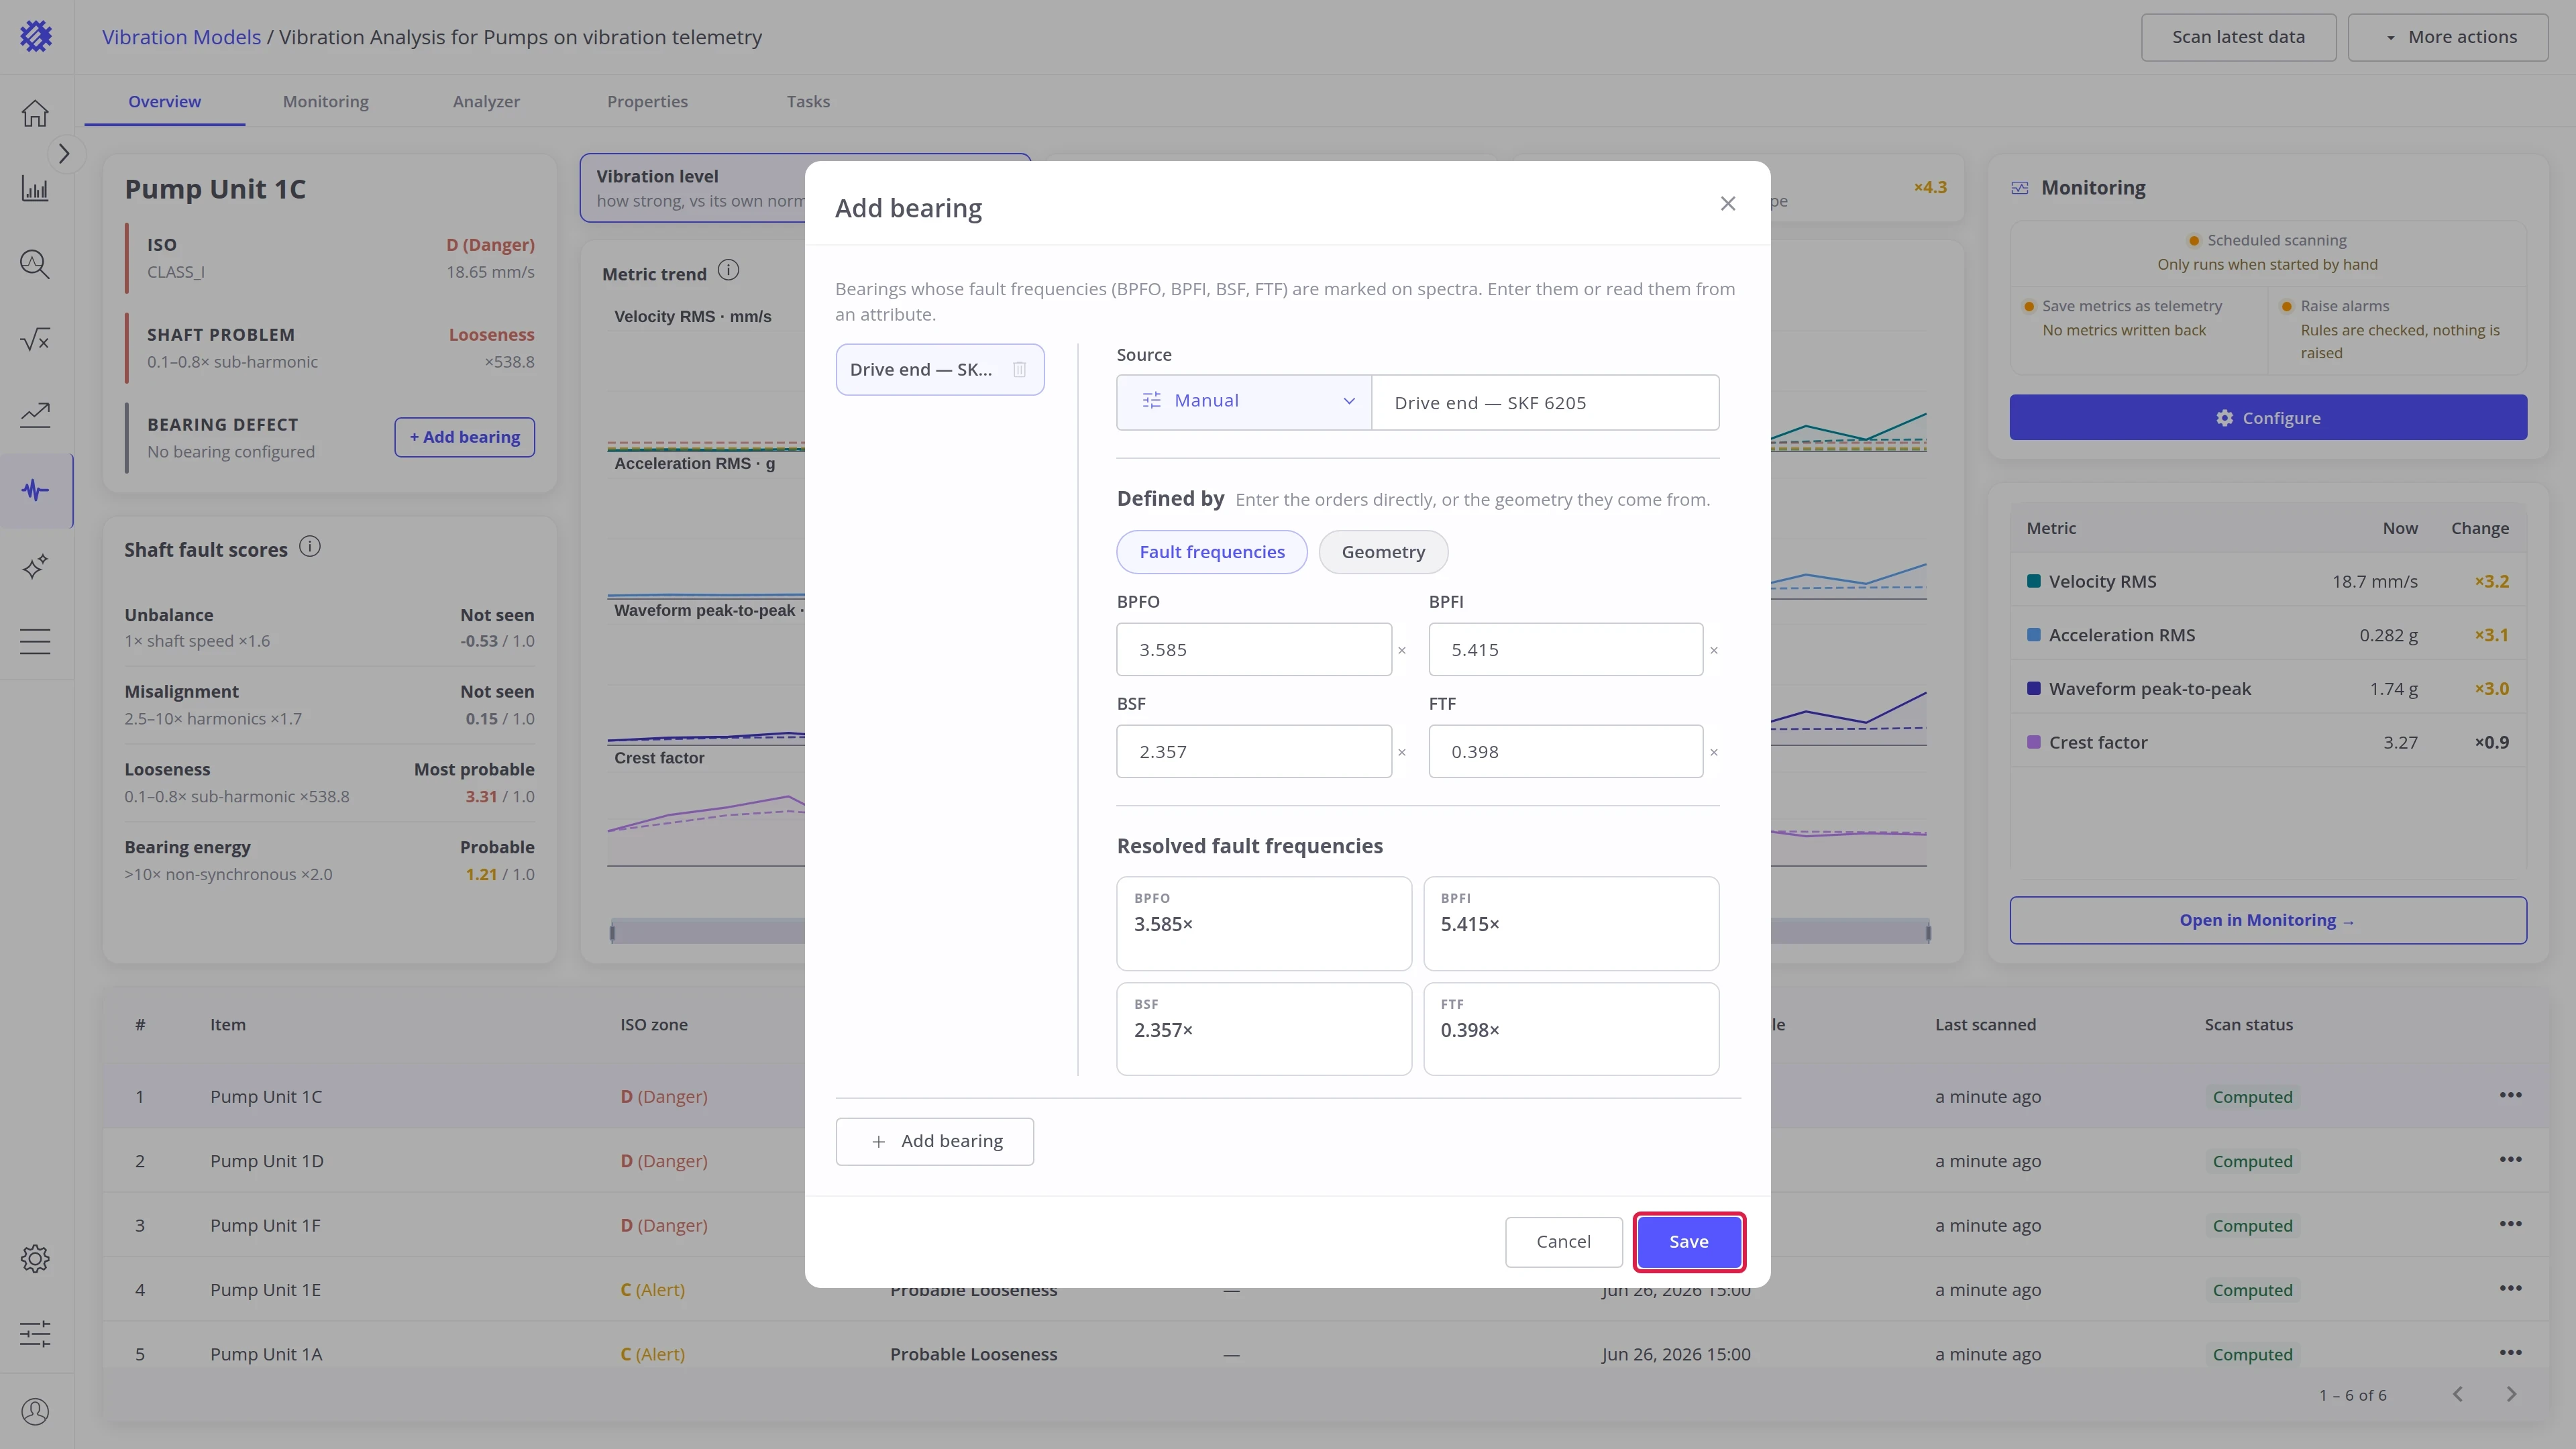
Bearings mark the bearing fault frequencies on the spectra and name the bearing defect. The + Add bearing button appears once the shaft speed is set. Click it, enter the bearing, and click Save. More options are described in Bearings.
Actions
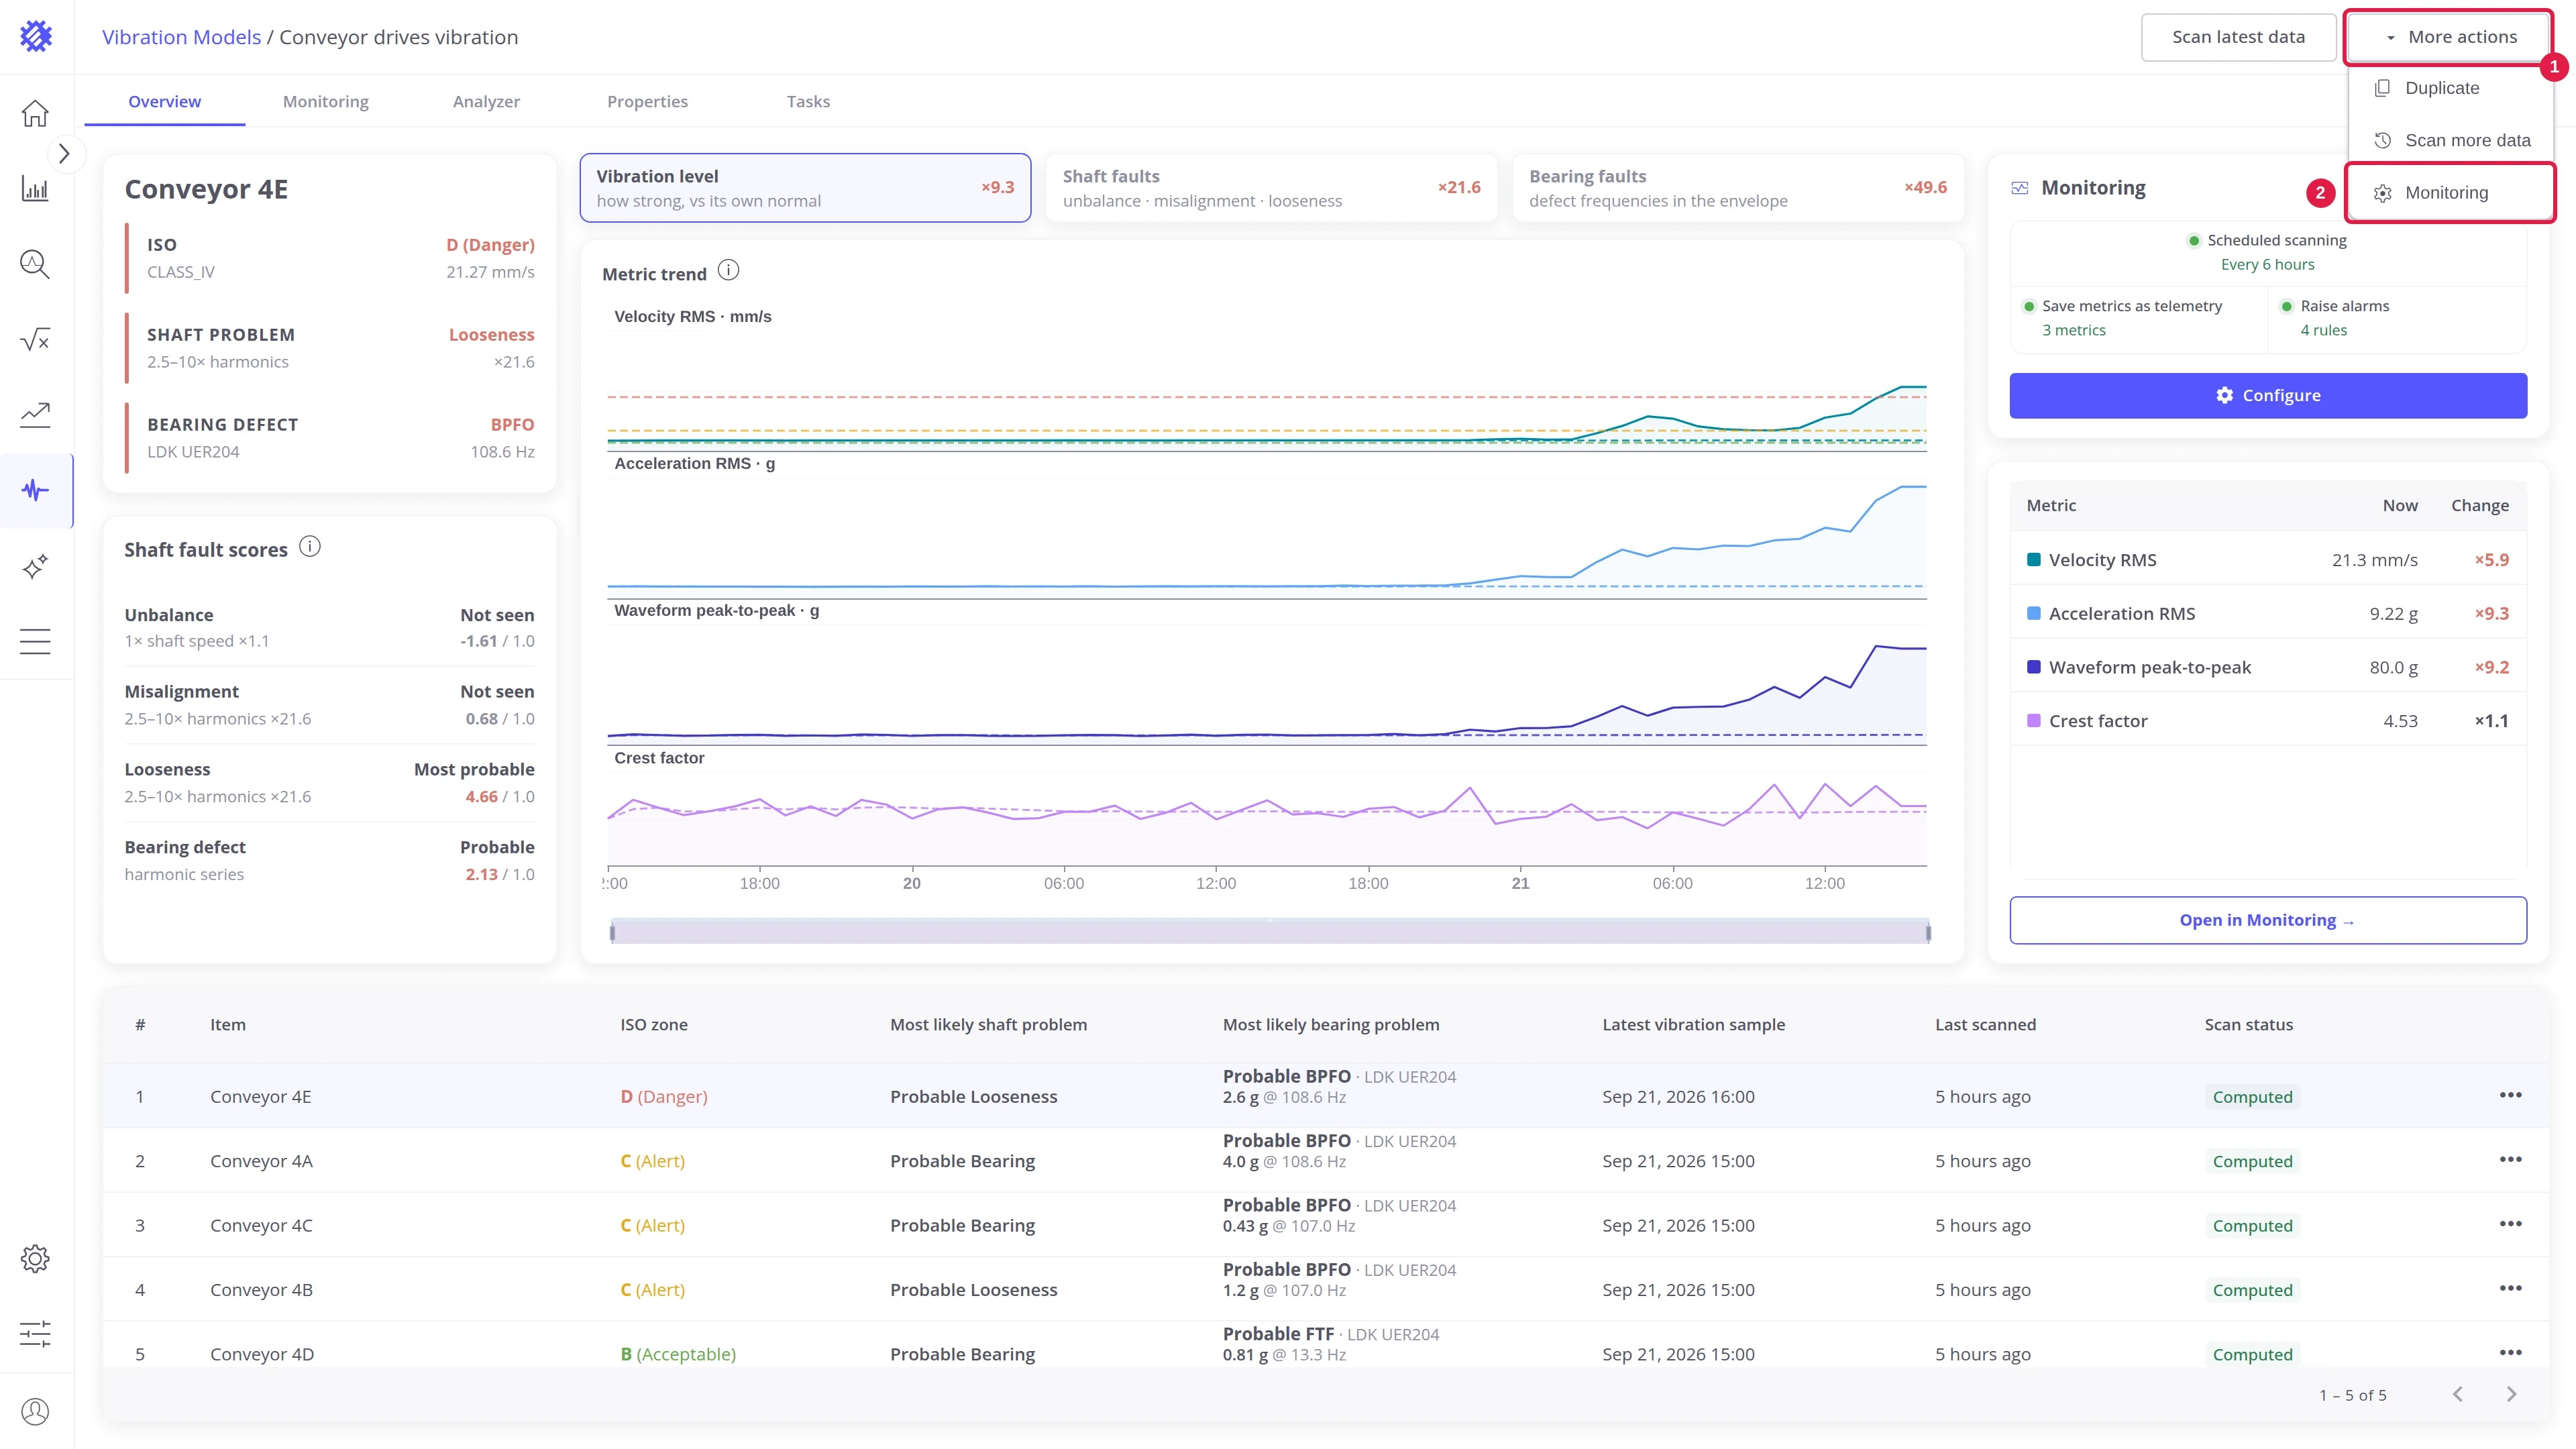
Section titled “Actions”The top right of the model page holds the actions for the whole model. Scan latest data (1) is a button; the others are under More actions (2–4).
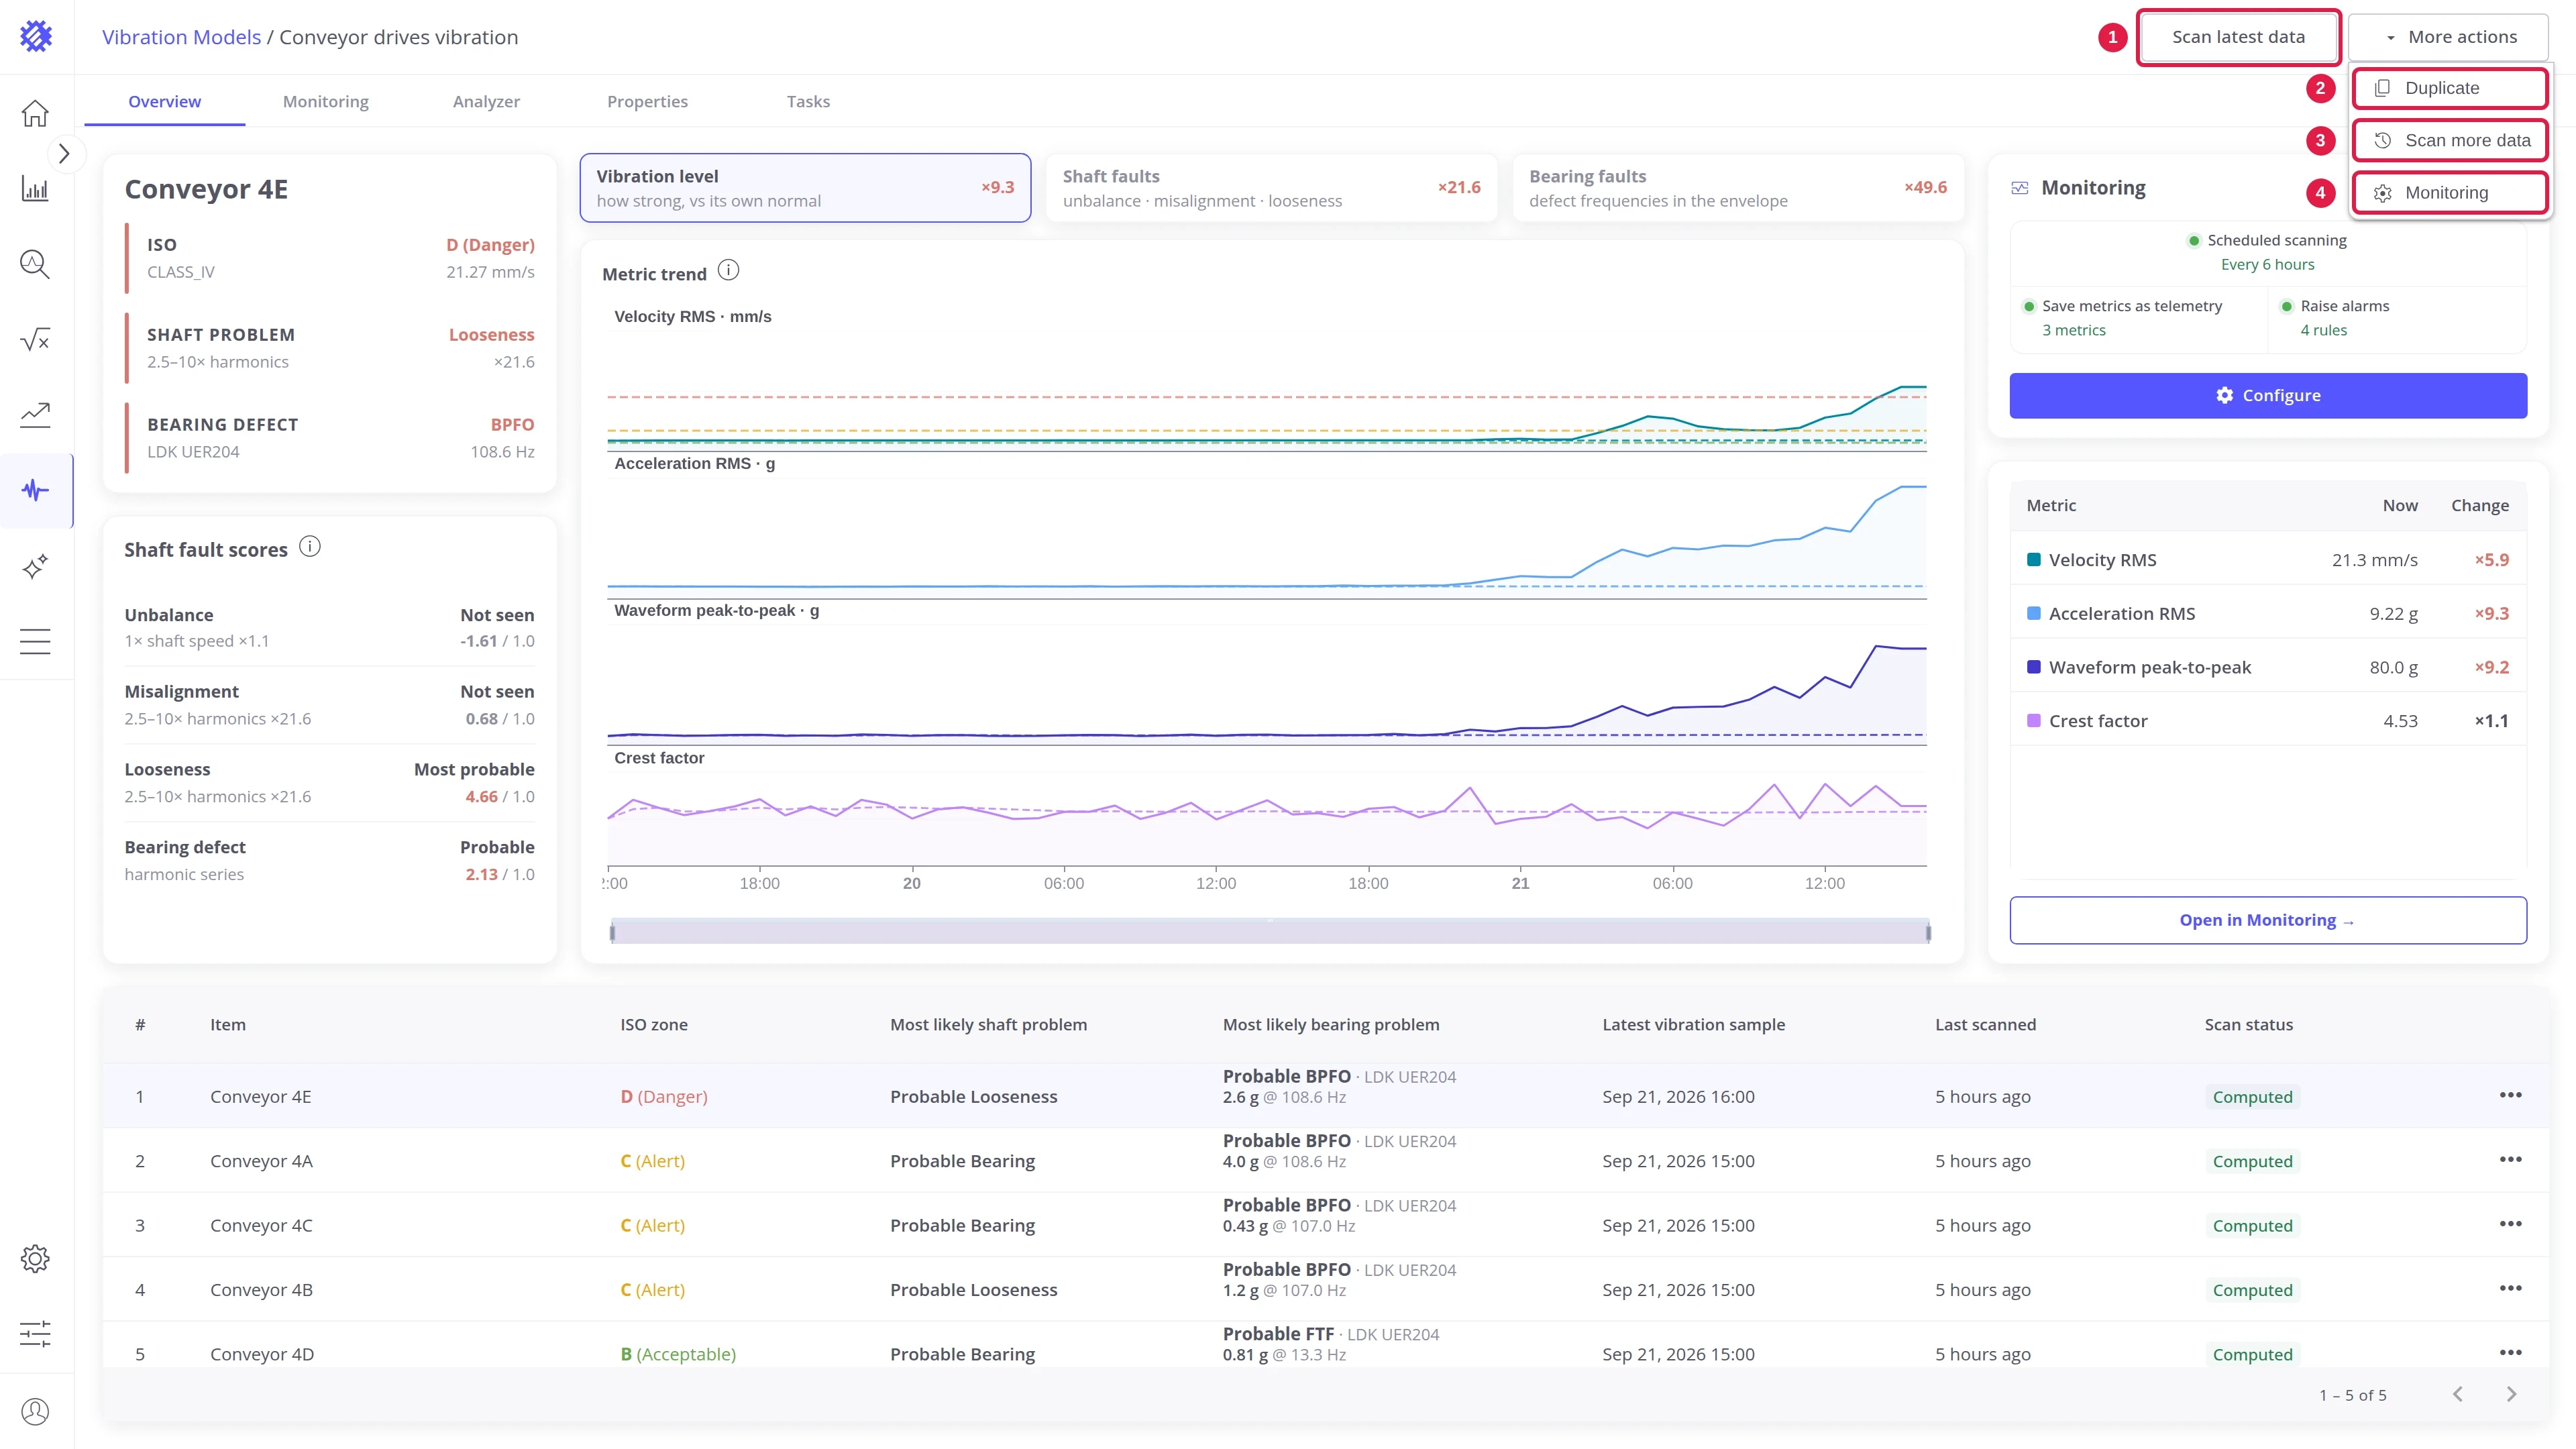
| # | Action | What it does |
|---|---|---|
| 1 | Scan latest data | Scans the samples that arrived since the last scan |
| 2 | Duplicate | Creates a copy of the model |
| 3 | Scan more data | Scans a period you choose |
| 4 | Monitoring | Turns on scheduled scanning, saving metrics, and alarms |
Scan latest data
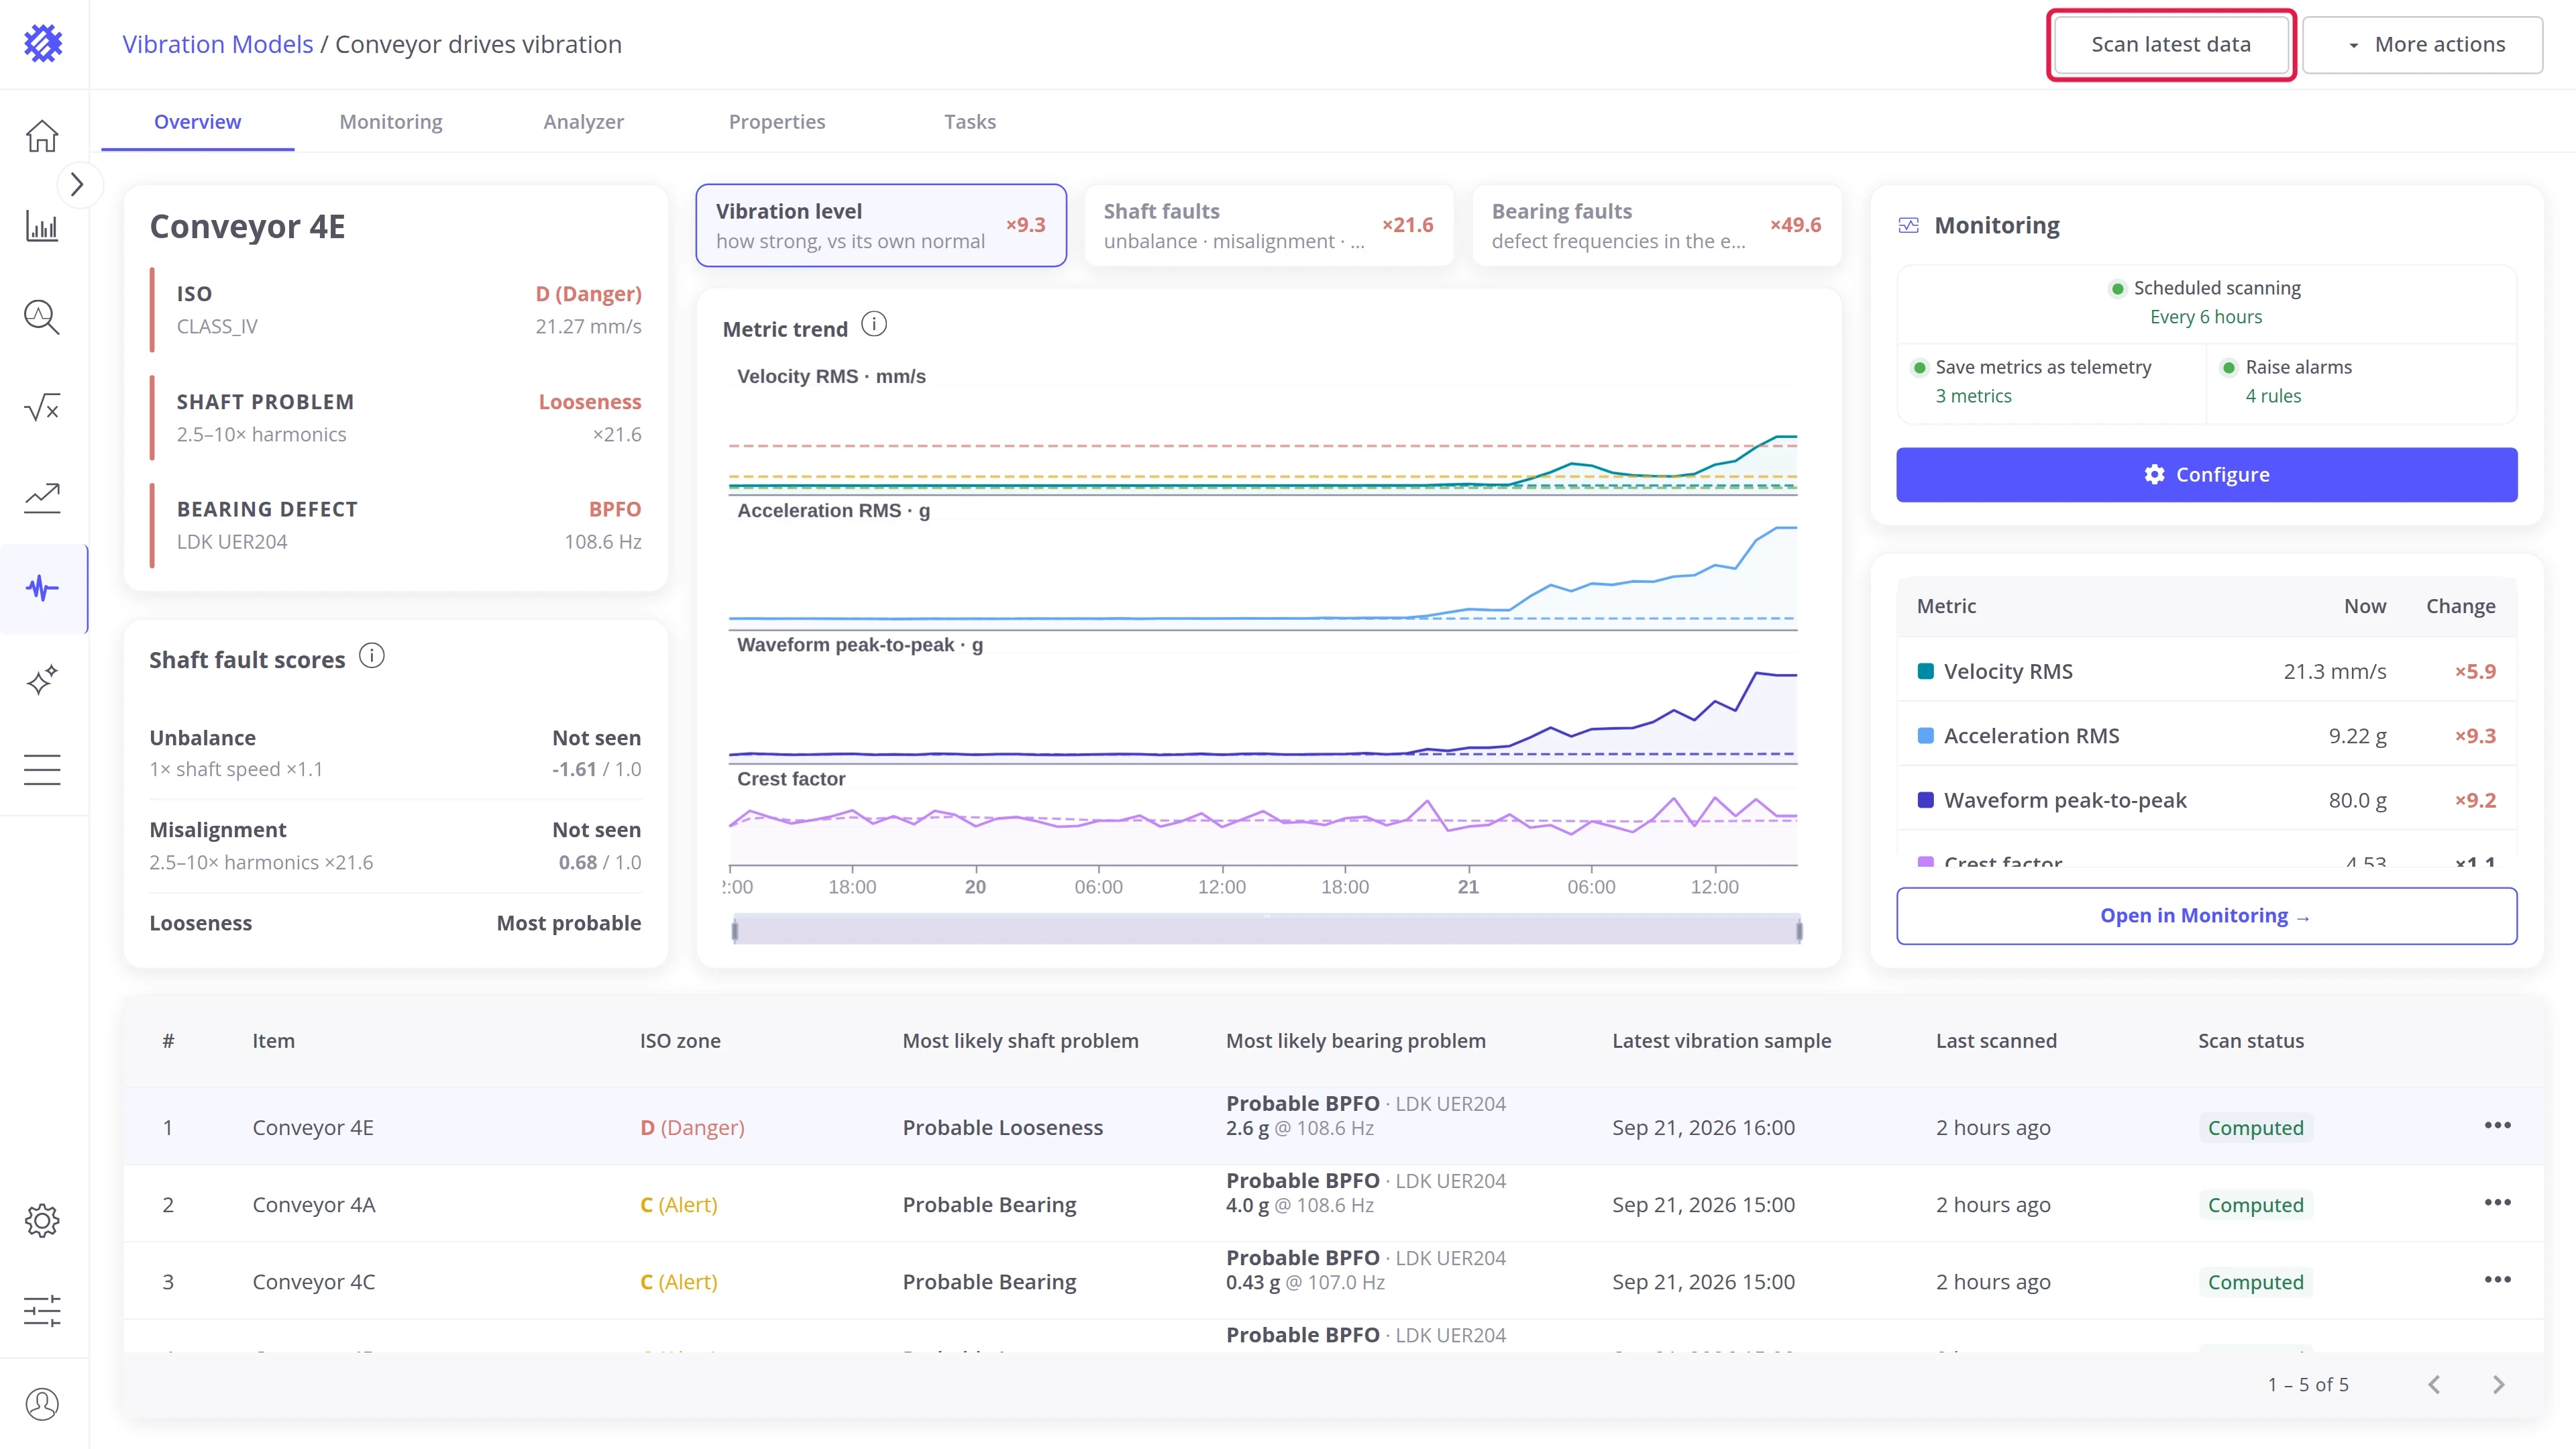
Section titled “Scan latest data”Click Scan latest data to bring the model up to date by hand. It is the same scan that scheduled scanning runs.
- Only new samples are scanned: for each machine, from its newest stored sample up to now.
- It covers the machines the model has already scanned. To add new machines, use Scan more data.
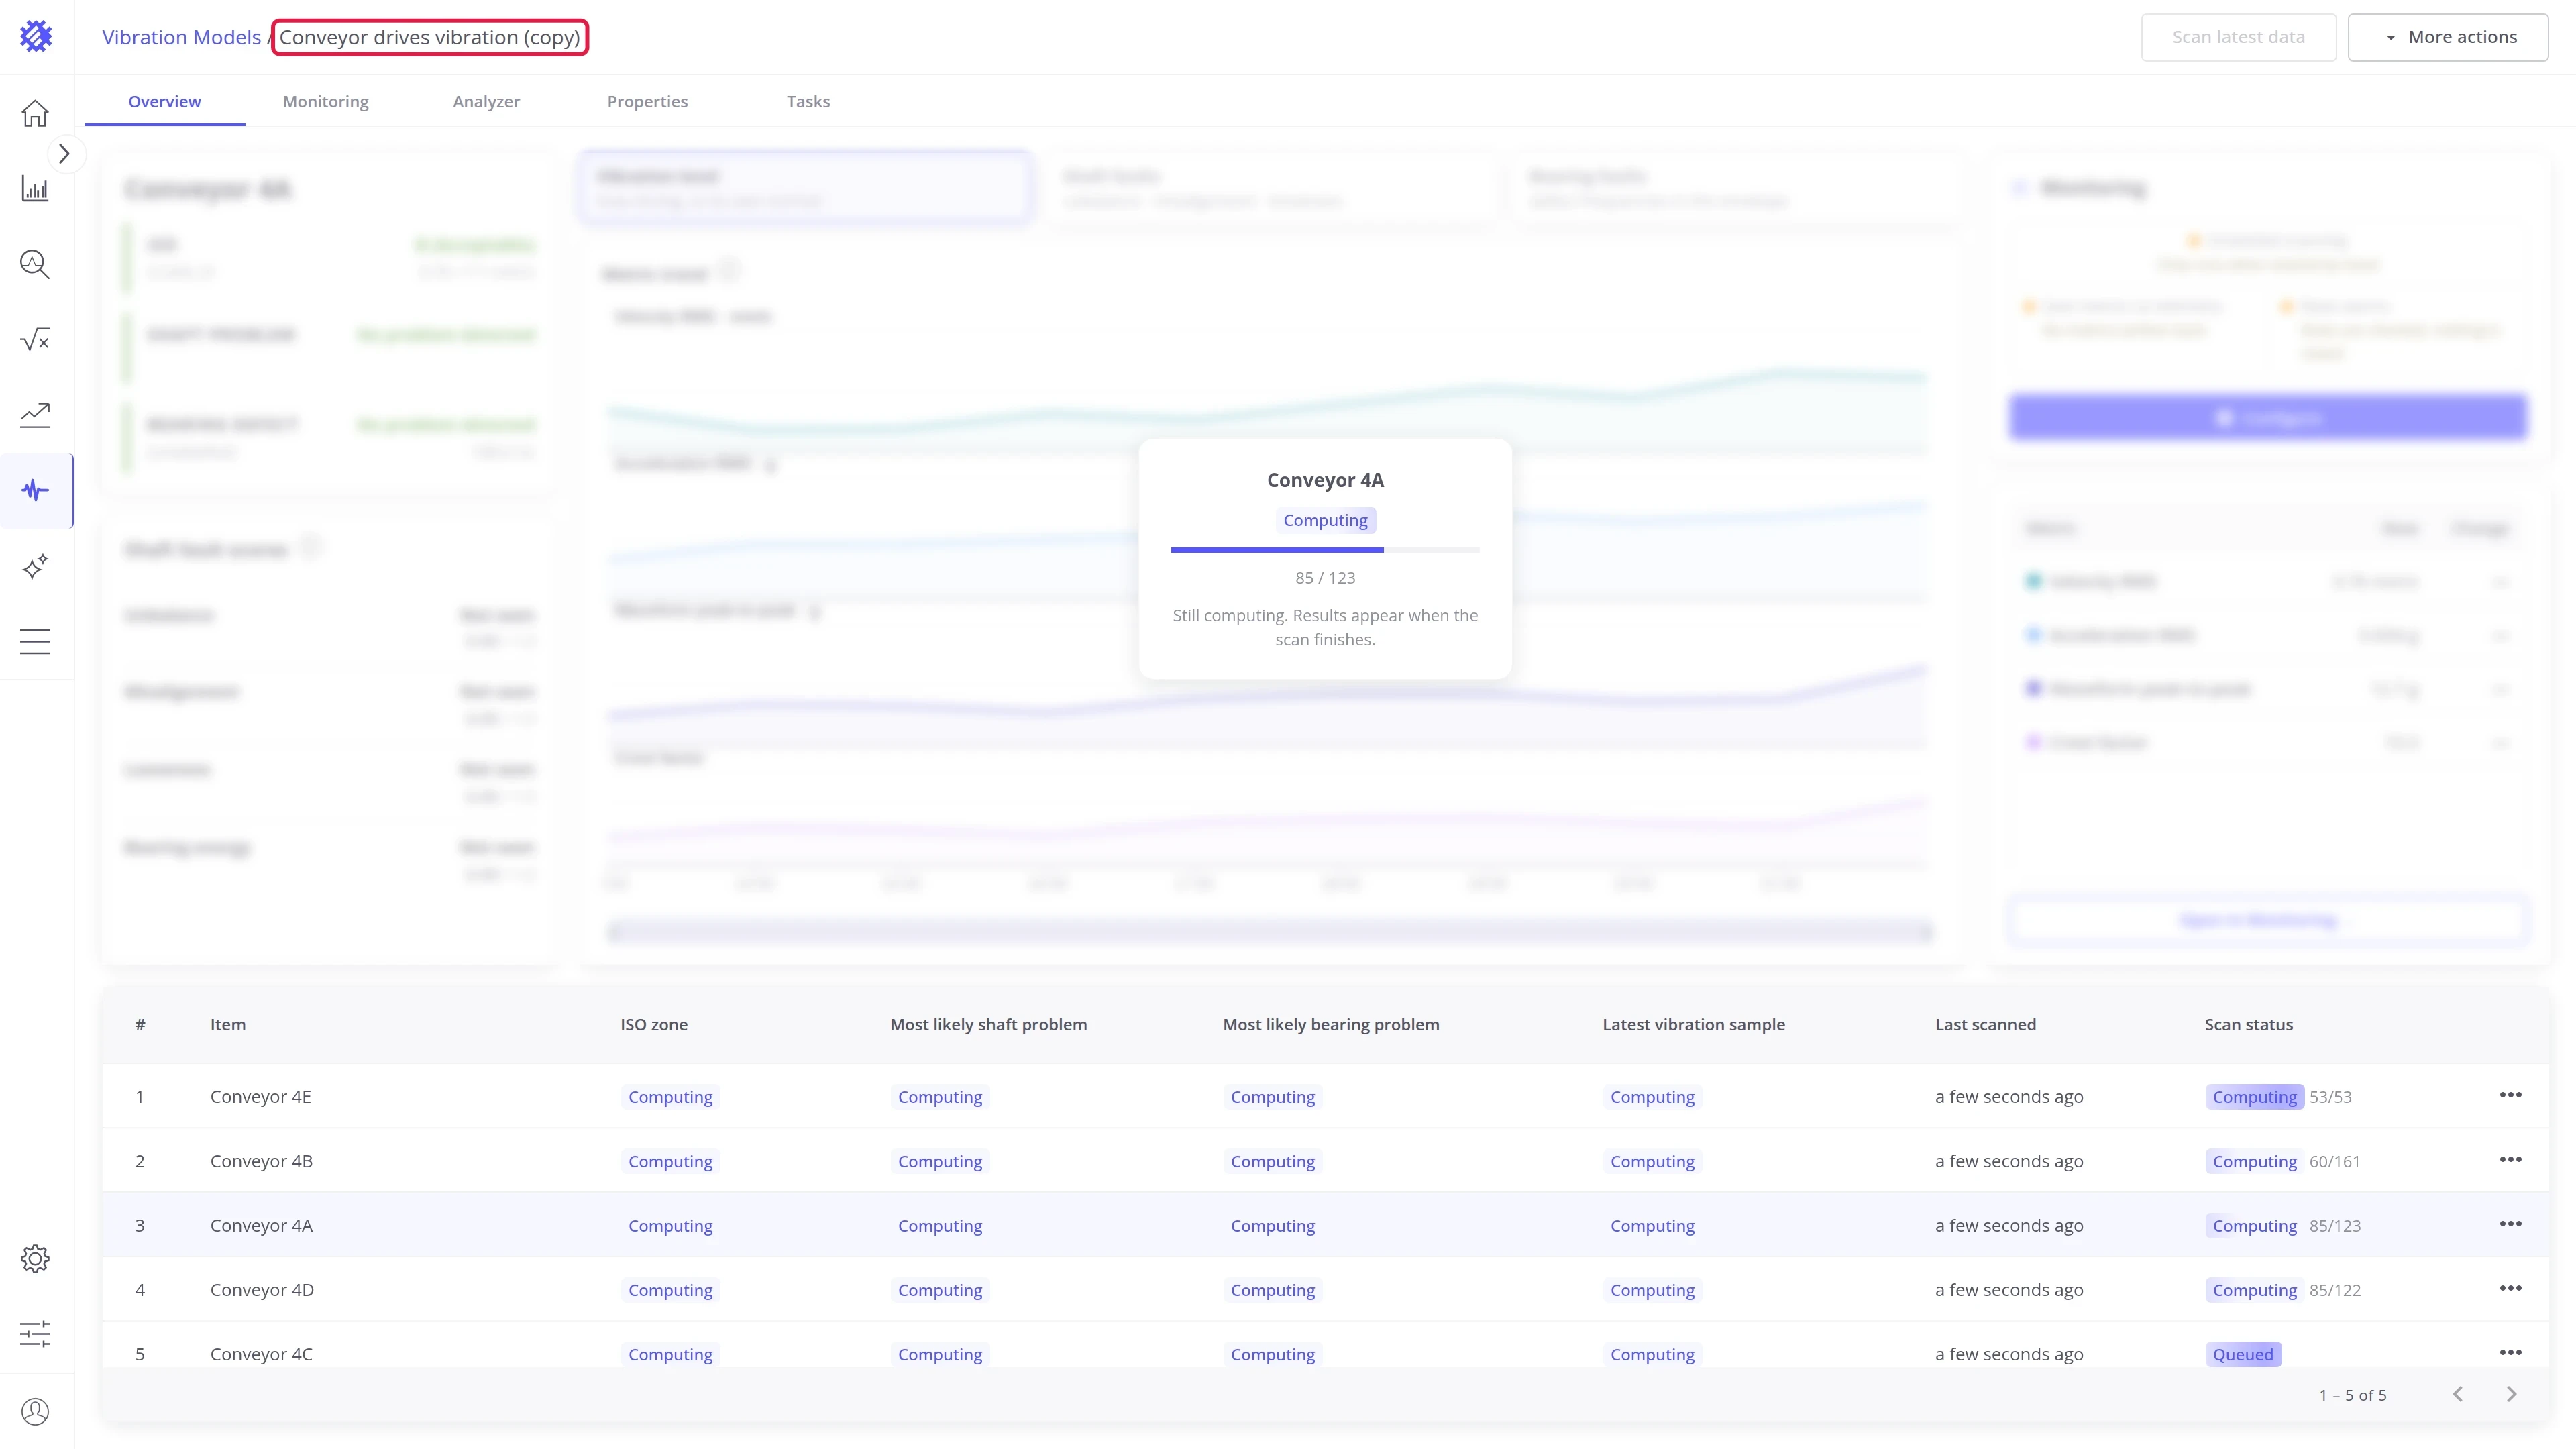
Duplicate
Section titled “Duplicate”Create a copy of the model, for example to try another setting without touching the model that is running.
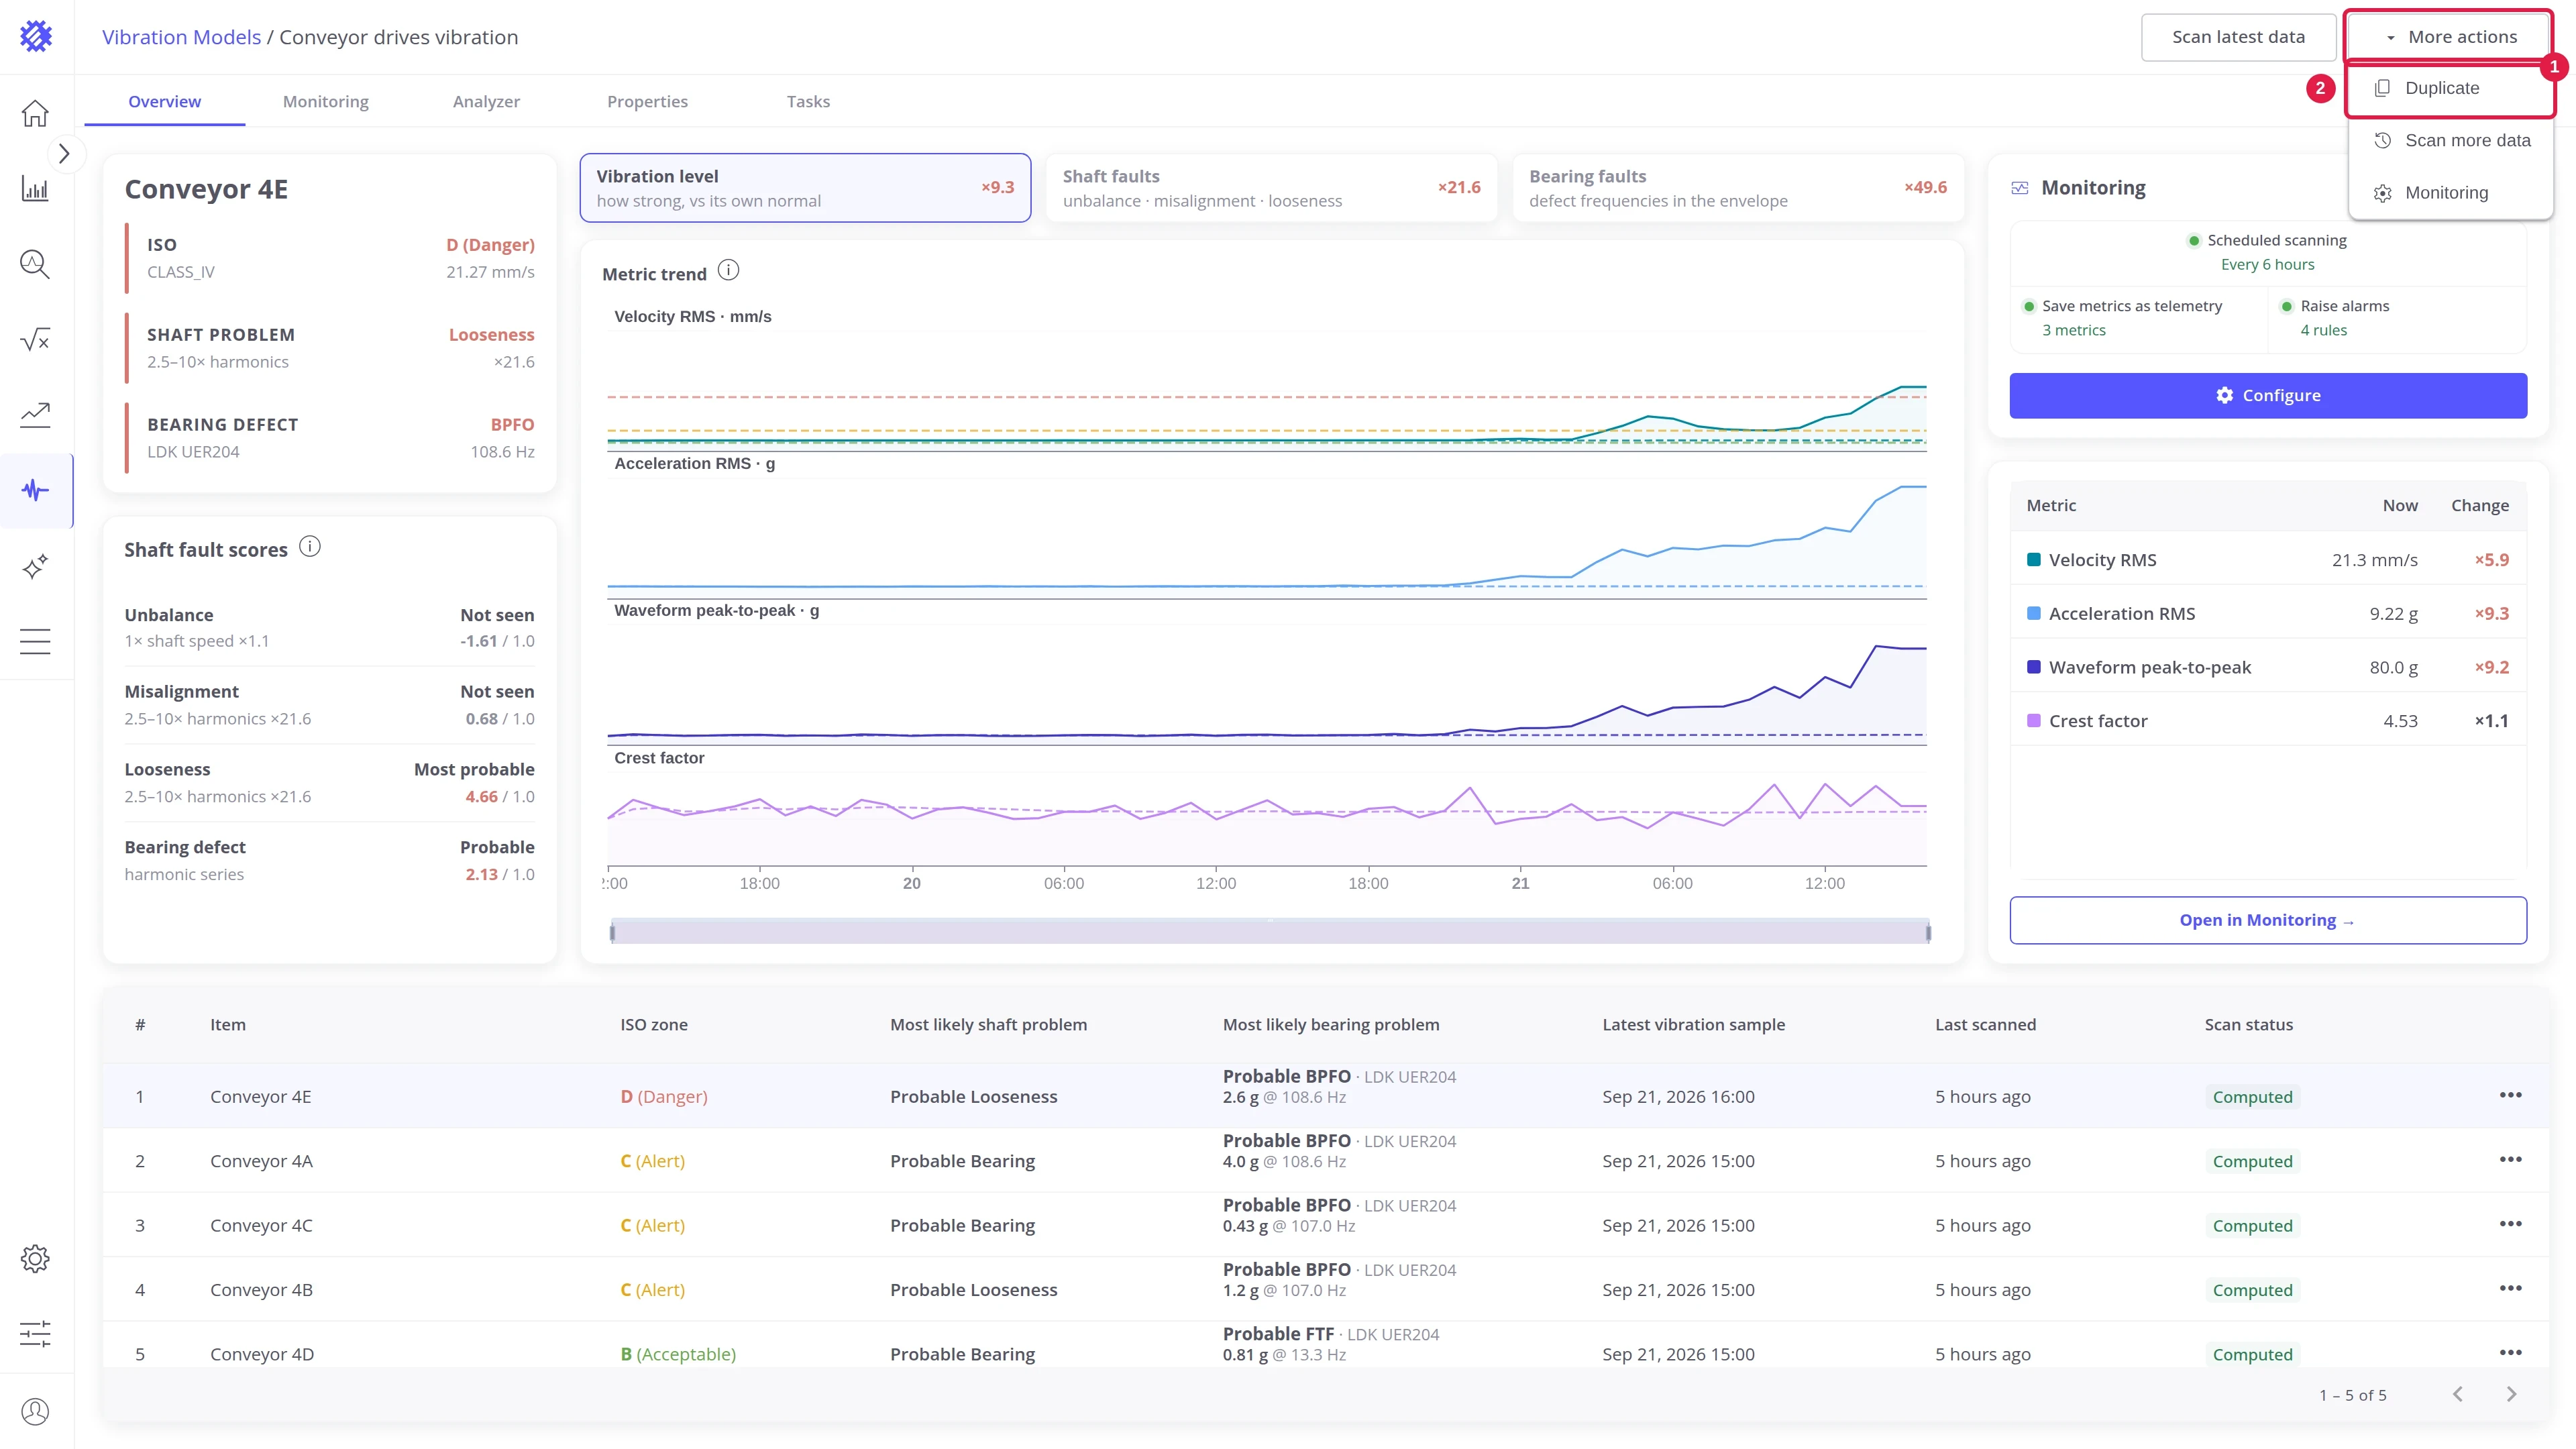
- Click More actions (1) and choose Duplicate (2).
- The copy opens in a new browser tab.
The copy has the same settings and alarm rules. It starts with no results and runs its own scan, and its monitoring is off.
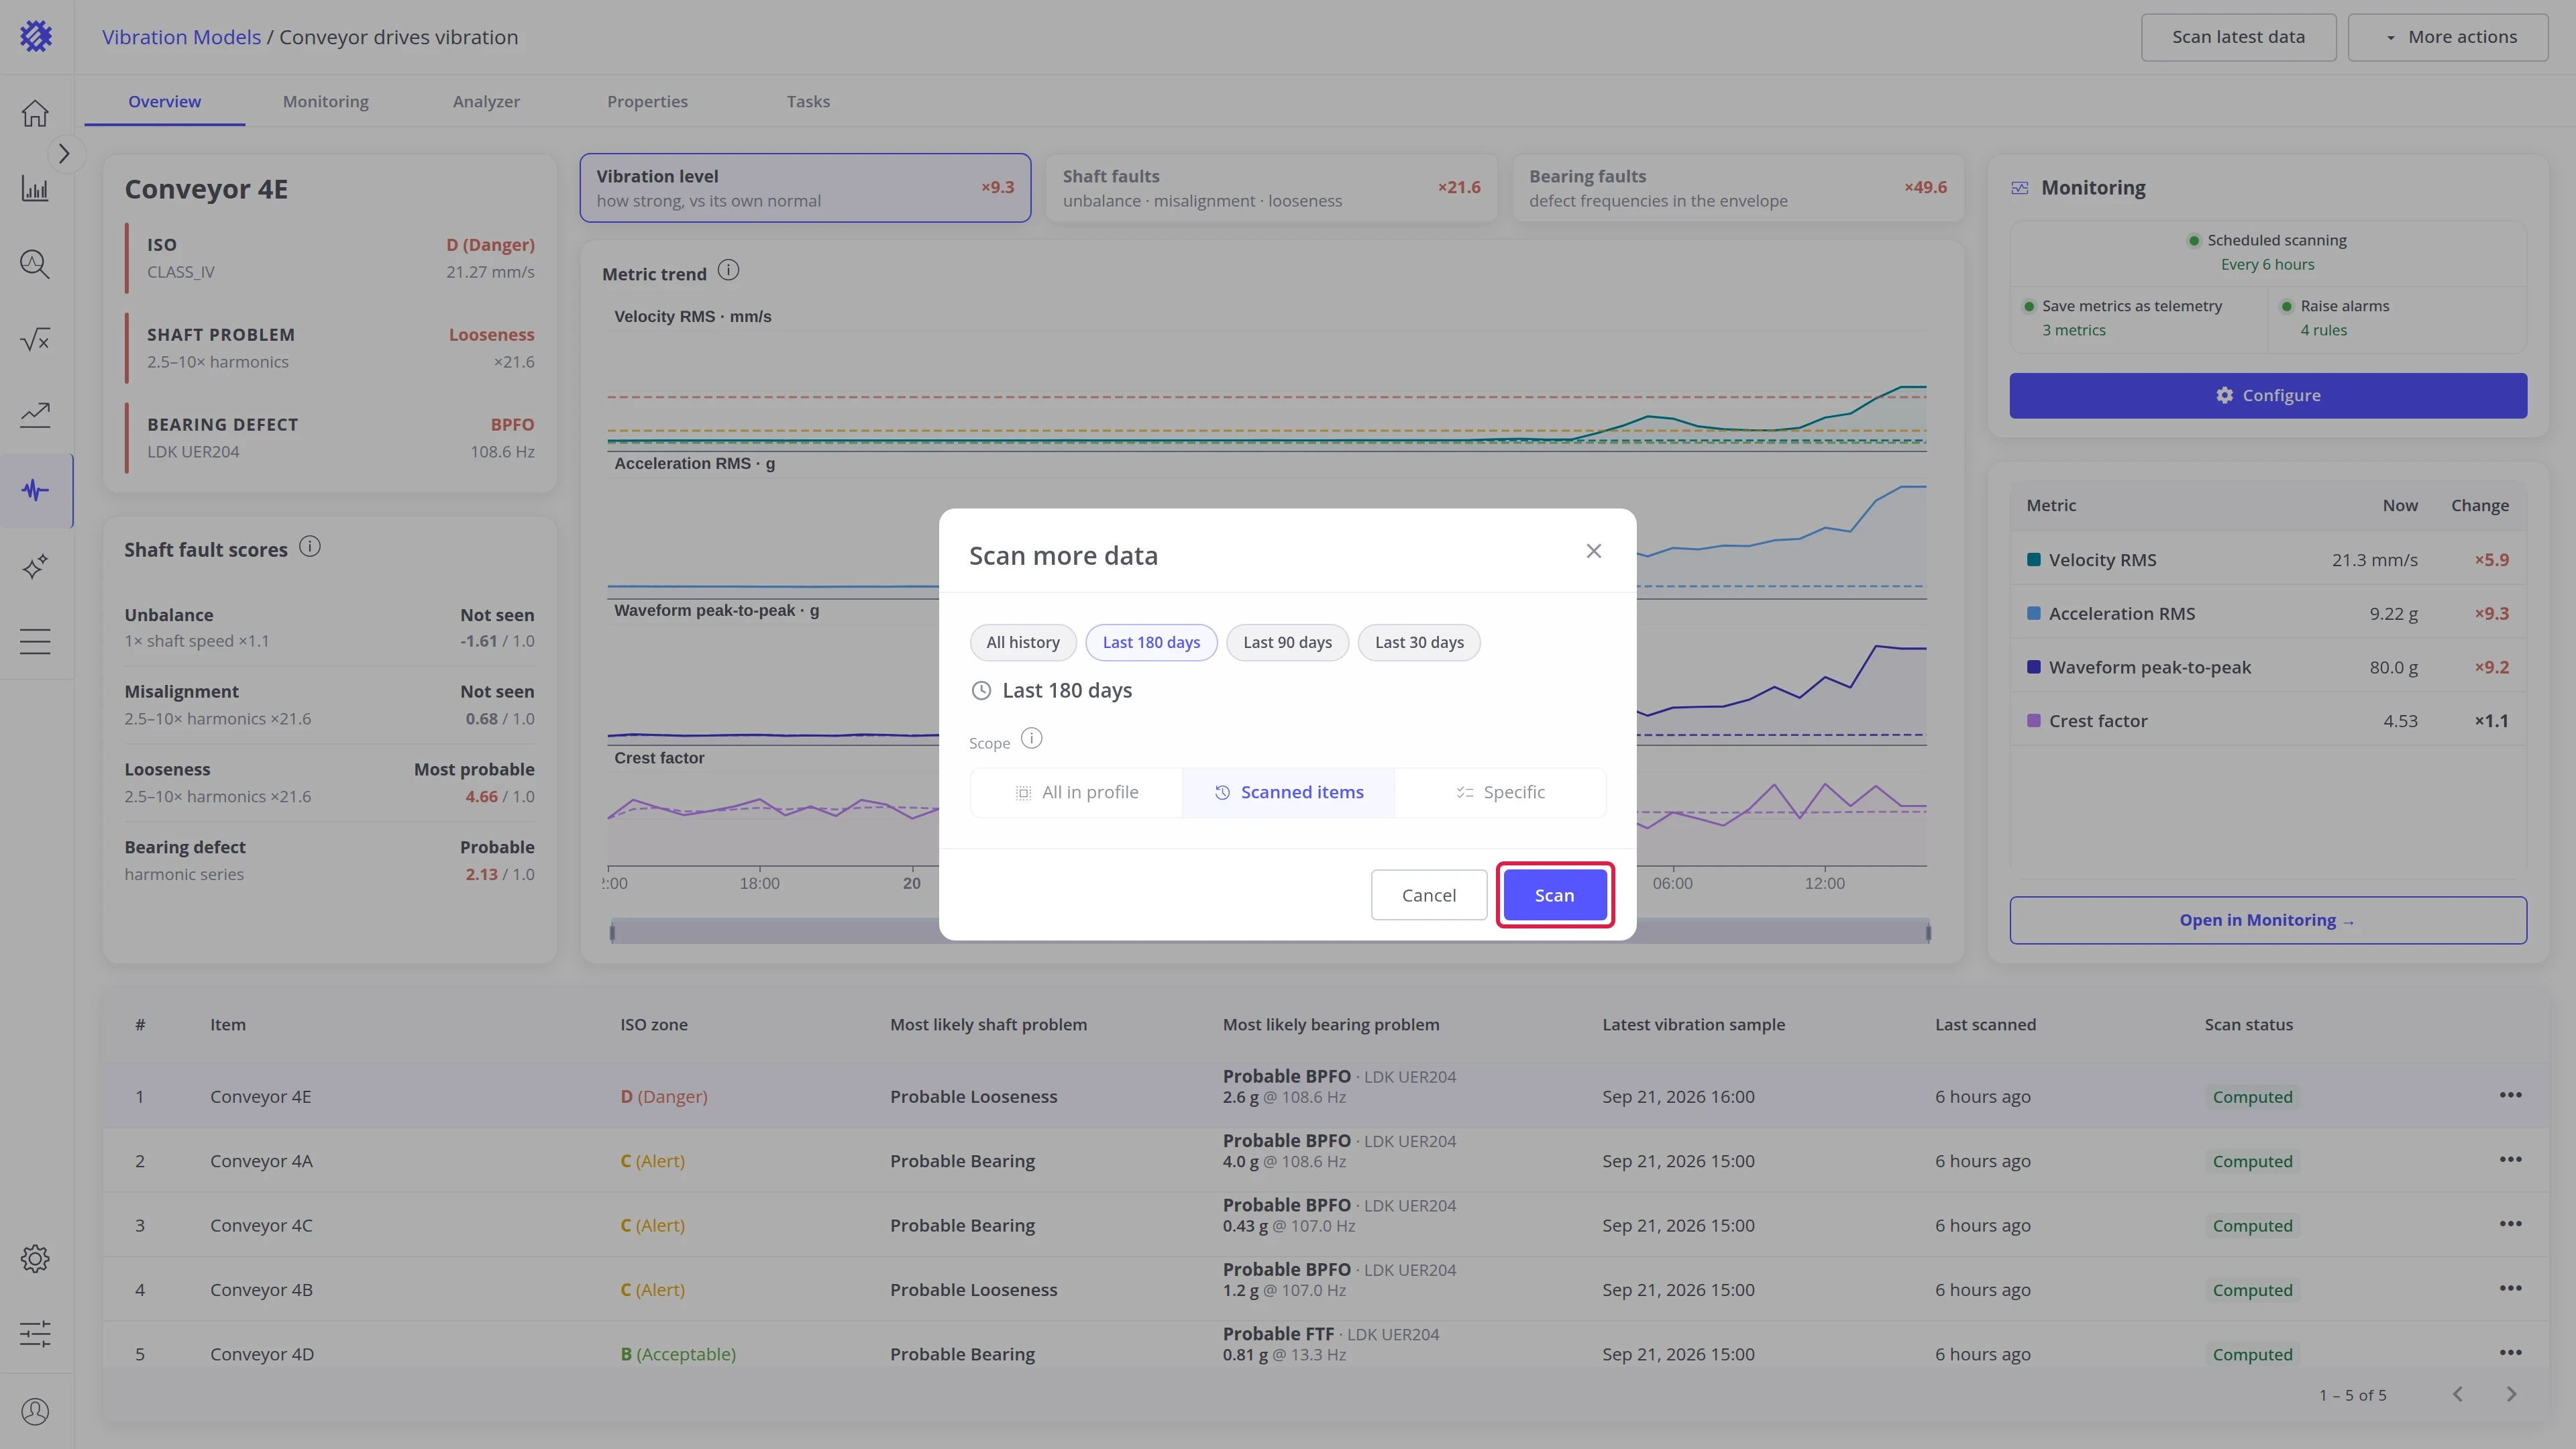
Scan more data
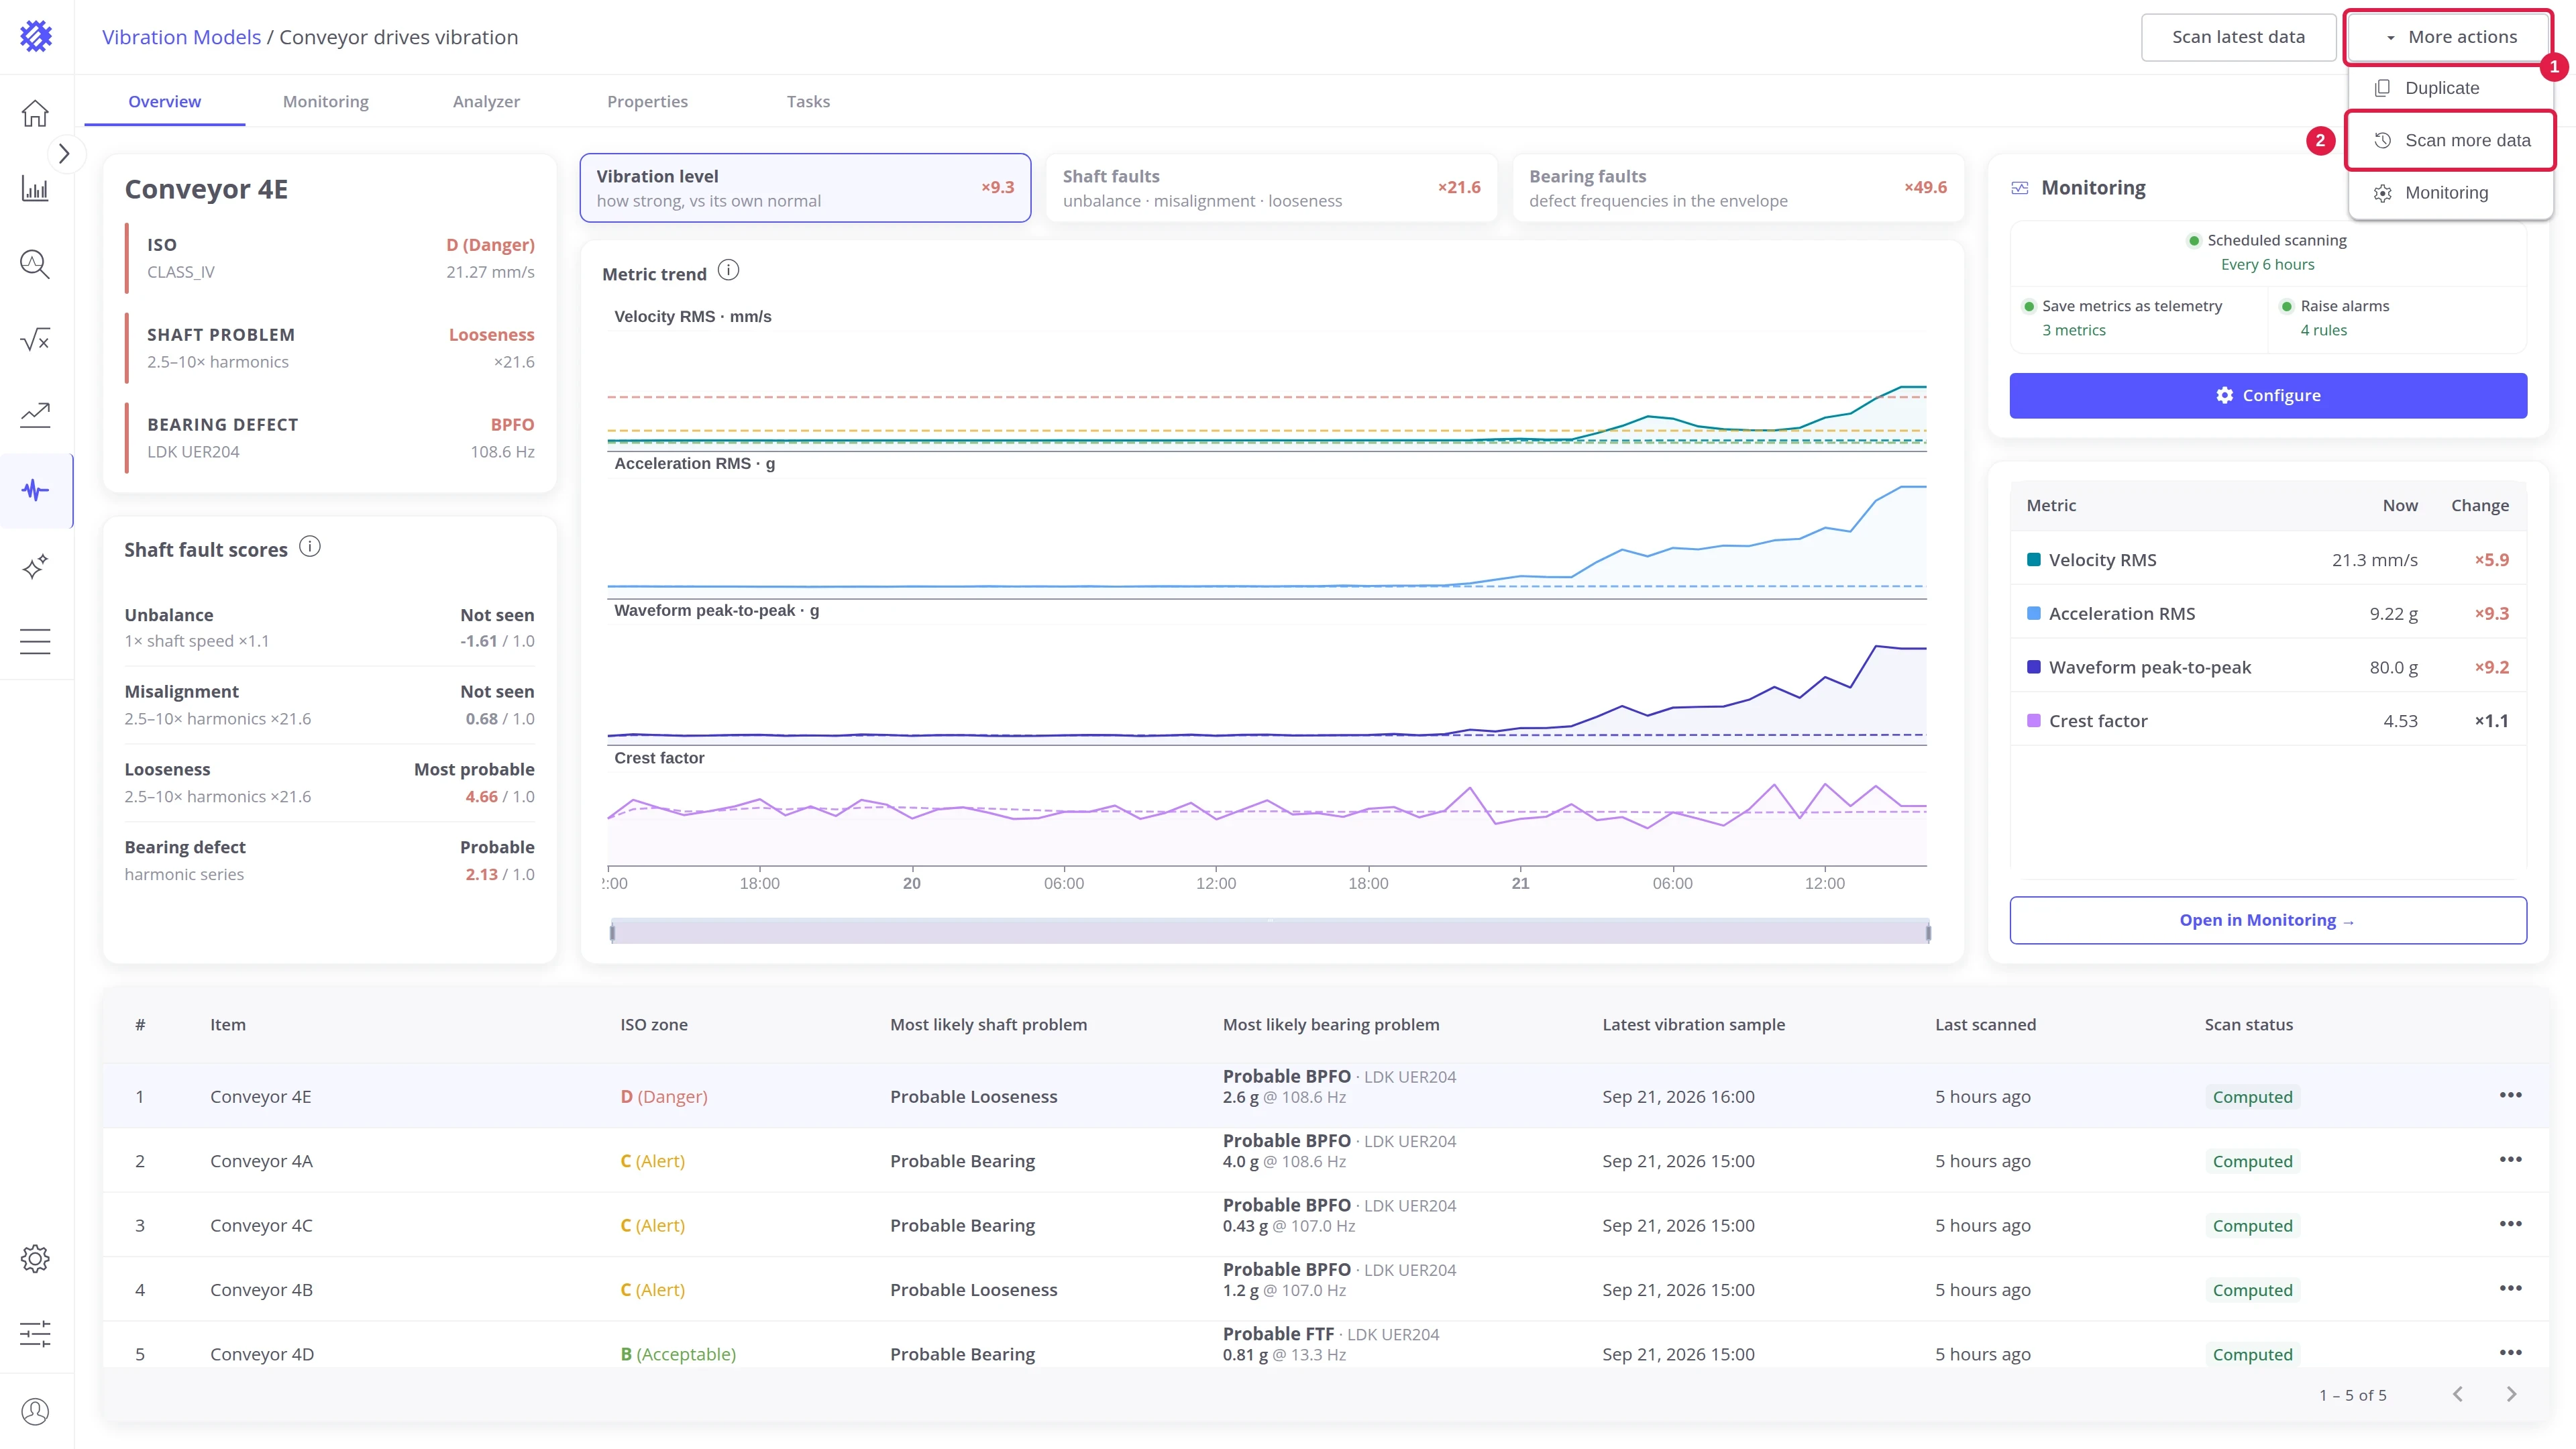
Section titled “Scan more data”Scan a period of history, for example to fill a gap, to rescan after the data was fixed, or to add machines.
-
Click More actions (1) and choose Scan more data (2).
-
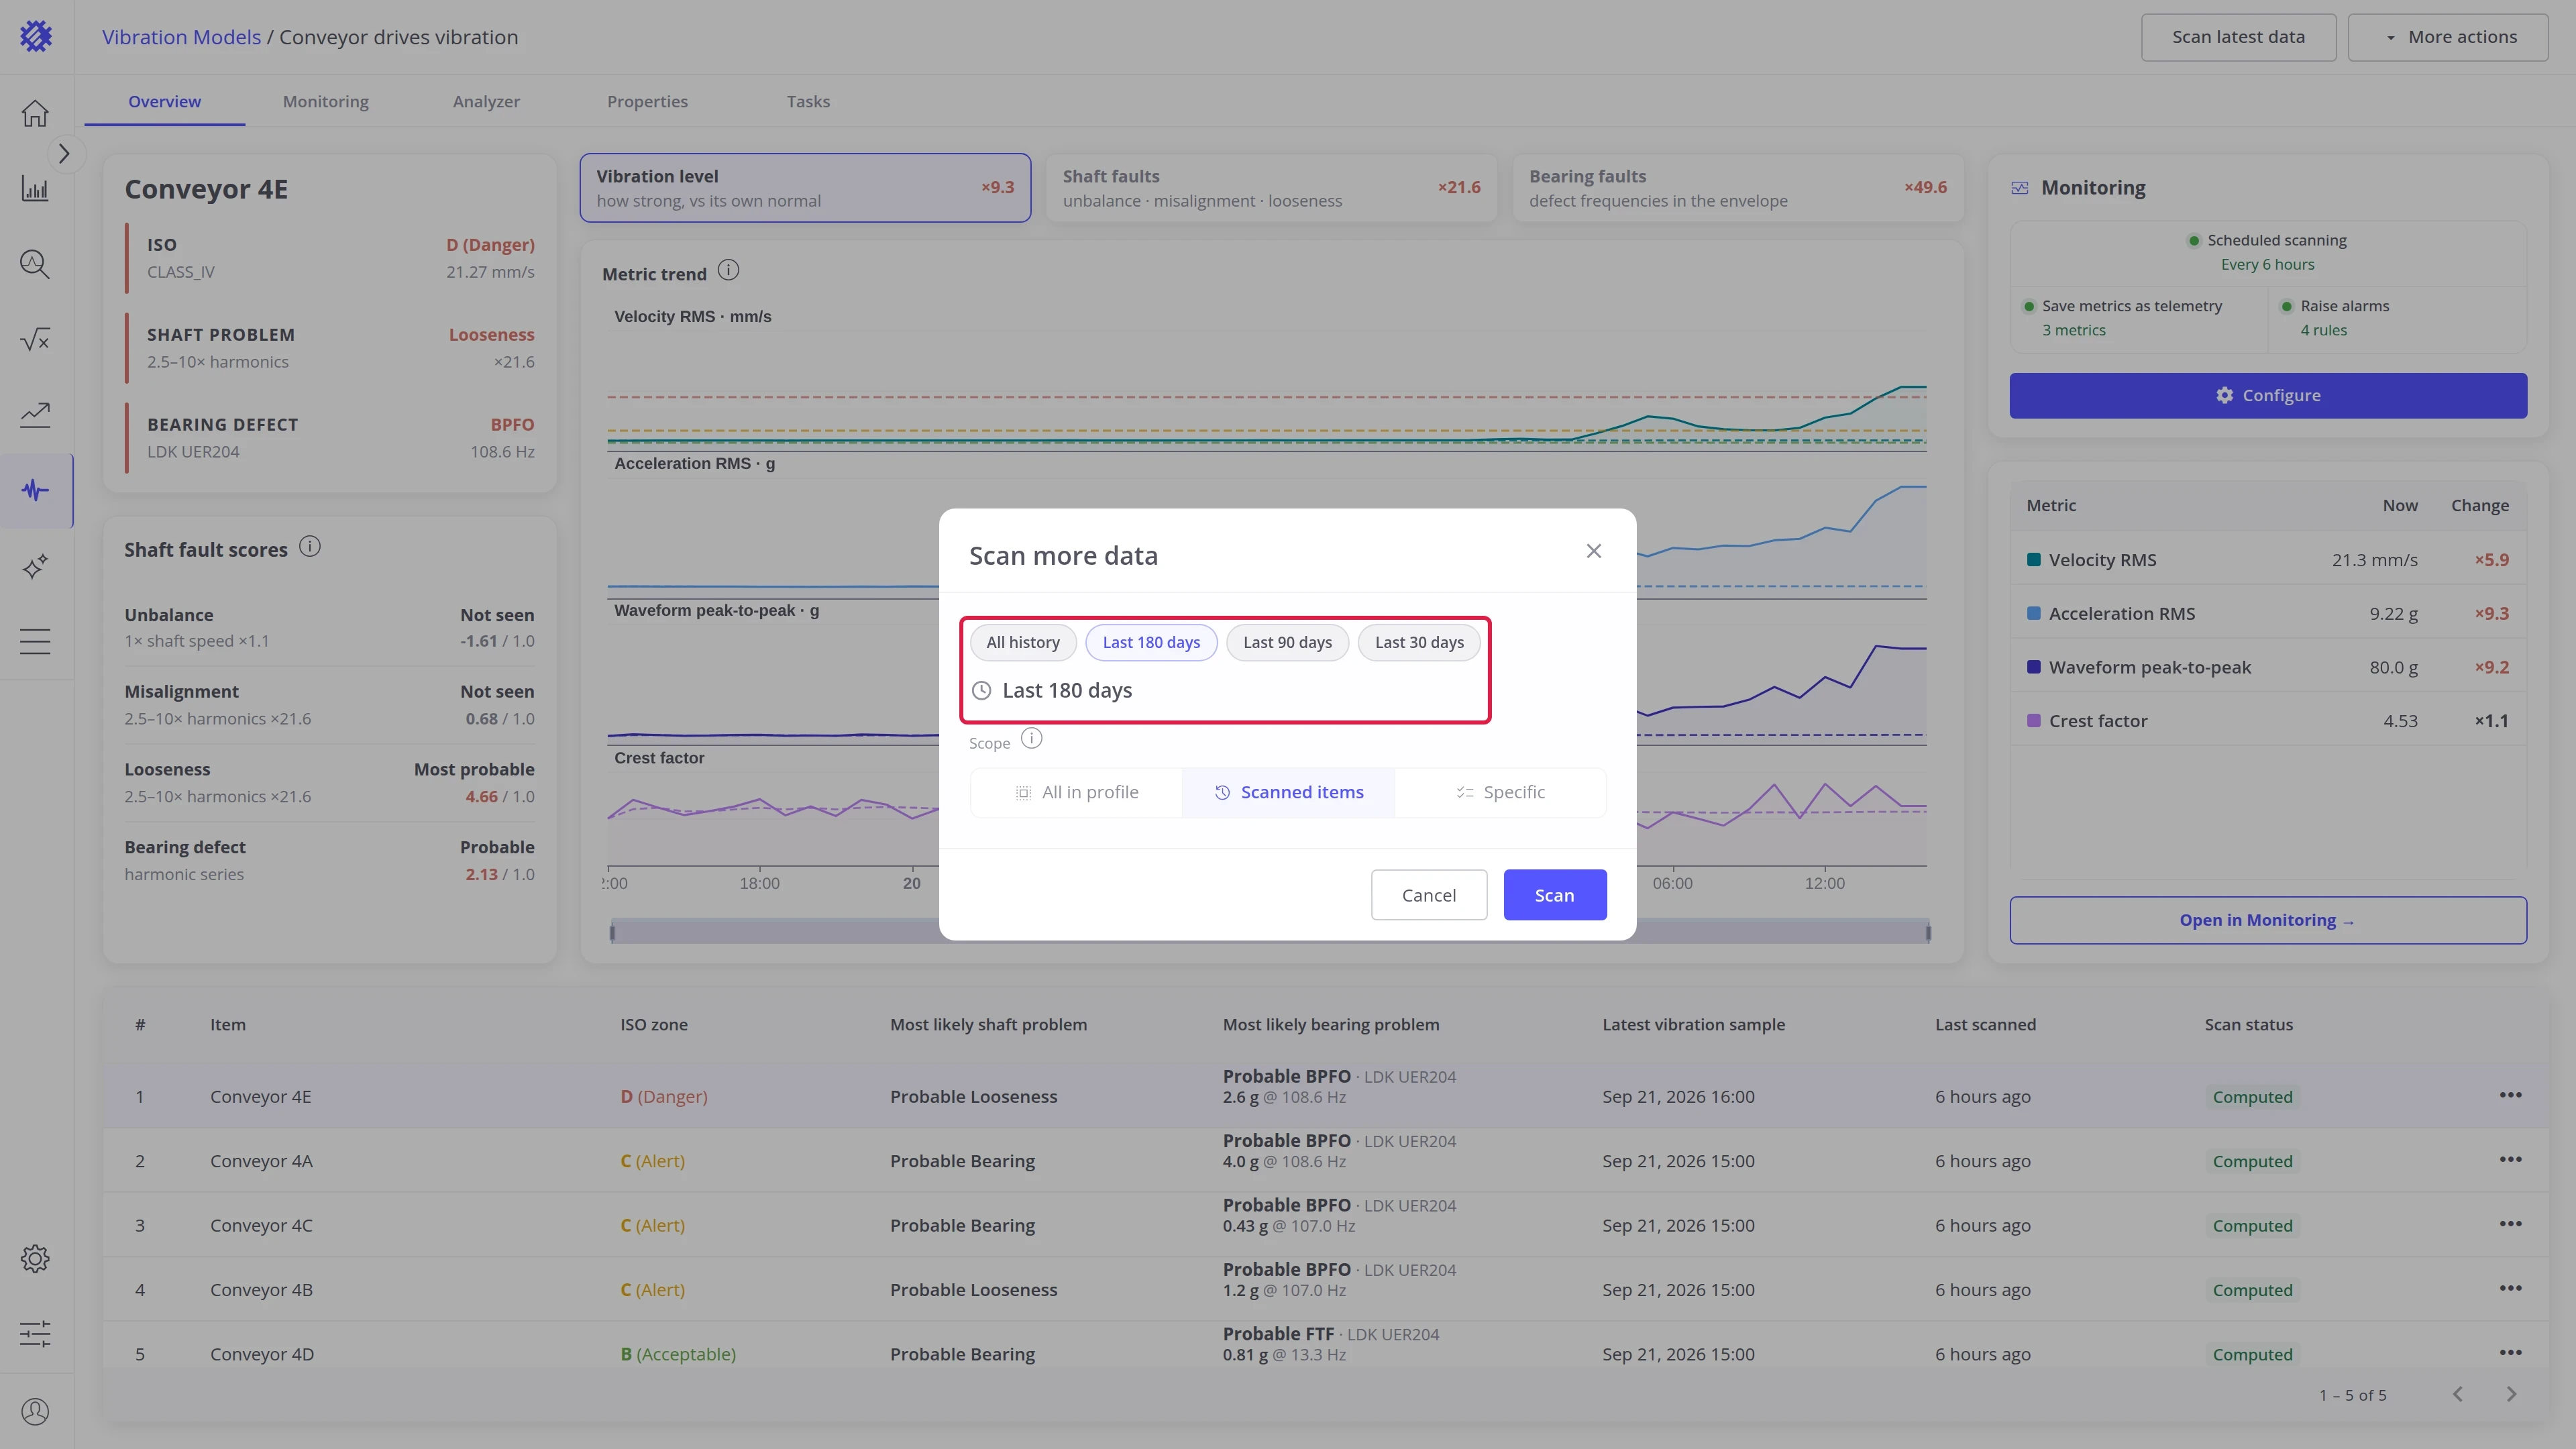
Pick the period: All history, Last 180 days, Last 90 days, Last 30 days, or a custom range.
-
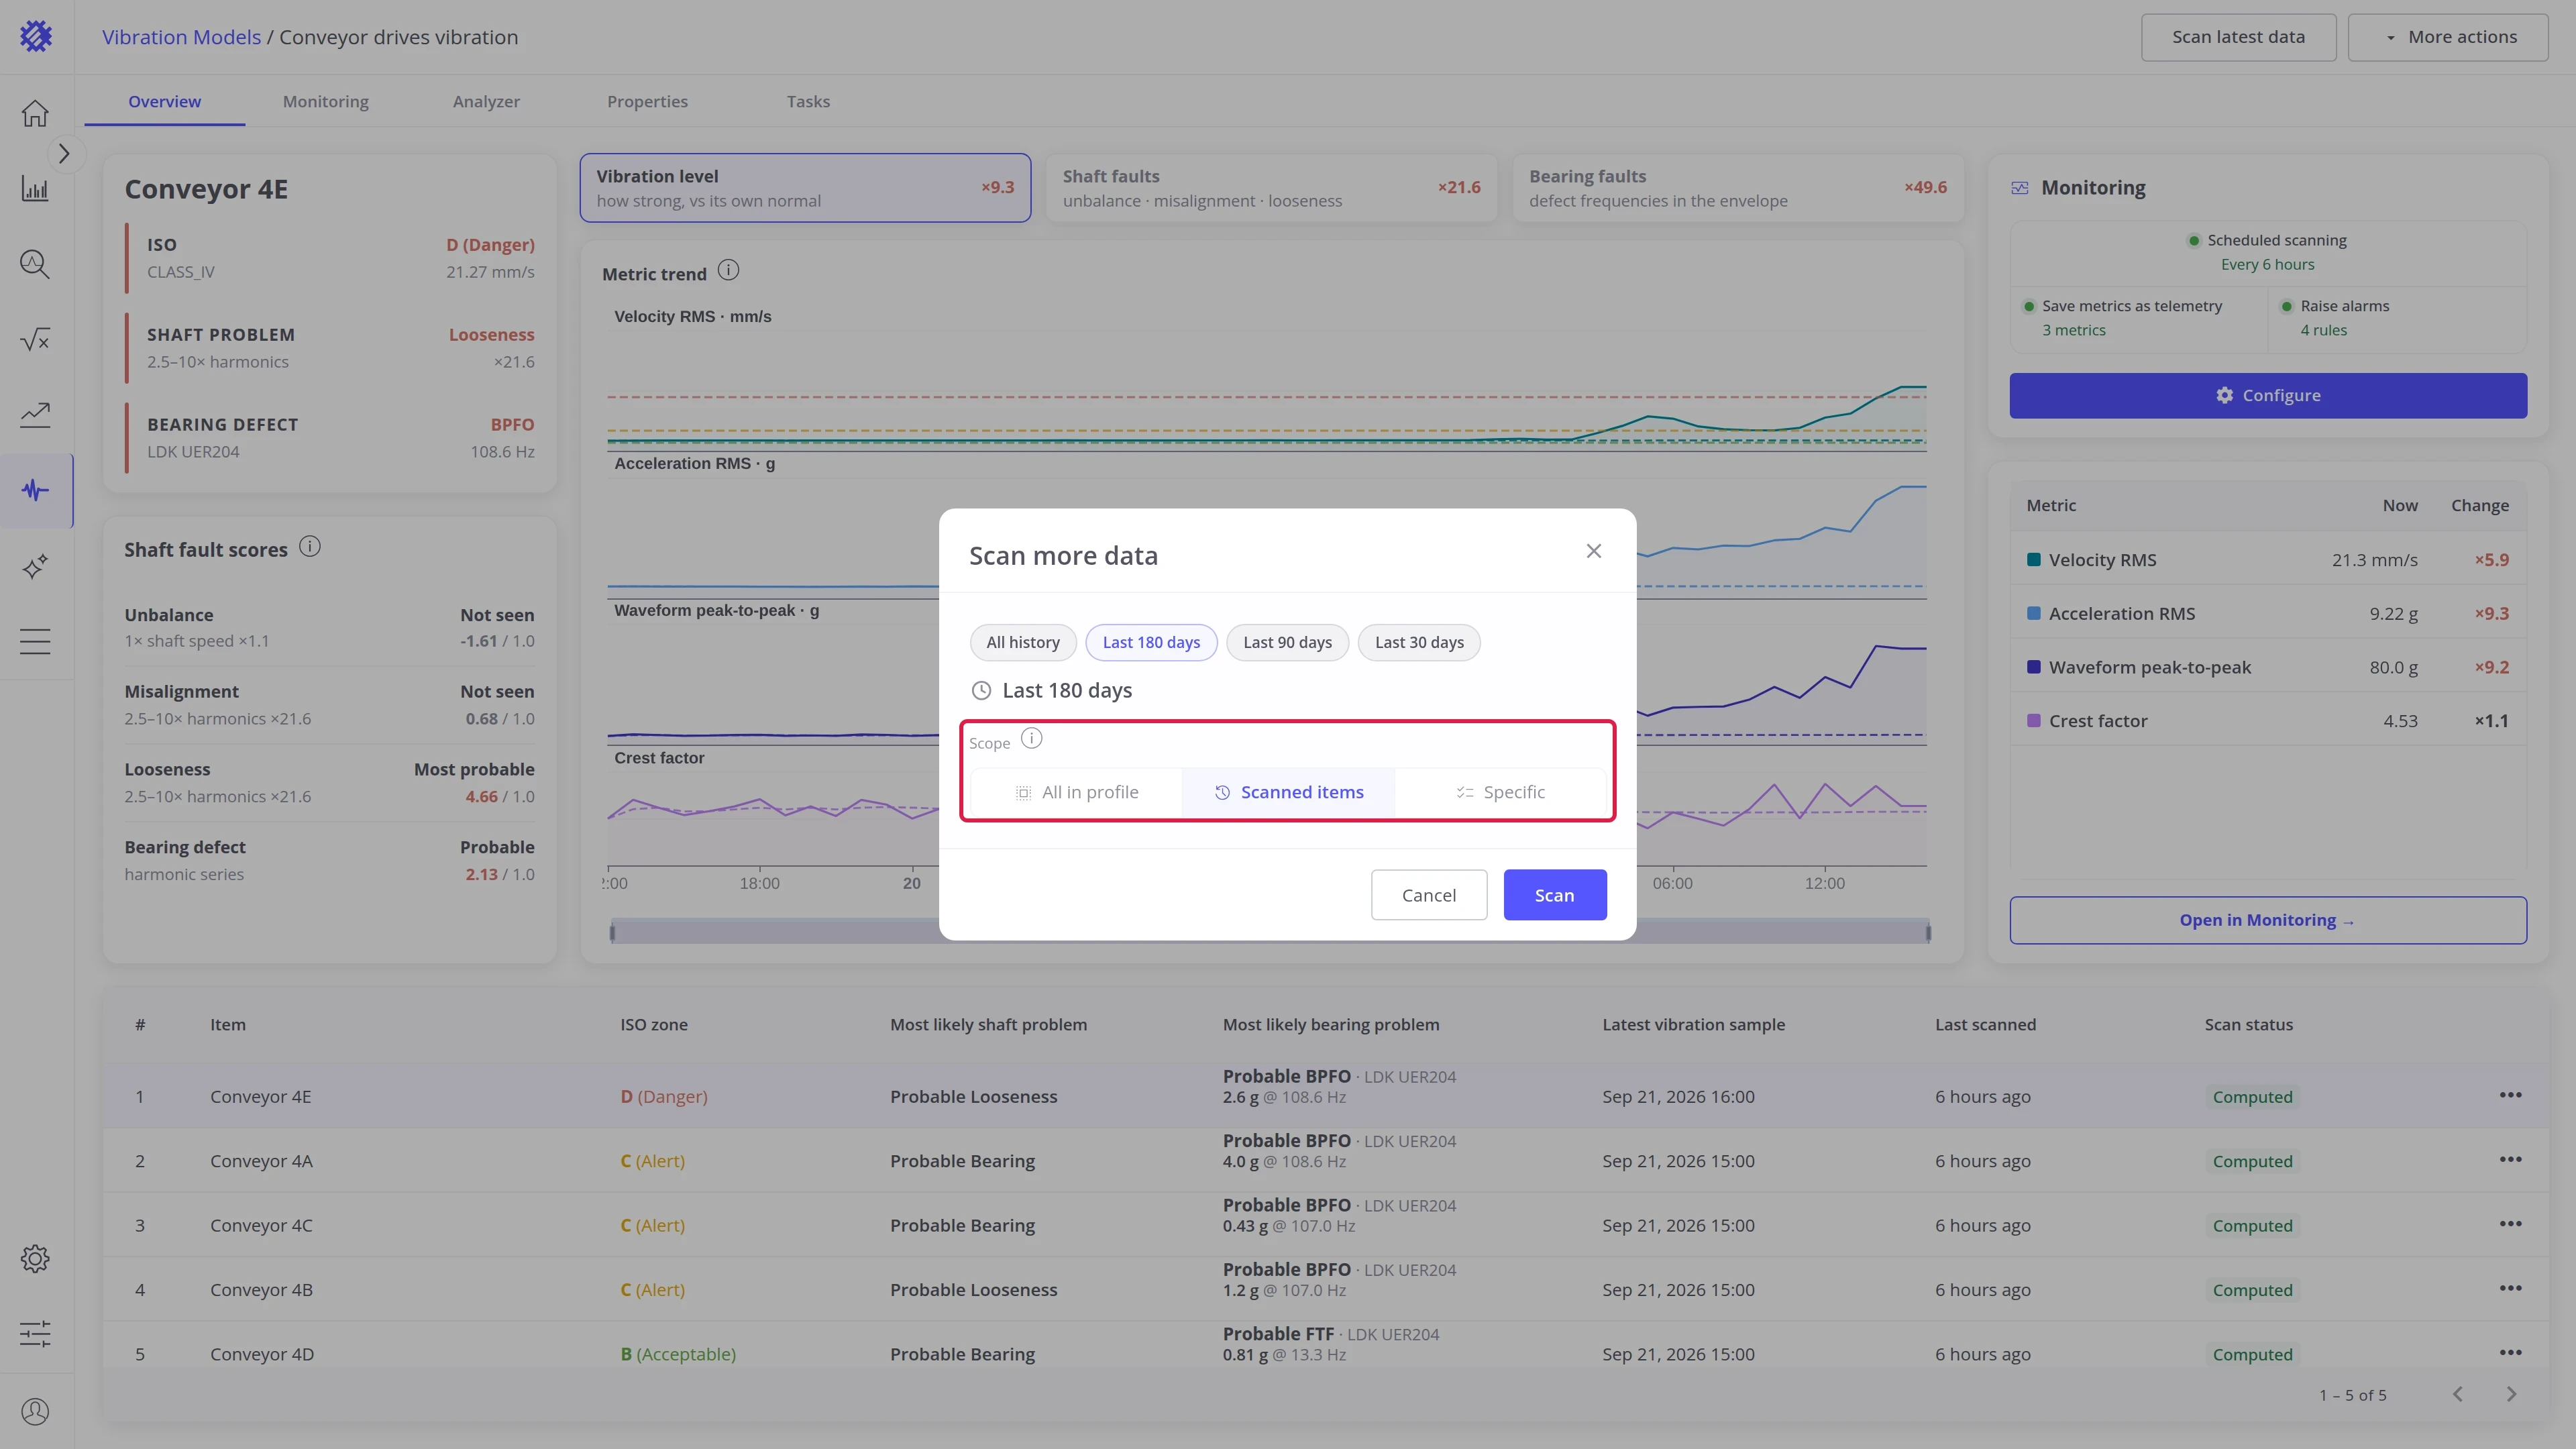
Pick the machines under Scope:
Scope Scans All in profile Every machine of the profile, including ones not scanned yet Scanned items The machines the model already holds Specific Only the machines you pick -
Click Scan. Results already stored for that period are replaced.
Monitoring
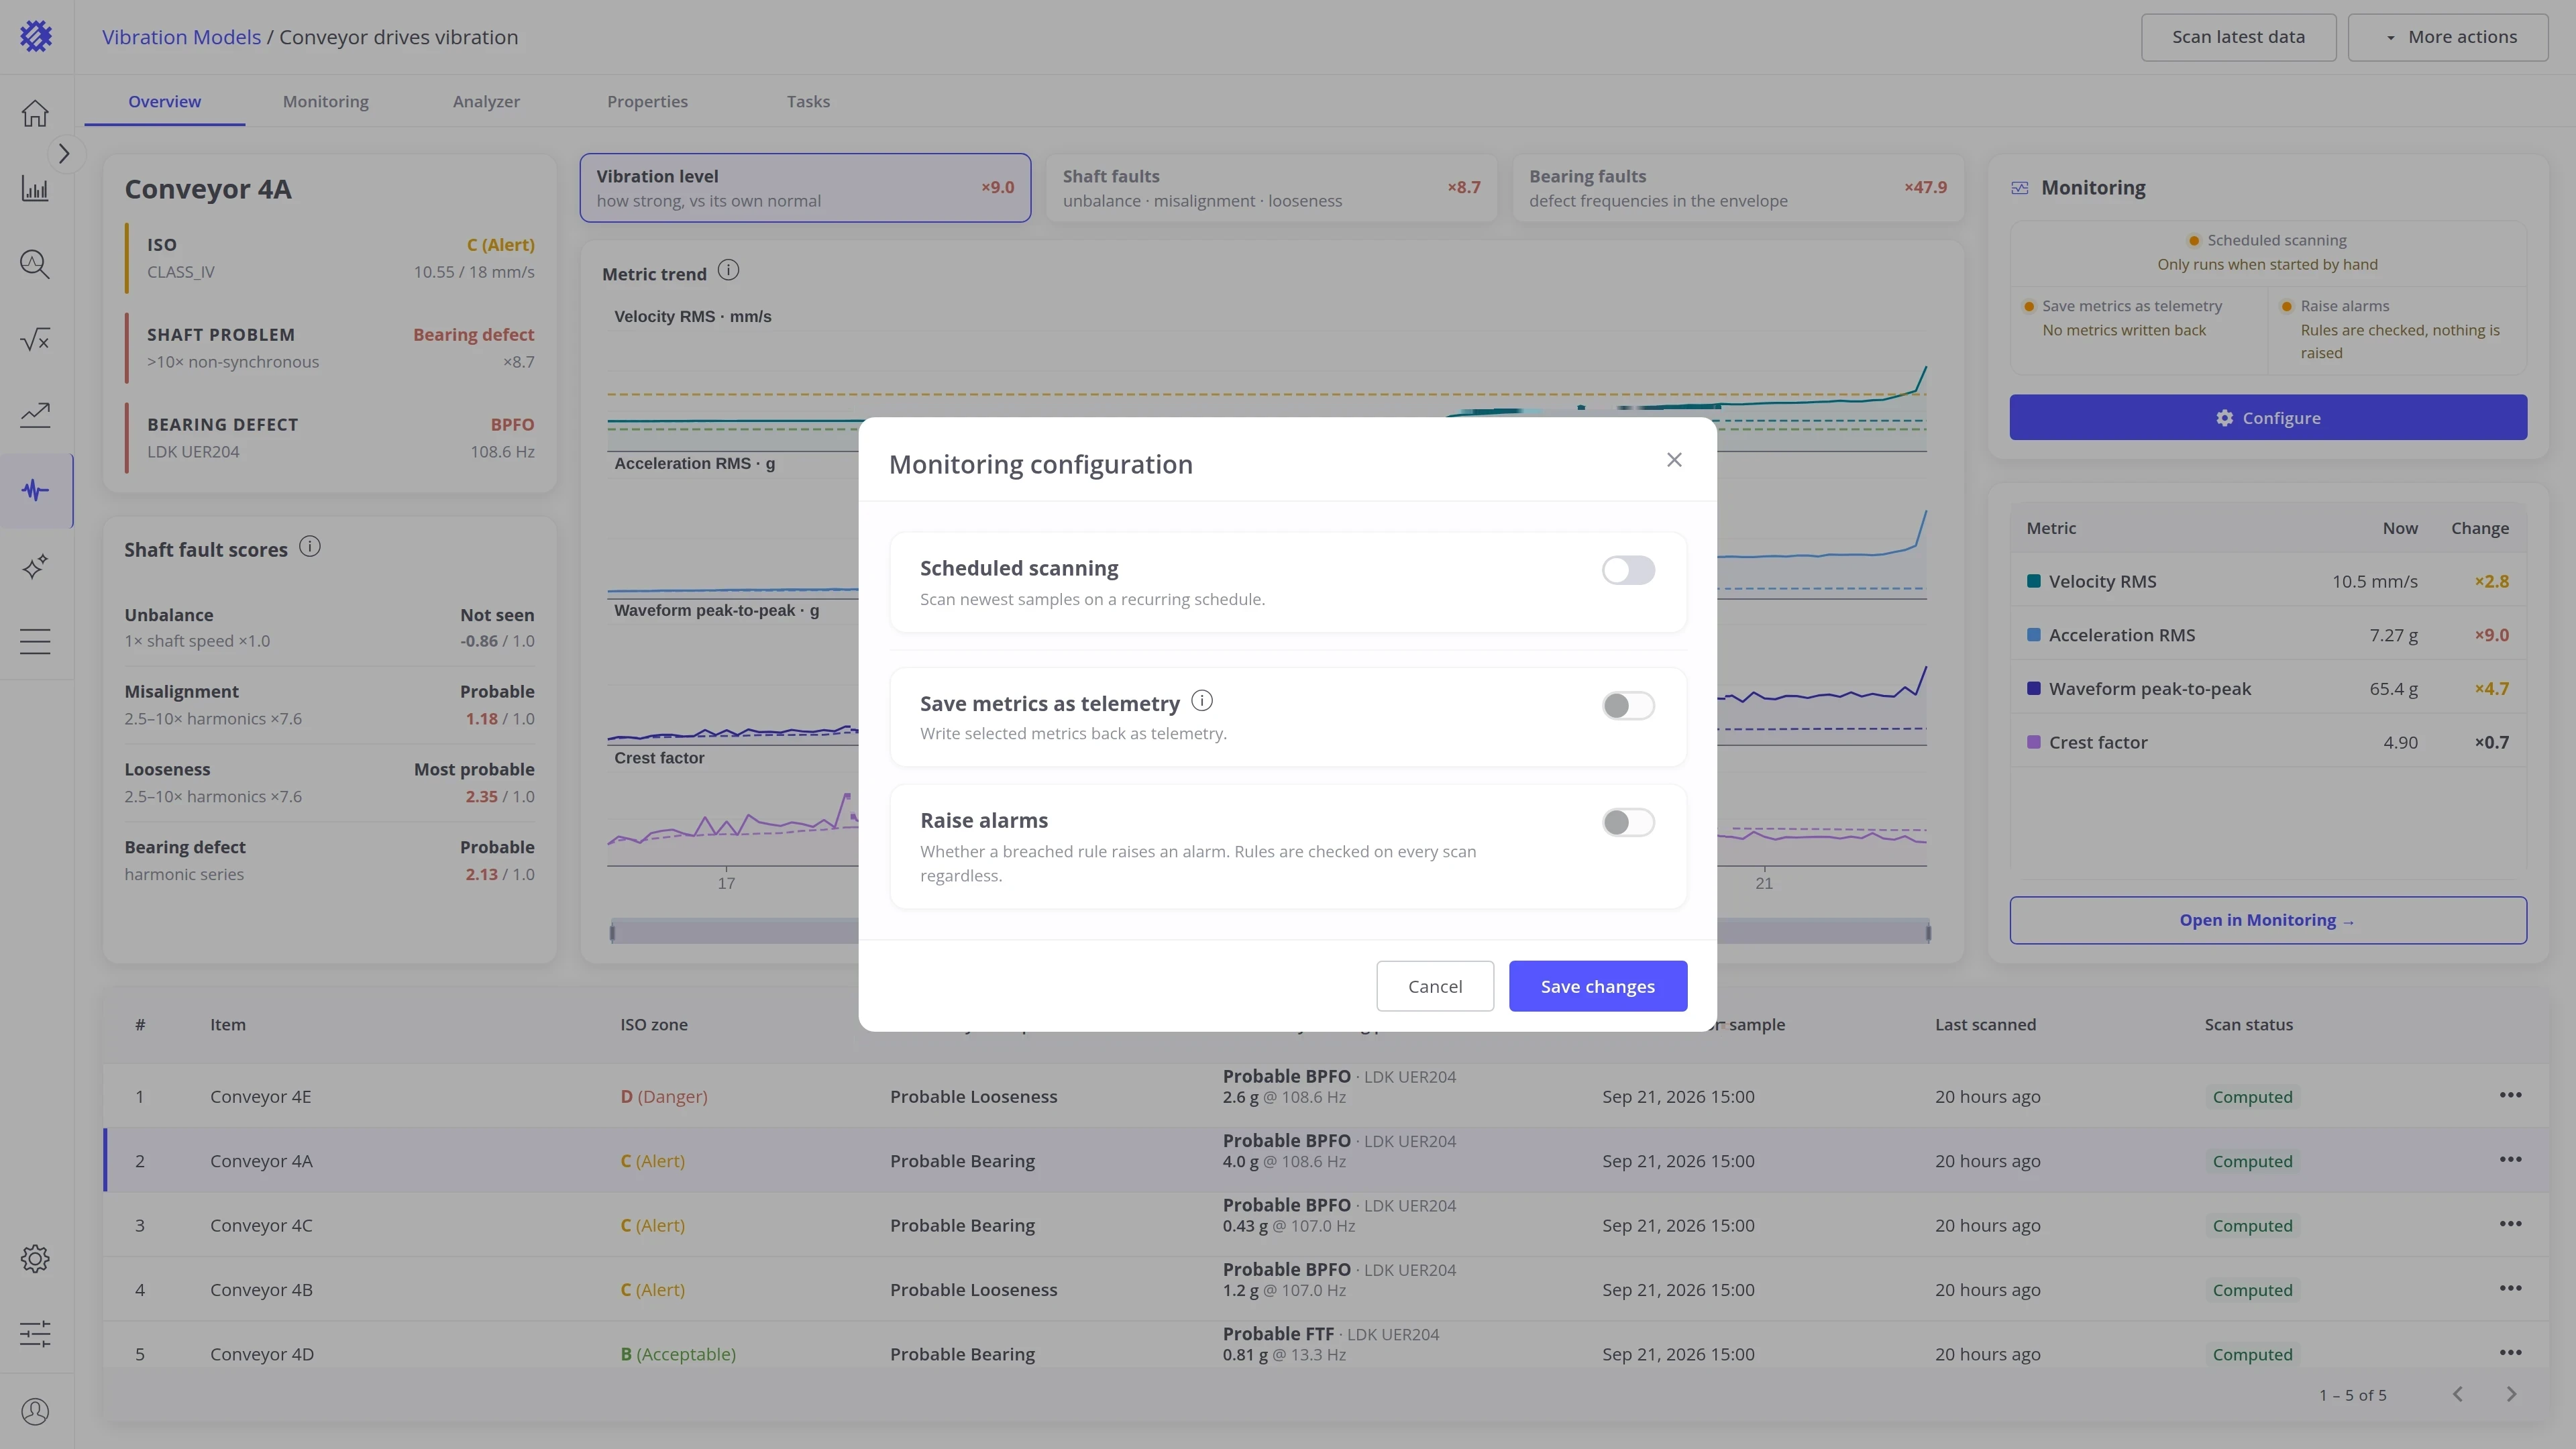
Section titled “Monitoring”Set how the model keeps working on its own: scanning on a schedule, saving metrics to ThingsBoard, and raising alarms.
- Click More actions (1) and choose Monitoring (2).
- Switch on what you need and click Save changes.
The same dialog opens from Configure on the Monitoring card. Each switch is described in Monitoring & Alarms.
Explore the tabs in detail
Section titled “Explore the tabs in detail”-
Overview tab
Read the verdict for each machine: its ISO zone, the shaft problem, and the bearing defect that fits best.
-
Monitoring tab
Follow the model over time: alarm state, metric trends, and the alarms raised.
-
Analyzer tab
Open one sample: its waveform, spectrum, and envelope spectrum with fault frequencies marked.
-
Properties tab
Change what the model reads and how, and see which changes need a rescan.
Was this helpful?