Prediction Models Interface
Prediction models in the left menu is where you create, open, and manage prediction models. One model predicts one telemetry key for the items of one device or asset profile, and keeps its forecasts, events, and alarms up to date.
Layout
Section titled “Layout”Prediction models opens on two tabs. The Summary tab shows the state of every model at a glance.
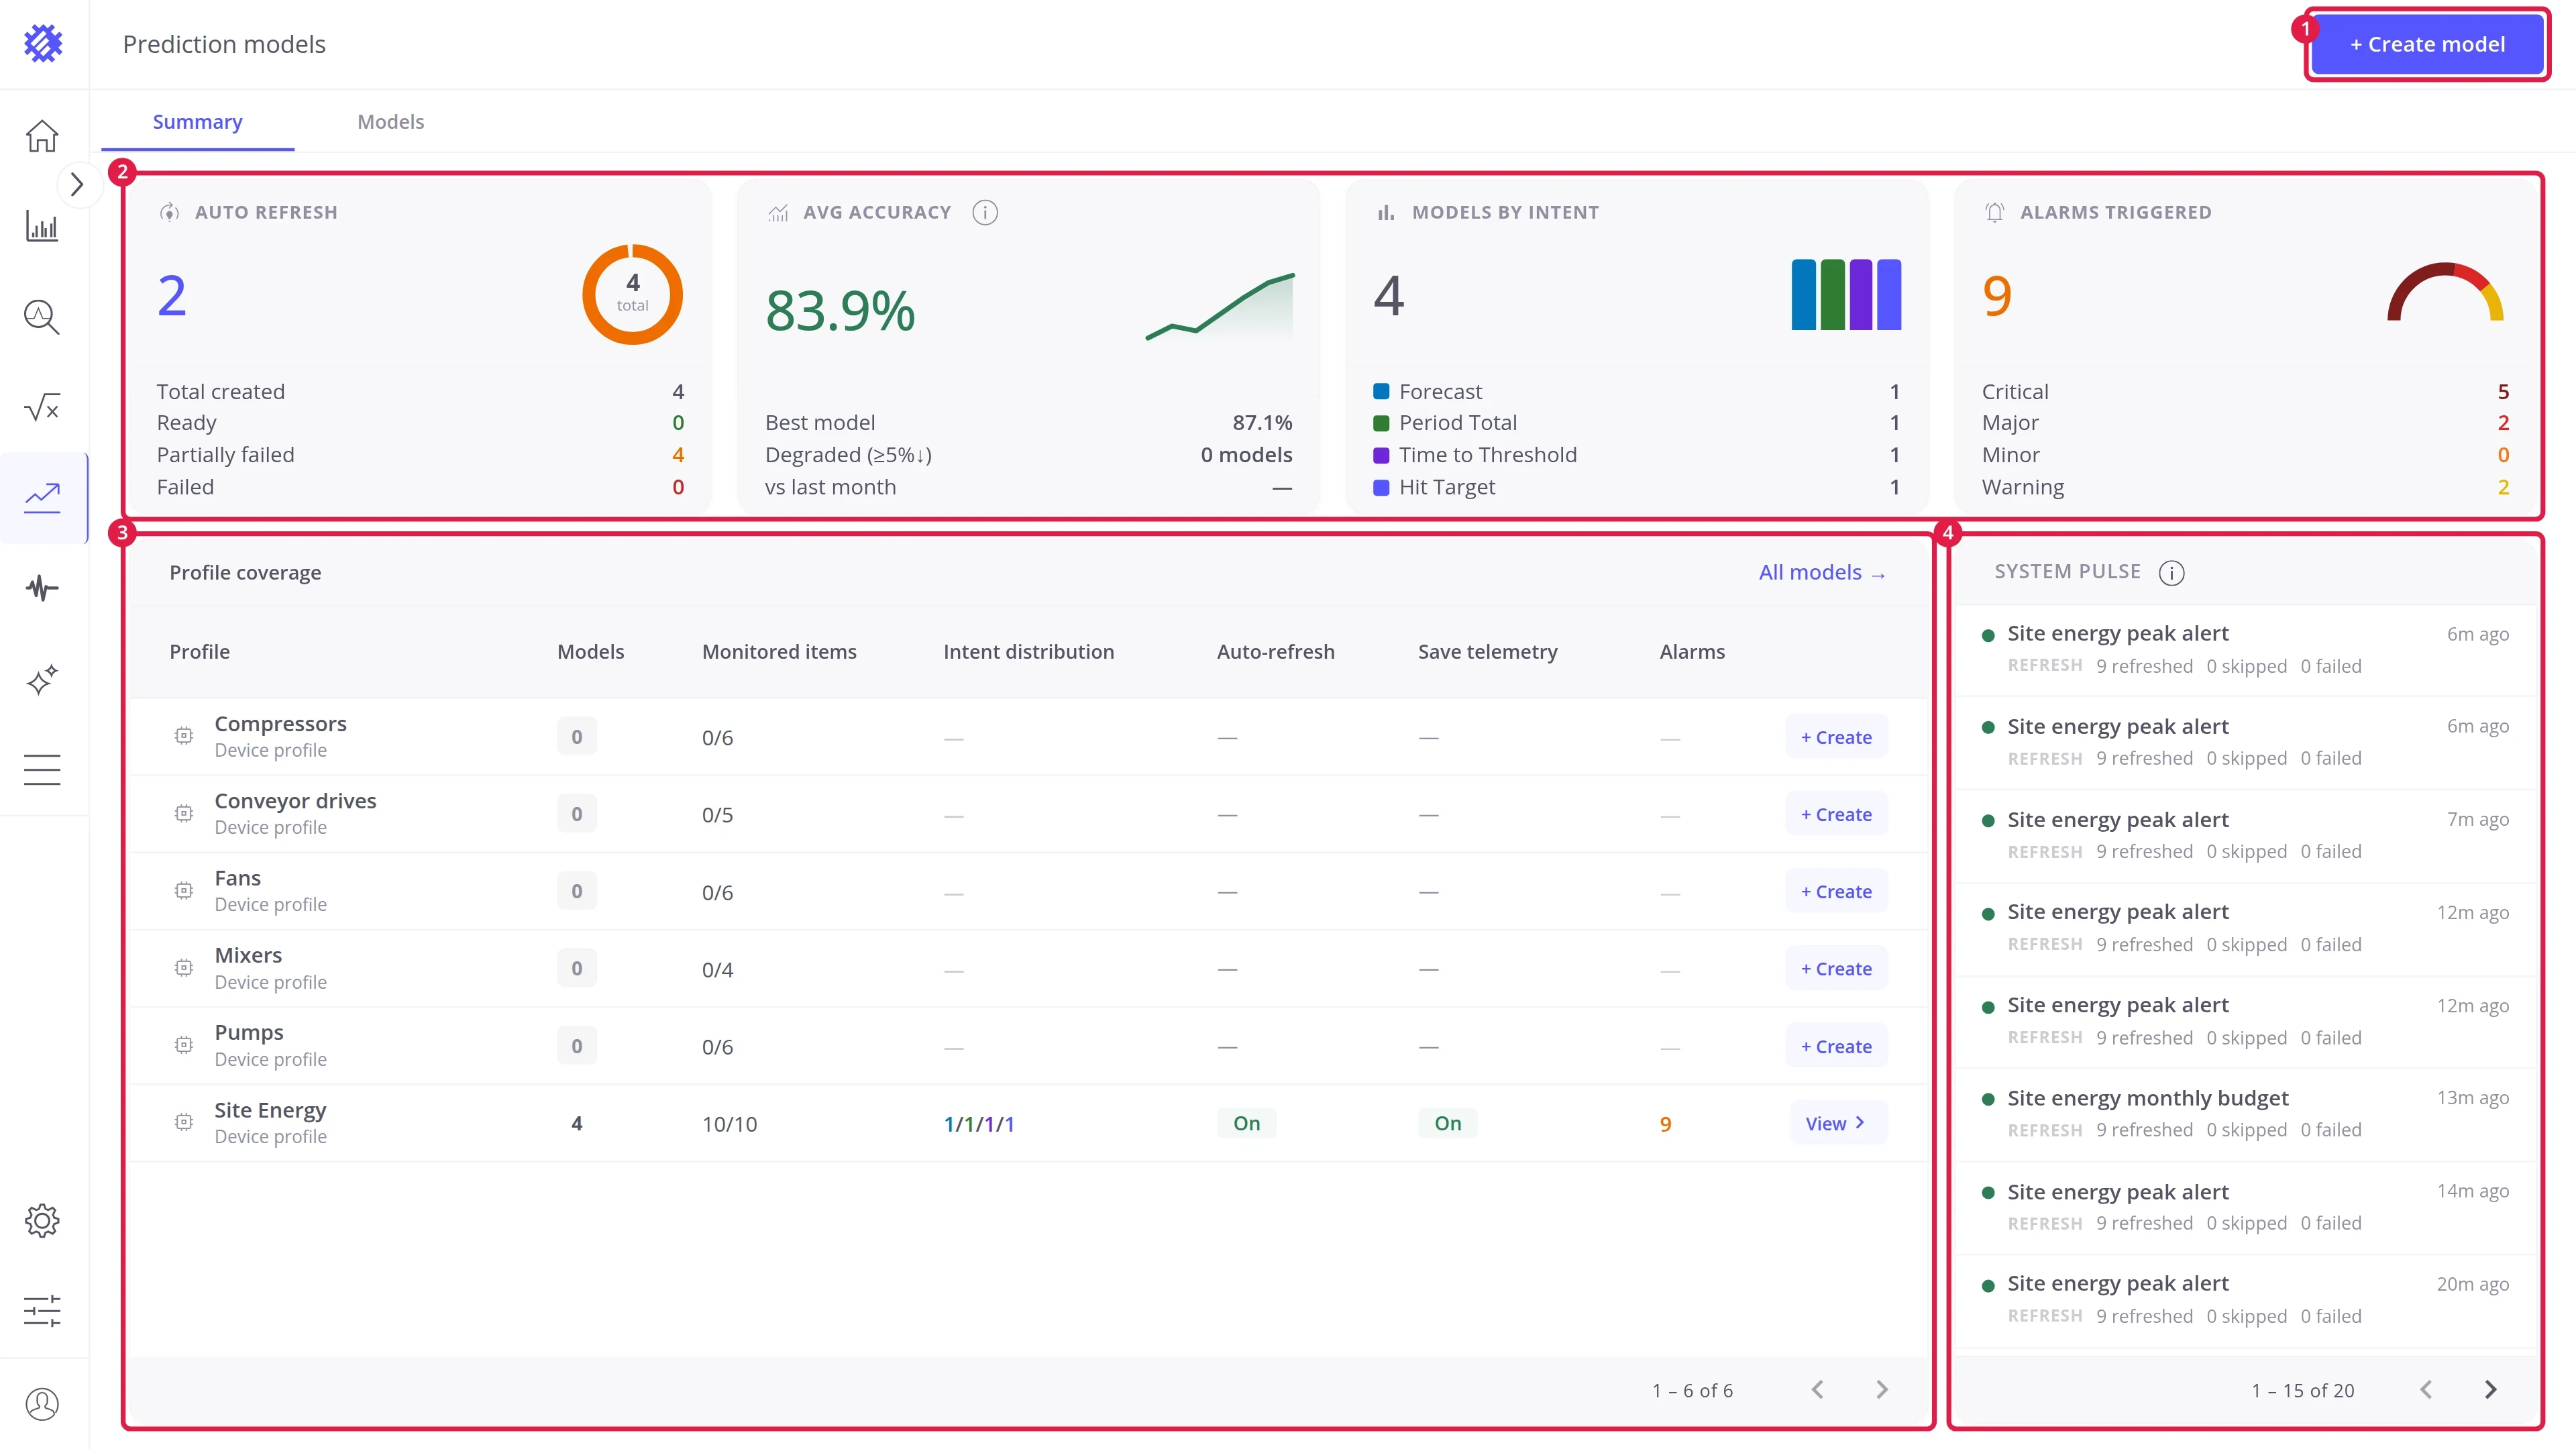
| # | Area | Contents |
|---|---|---|
| 1 | Create model | Opens the wizard, described in Getting Started |
| 2 | Summary cards | Refresh, accuracy, intents, and alarms across all models |
| 3 | Profile coverage | Every profile with the models built on it |
| 4 | System pulse | The latest training and refresh runs |
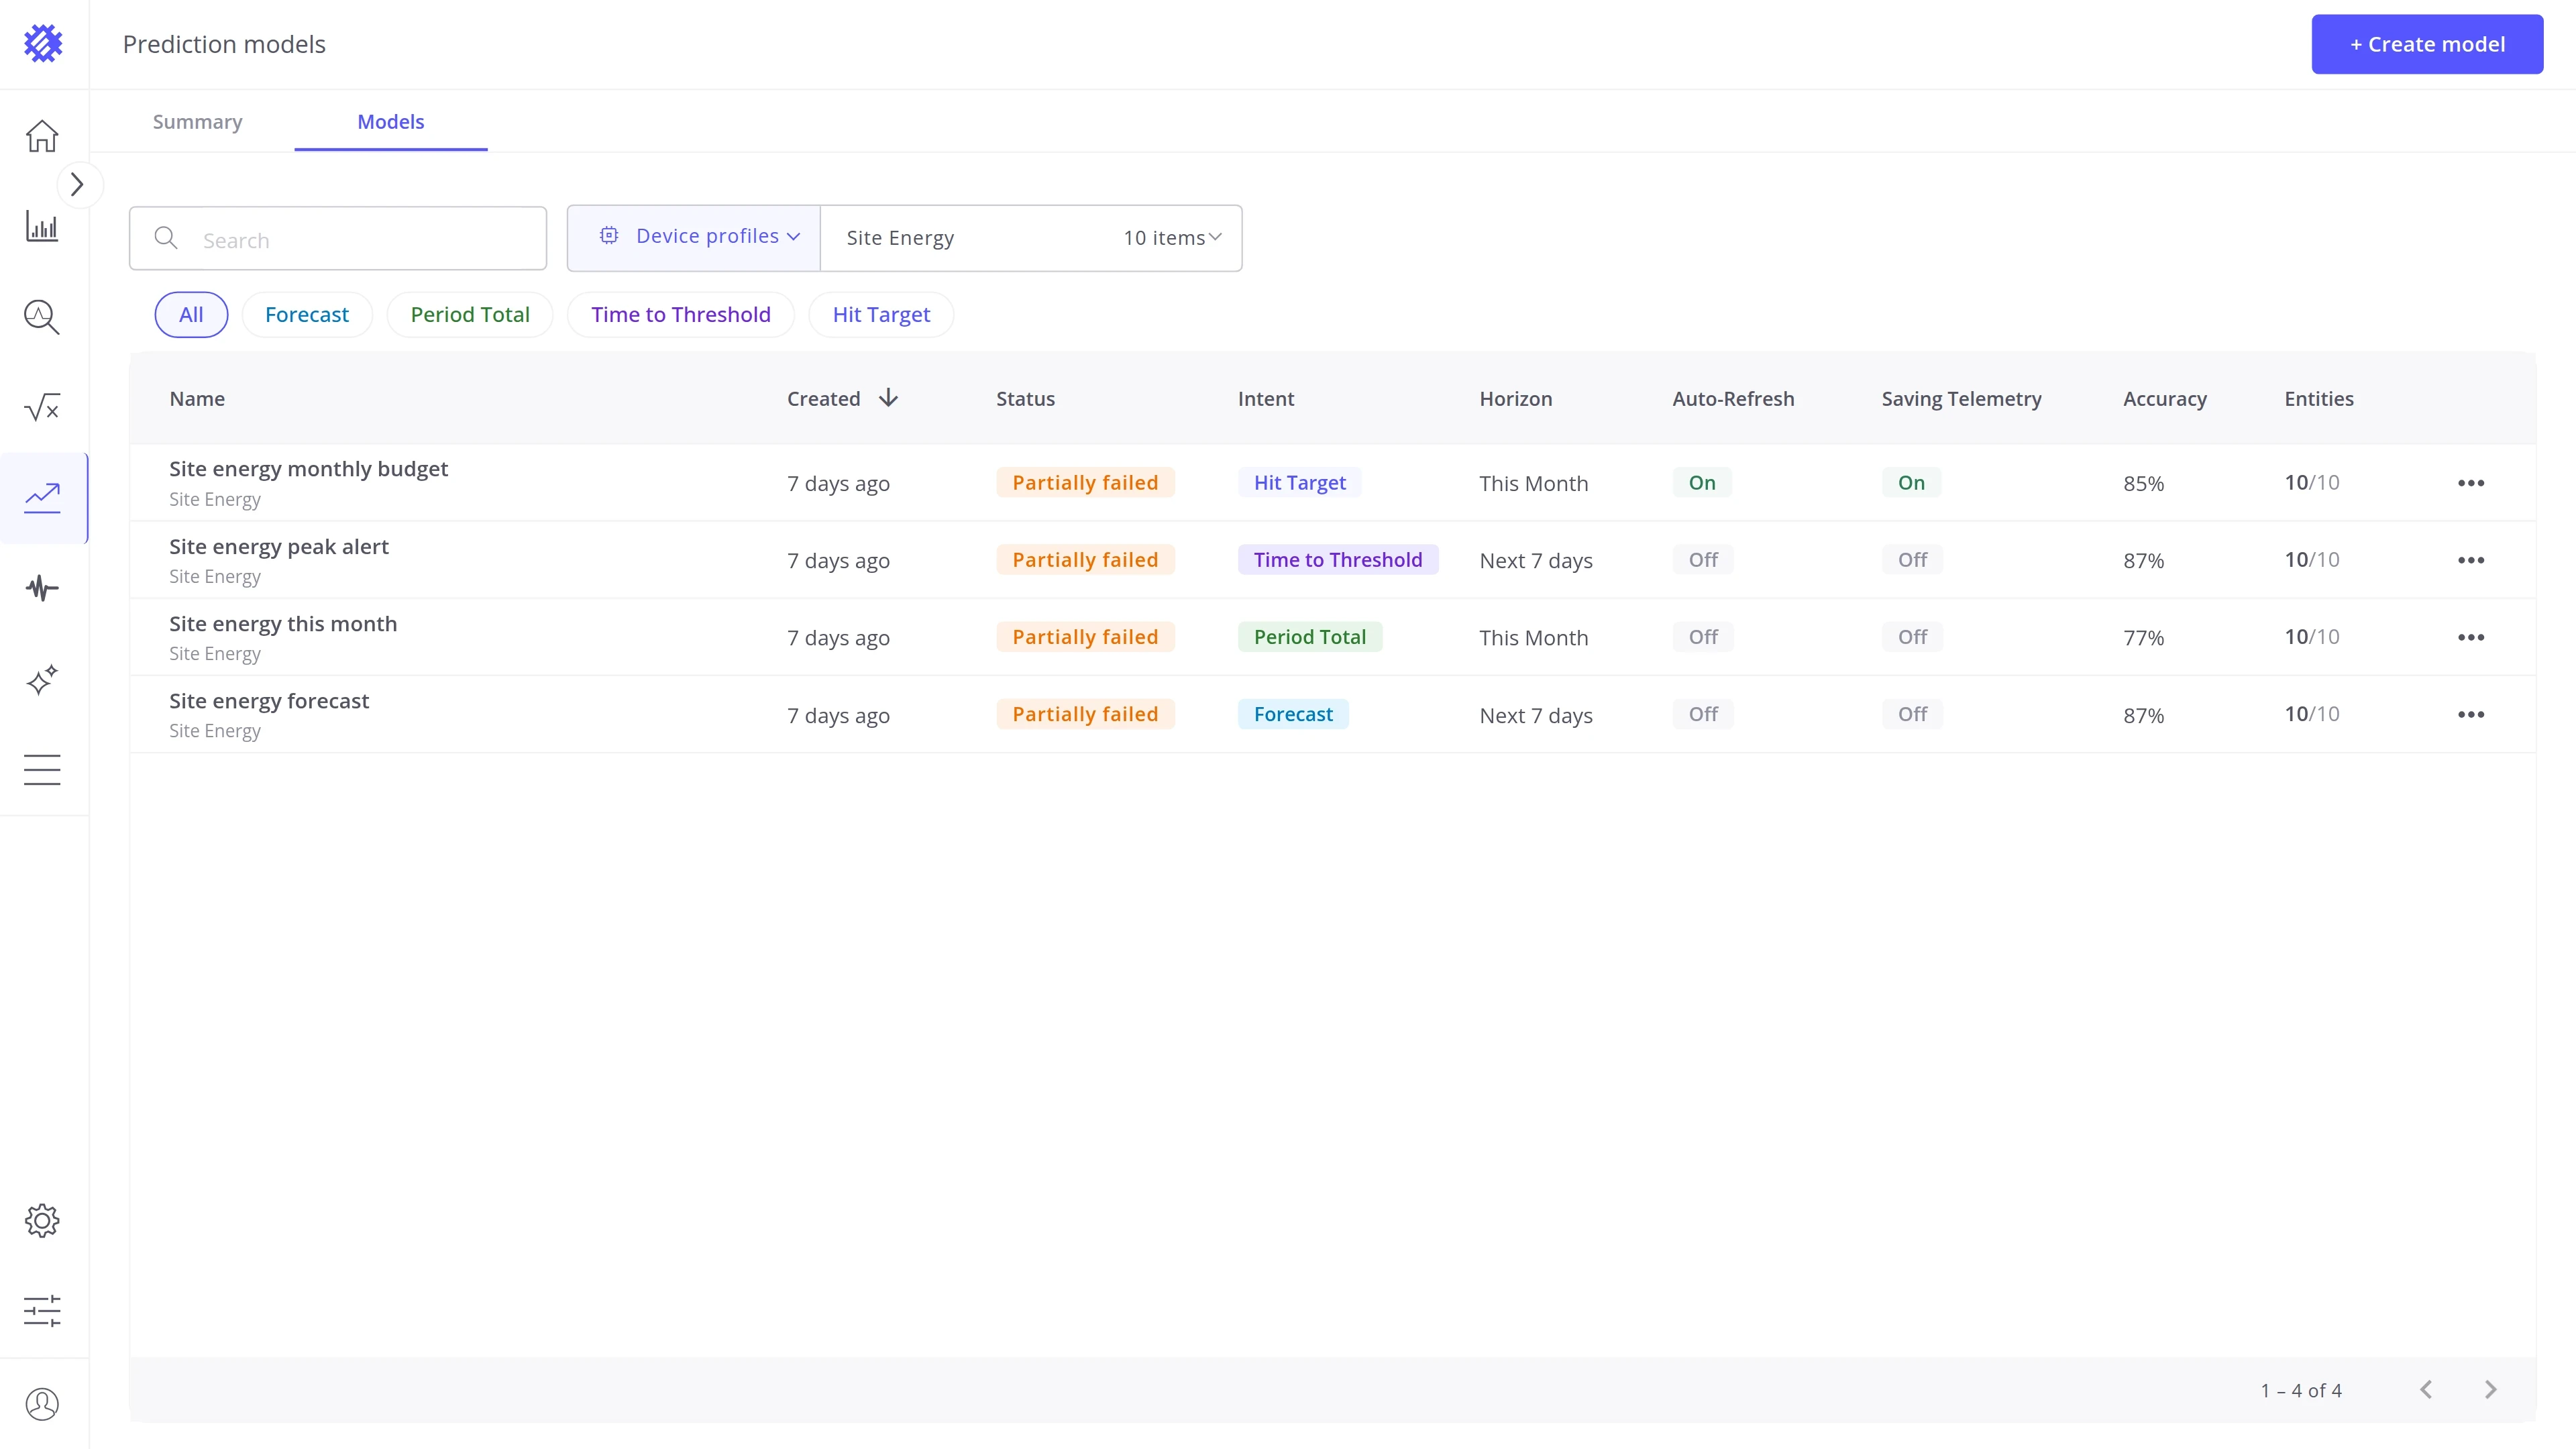
The Models tab lists every model. Click a model to see its details beside the table.
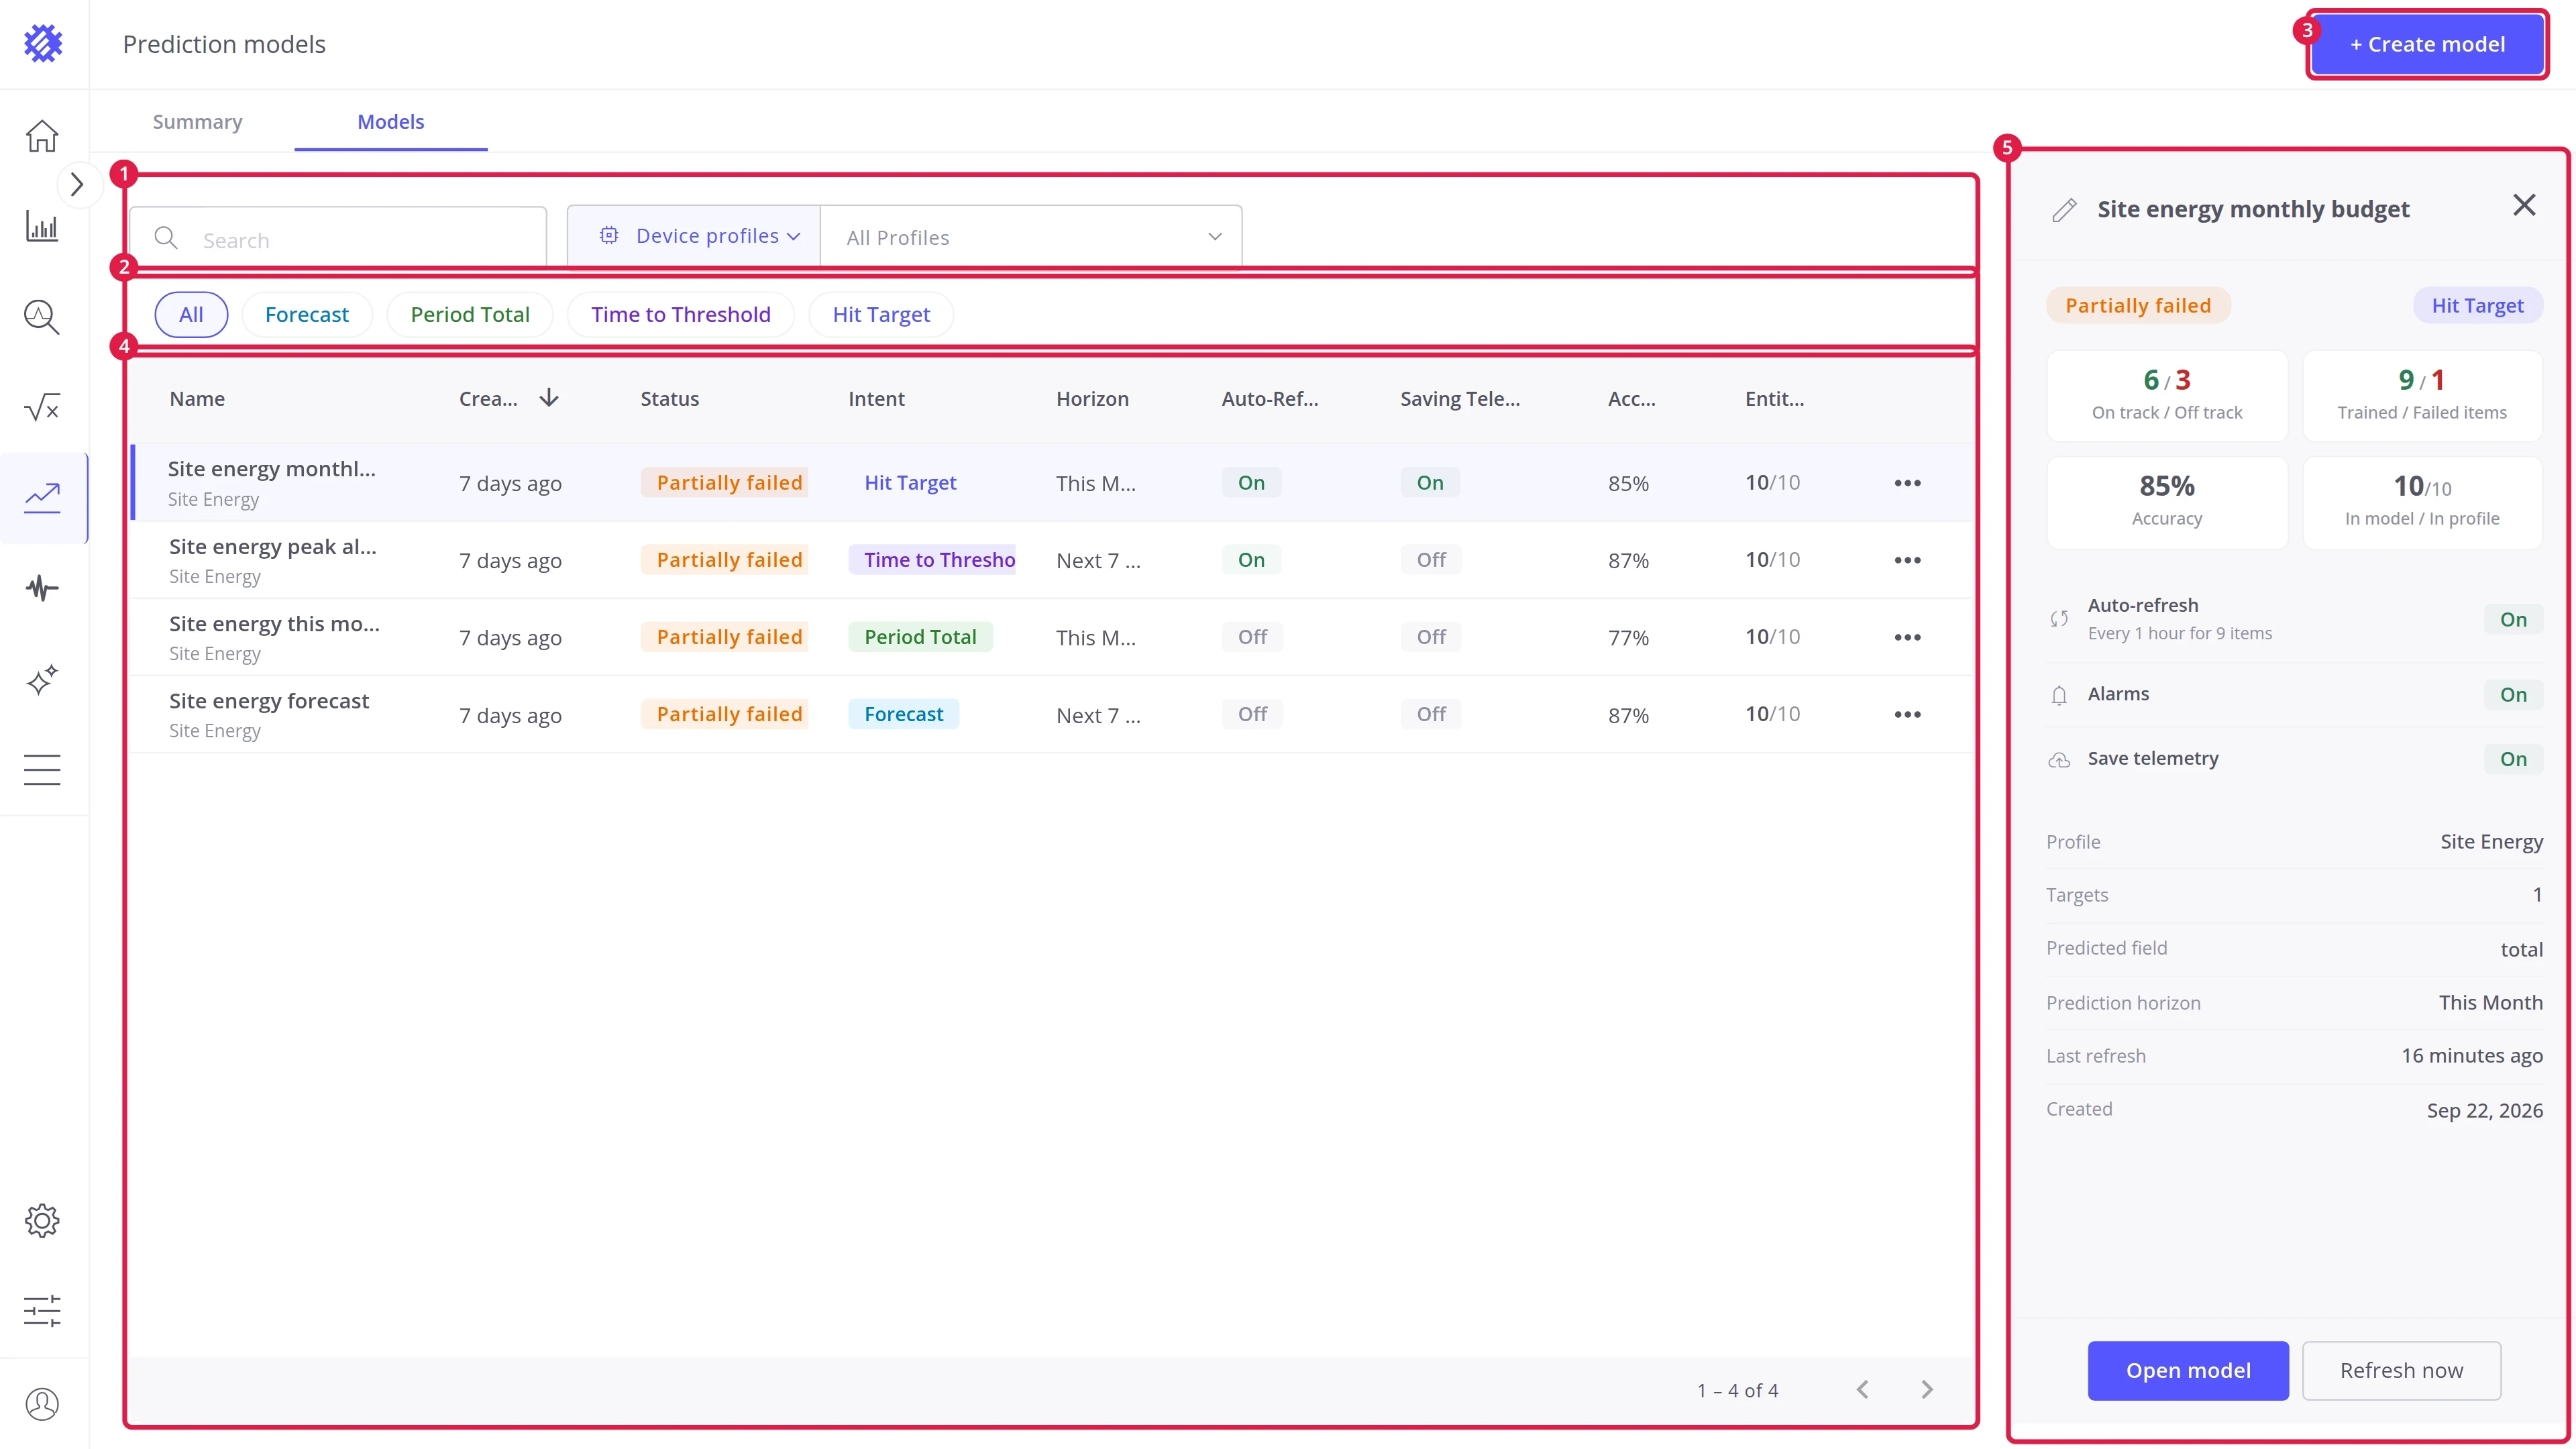
| # | Area | Contents |
|---|---|---|
| 1 | Search and profile filter | Find a model by name, or show the models of one profile |
| 2 | Intent chips | Show the models of one intent |
| 3 | Create model | Opens the wizard |
| 4 | Models | Every model with its status, intent, and accuracy. The row menu renames or deletes a model |
| 5 | Detail panel | The selected model at a glance, with Open model and Refresh now |
Model level
Section titled “Model level”The model page shows one model. Its tabs show the results and settings, and its actions work on the whole model.
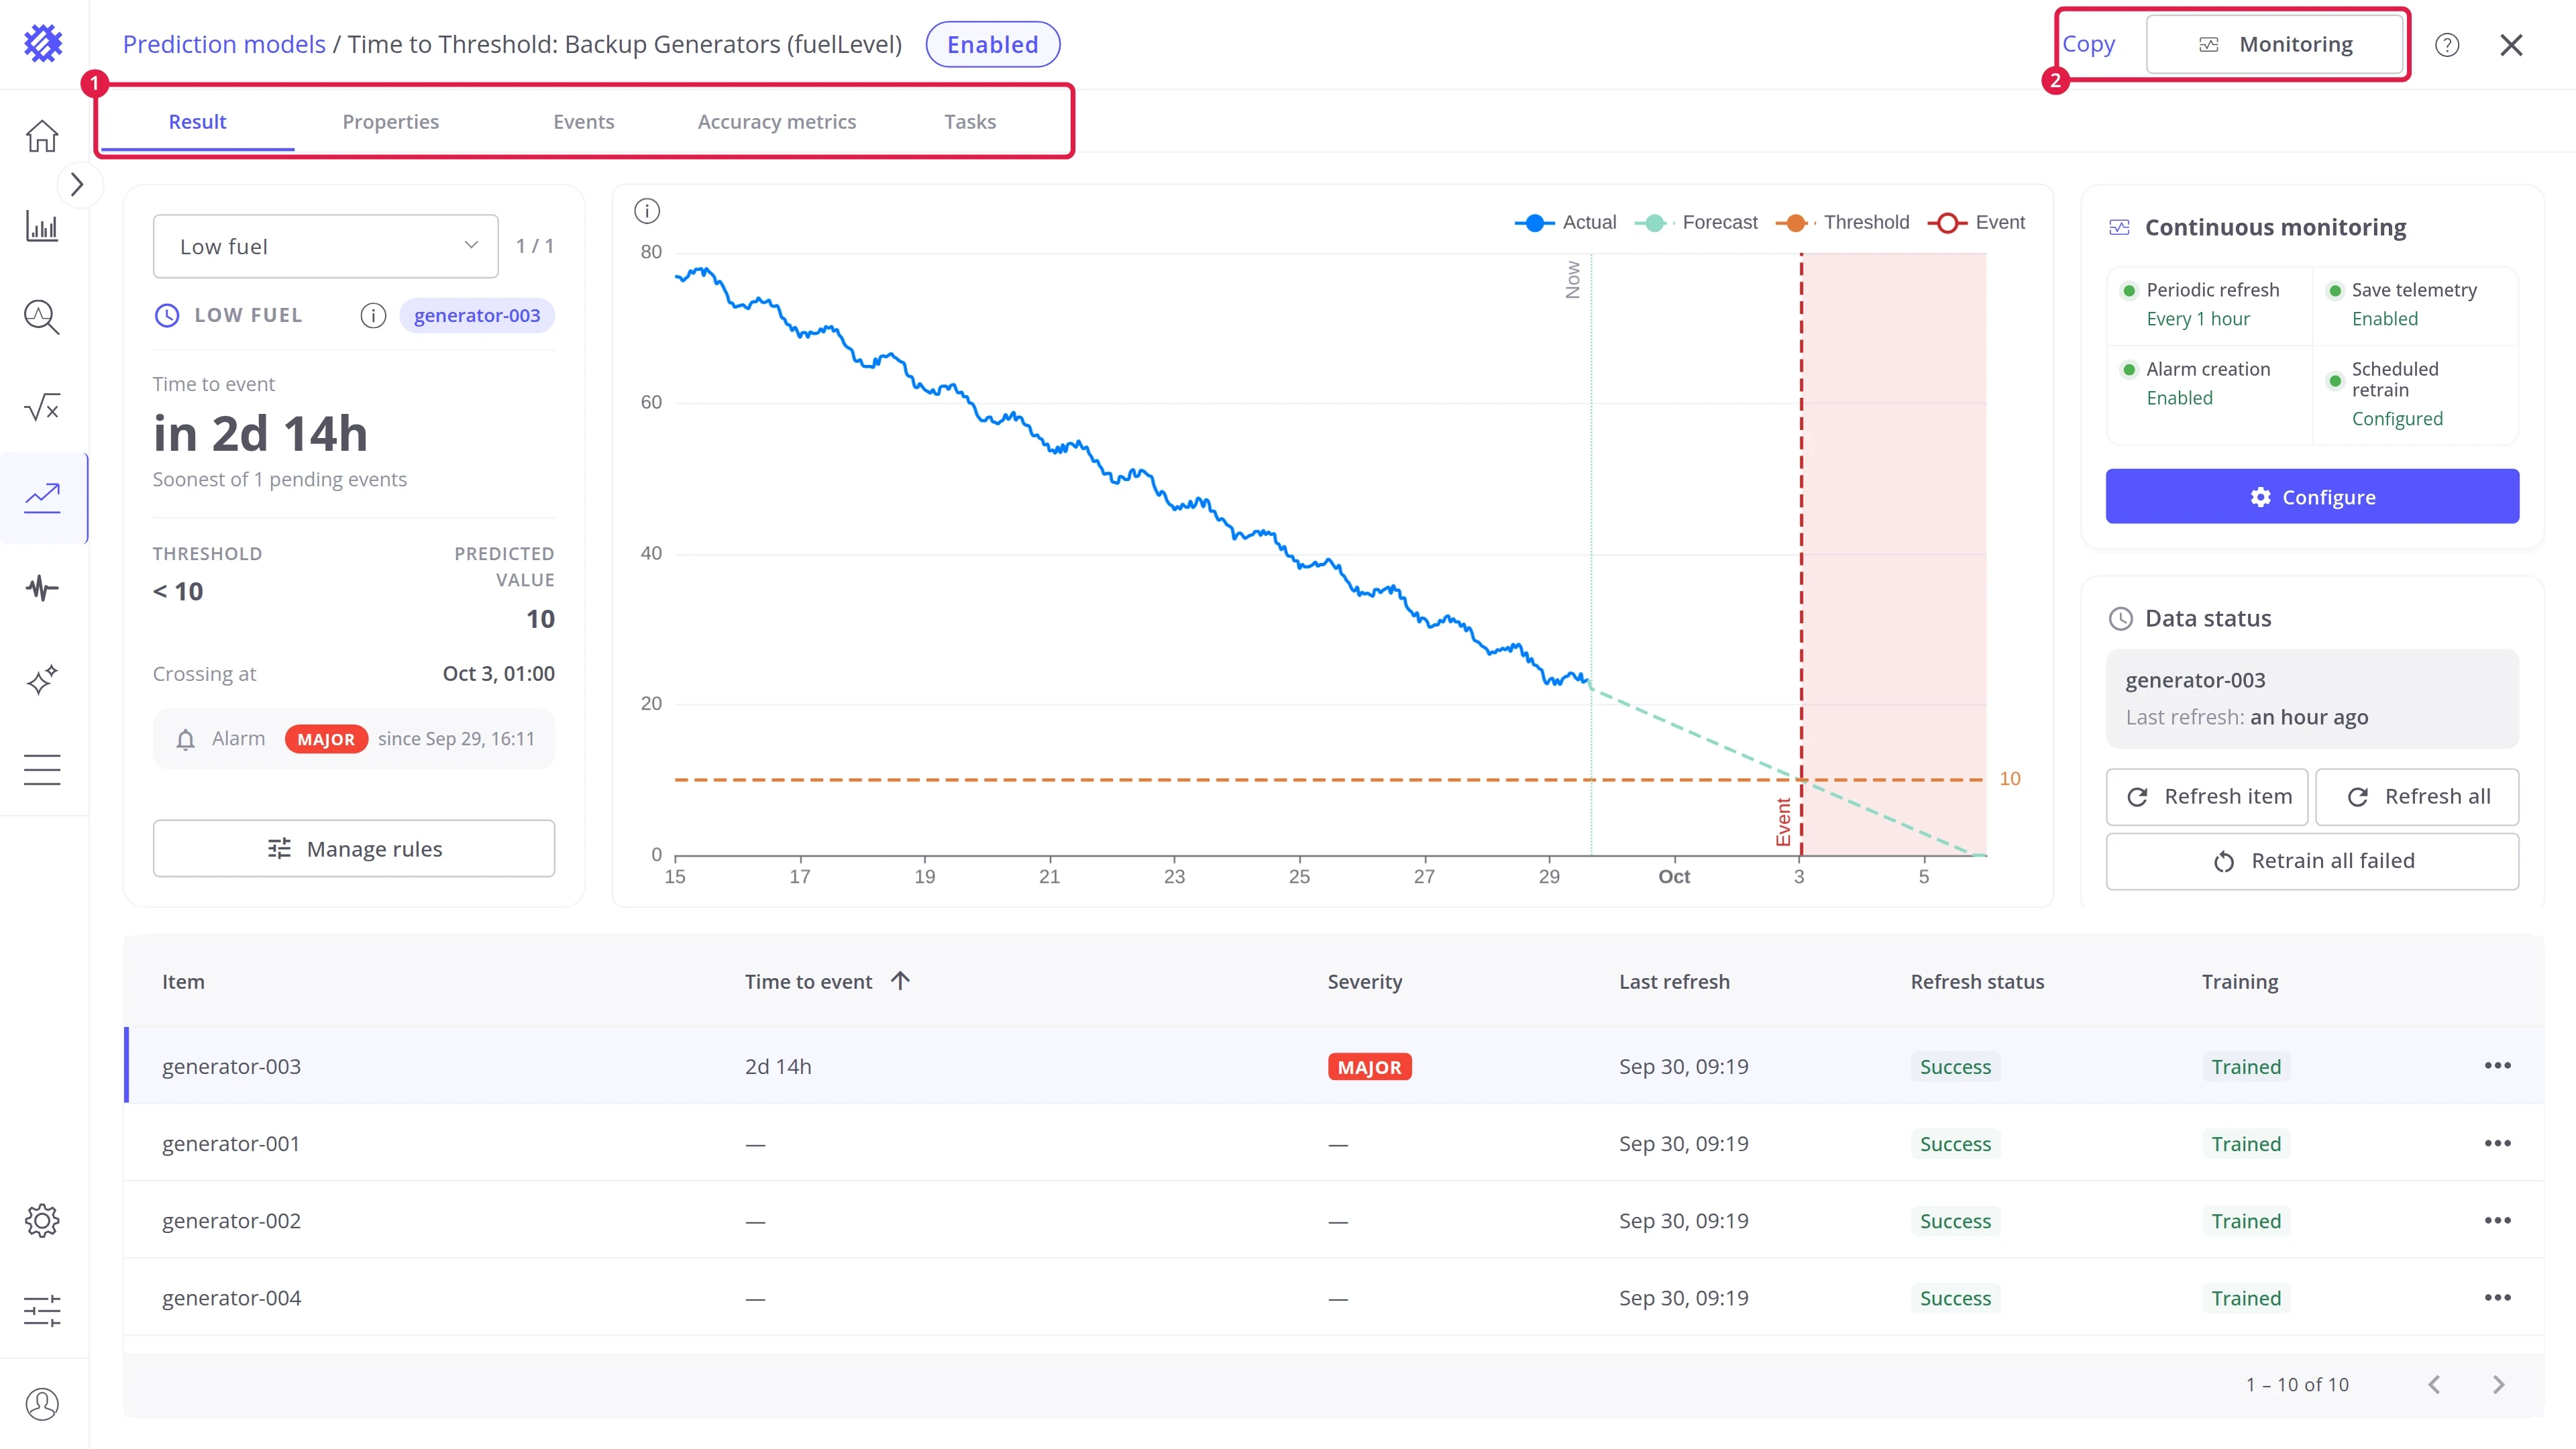
| # | Area | Contents |
|---|---|---|
| 1 | Tabs | Result, Properties, Events, Accuracy metrics, and Tasks, each showing one side of the model |
| 2 | Actions | Copy and Monitoring, which work on the whole model |
Summary and Models tabs
Section titled “Summary and Models tabs”Summary tab
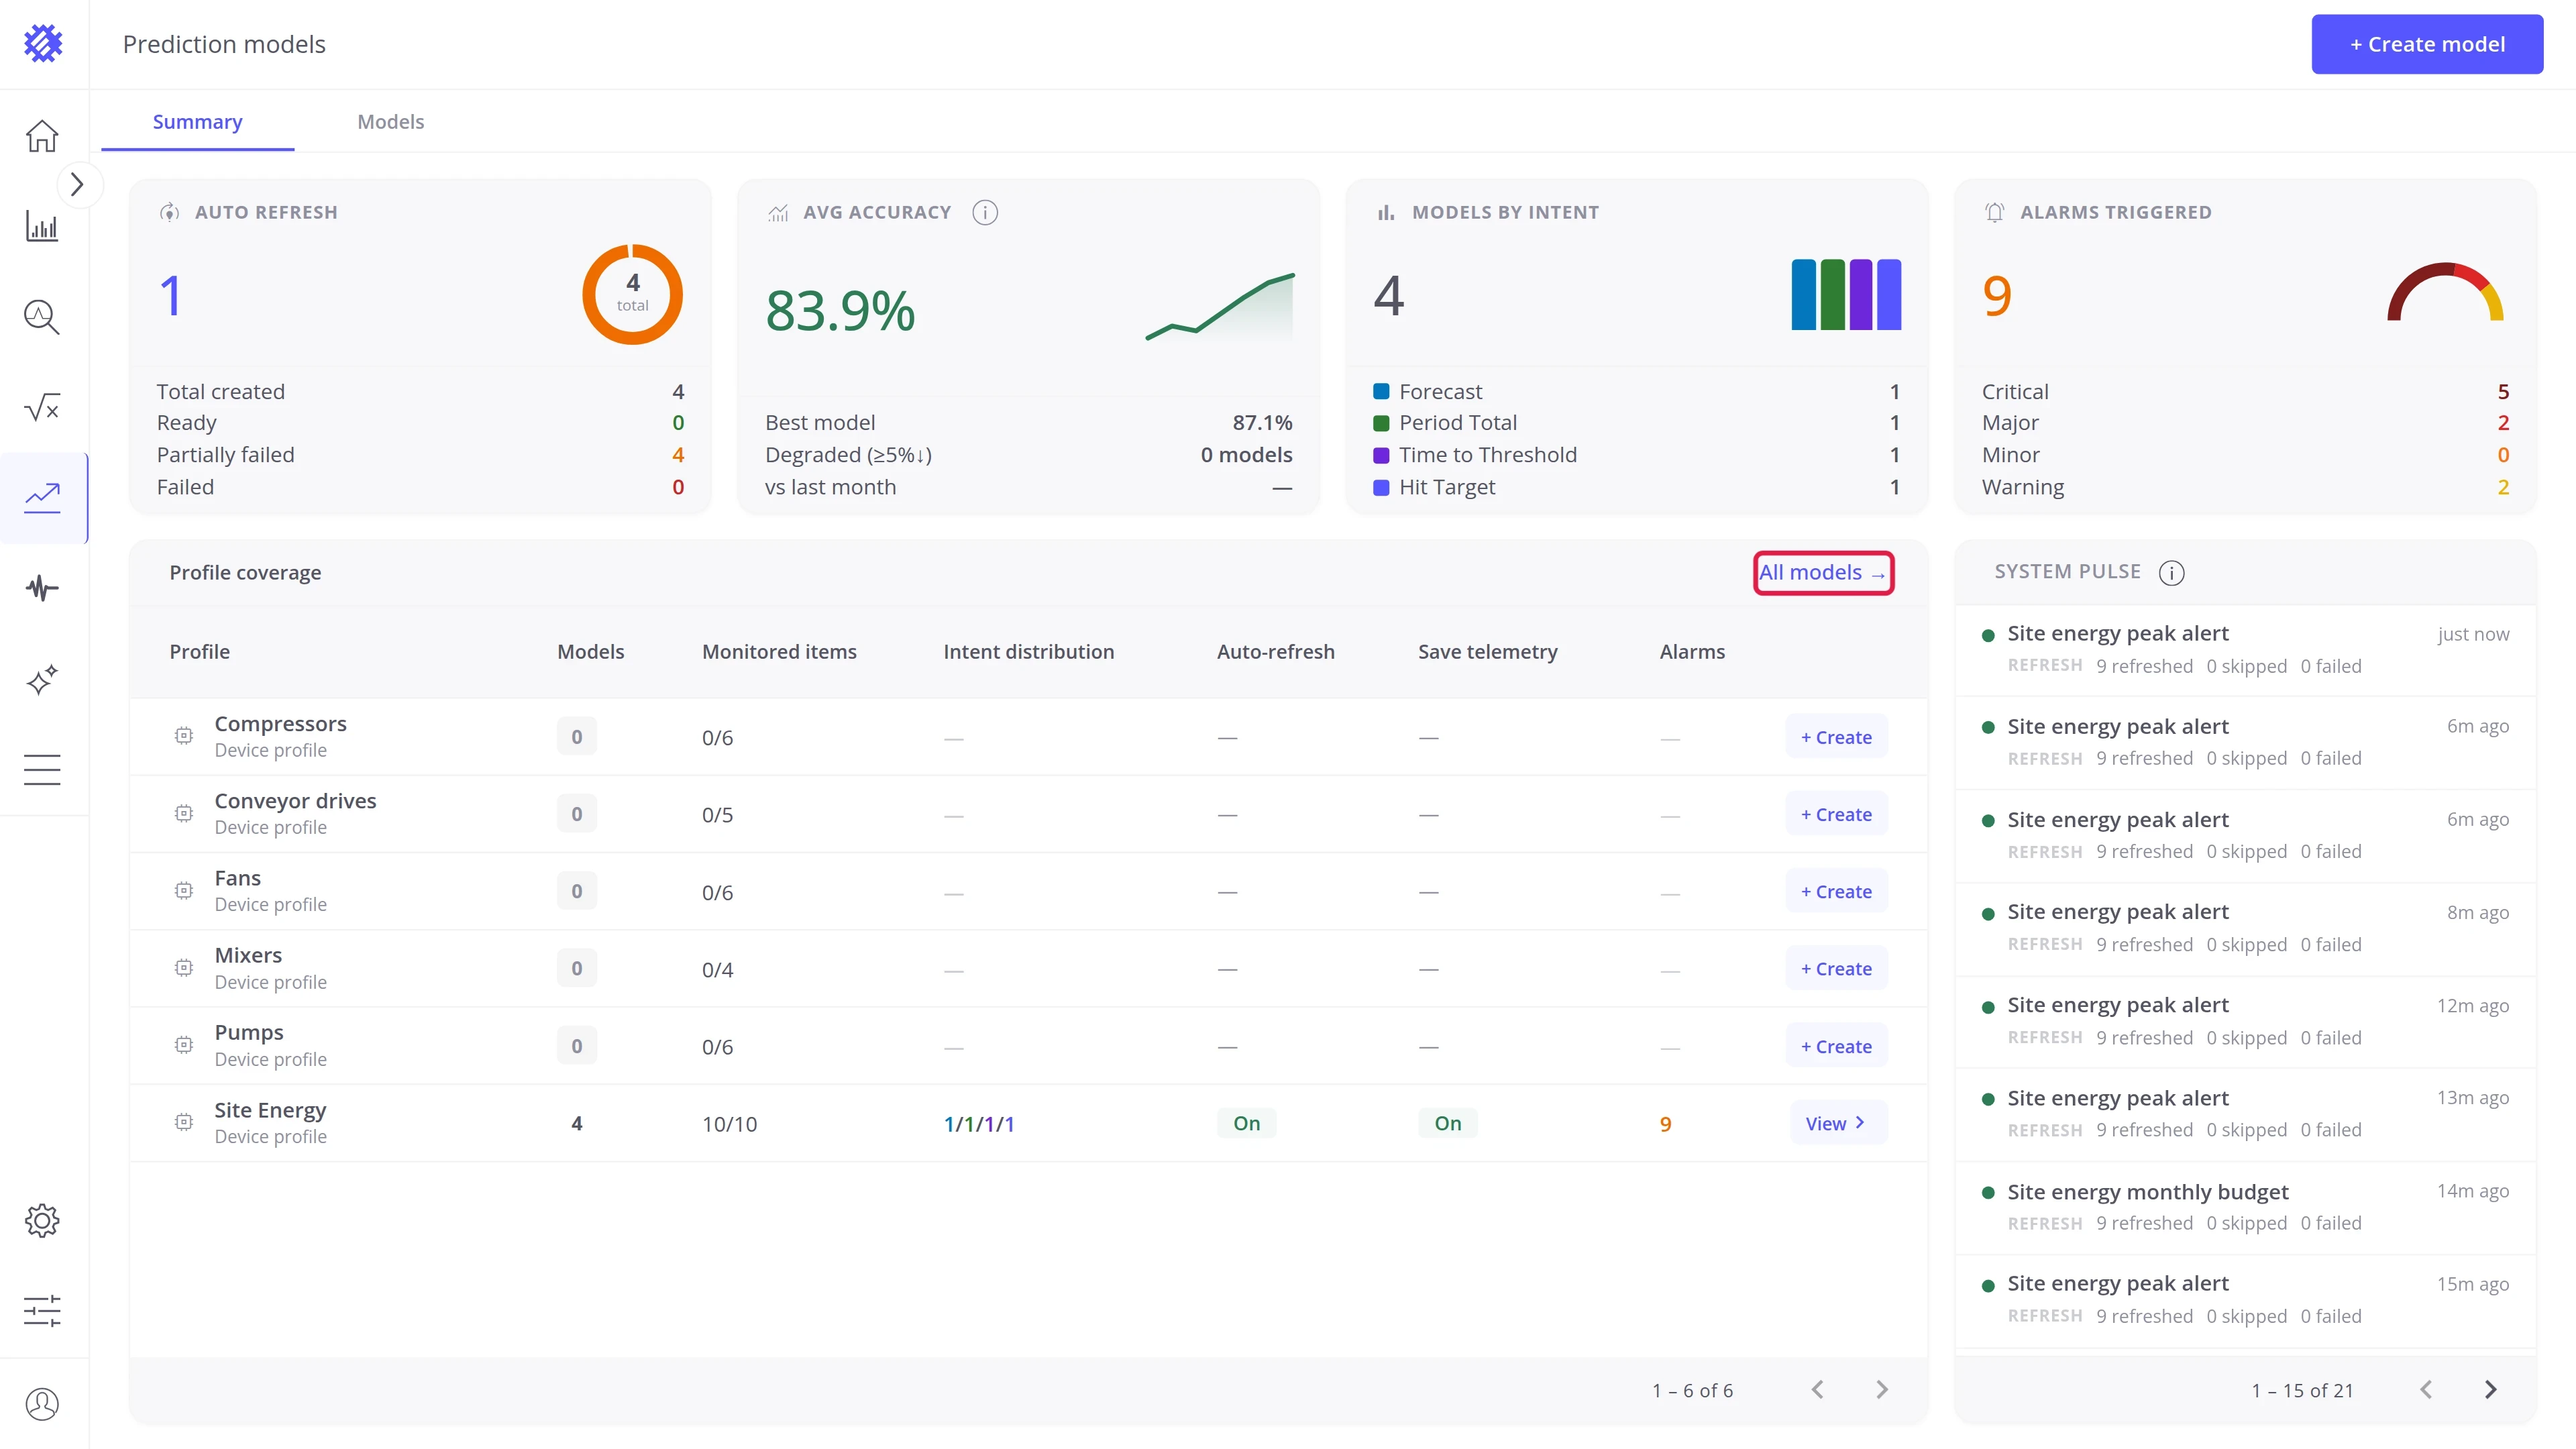
Section titled “Summary tab”The Summary tab opens by default. It shows every prediction model of the tenant: how they refresh, how accurate they are, which profiles they cover, and how their latest runs went.
Summary cards. Four cards at the top show the main figures across all models.
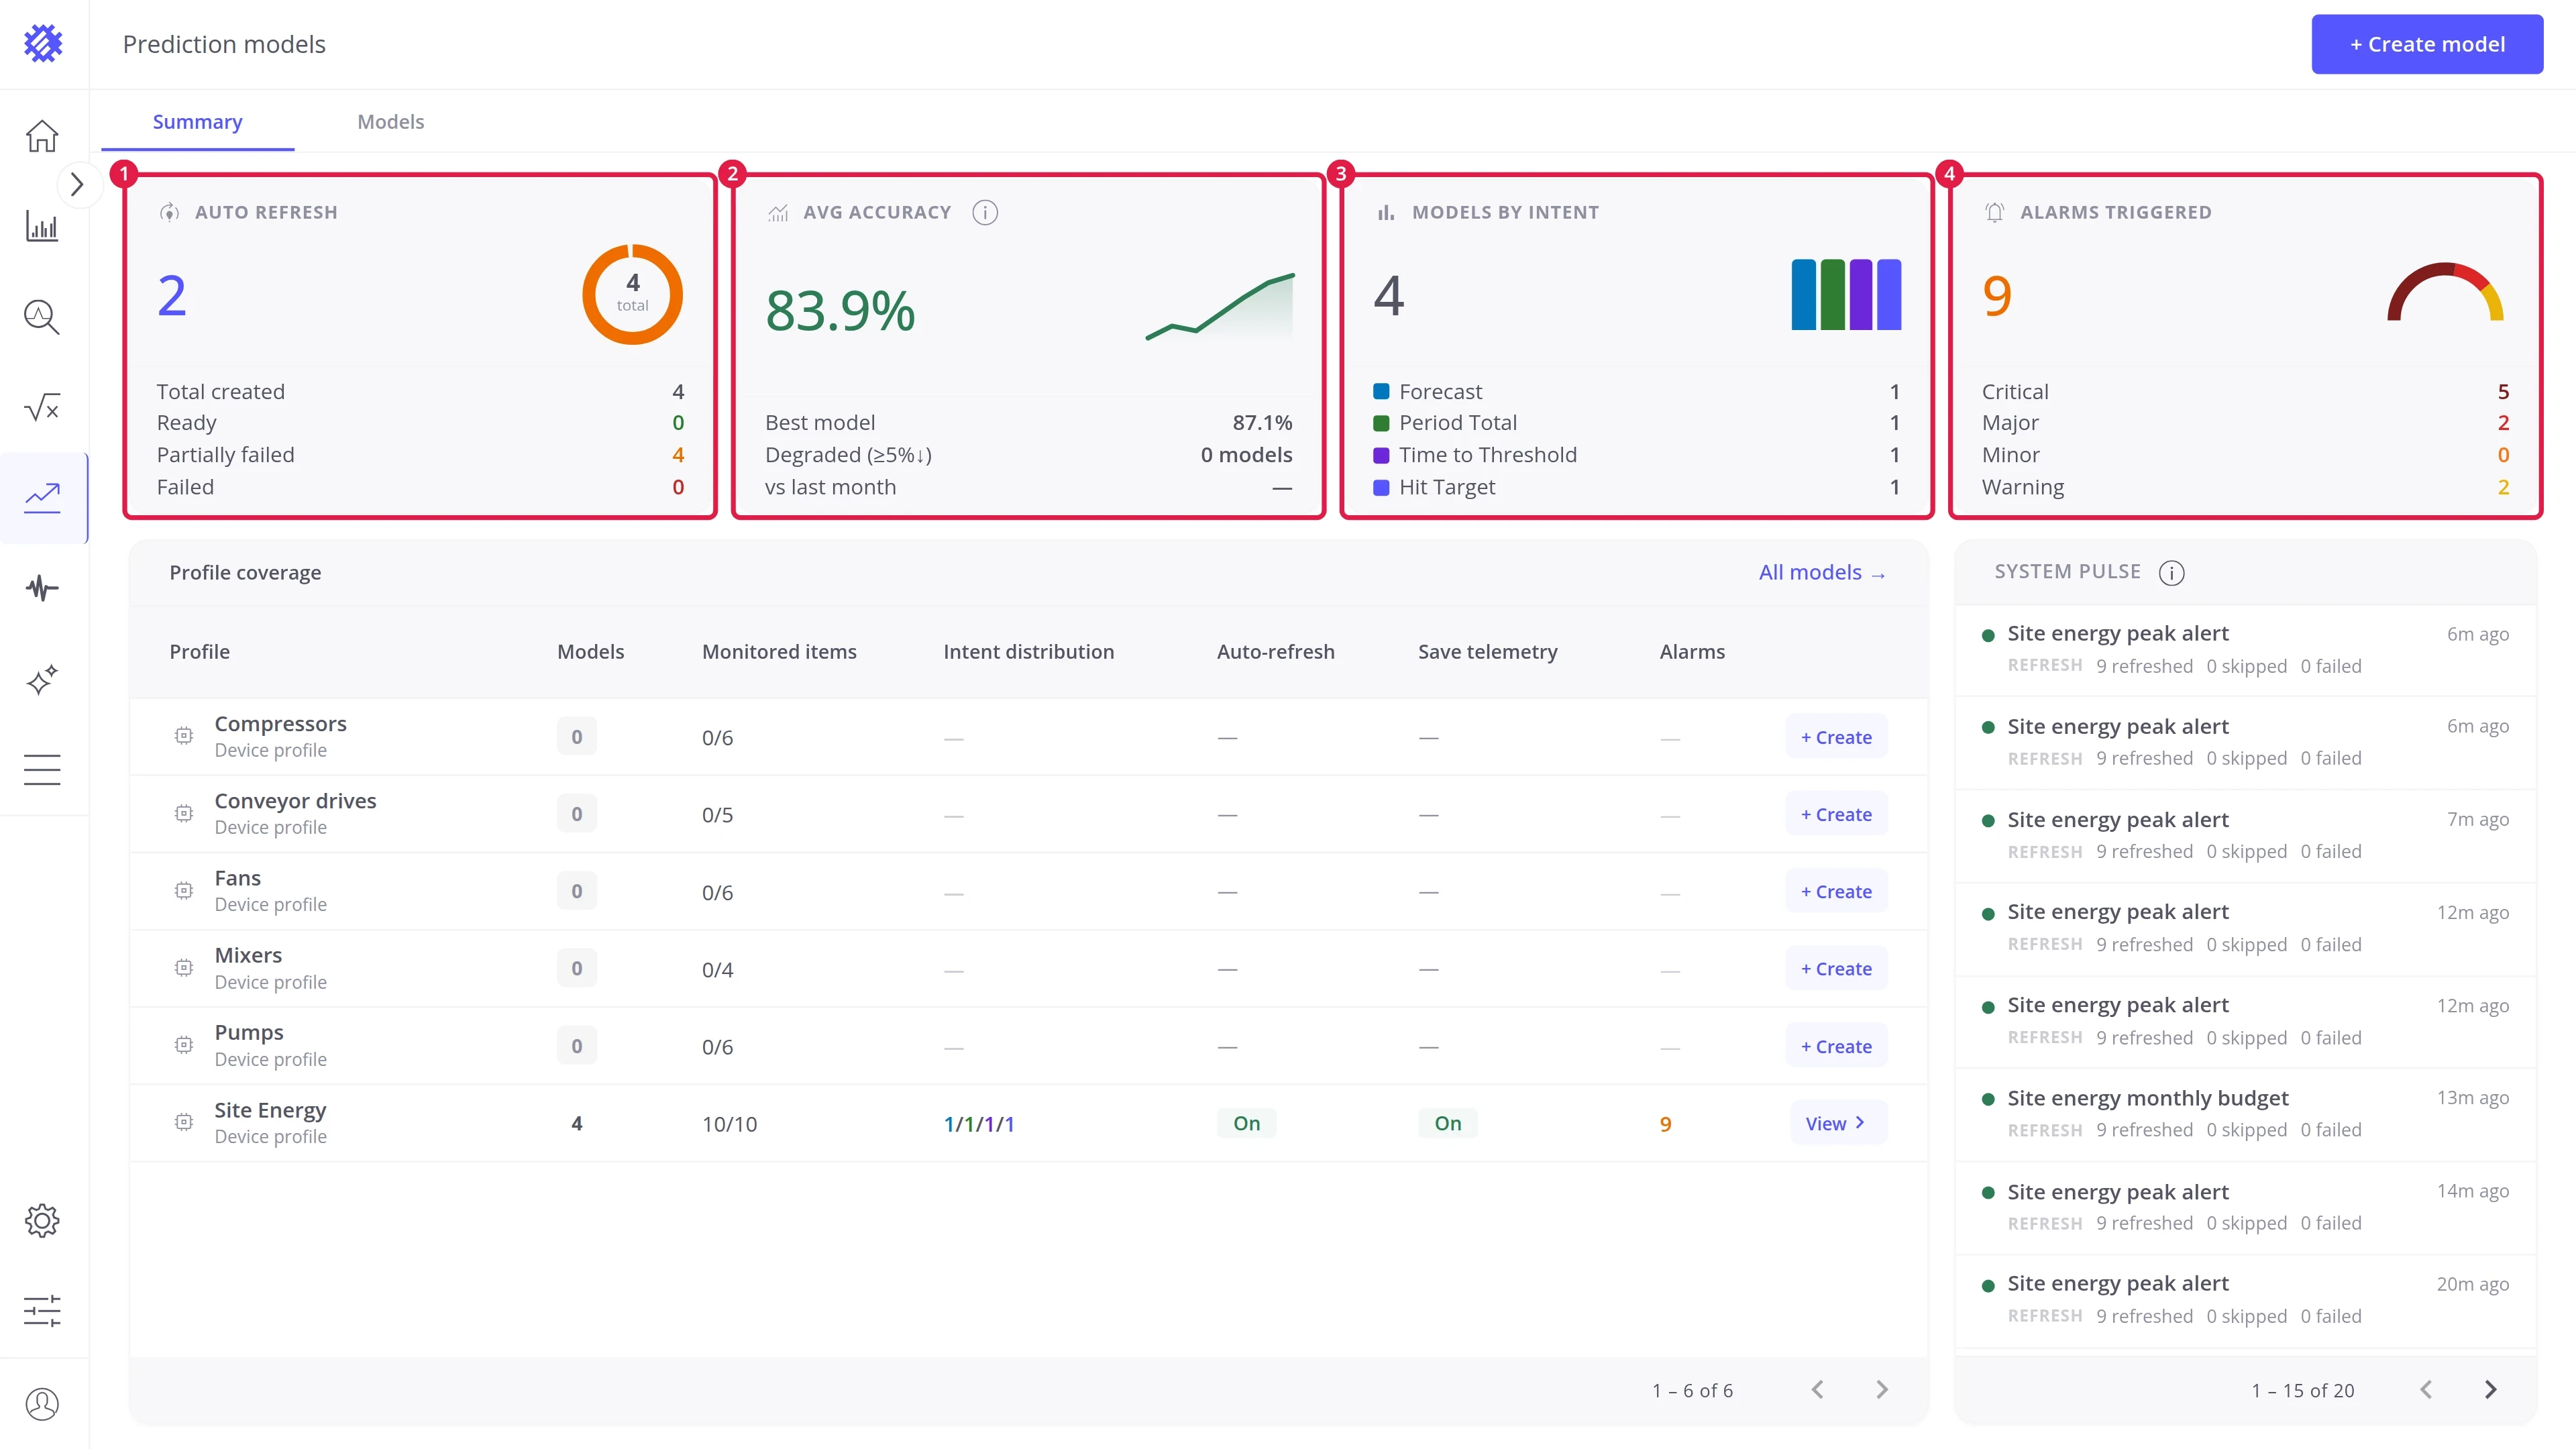
| # | Card | Shows |
|---|---|---|
| 1 | Auto refresh | How many models refresh on a schedule. Below: Total created, Ready (trained for every item), Partially failed, and Failed |
| 2 | Avg accuracy | The average accuracy of the trained models. Below: Best model, Degraded (≥5%↓), the models that lost 5% or more against the previous 30 days, and vs last month |
| 3 | Models by intent | How many models there are of each intent |
| 4 | Alarms triggered | The alarms raised by prediction models, by severity |
Profile coverage. Every device and asset profile, with the models built on it.
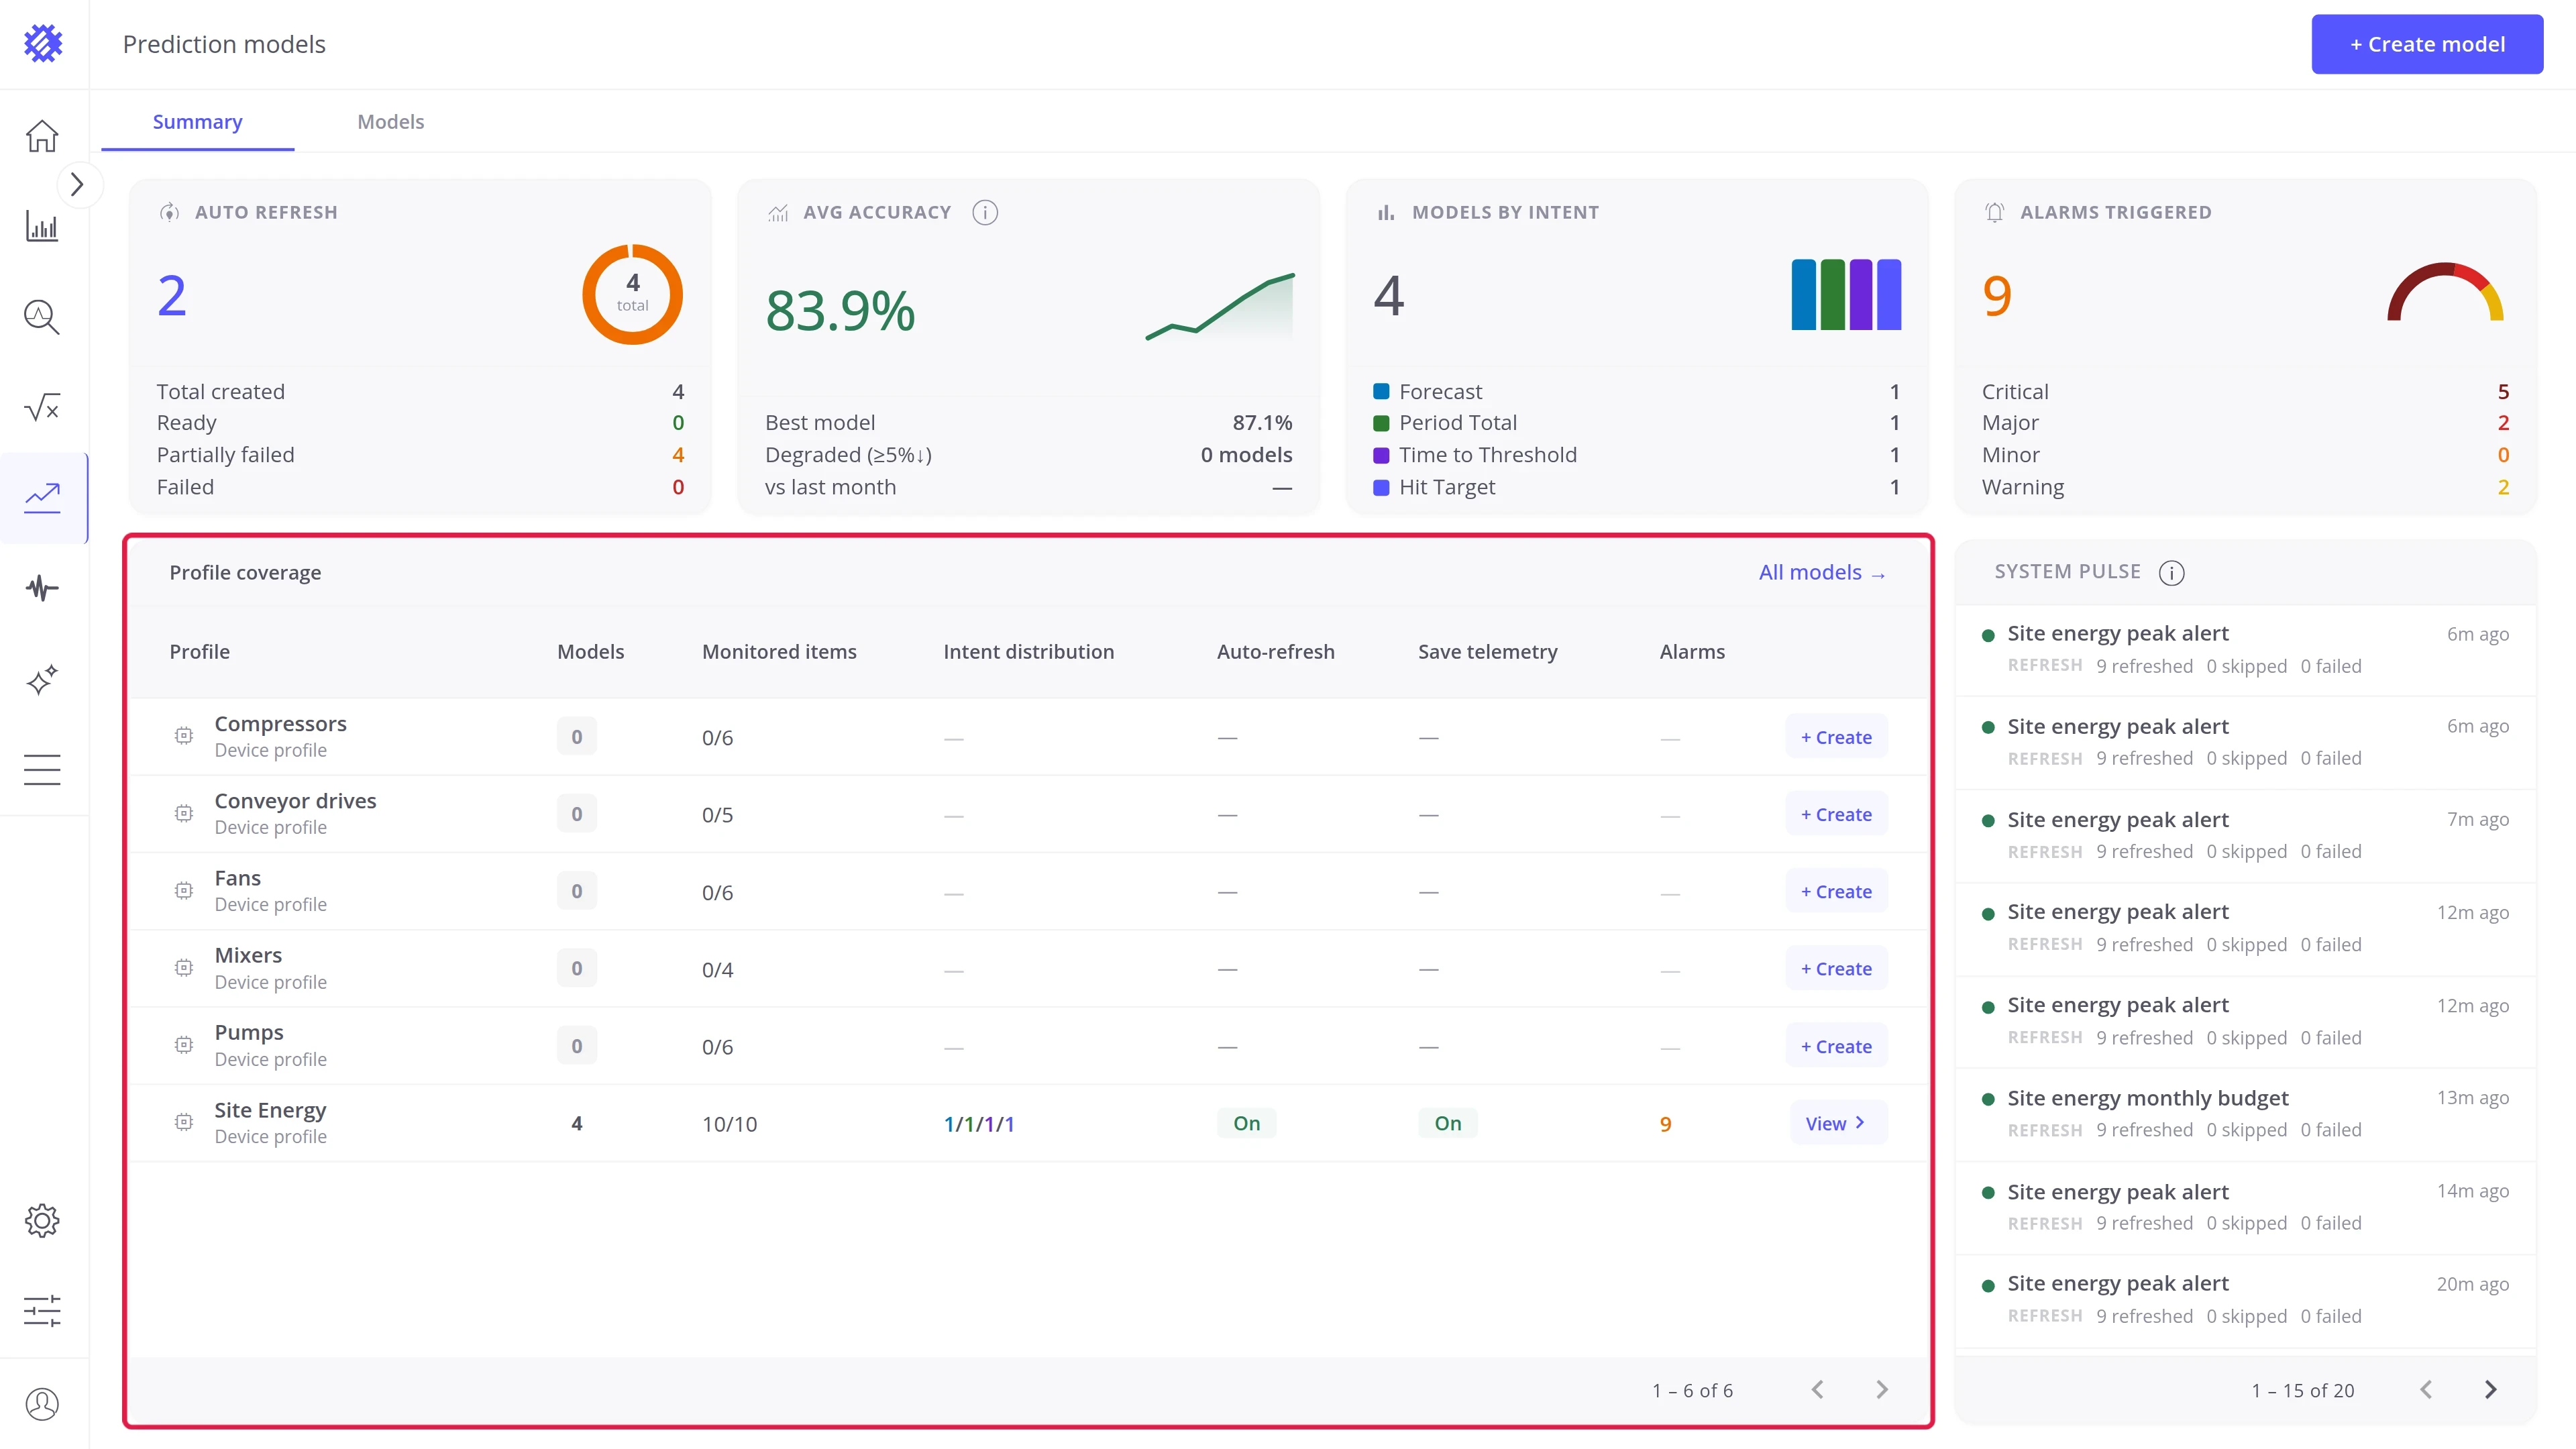
| Column | Description |
|---|---|
| Profile | The profile name and type |
| Models | How many models are built on the profile |
| Monitored items | Items in a model, out of all items of the profile |
| Intent distribution | Models per intent: Forecast / Period Total / Time to Threshold / Hit Target |
| Auto-refresh | On when at least one model refreshes on a schedule |
| Save telemetry | On when at least one model writes its predictions to ThingsBoard |
| Alarms | Alarms raised by the models of the profile |
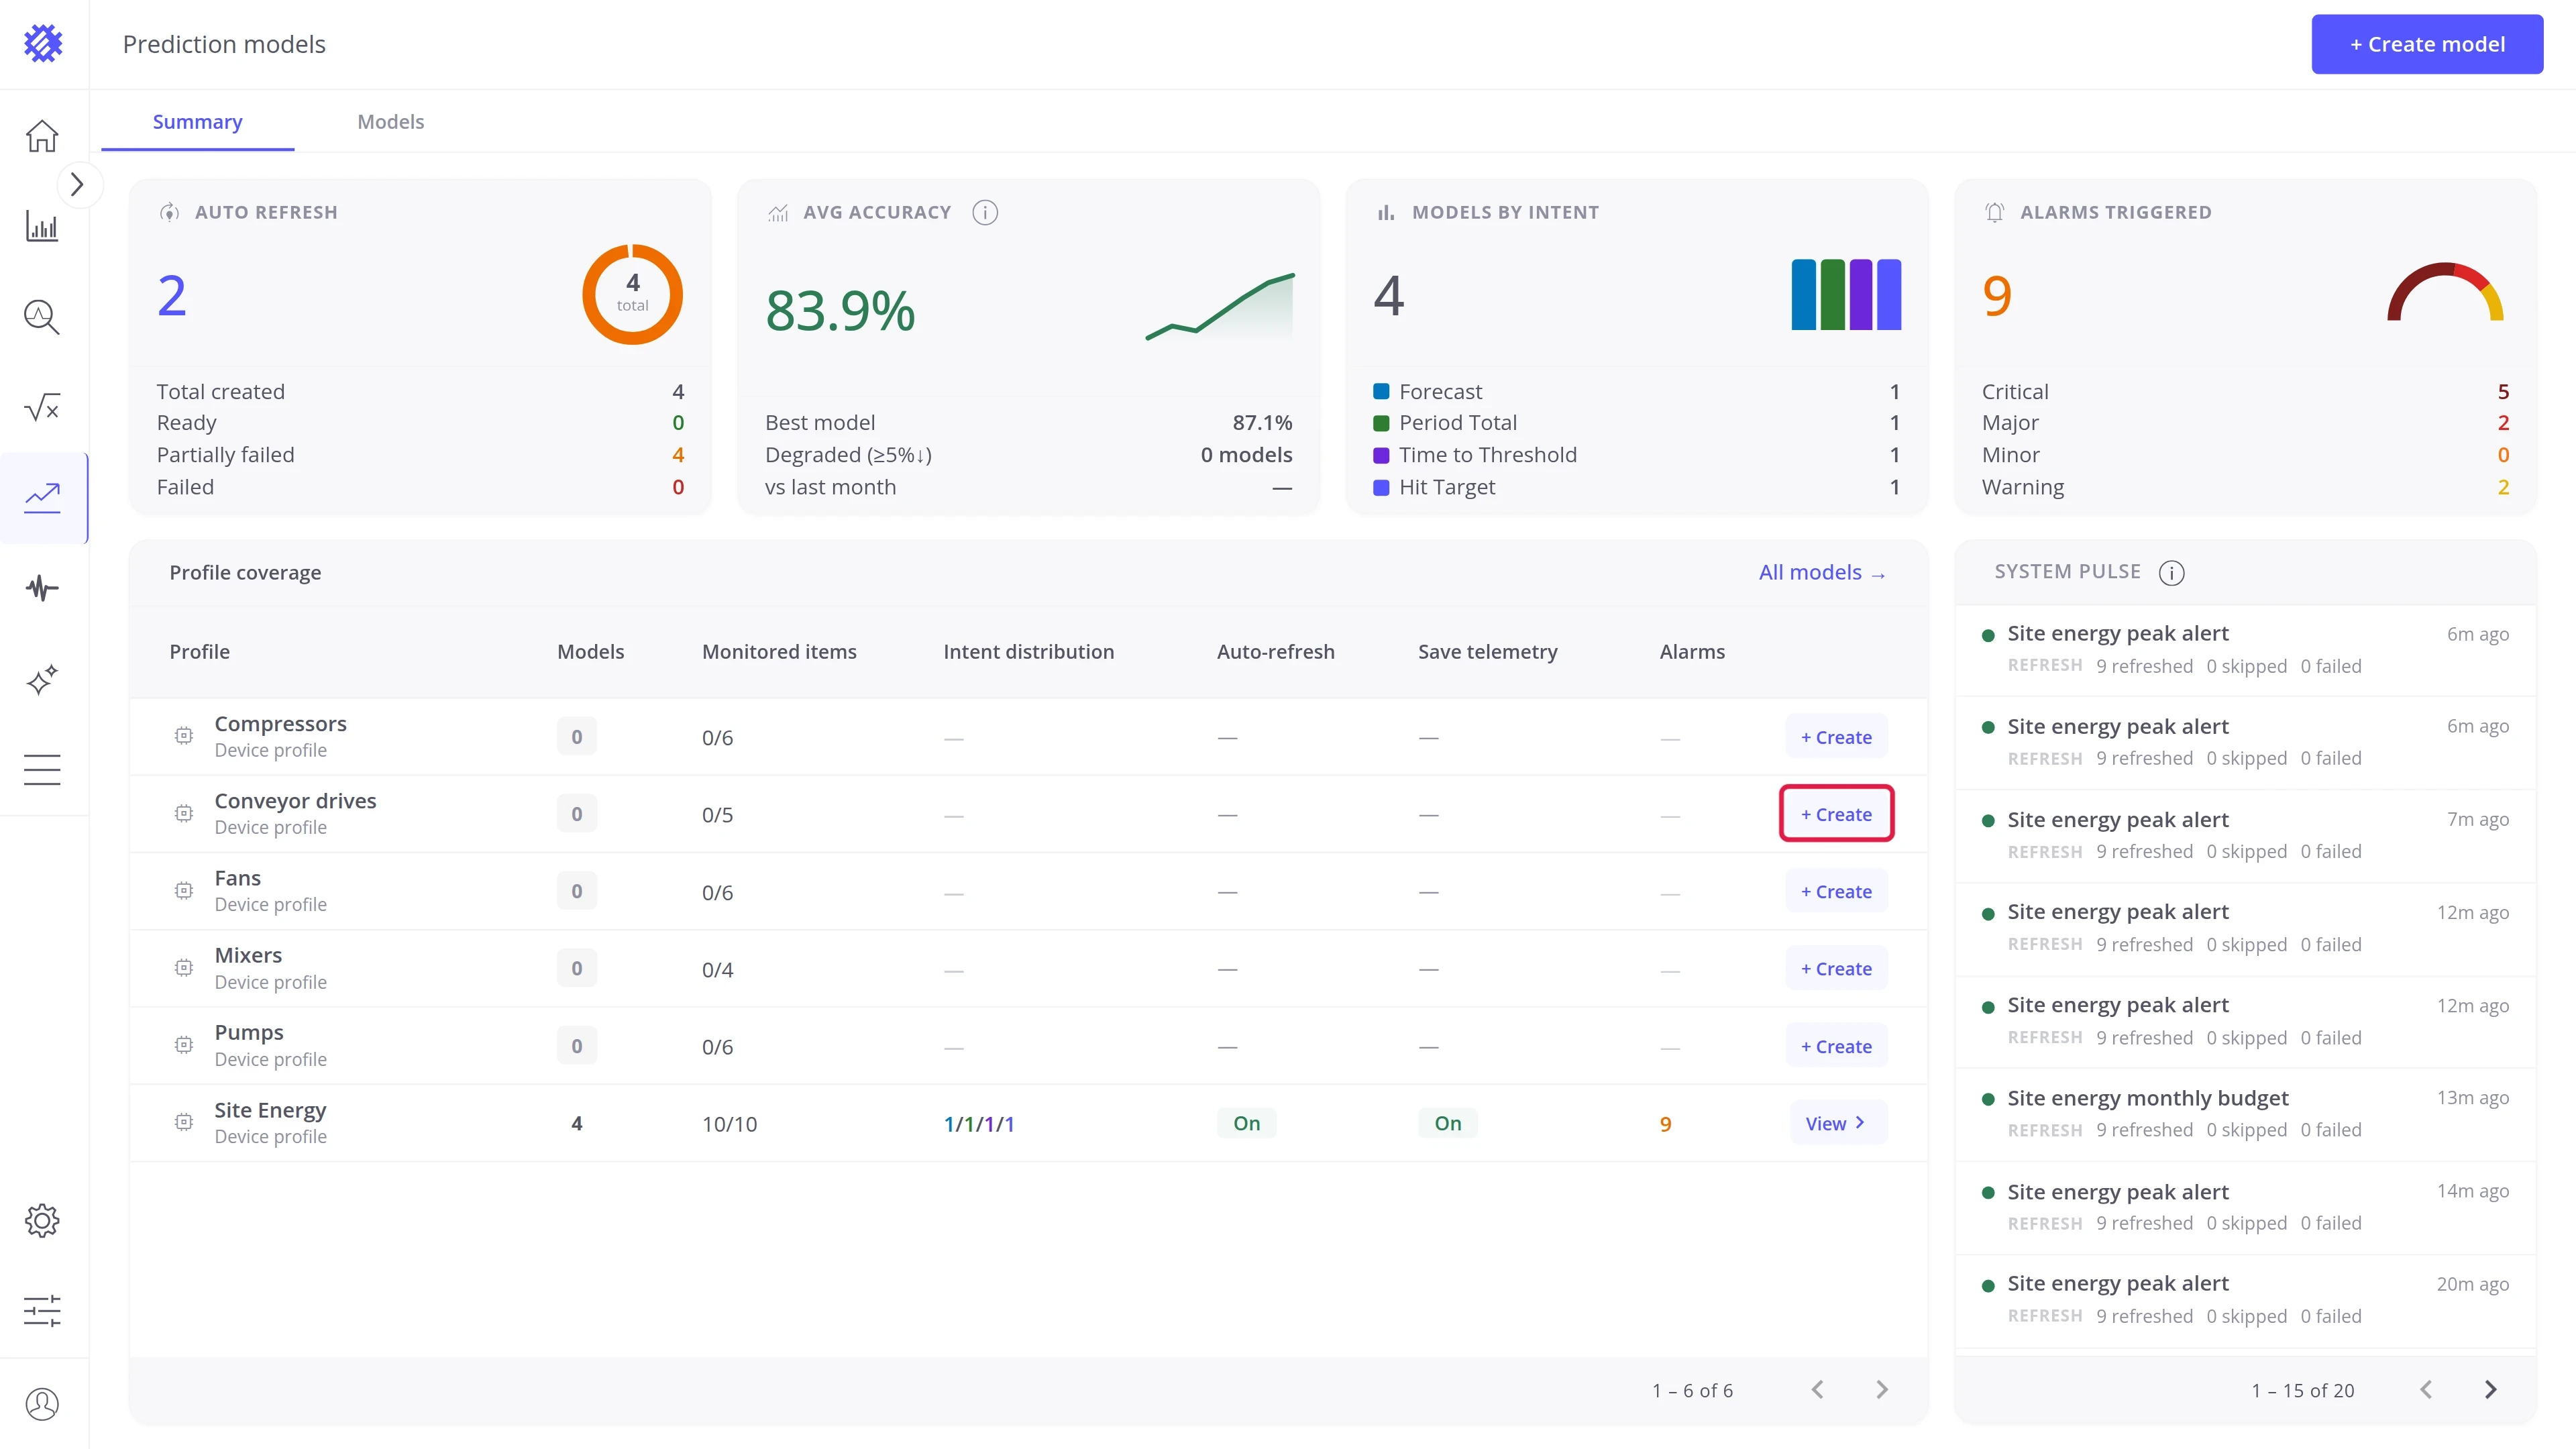
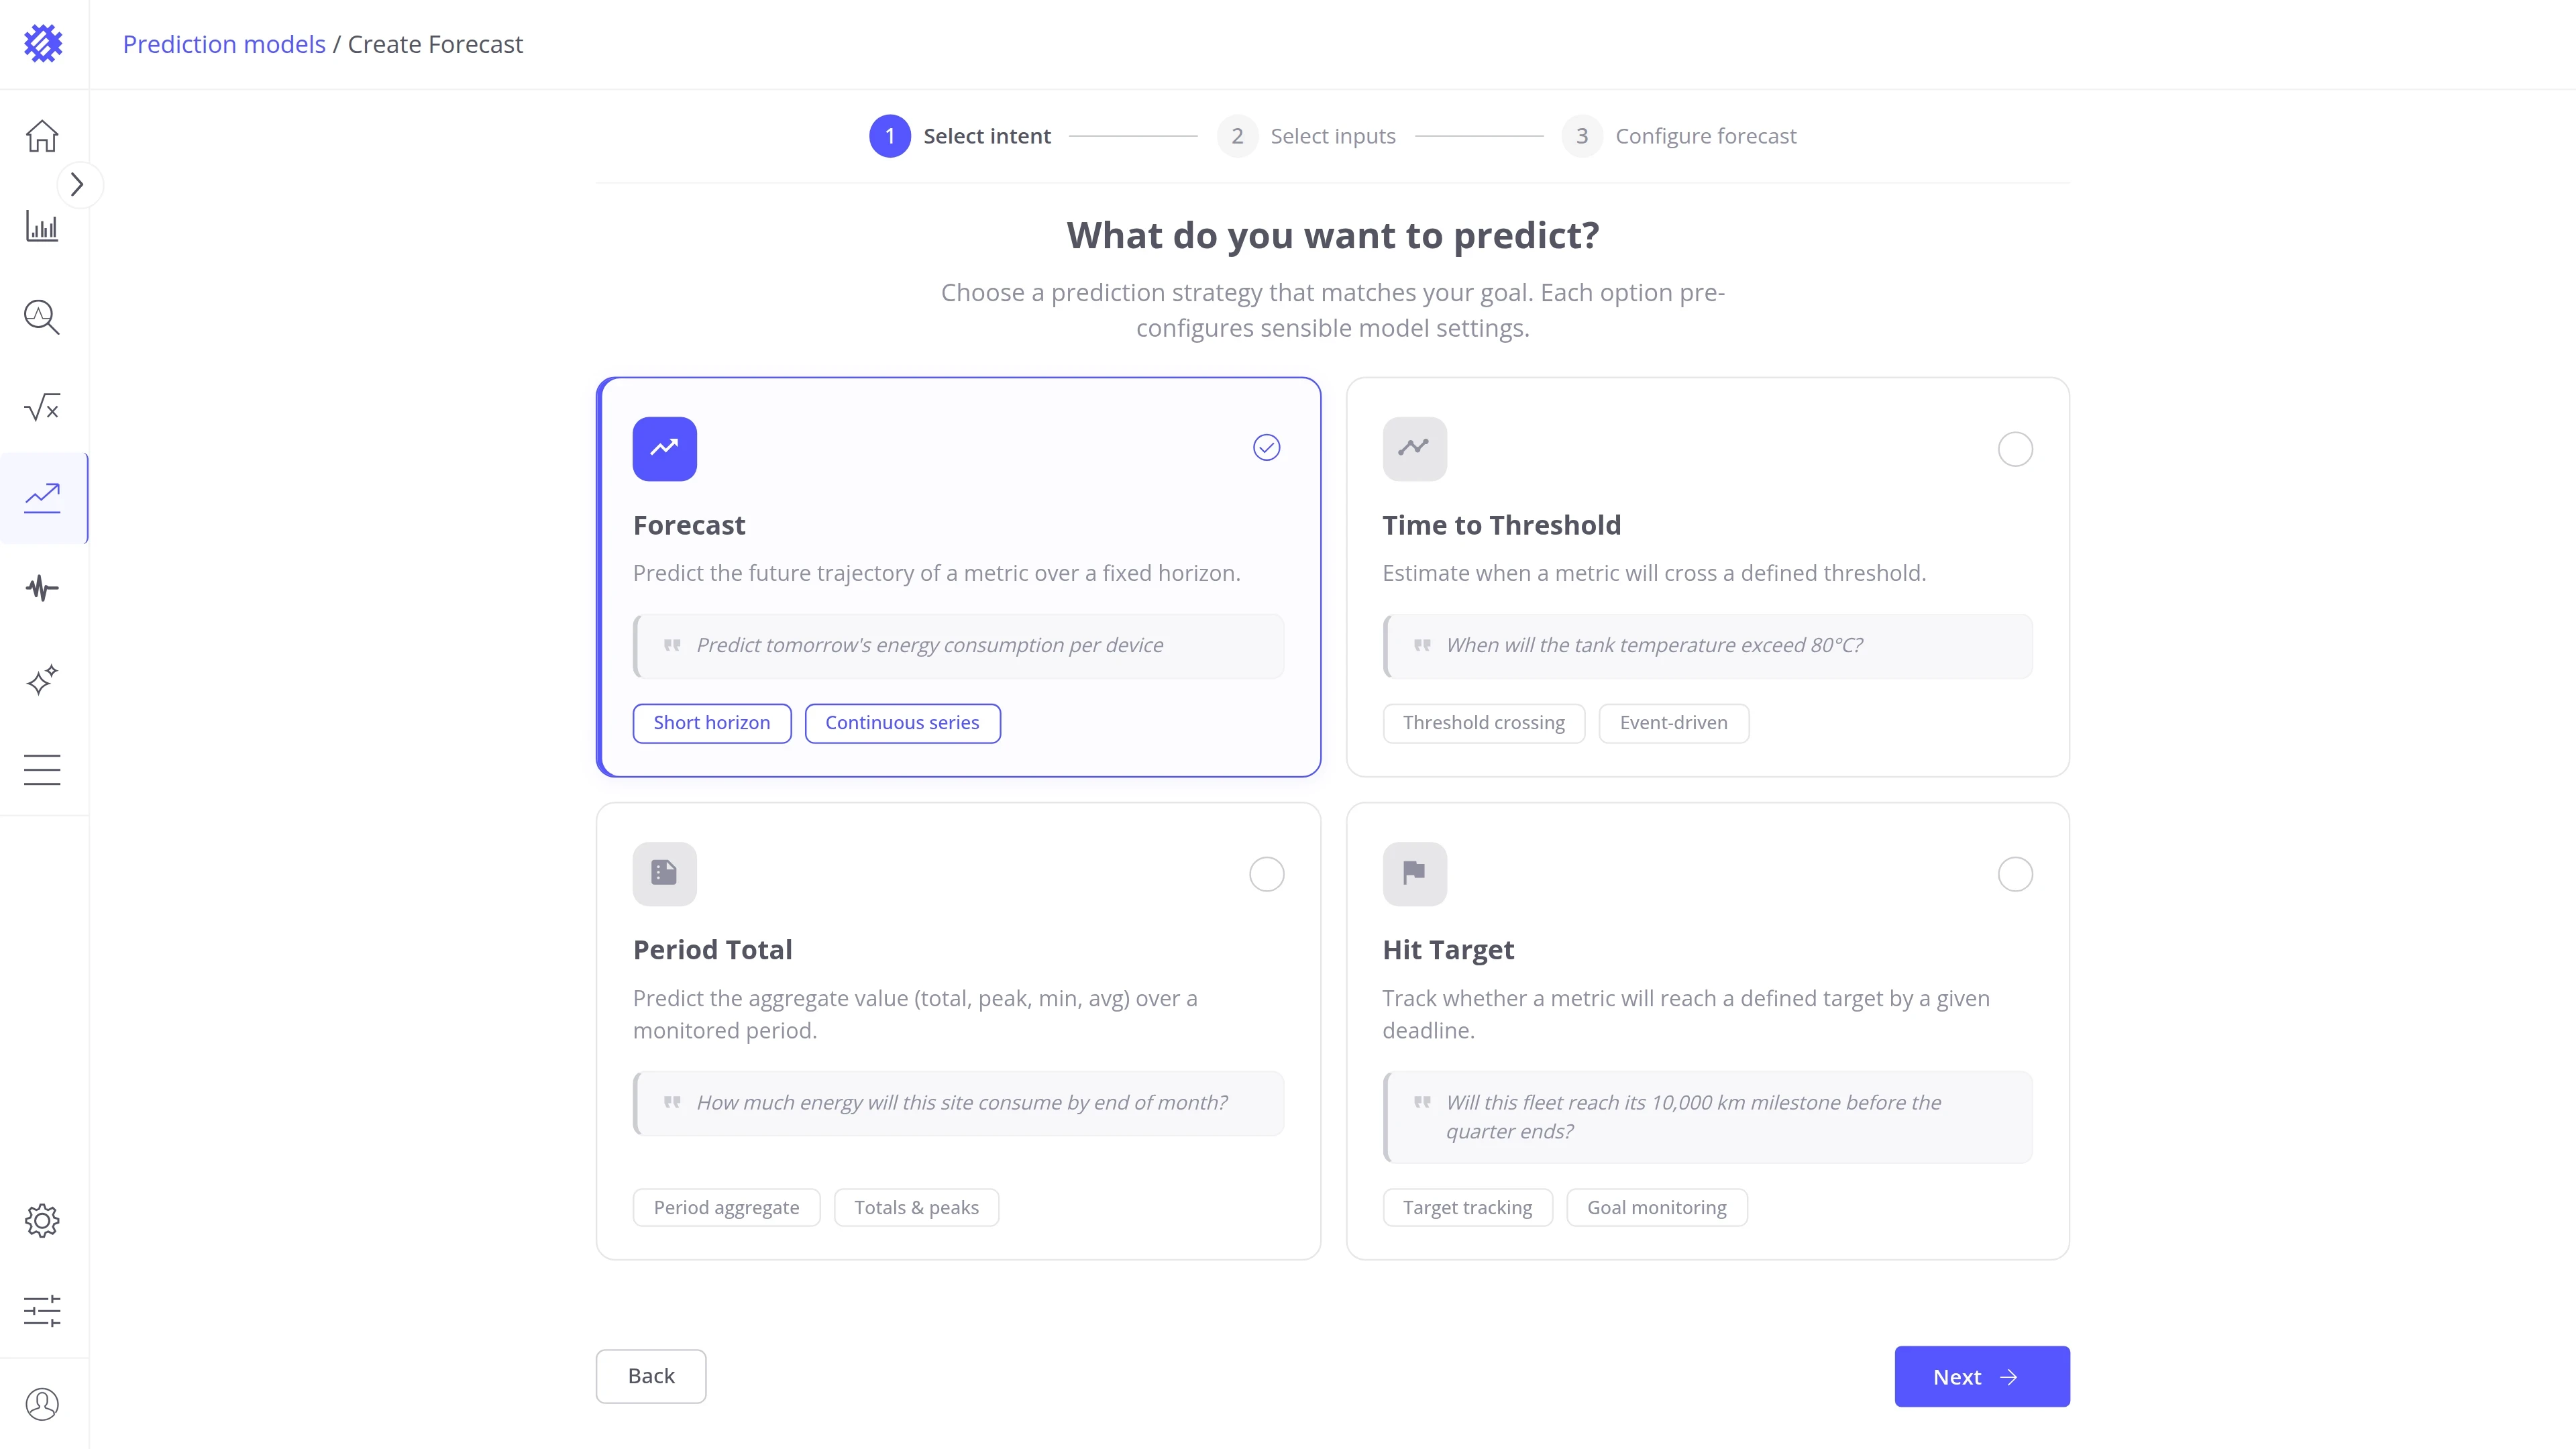
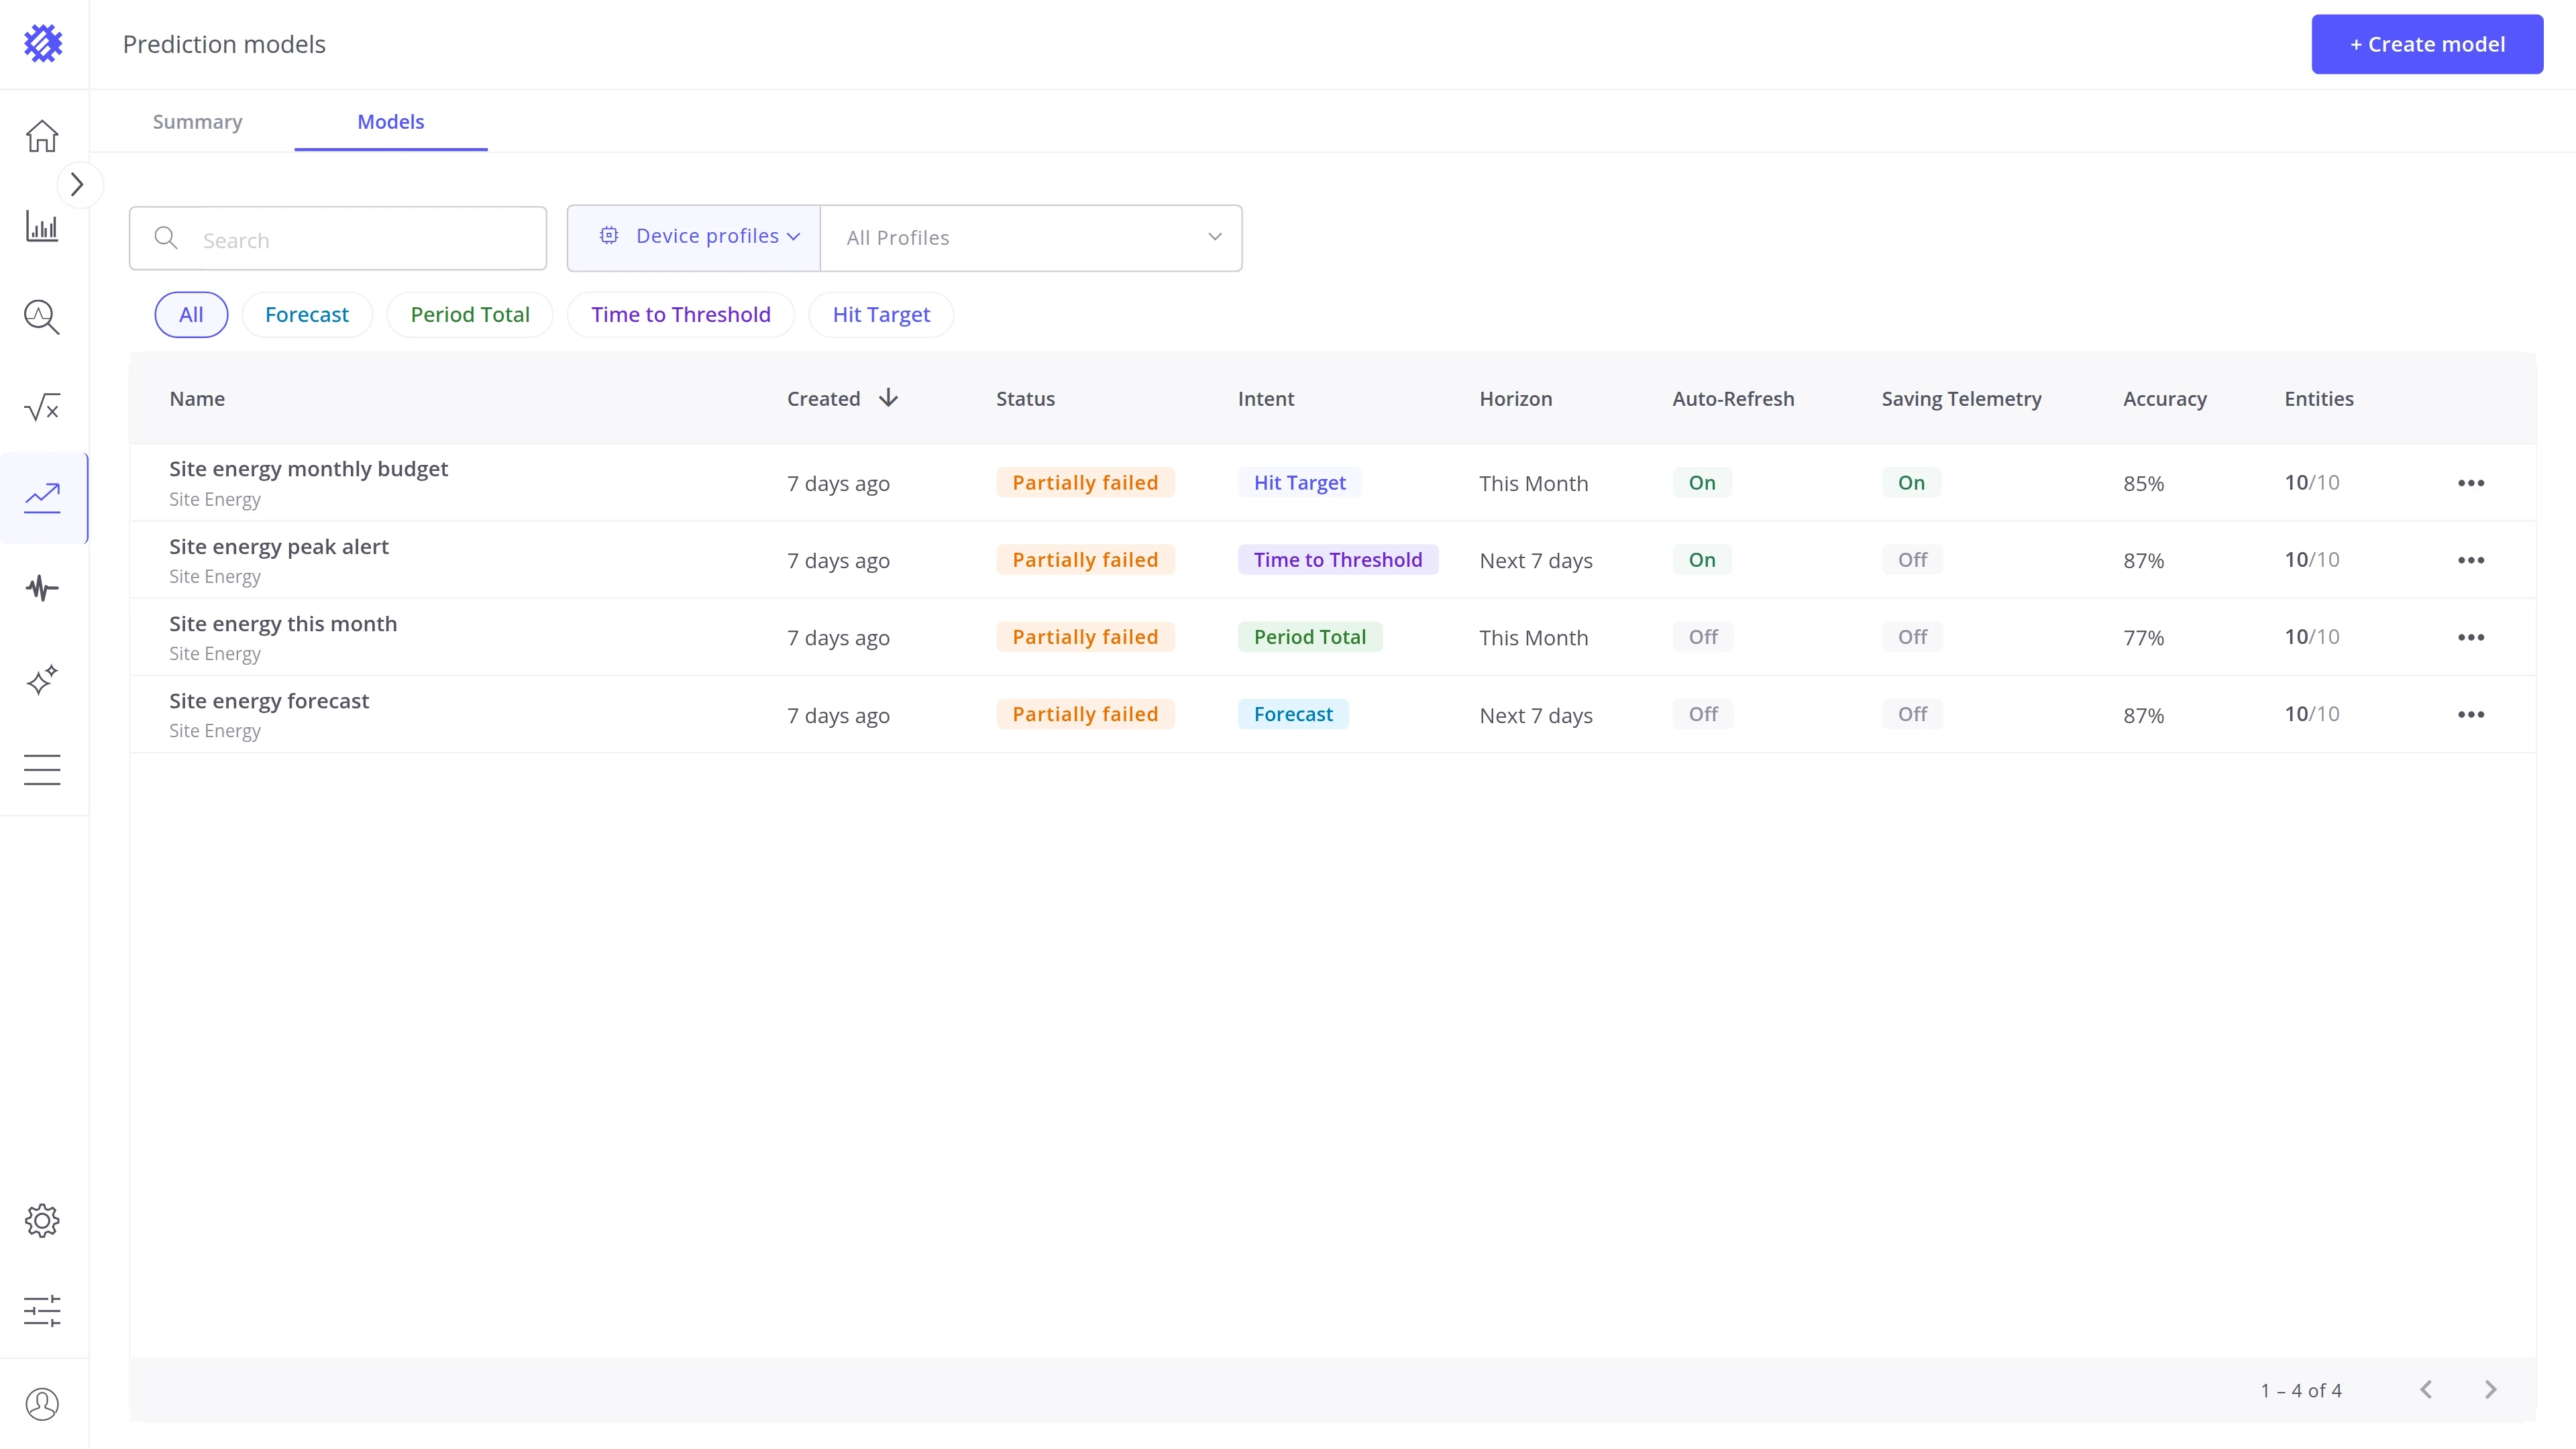
+ Create starts the wizard with this profile already selected. A profile with models shows View > instead, which opens the Models tab filtered to that profile.
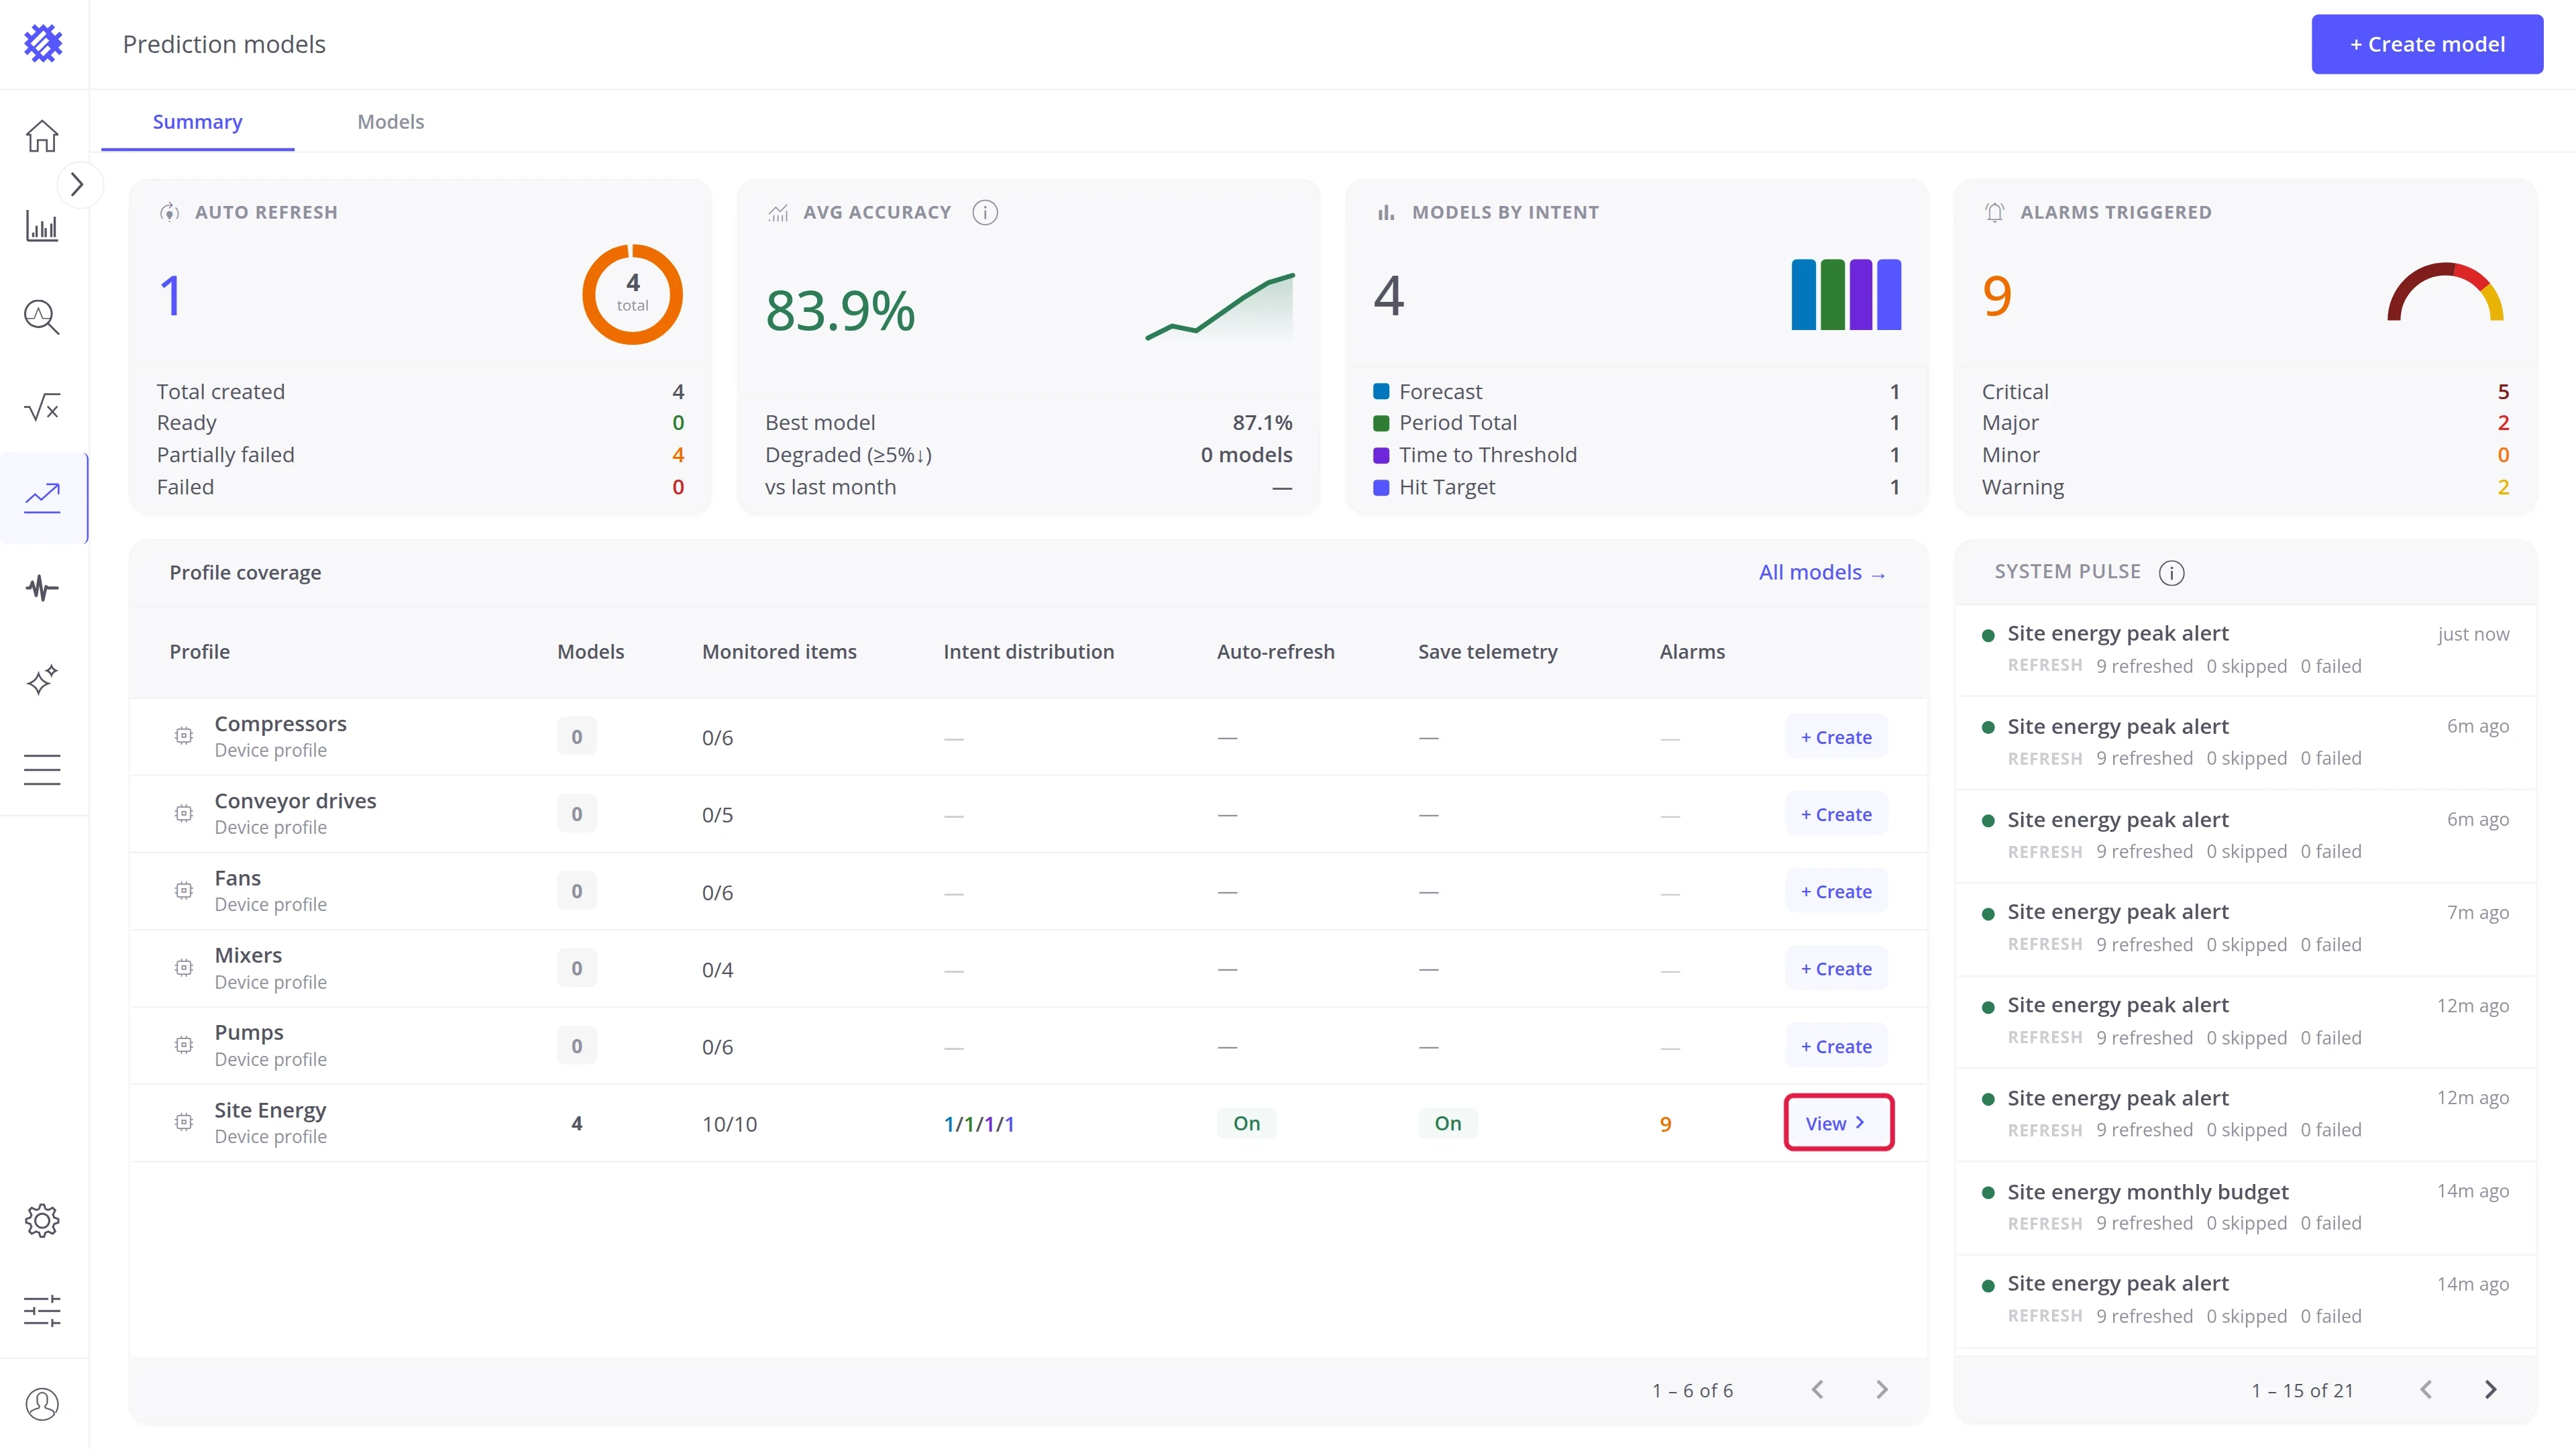
All models → in the table header opens the Models tab with no filter.
System pulse. The latest runs of all models, newest first, so you can see whether training and refreshes succeed.
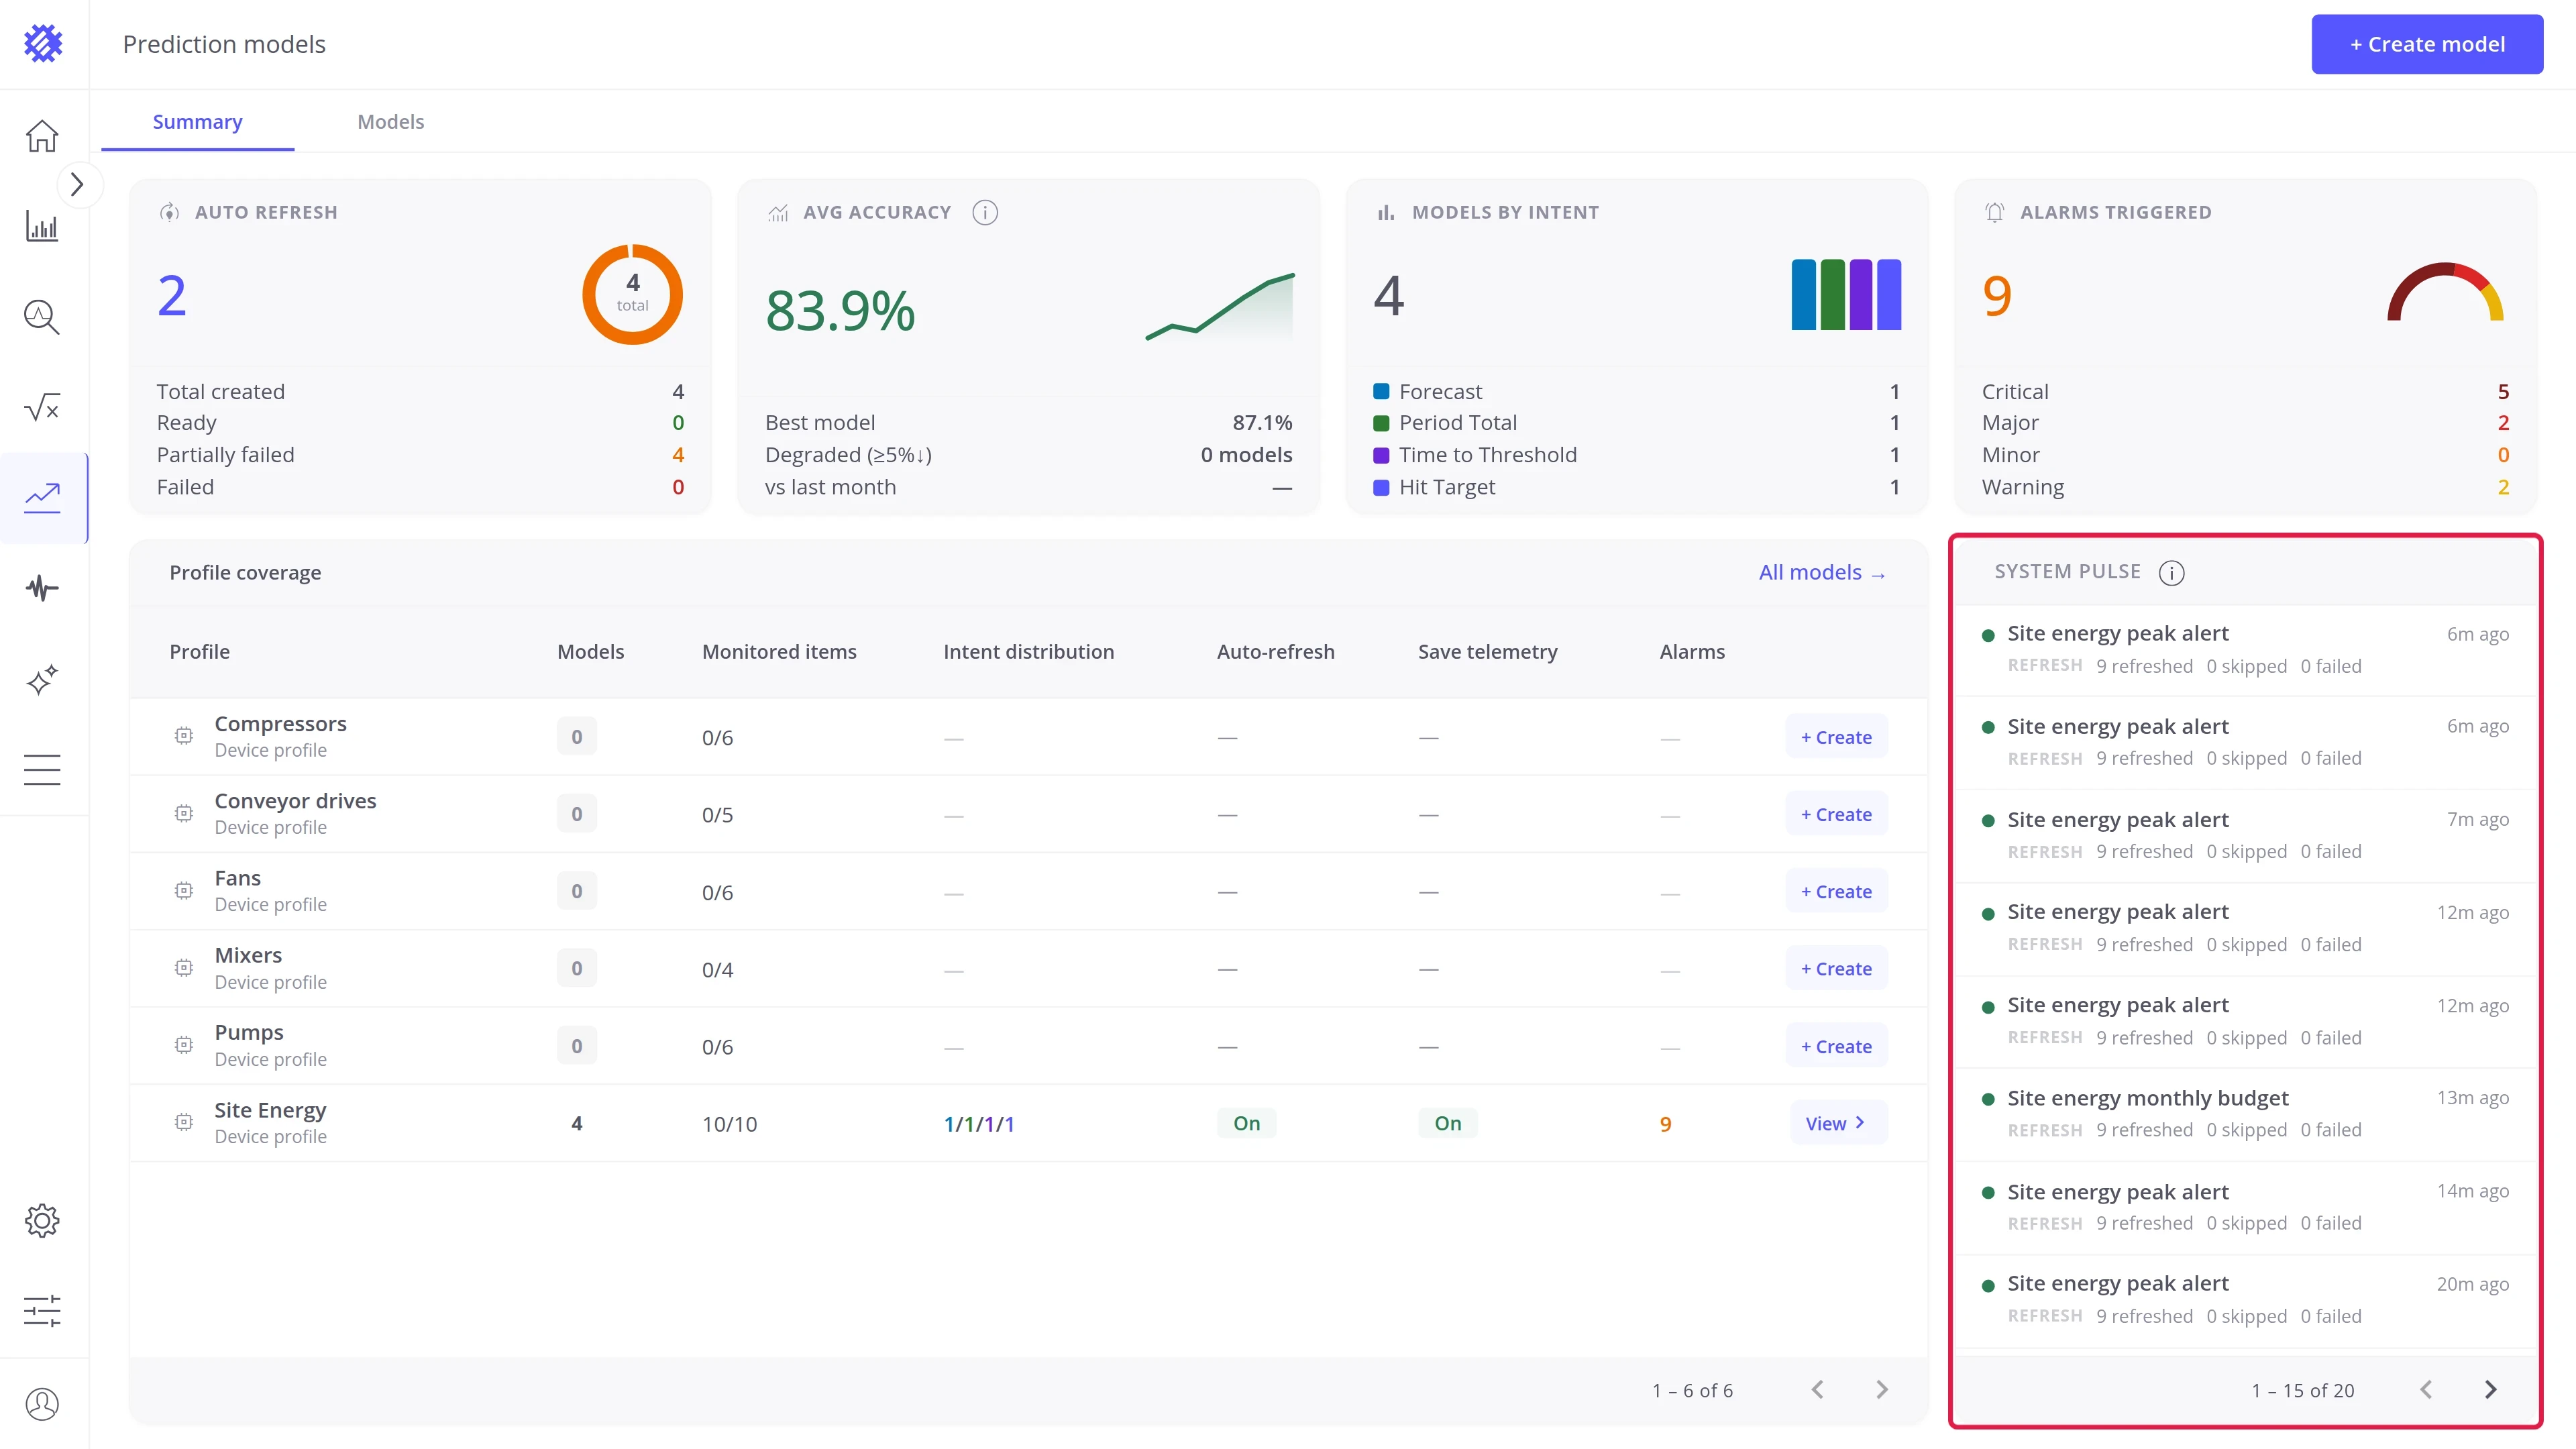
Each entry shows the model, how long ago it ran, the kind of run, and its item counts:
| Tag | Run | Counts |
|---|---|---|
| Train | Training | Items trained and failed |
| Refresh | A refresh | Items refreshed, skipped, and failed |
| Accuracy | An accuracy check | Items checked and failed |
The dot shows how the run ended: Completed, Partial, Failed, or Canceled.
Models tab
Section titled “Models tab”The Models tab lists every model of the tenant, newest first.
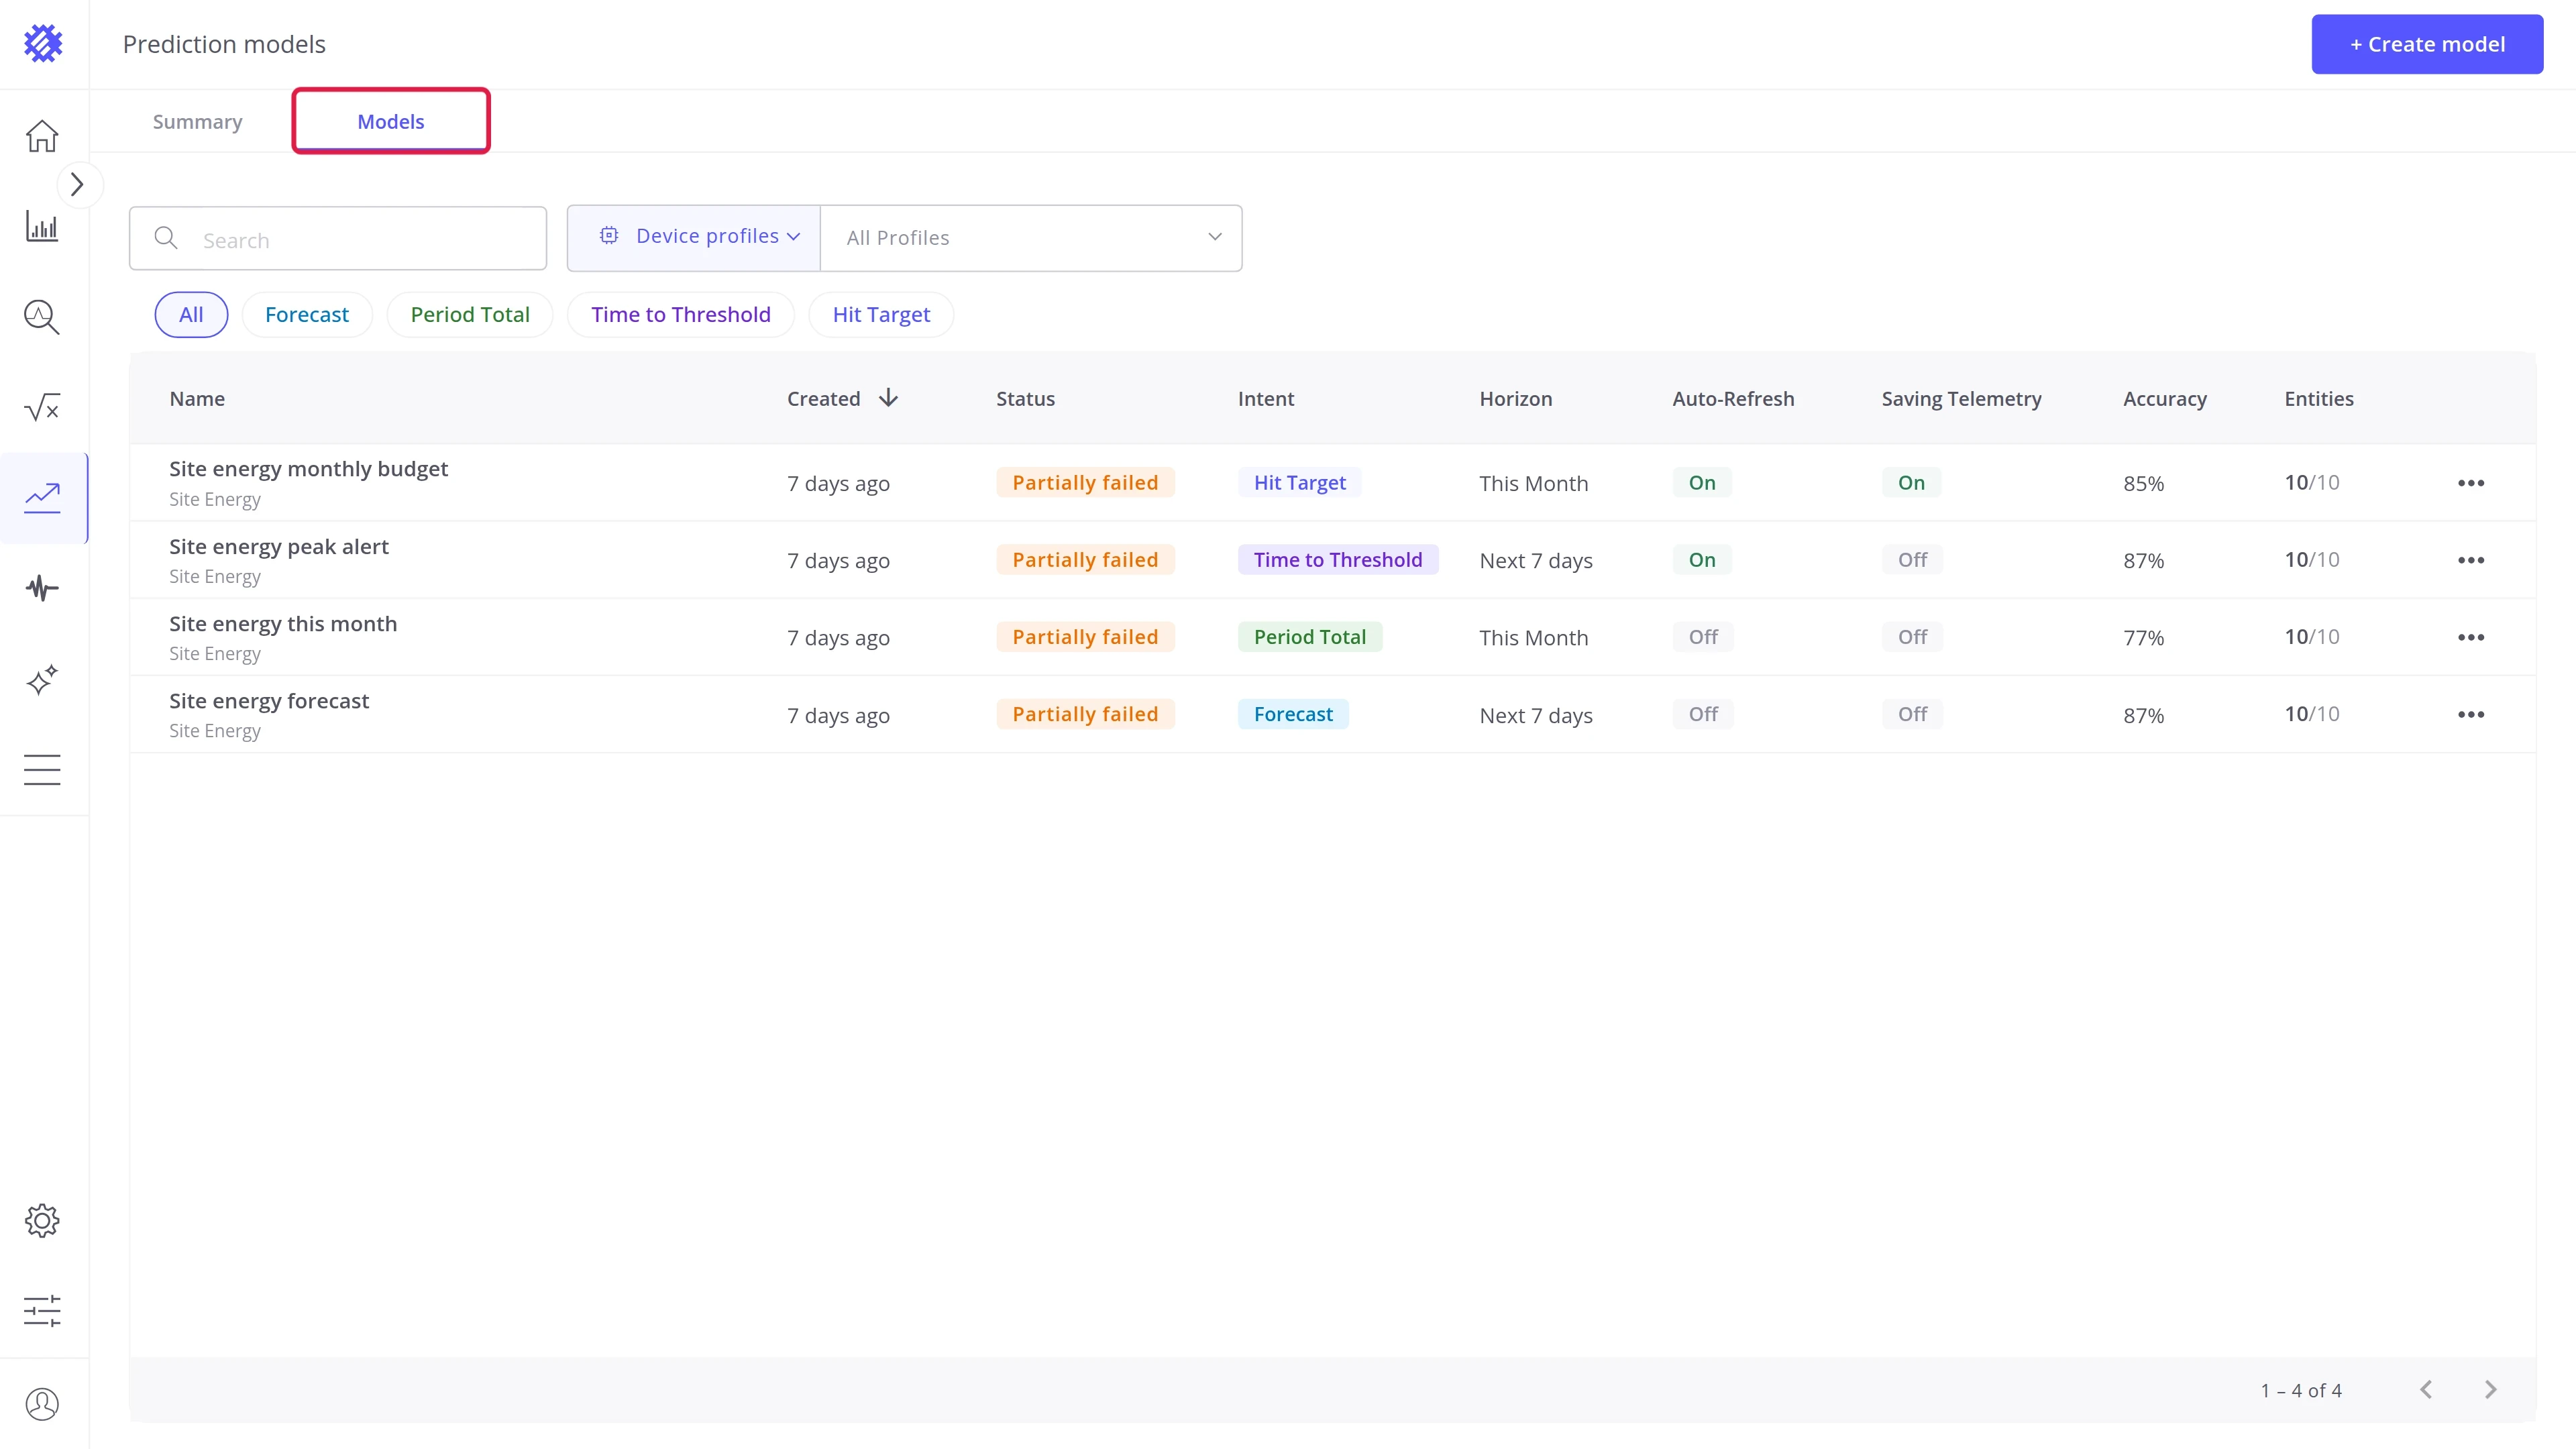
Each row shows:
| Column | Description |
|---|---|
| Name | The model name and its profile |
| Created | When the model was created |
| Status | Ready, Training, Partially failed, Failed, or Cancelled |
| Intent | Forecast, Period Total, Time to Threshold, or Hit Target |
| Horizon | How far ahead the model predicts, for example Next 7 days or This Month |
| Auto-Refresh | Whether the model refreshes on a schedule |
| Saving Telemetry | Whether the model writes its predictions to ThingsBoard |
| Accuracy | The accuracy of the model |
| Entities | Items in the model, out of all items of the profile |
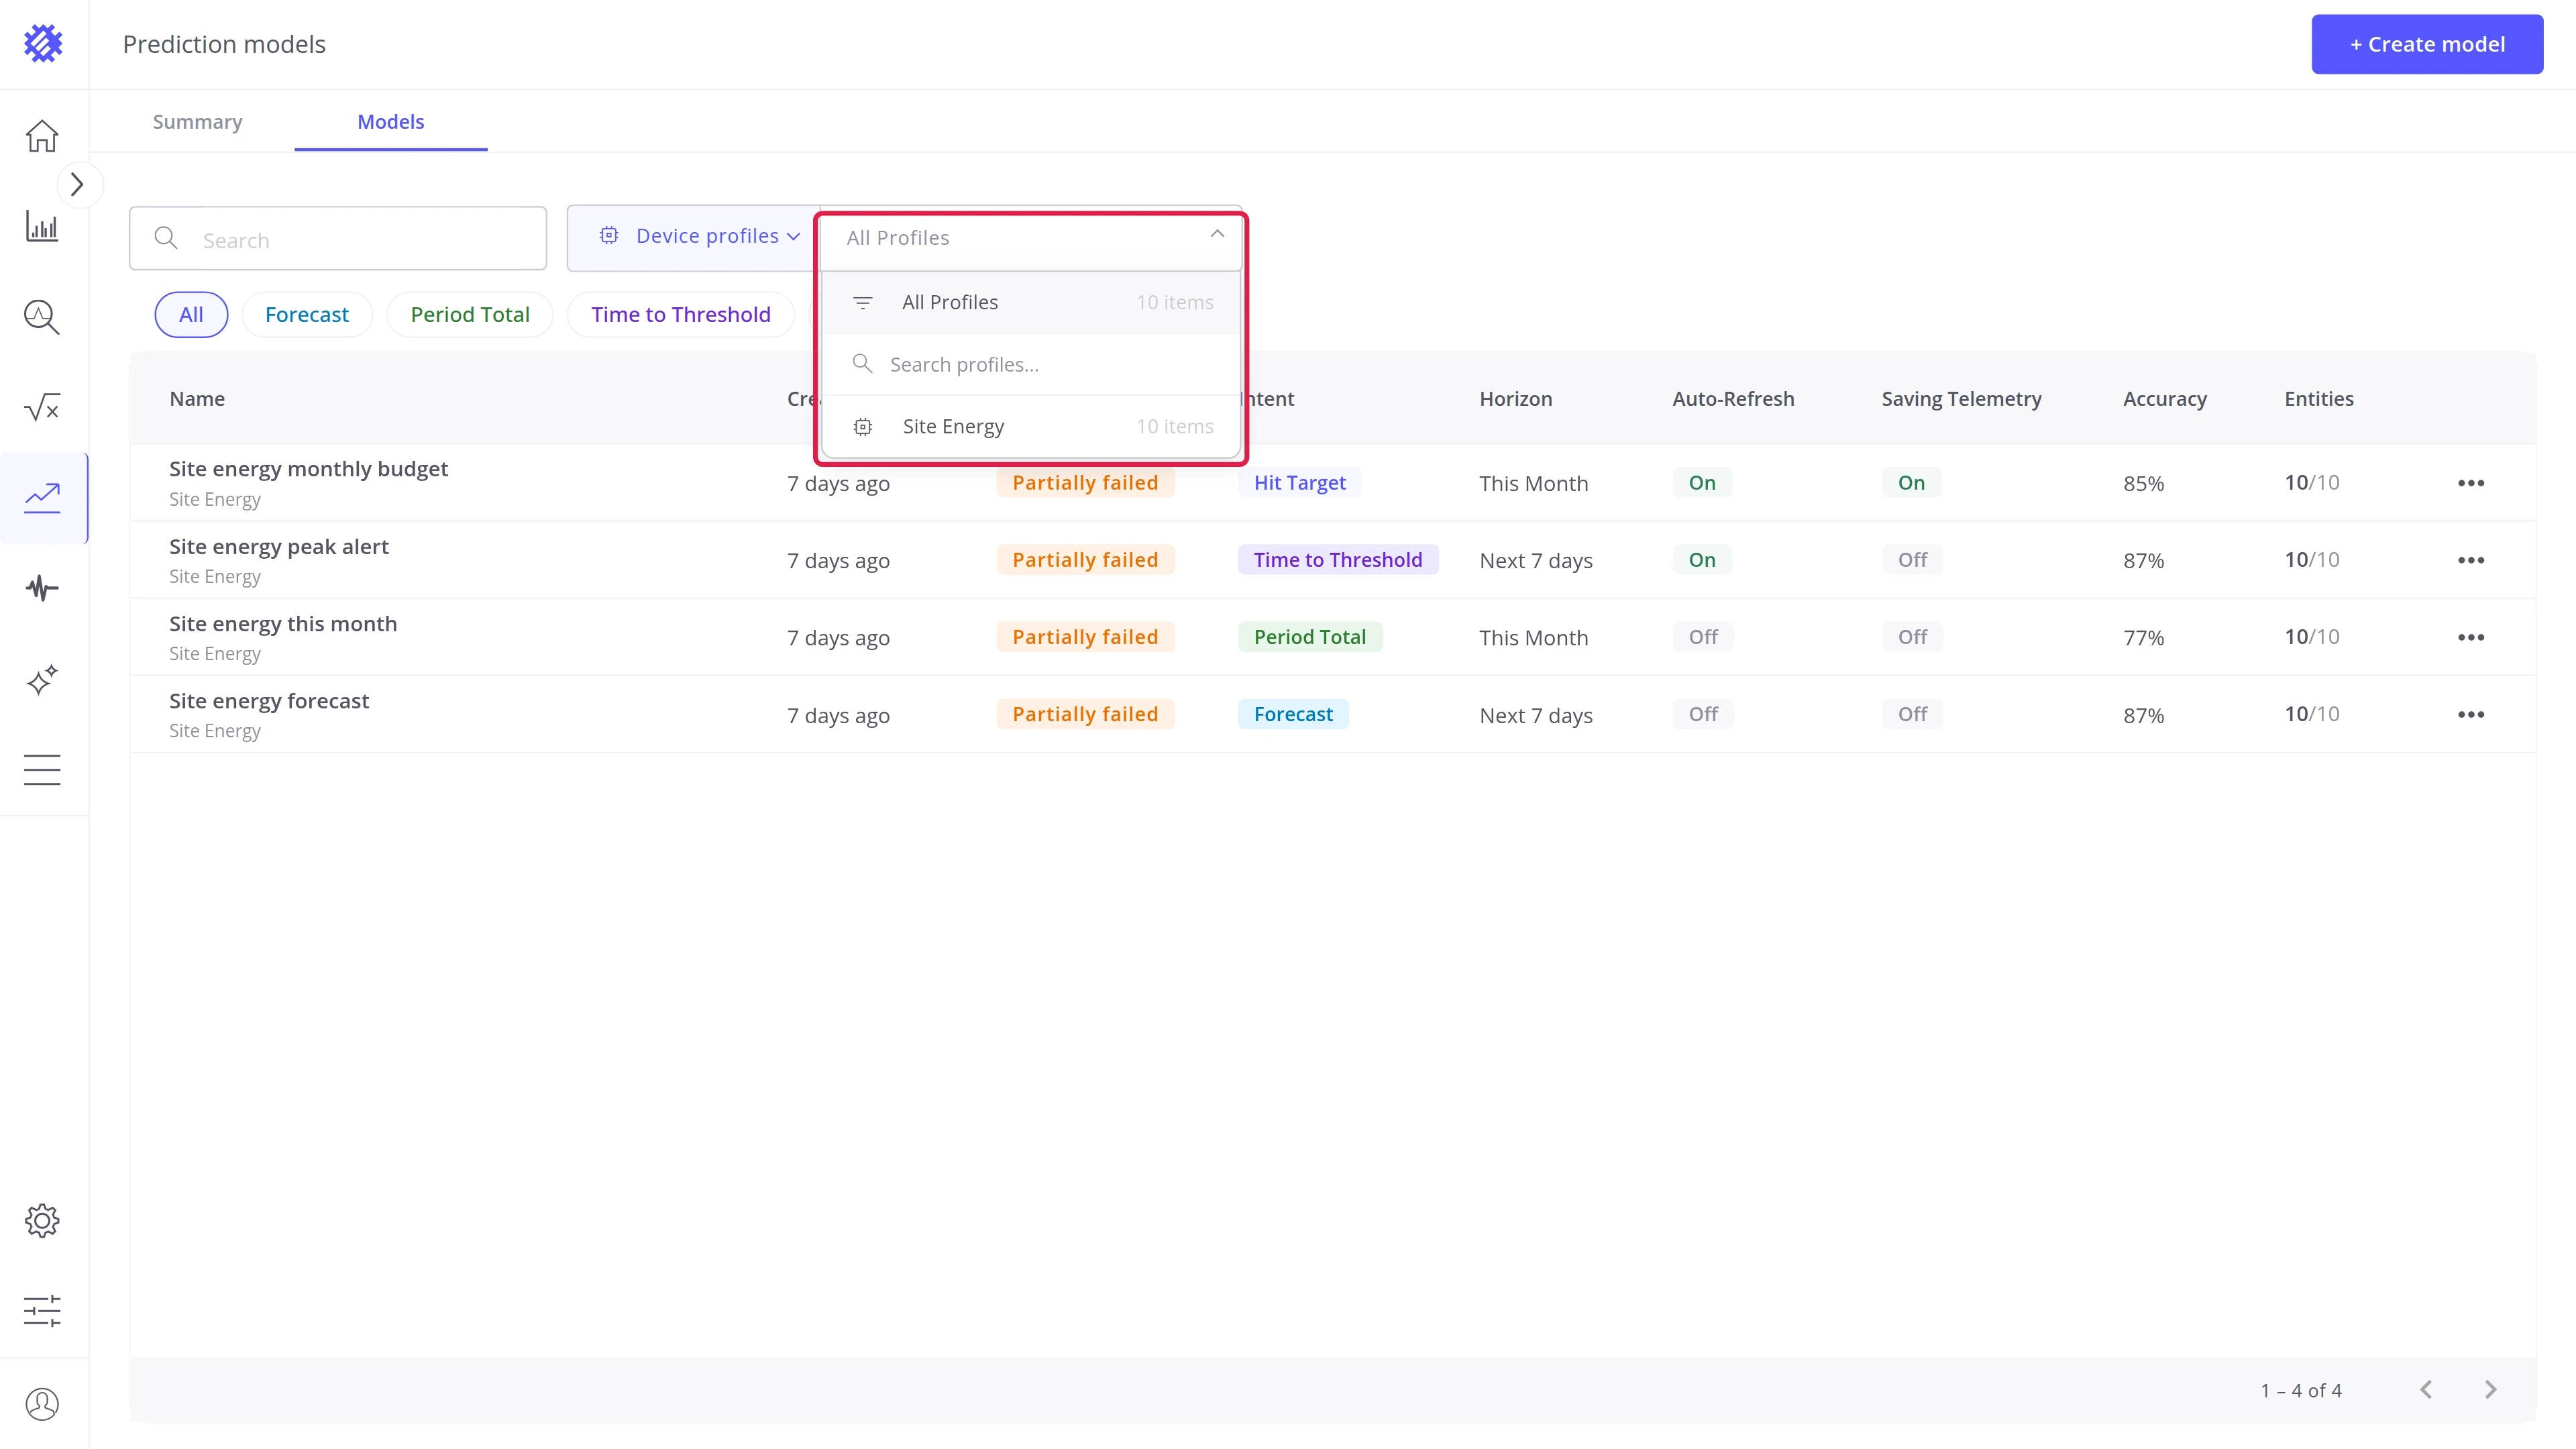
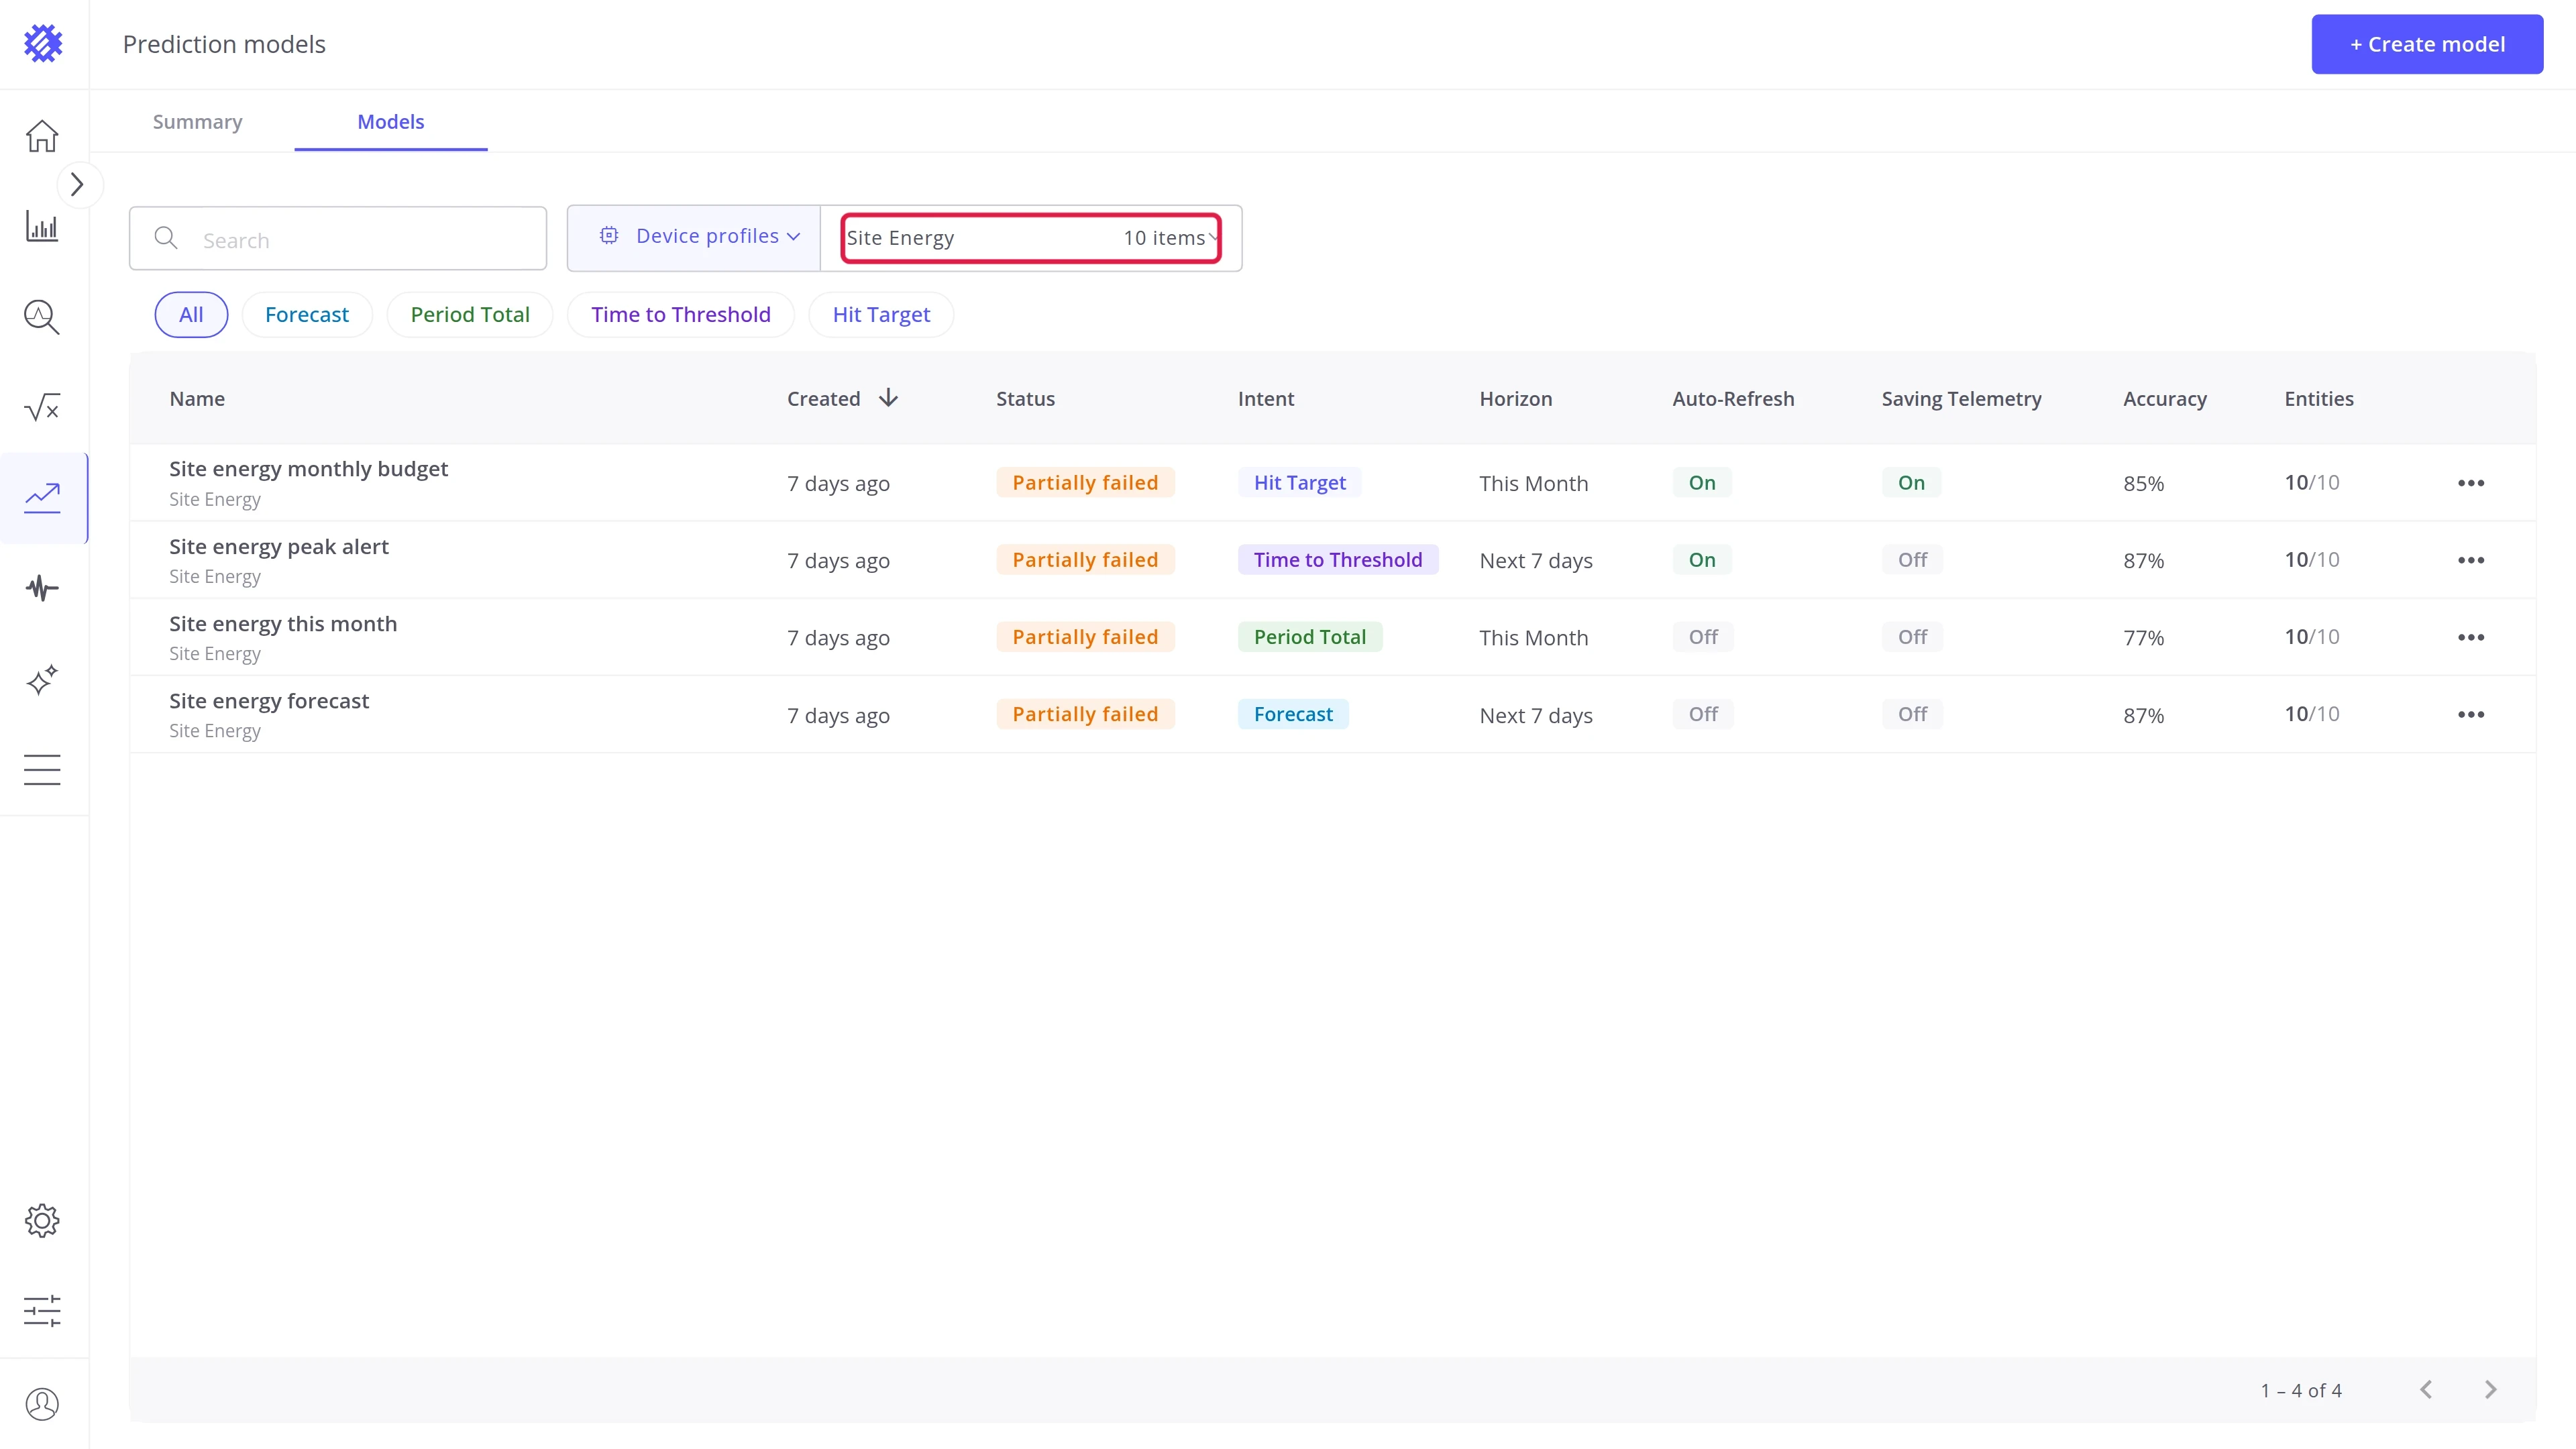
By profile. The left select switches between Device profiles and Asset profiles, the right one picks a single profile.
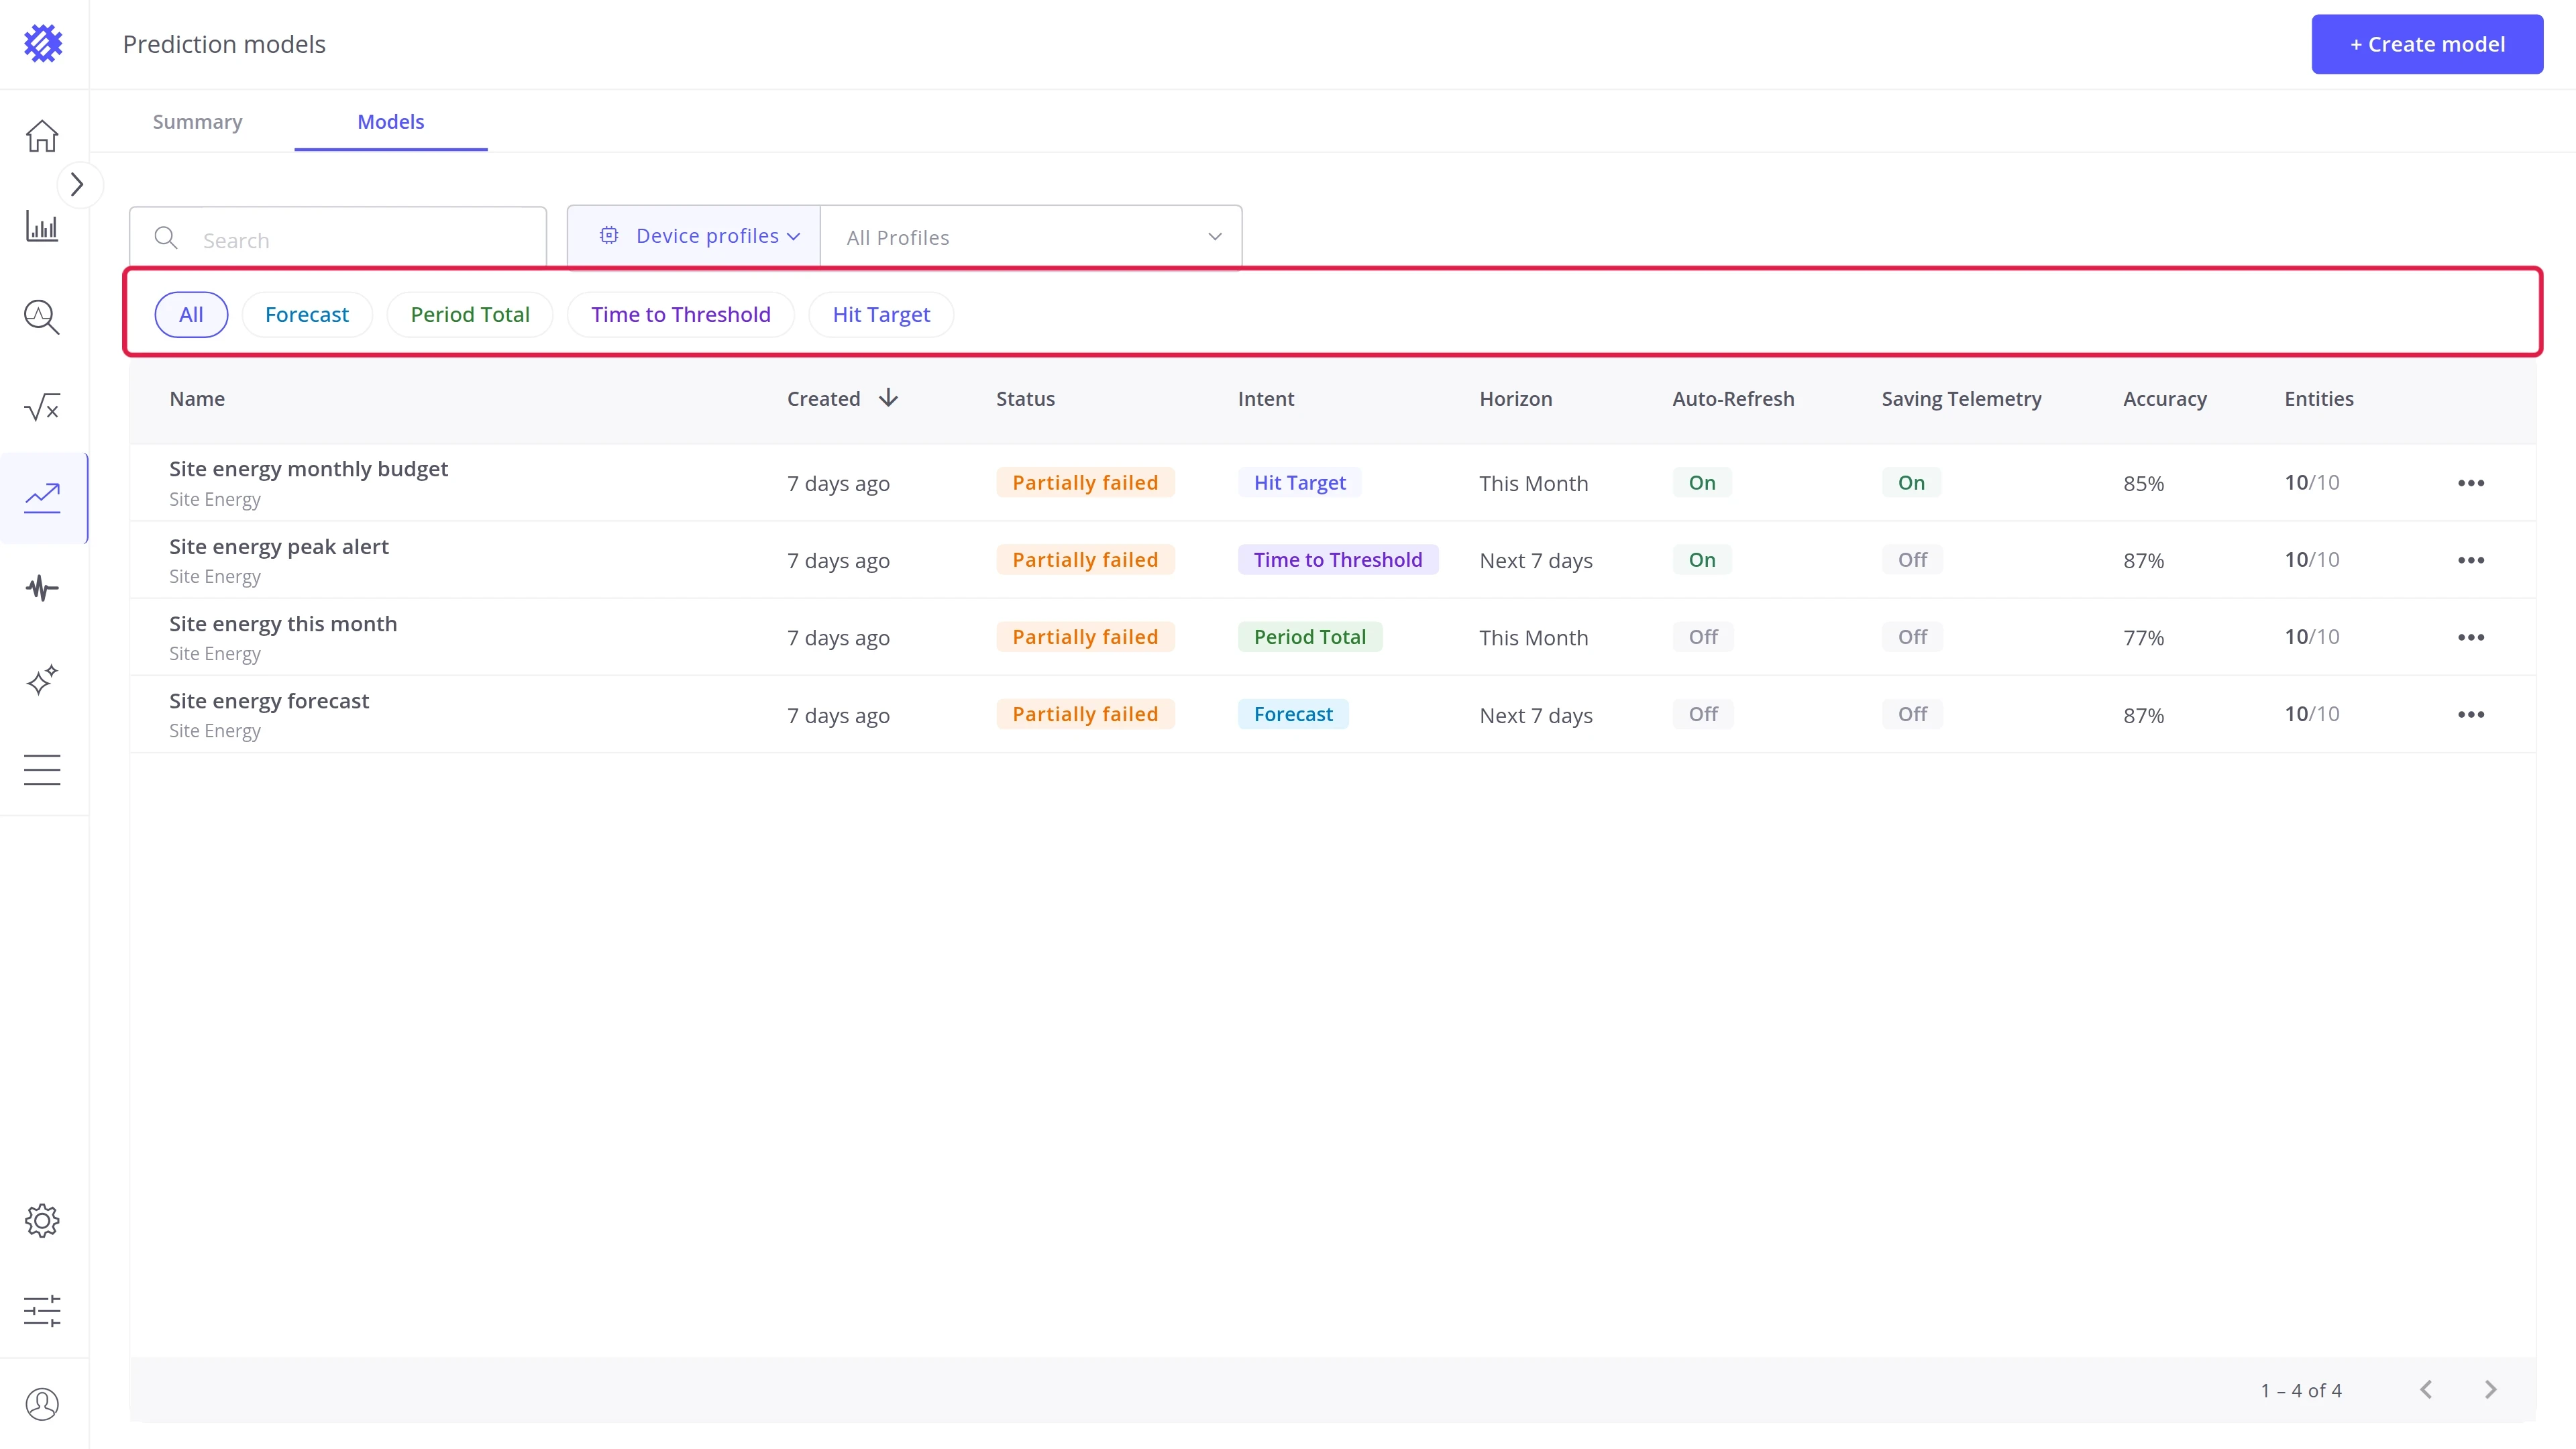
By intent. The chips under the toolbar show the models of one intent, or All.
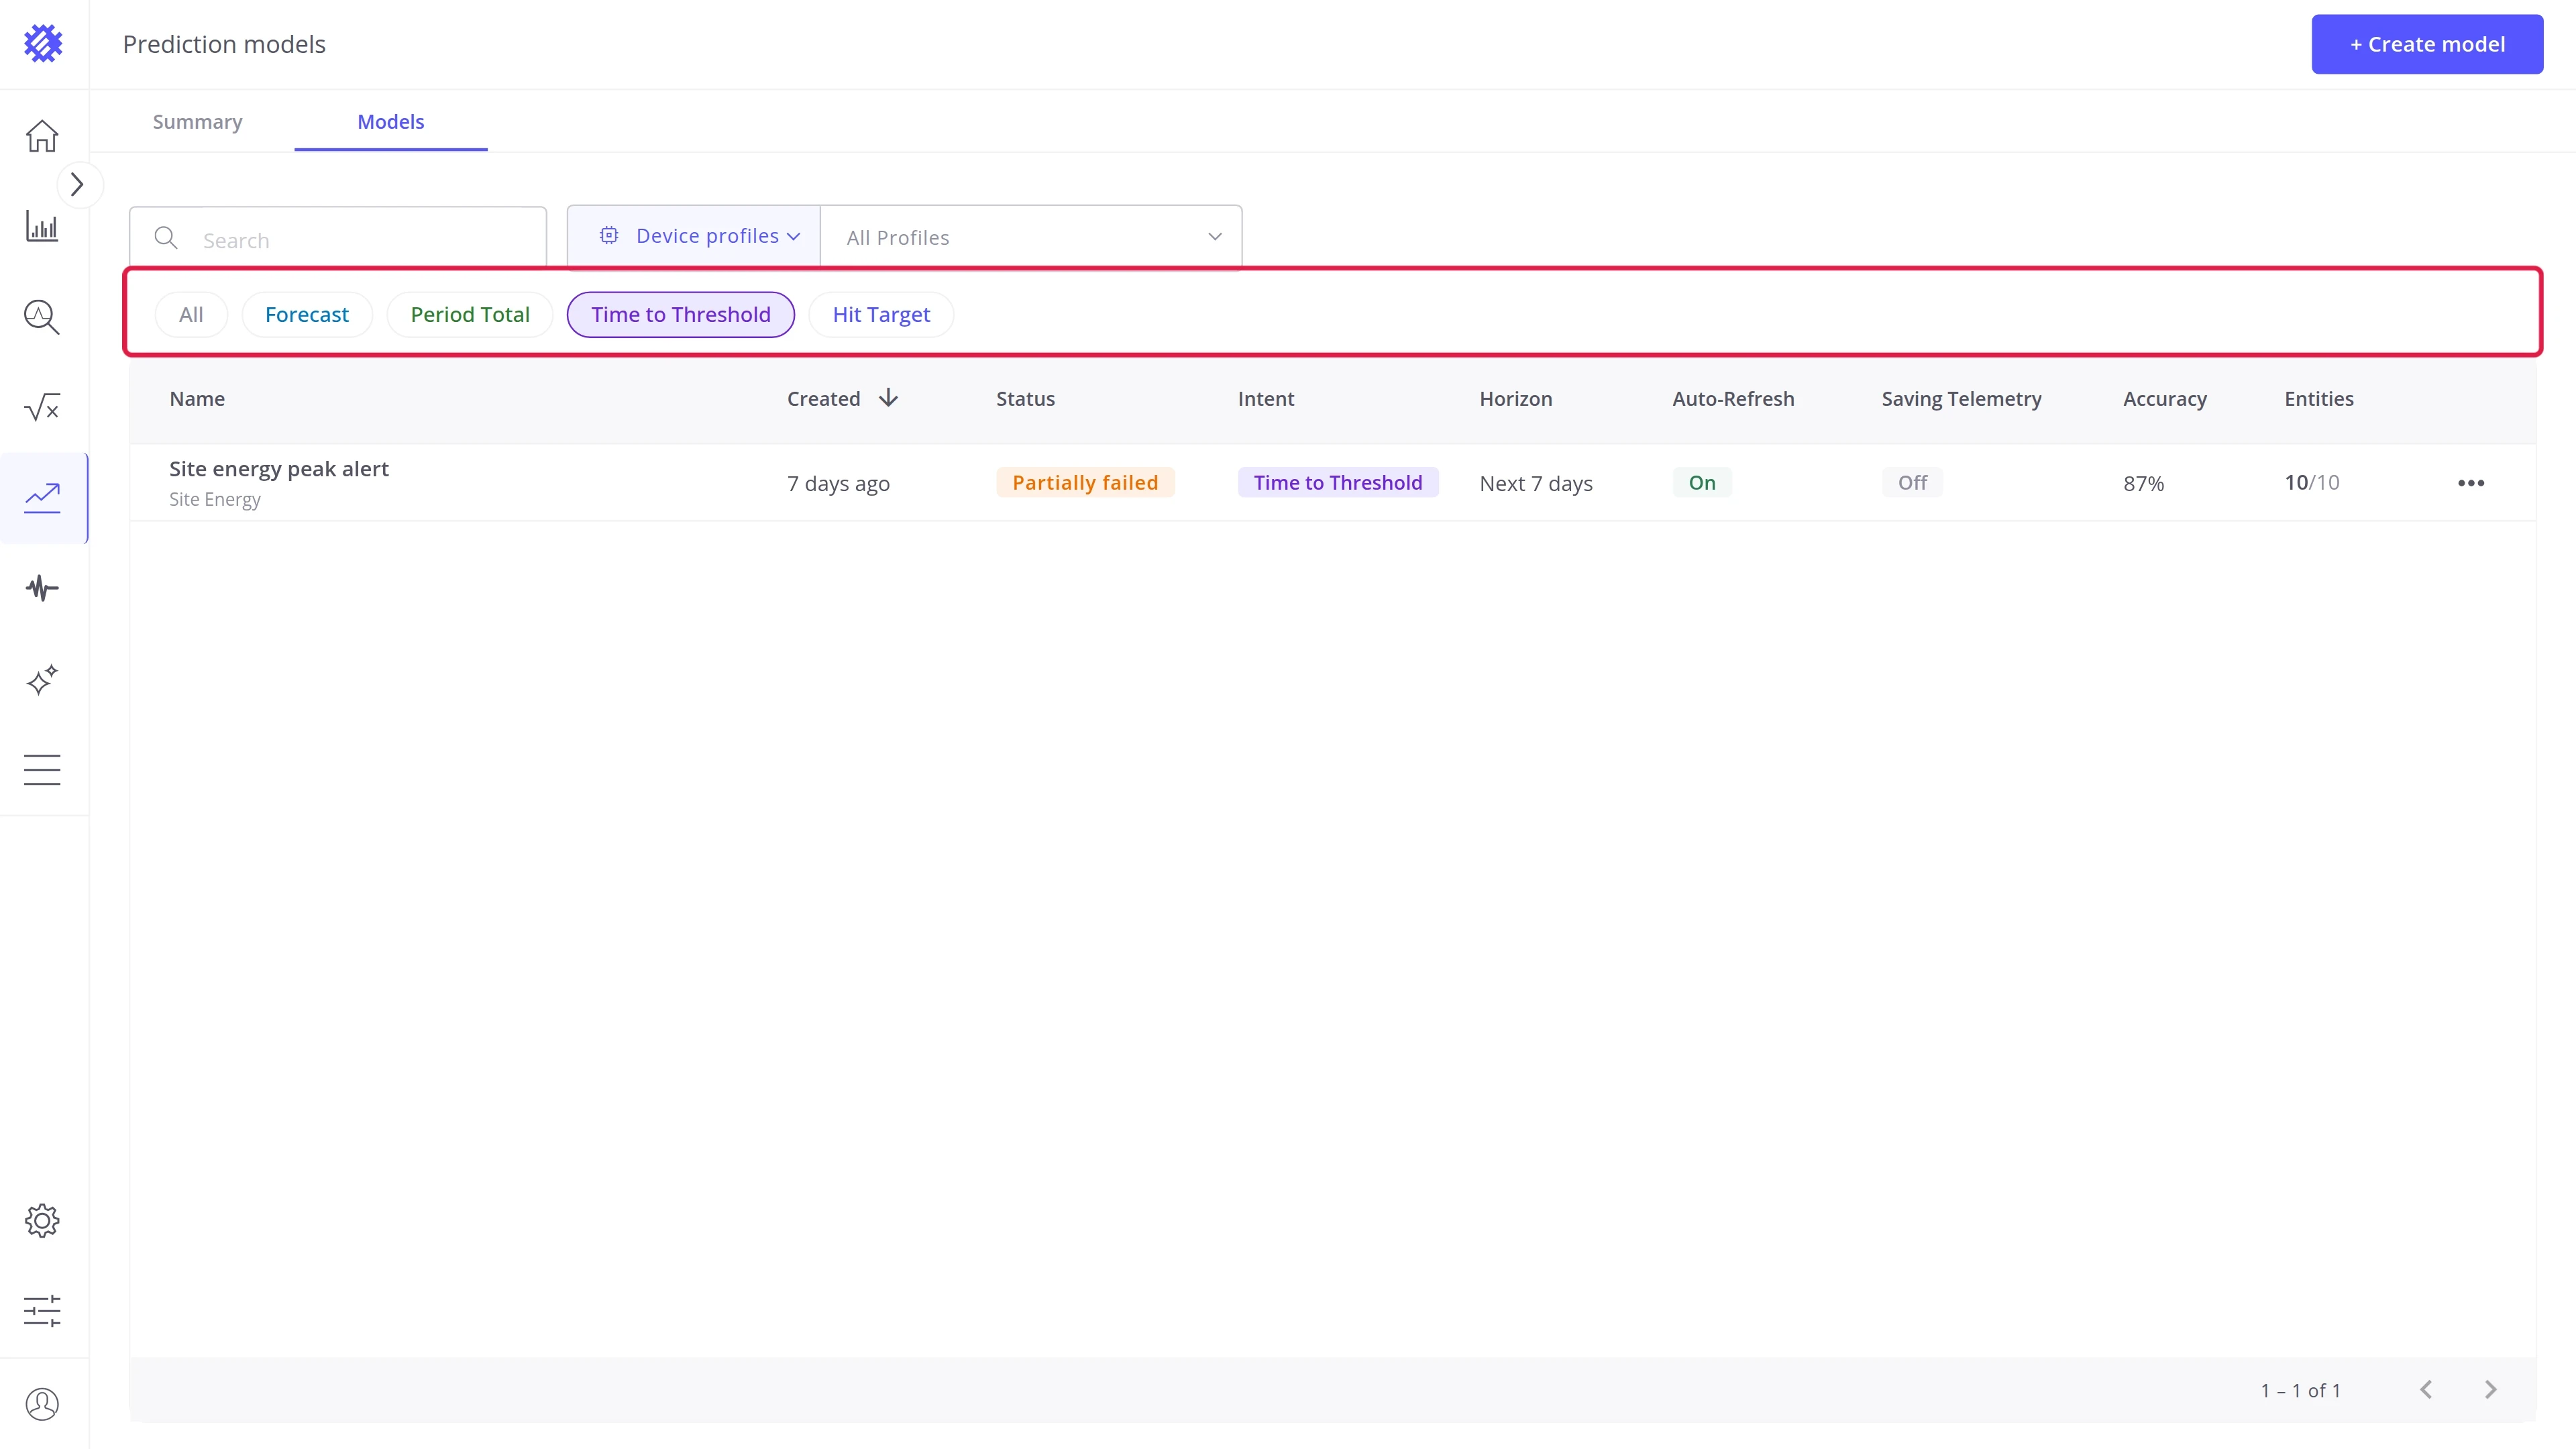
Search matches the model name as you type, and combines with both filters.
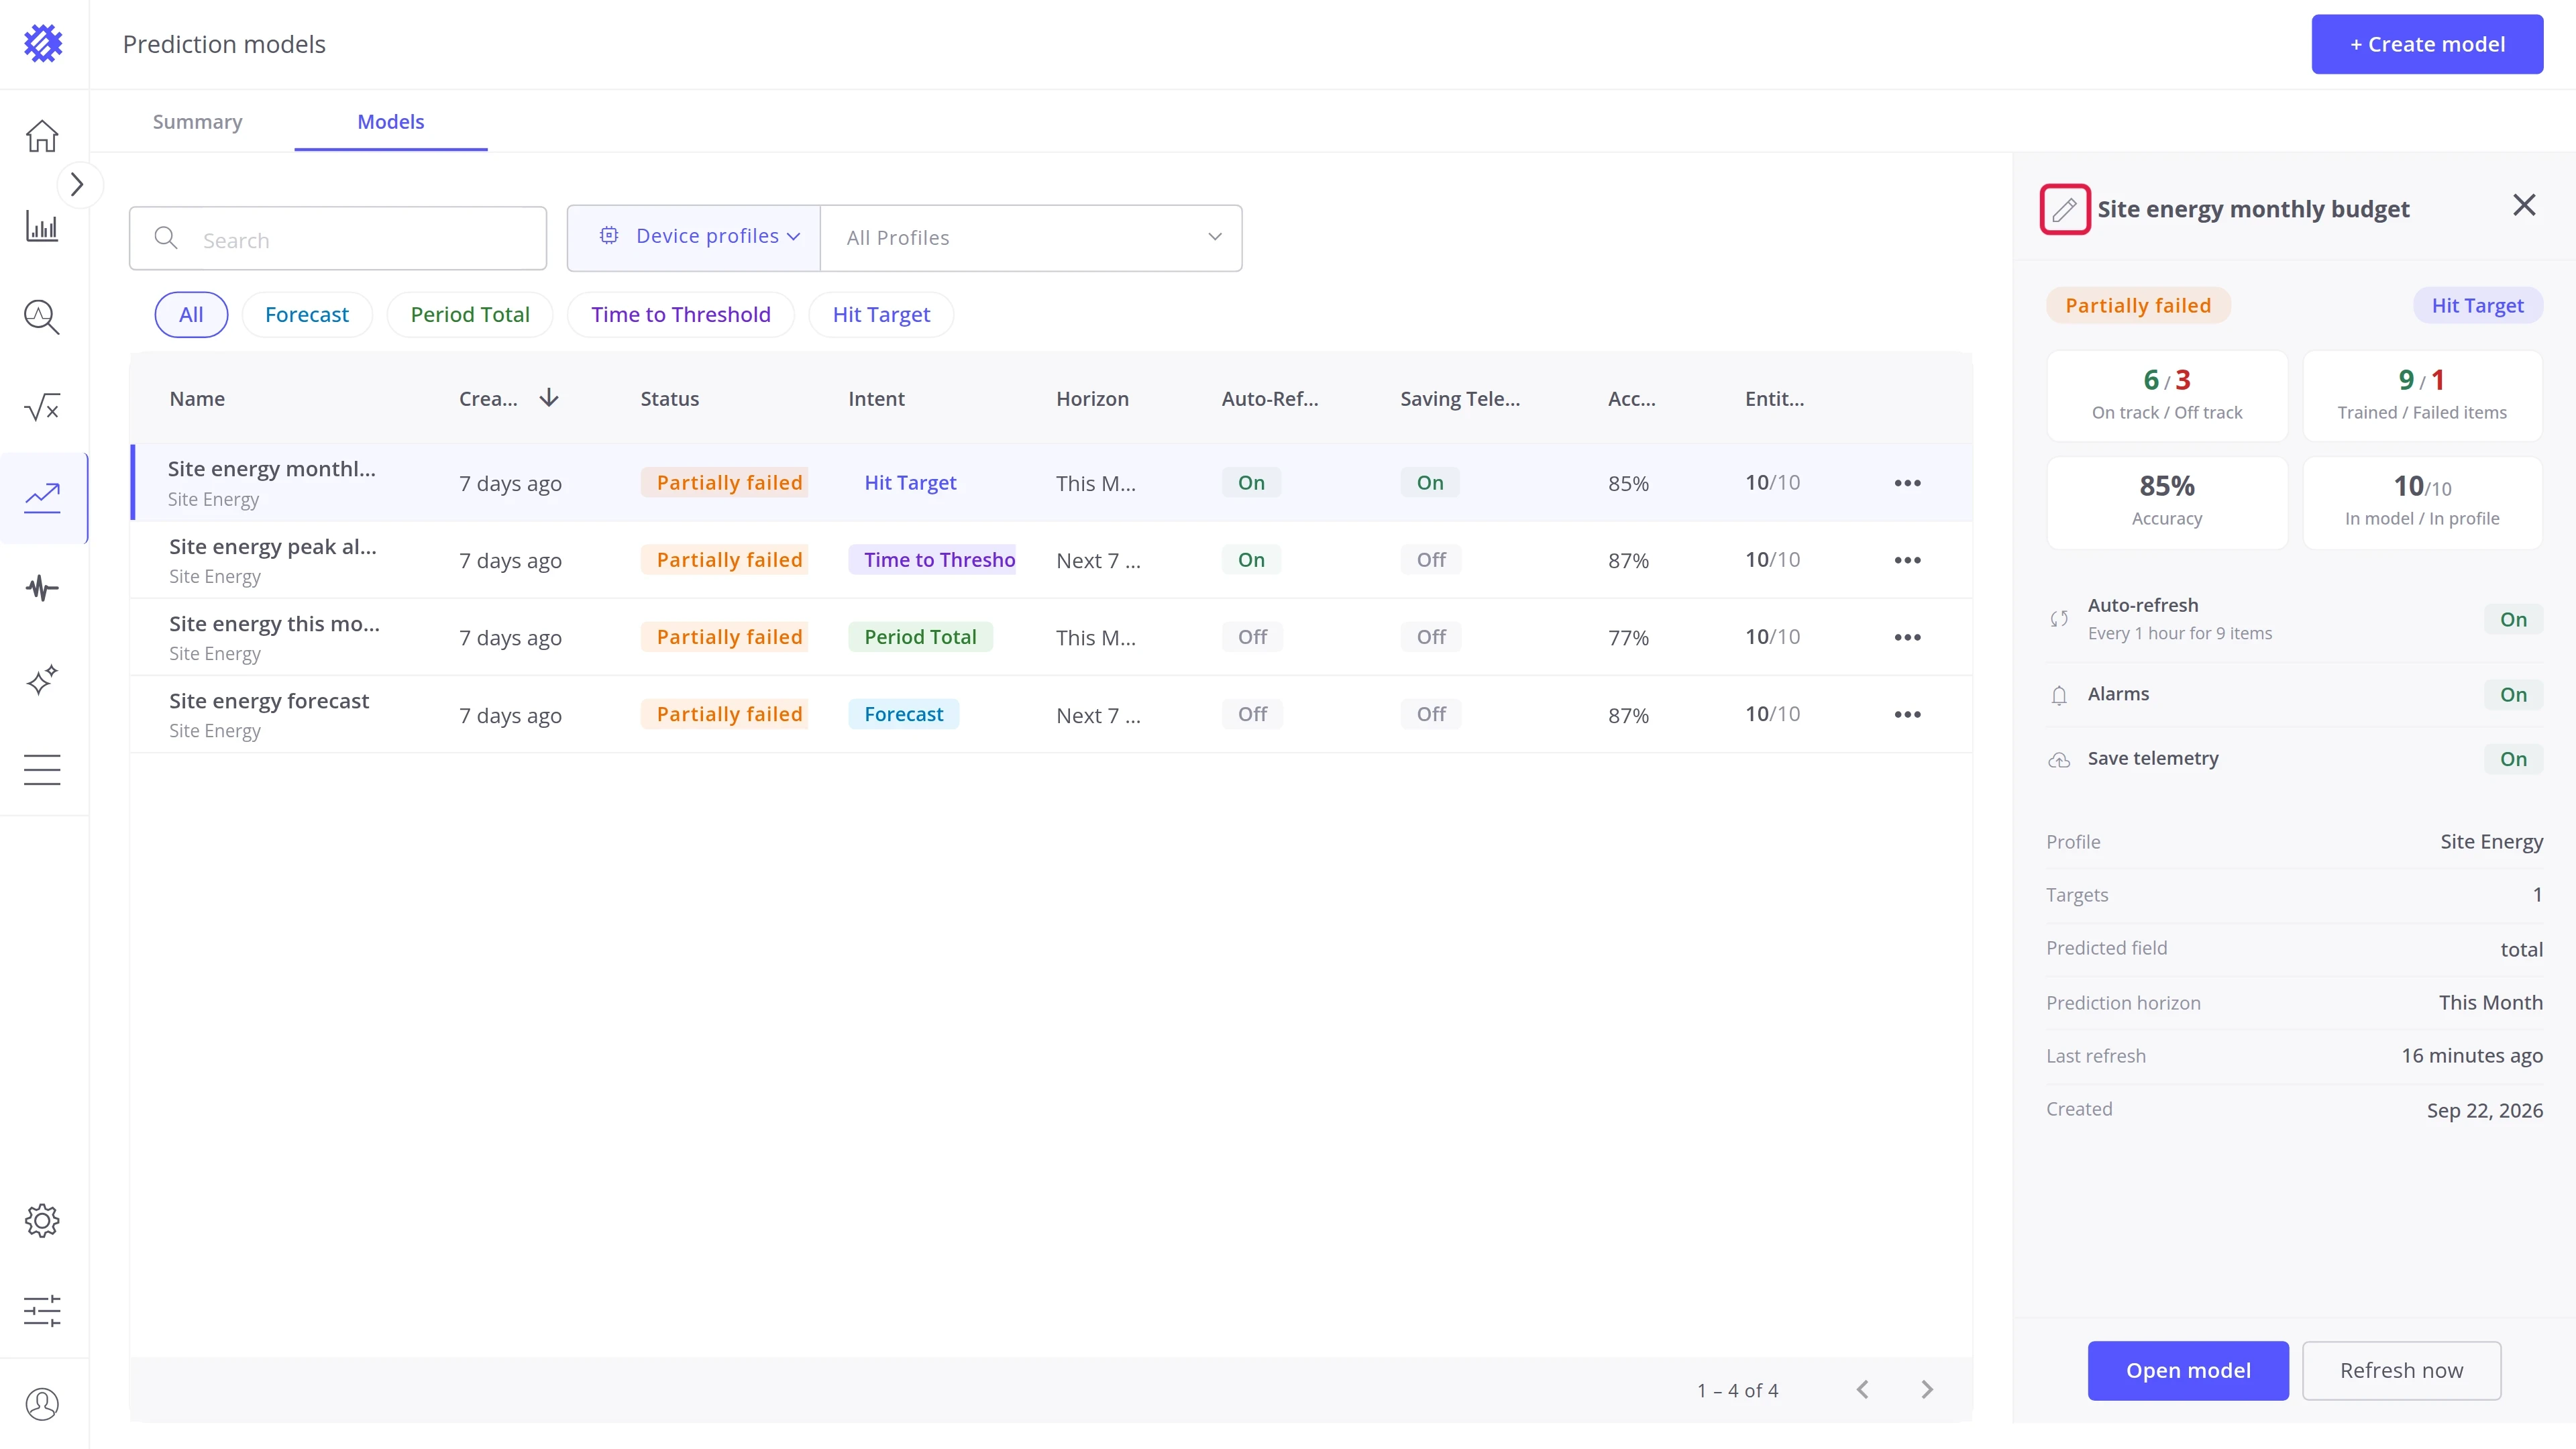
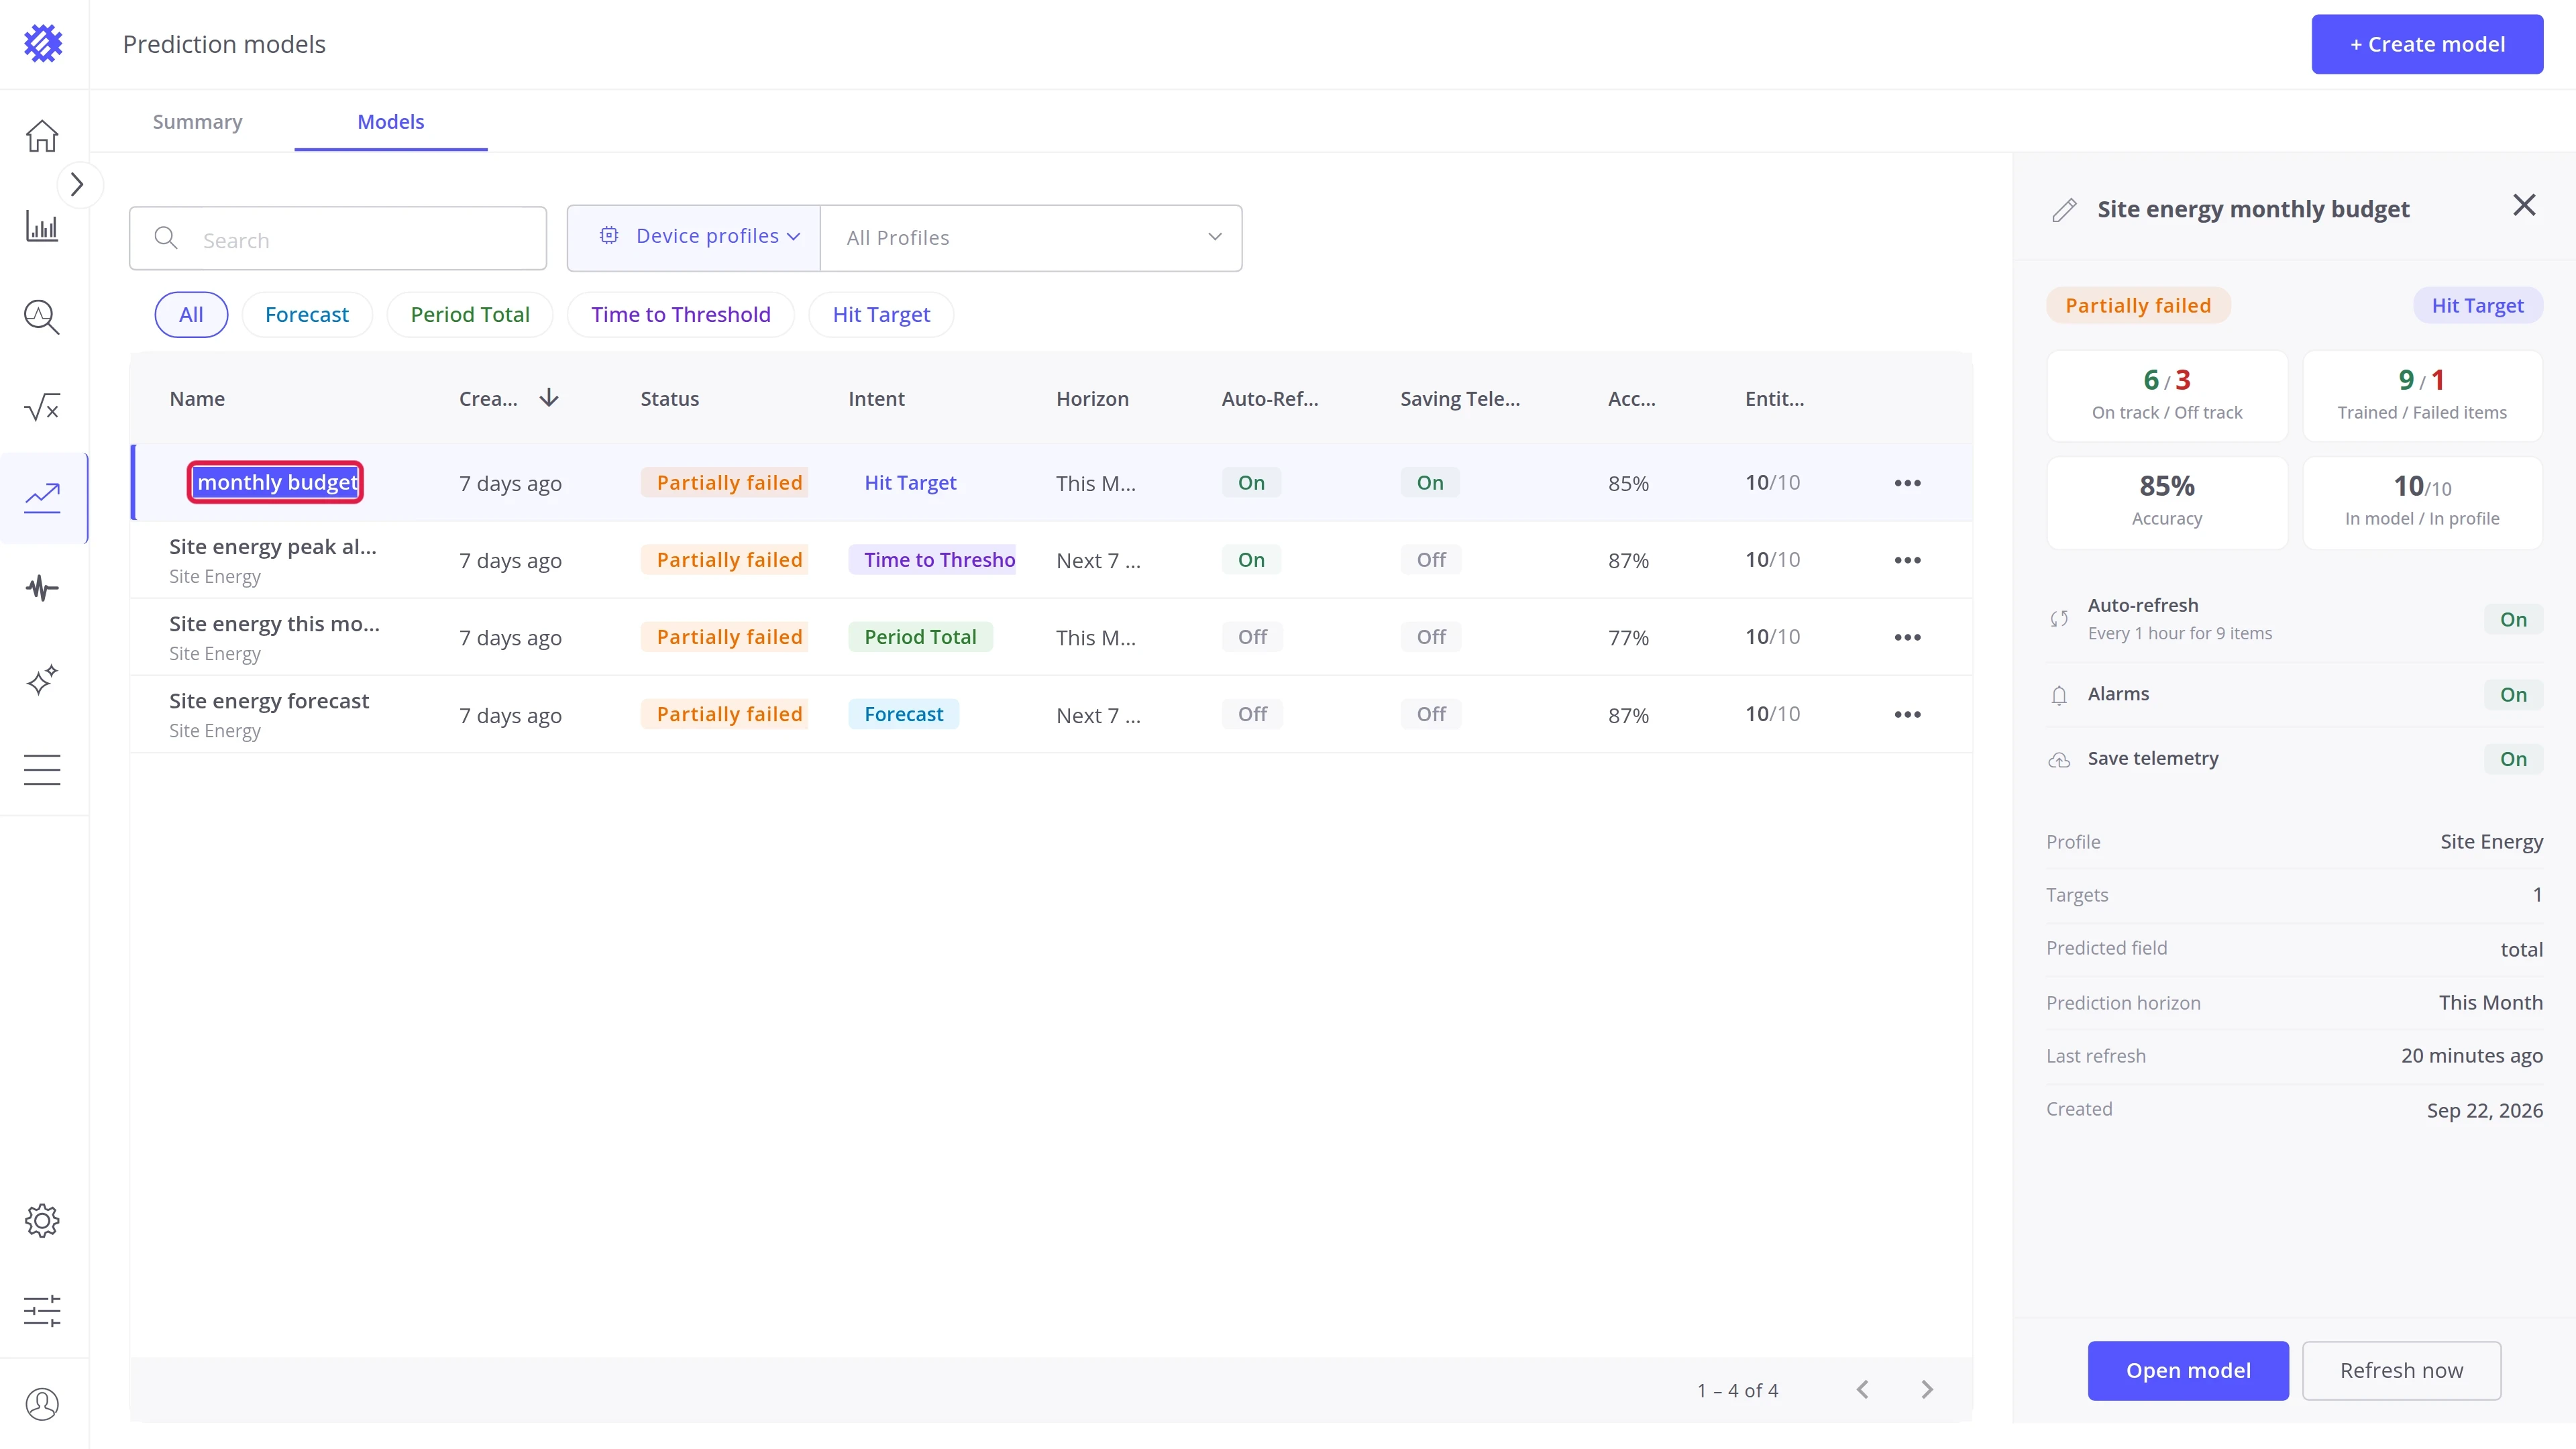
Rename from the panel. Click the pencil beside the model name in the detail panel. The name becomes editable: type the new name and press Enter to save, or Escape to cancel.
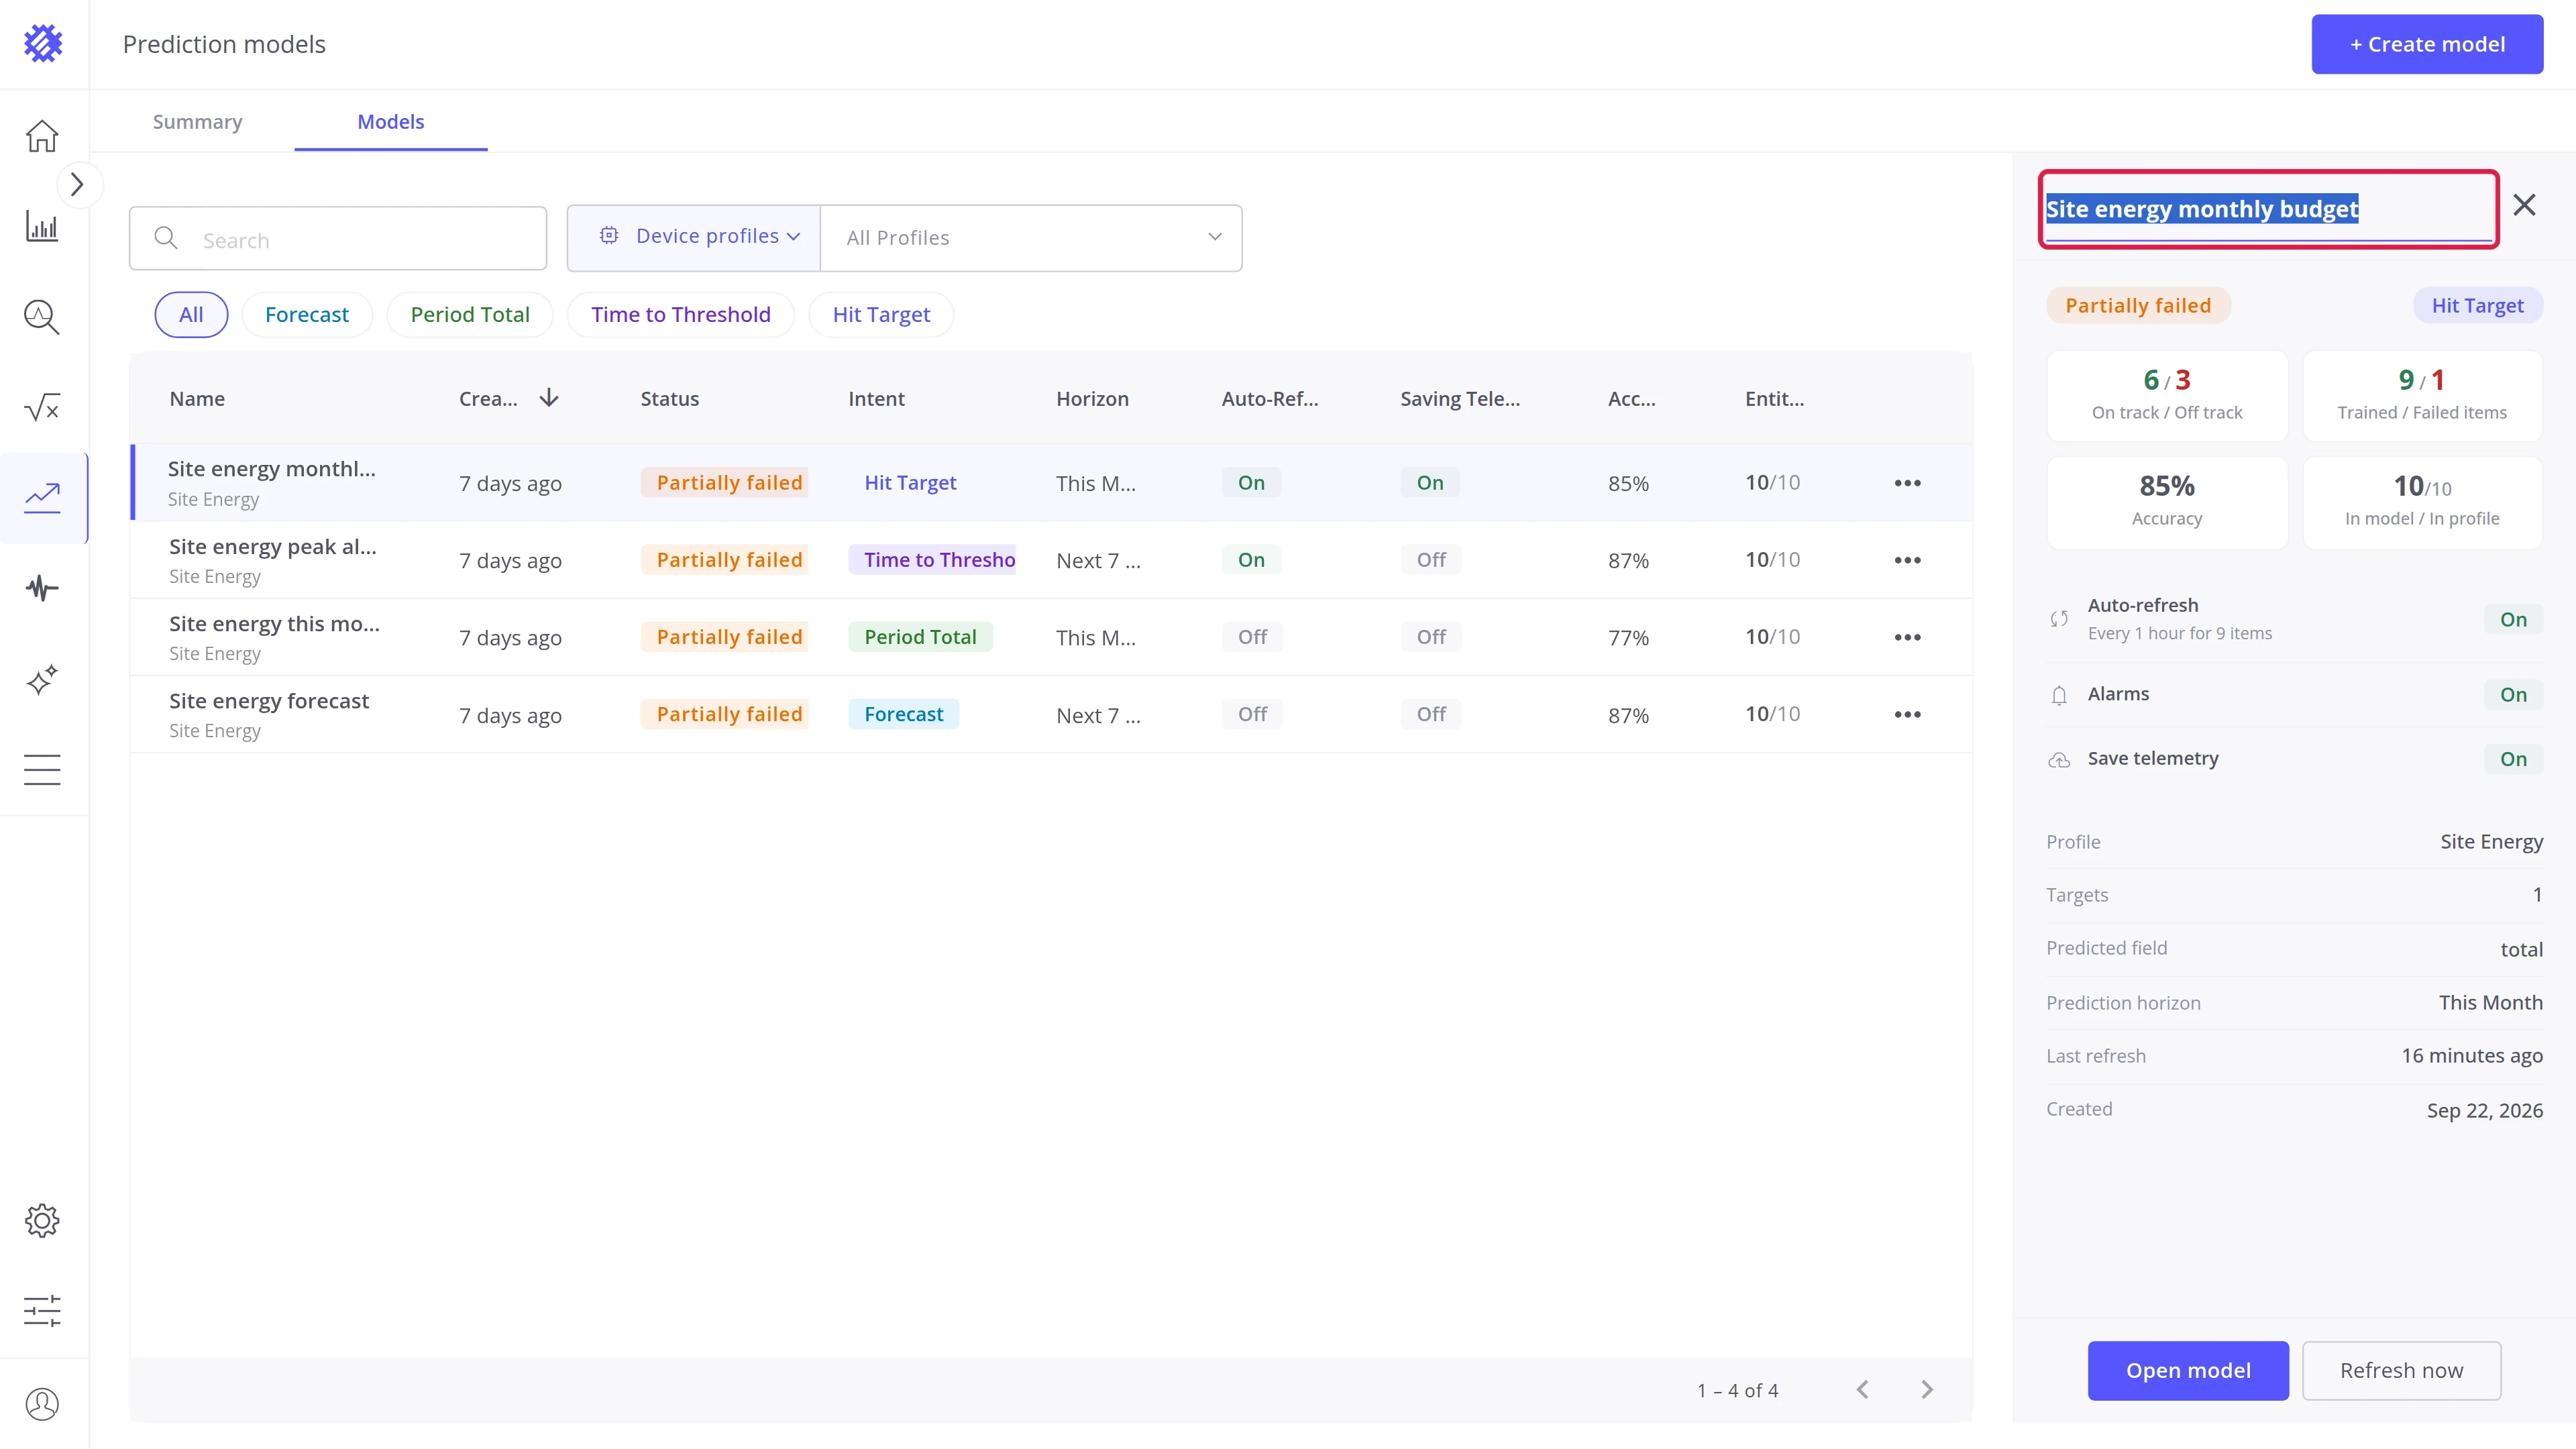
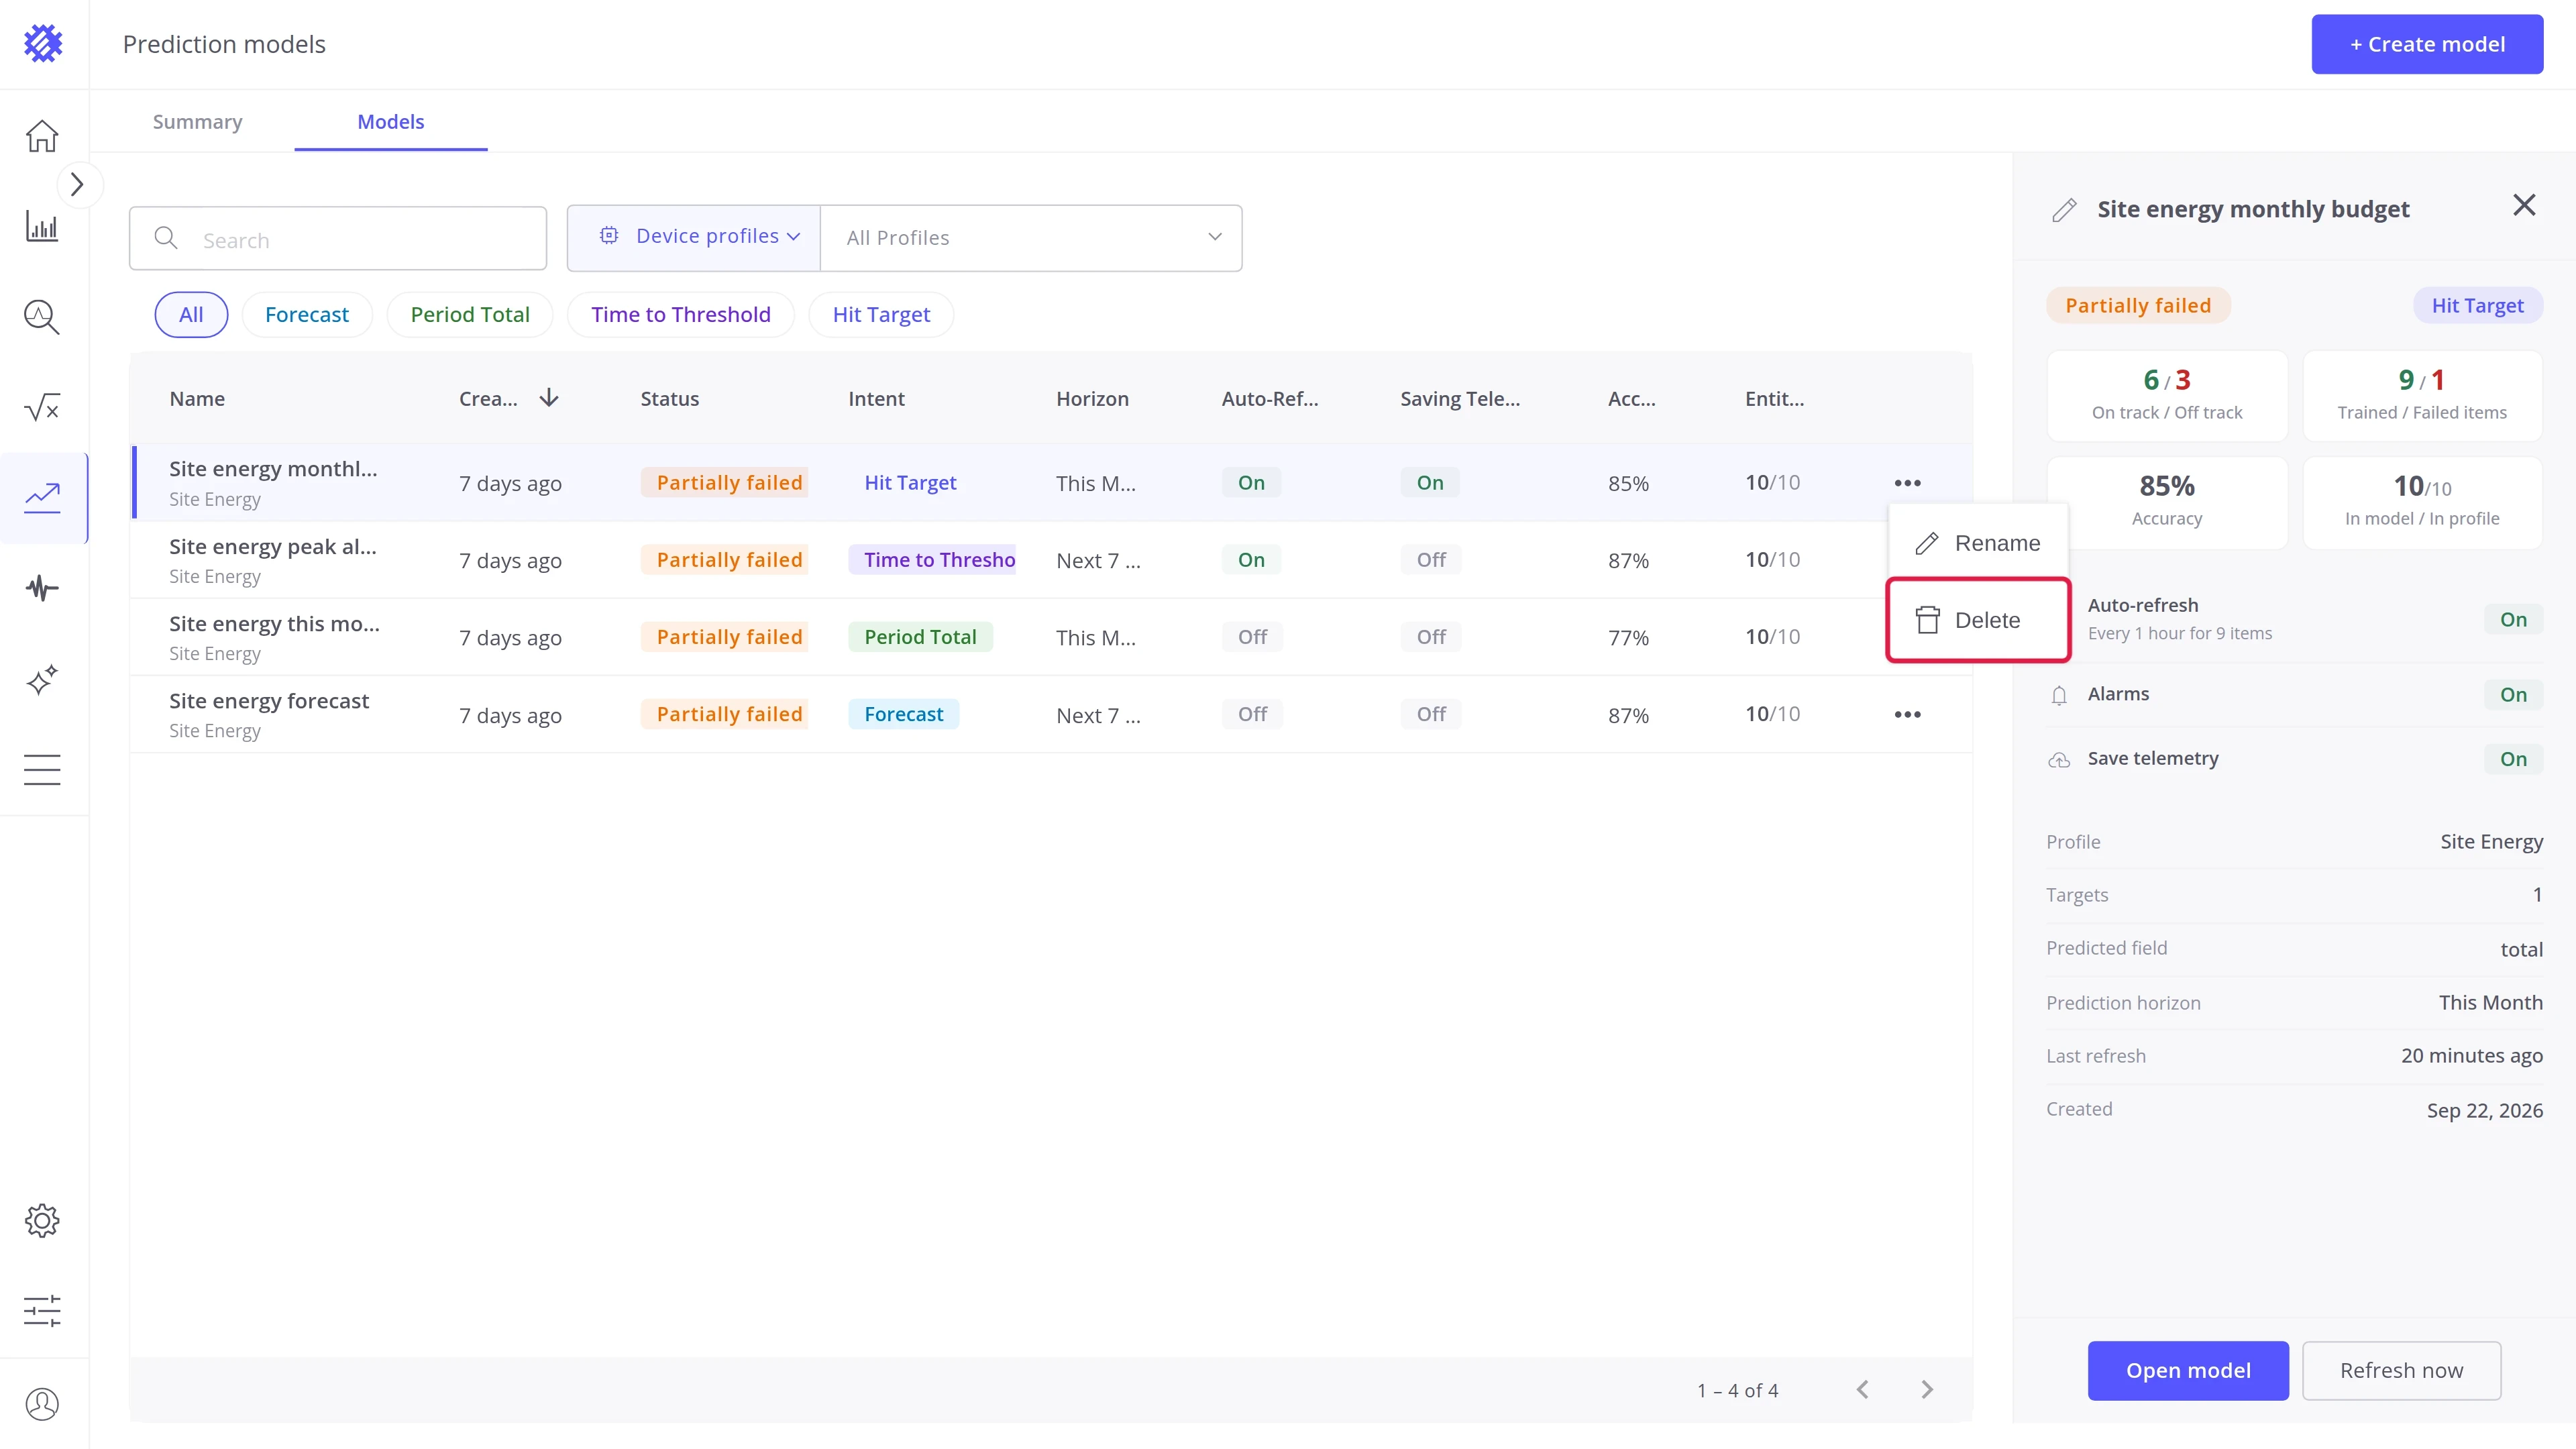
Rename or delete from the table. Click the ⋯ at the end of a row:
- Rename makes the name editable in the table. Type the new name and press Enter.
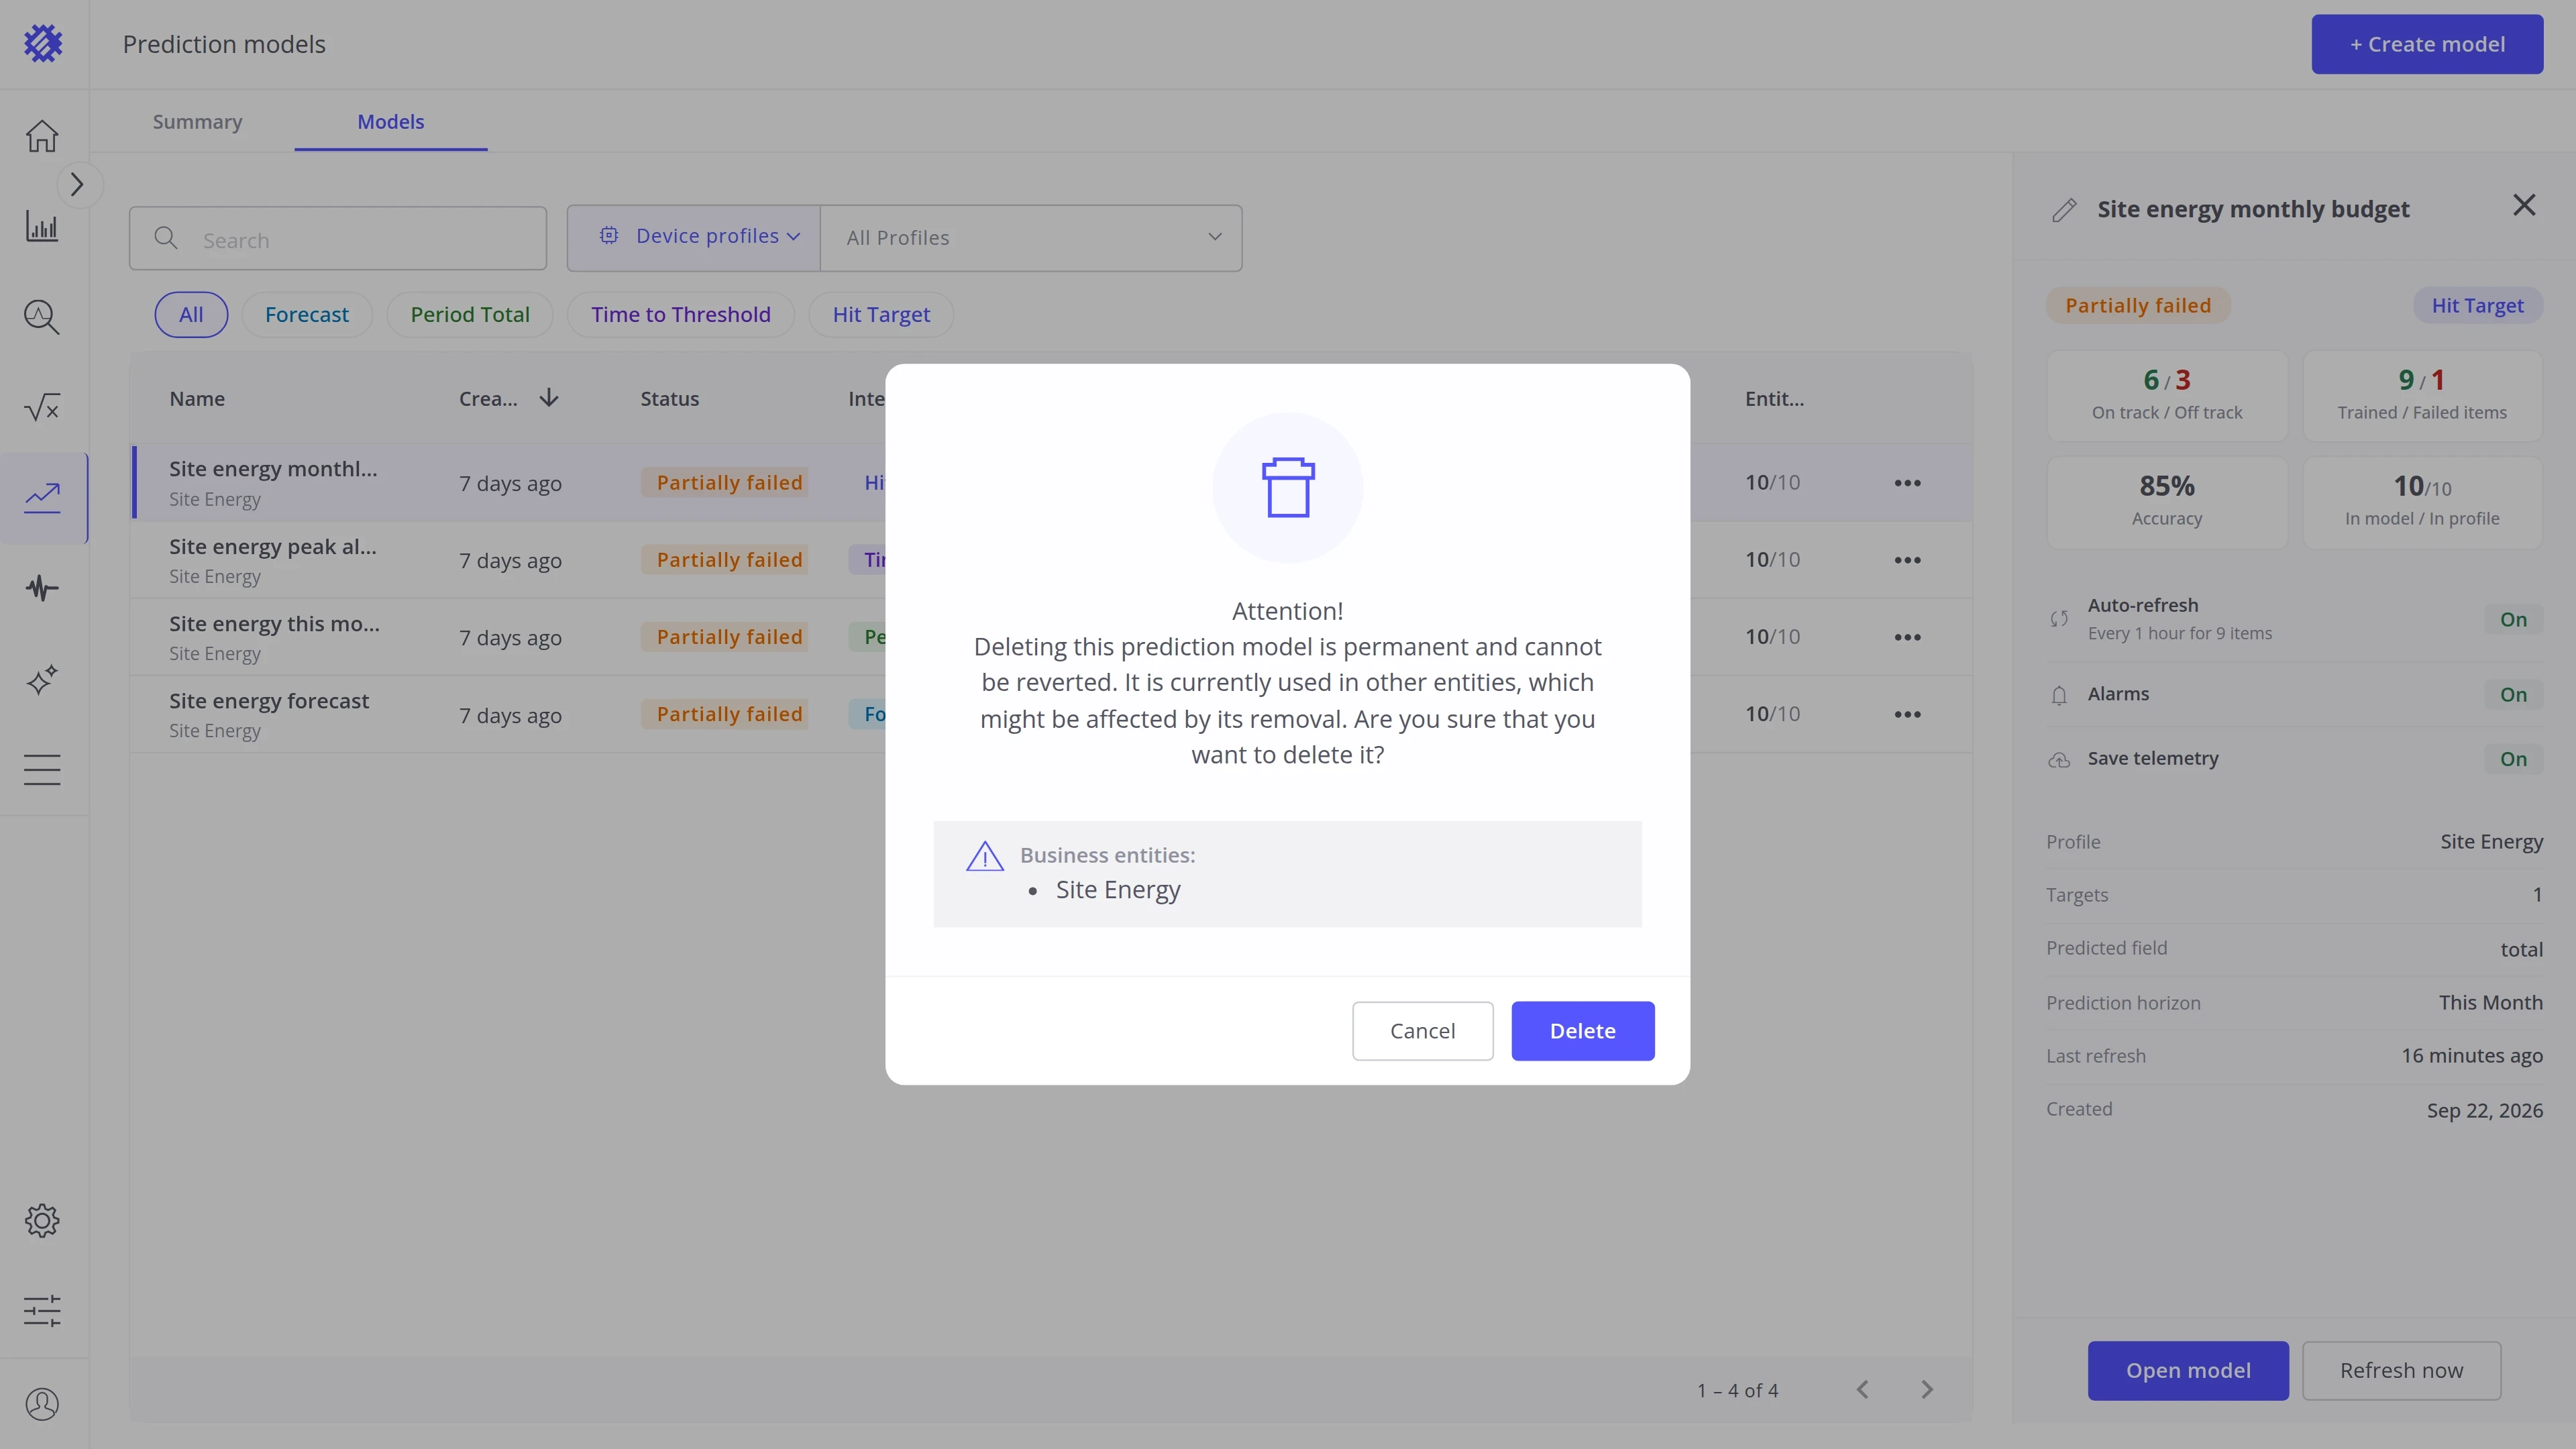
- Delete removes the model after a confirmation. The dialog names the business entities that use it.
Model detail panel
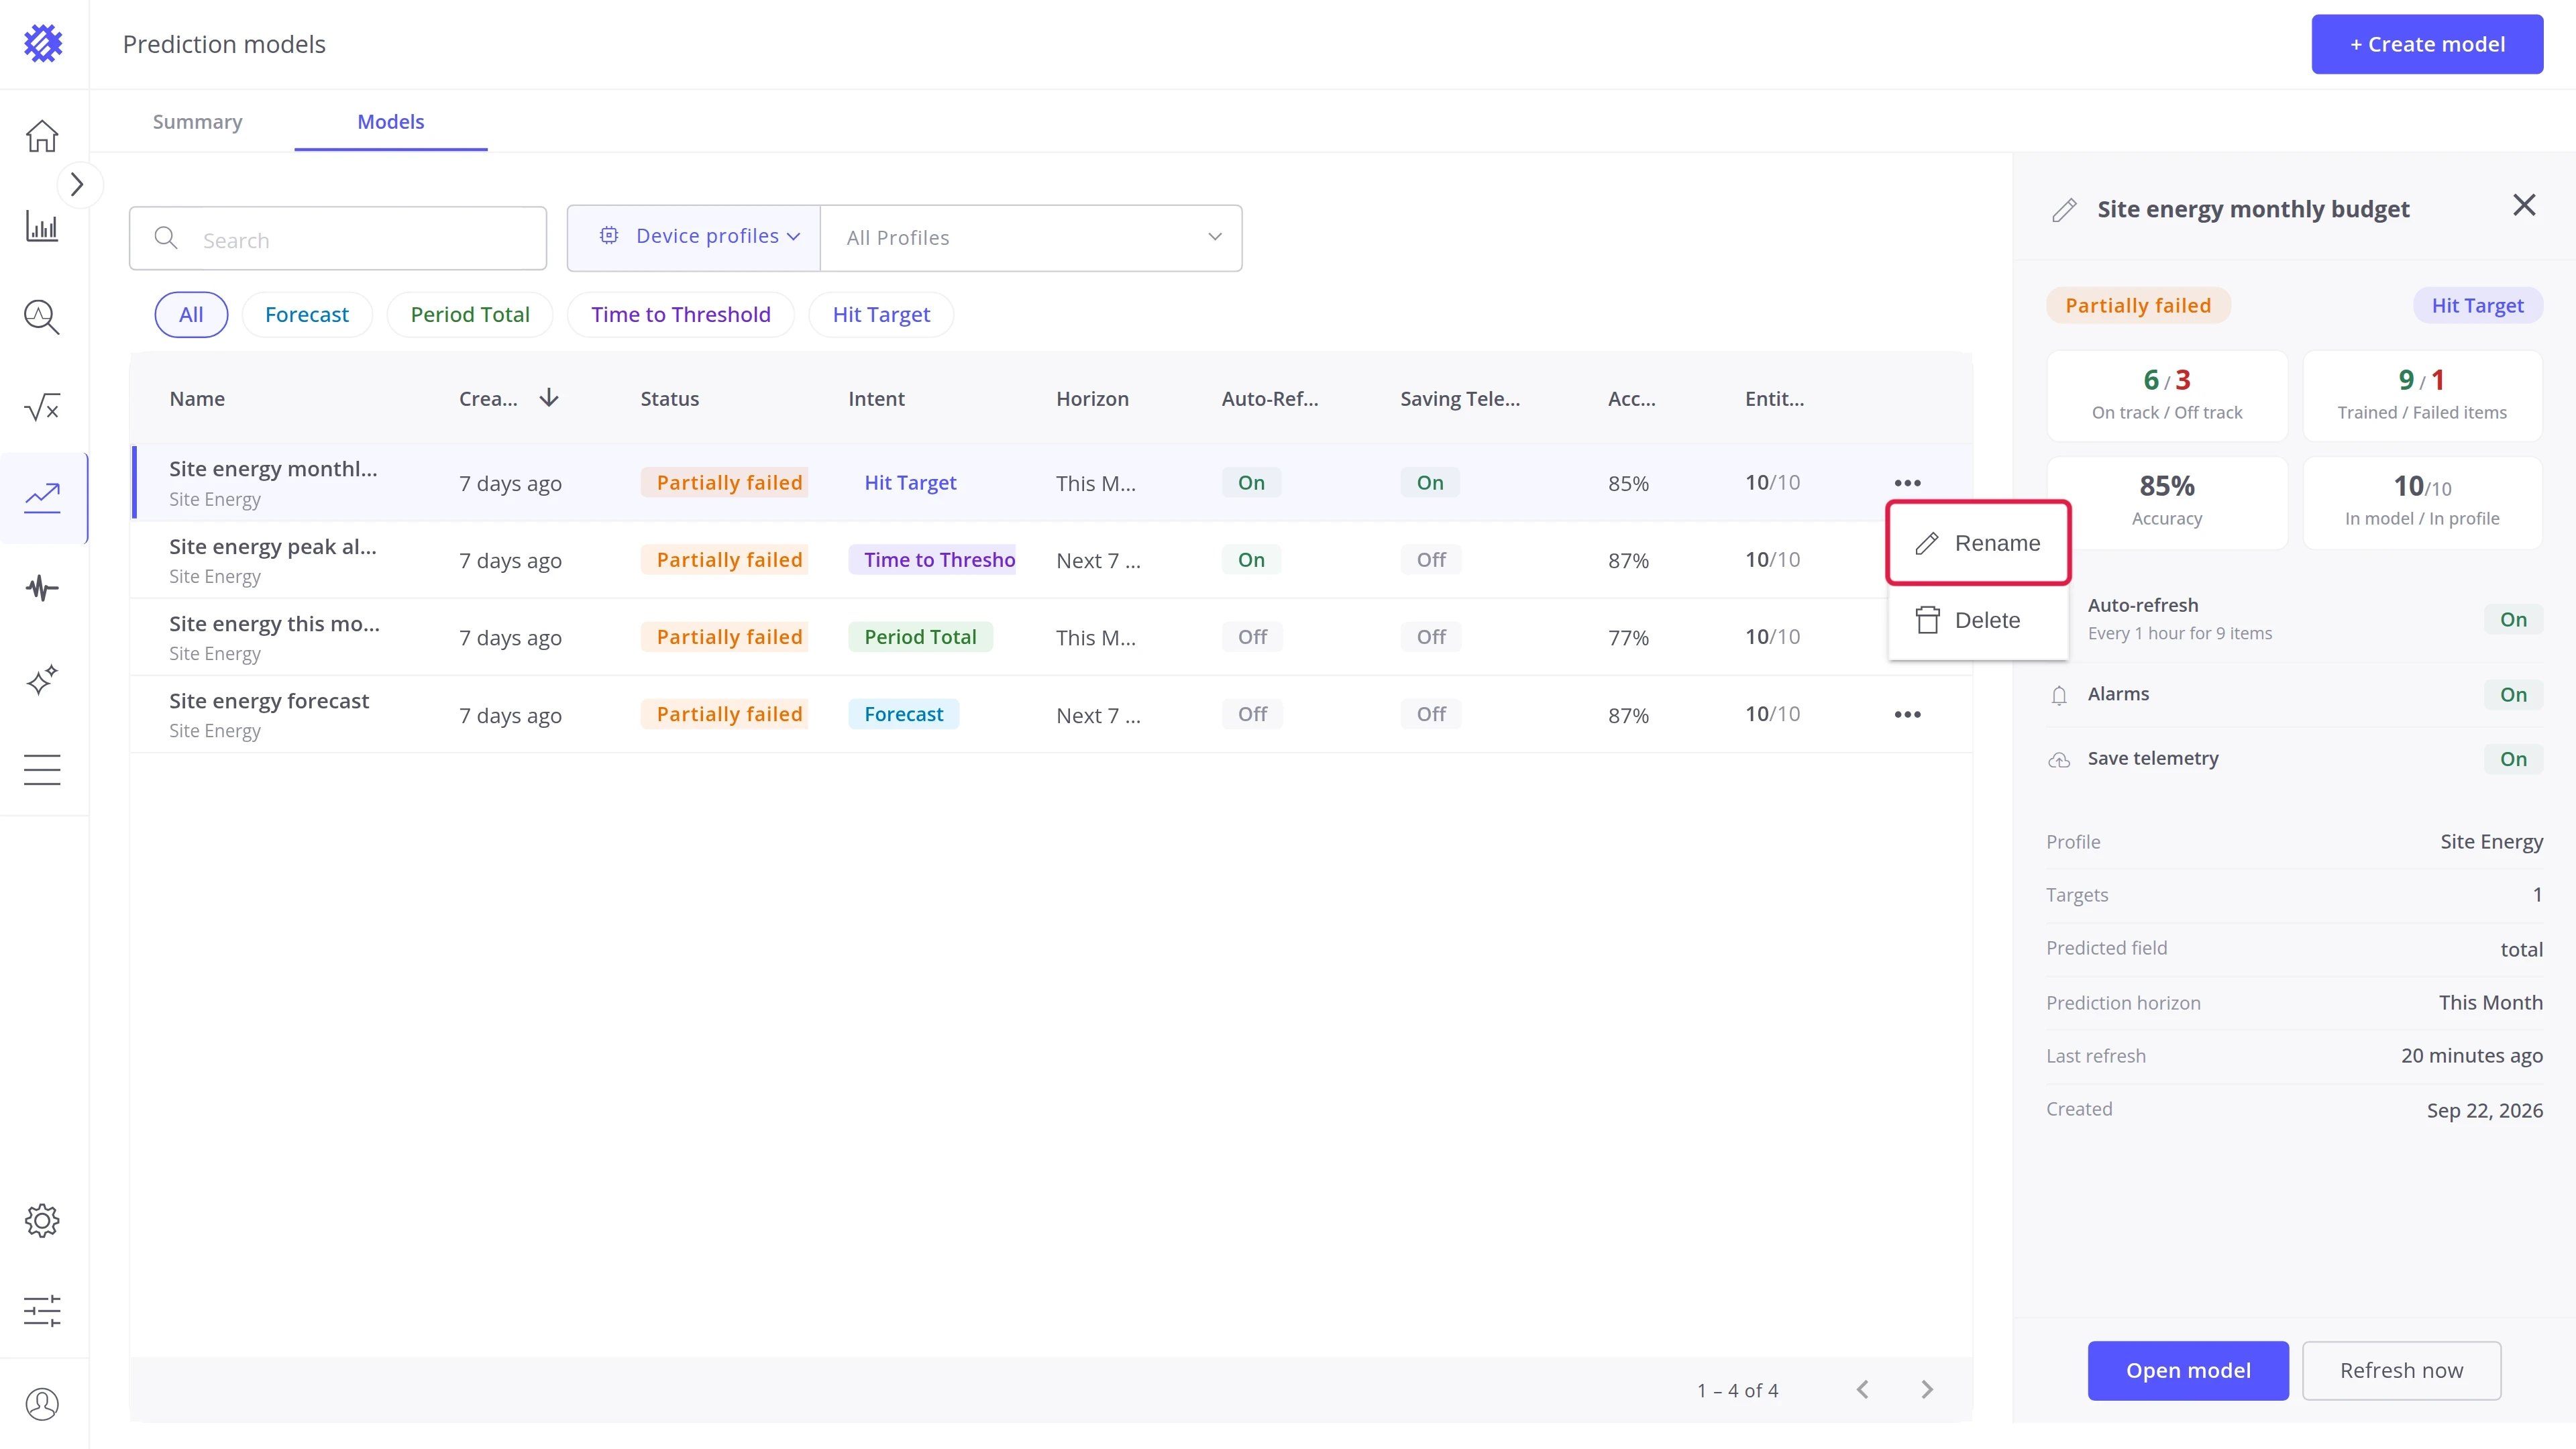
Section titled “Model detail panel”Click a model row to see it beside the table, without opening it.
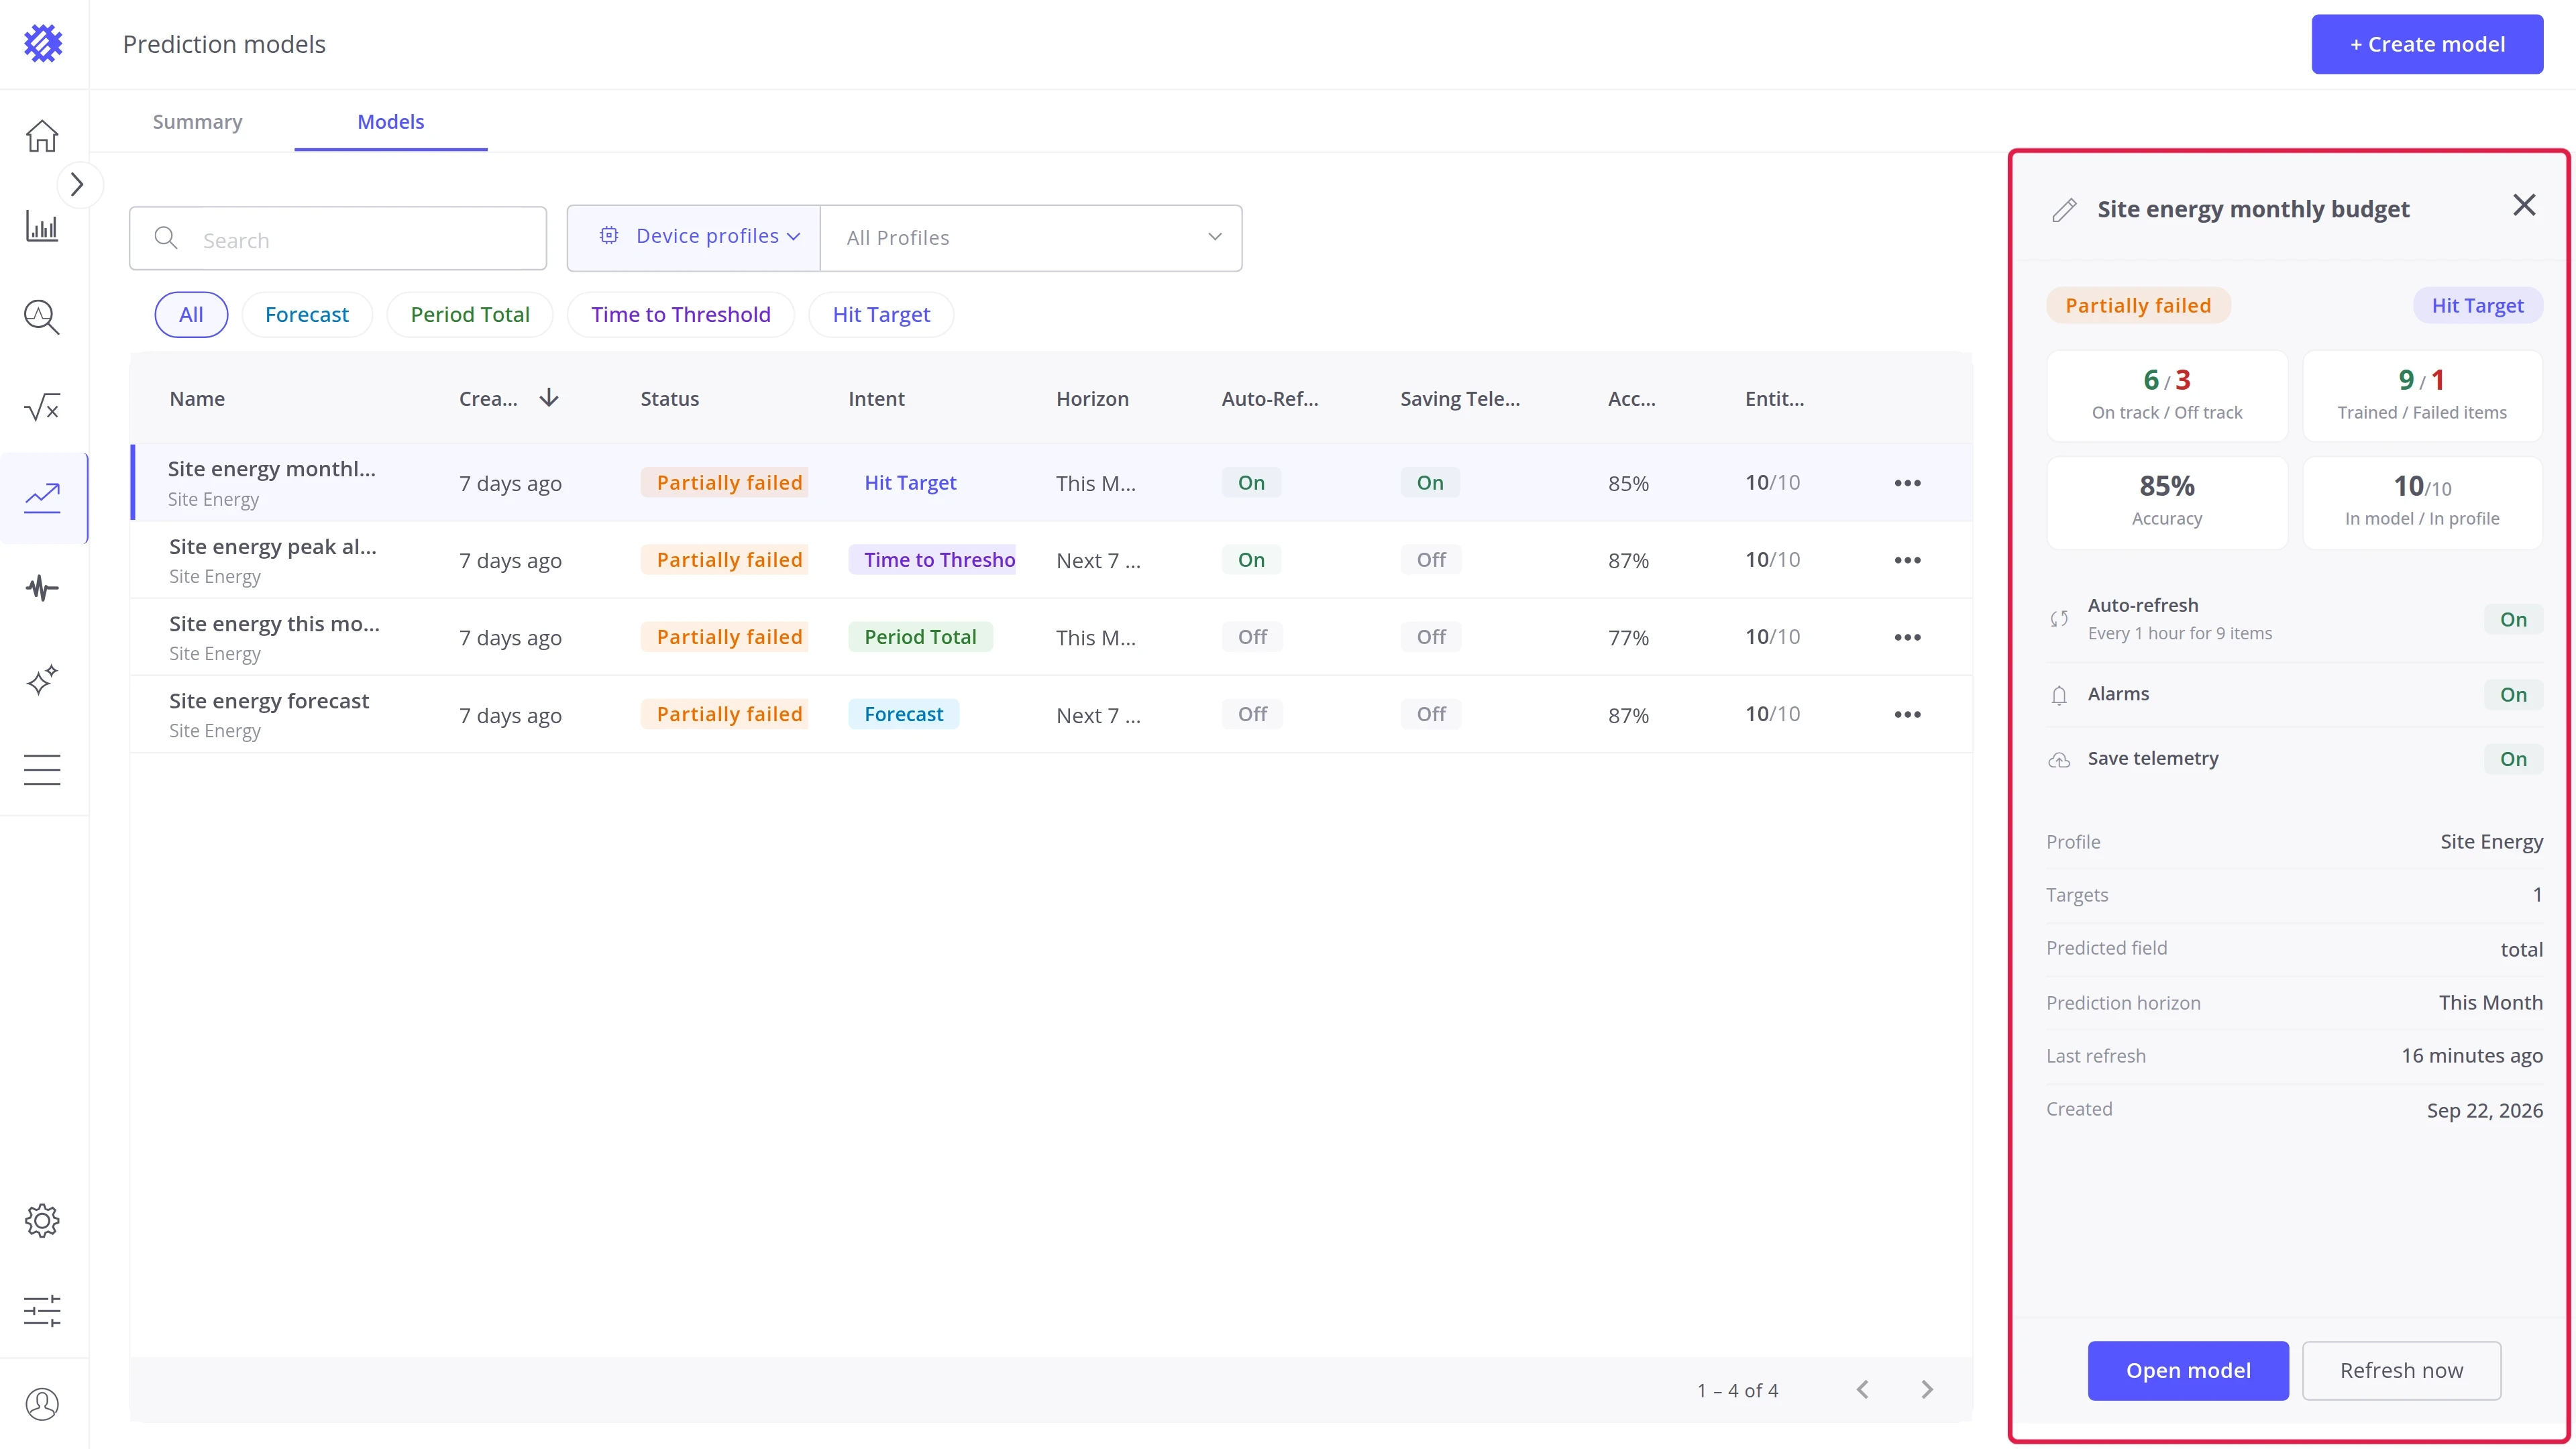
| Field | Description |
|---|---|
| Status and Intent | As in the table |
| Intent figure | Prediction horizon for Forecast, Period for Period Total, Current / Upcoming events for Time to Threshold, On track / Off track for Hit Target |
| Trained / Failed items | Items the model trained for, and items it failed on |
| Accuracy | The accuracy of the model |
| In model / In profile | Items in the model, out of all items of the profile |
| Auto-refresh | Whether the model refreshes on a schedule, how often, and for how many items |
| Alarms | Whether the model raises alarms. Time to Threshold and Hit Target only |
| Save telemetry | Whether the model writes its predictions to ThingsBoard |
| Profile, Predicted field, Prediction horizon | What the model predicts, and how far ahead |
| Rules or Targets | The number of event rules or targets. Time to Threshold and Hit Target only |
| Last refresh and Created | When the model last refreshed, and when it was created |
The panel has two actions.
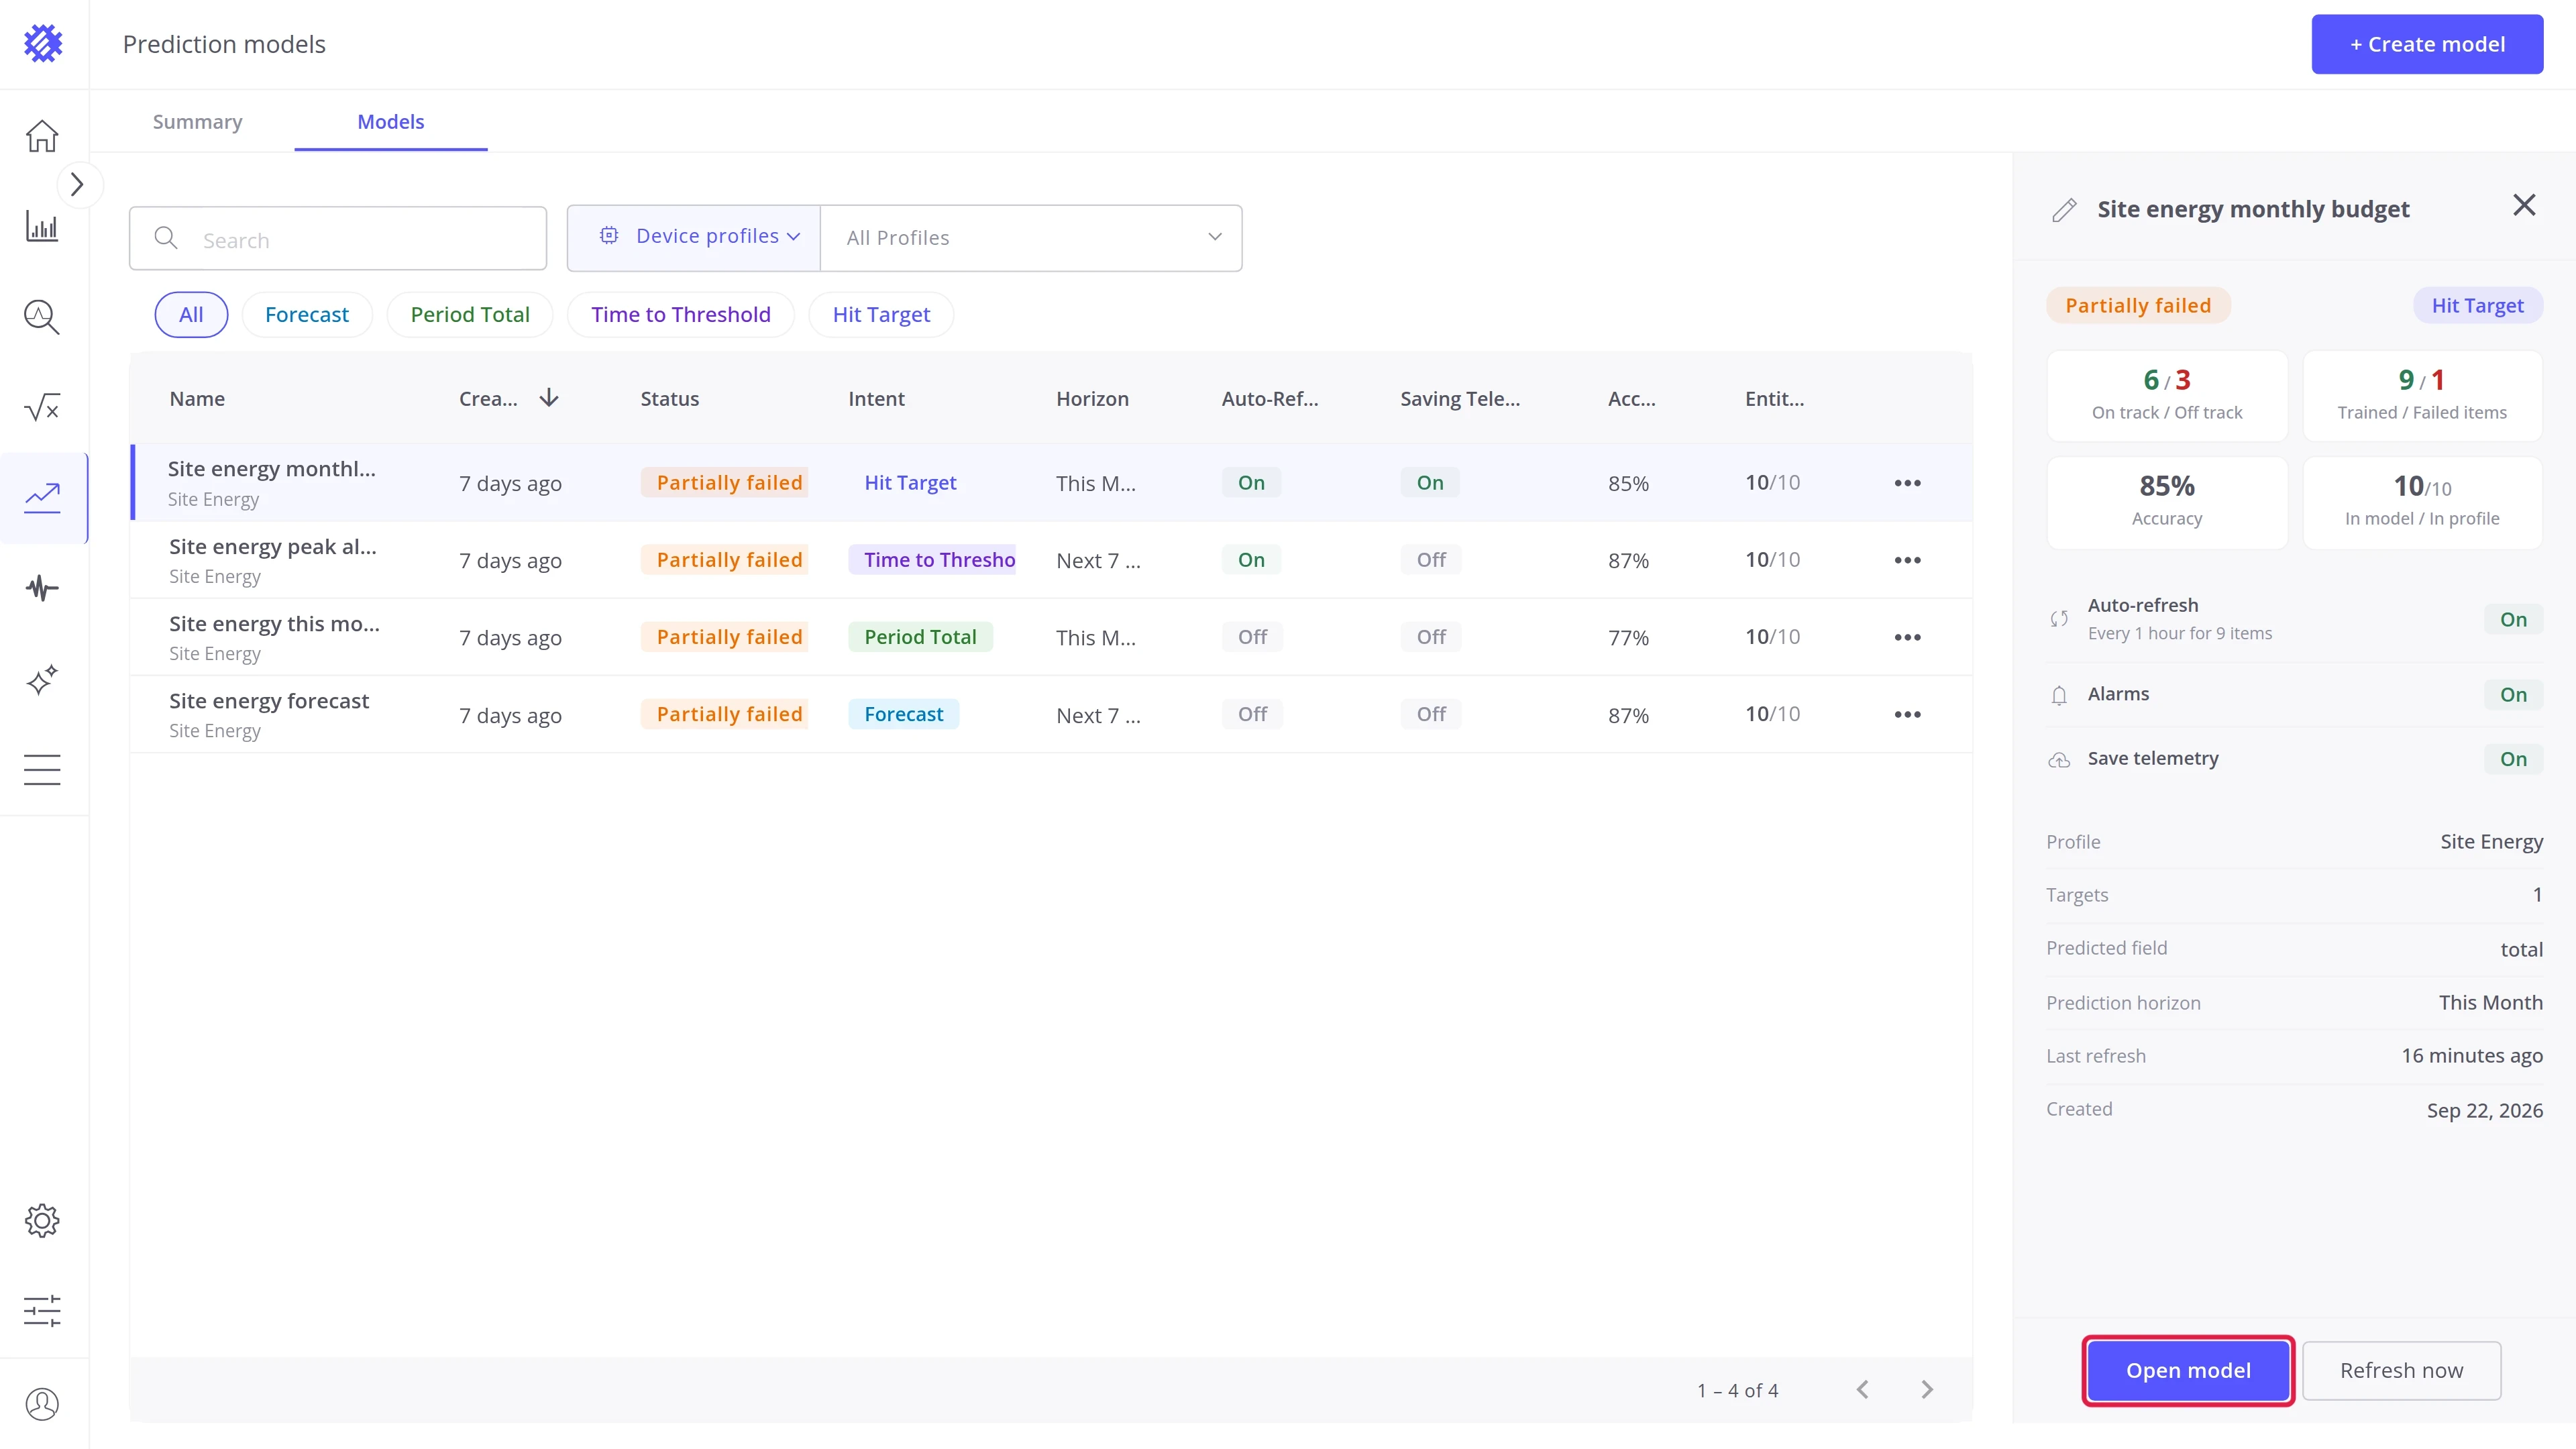
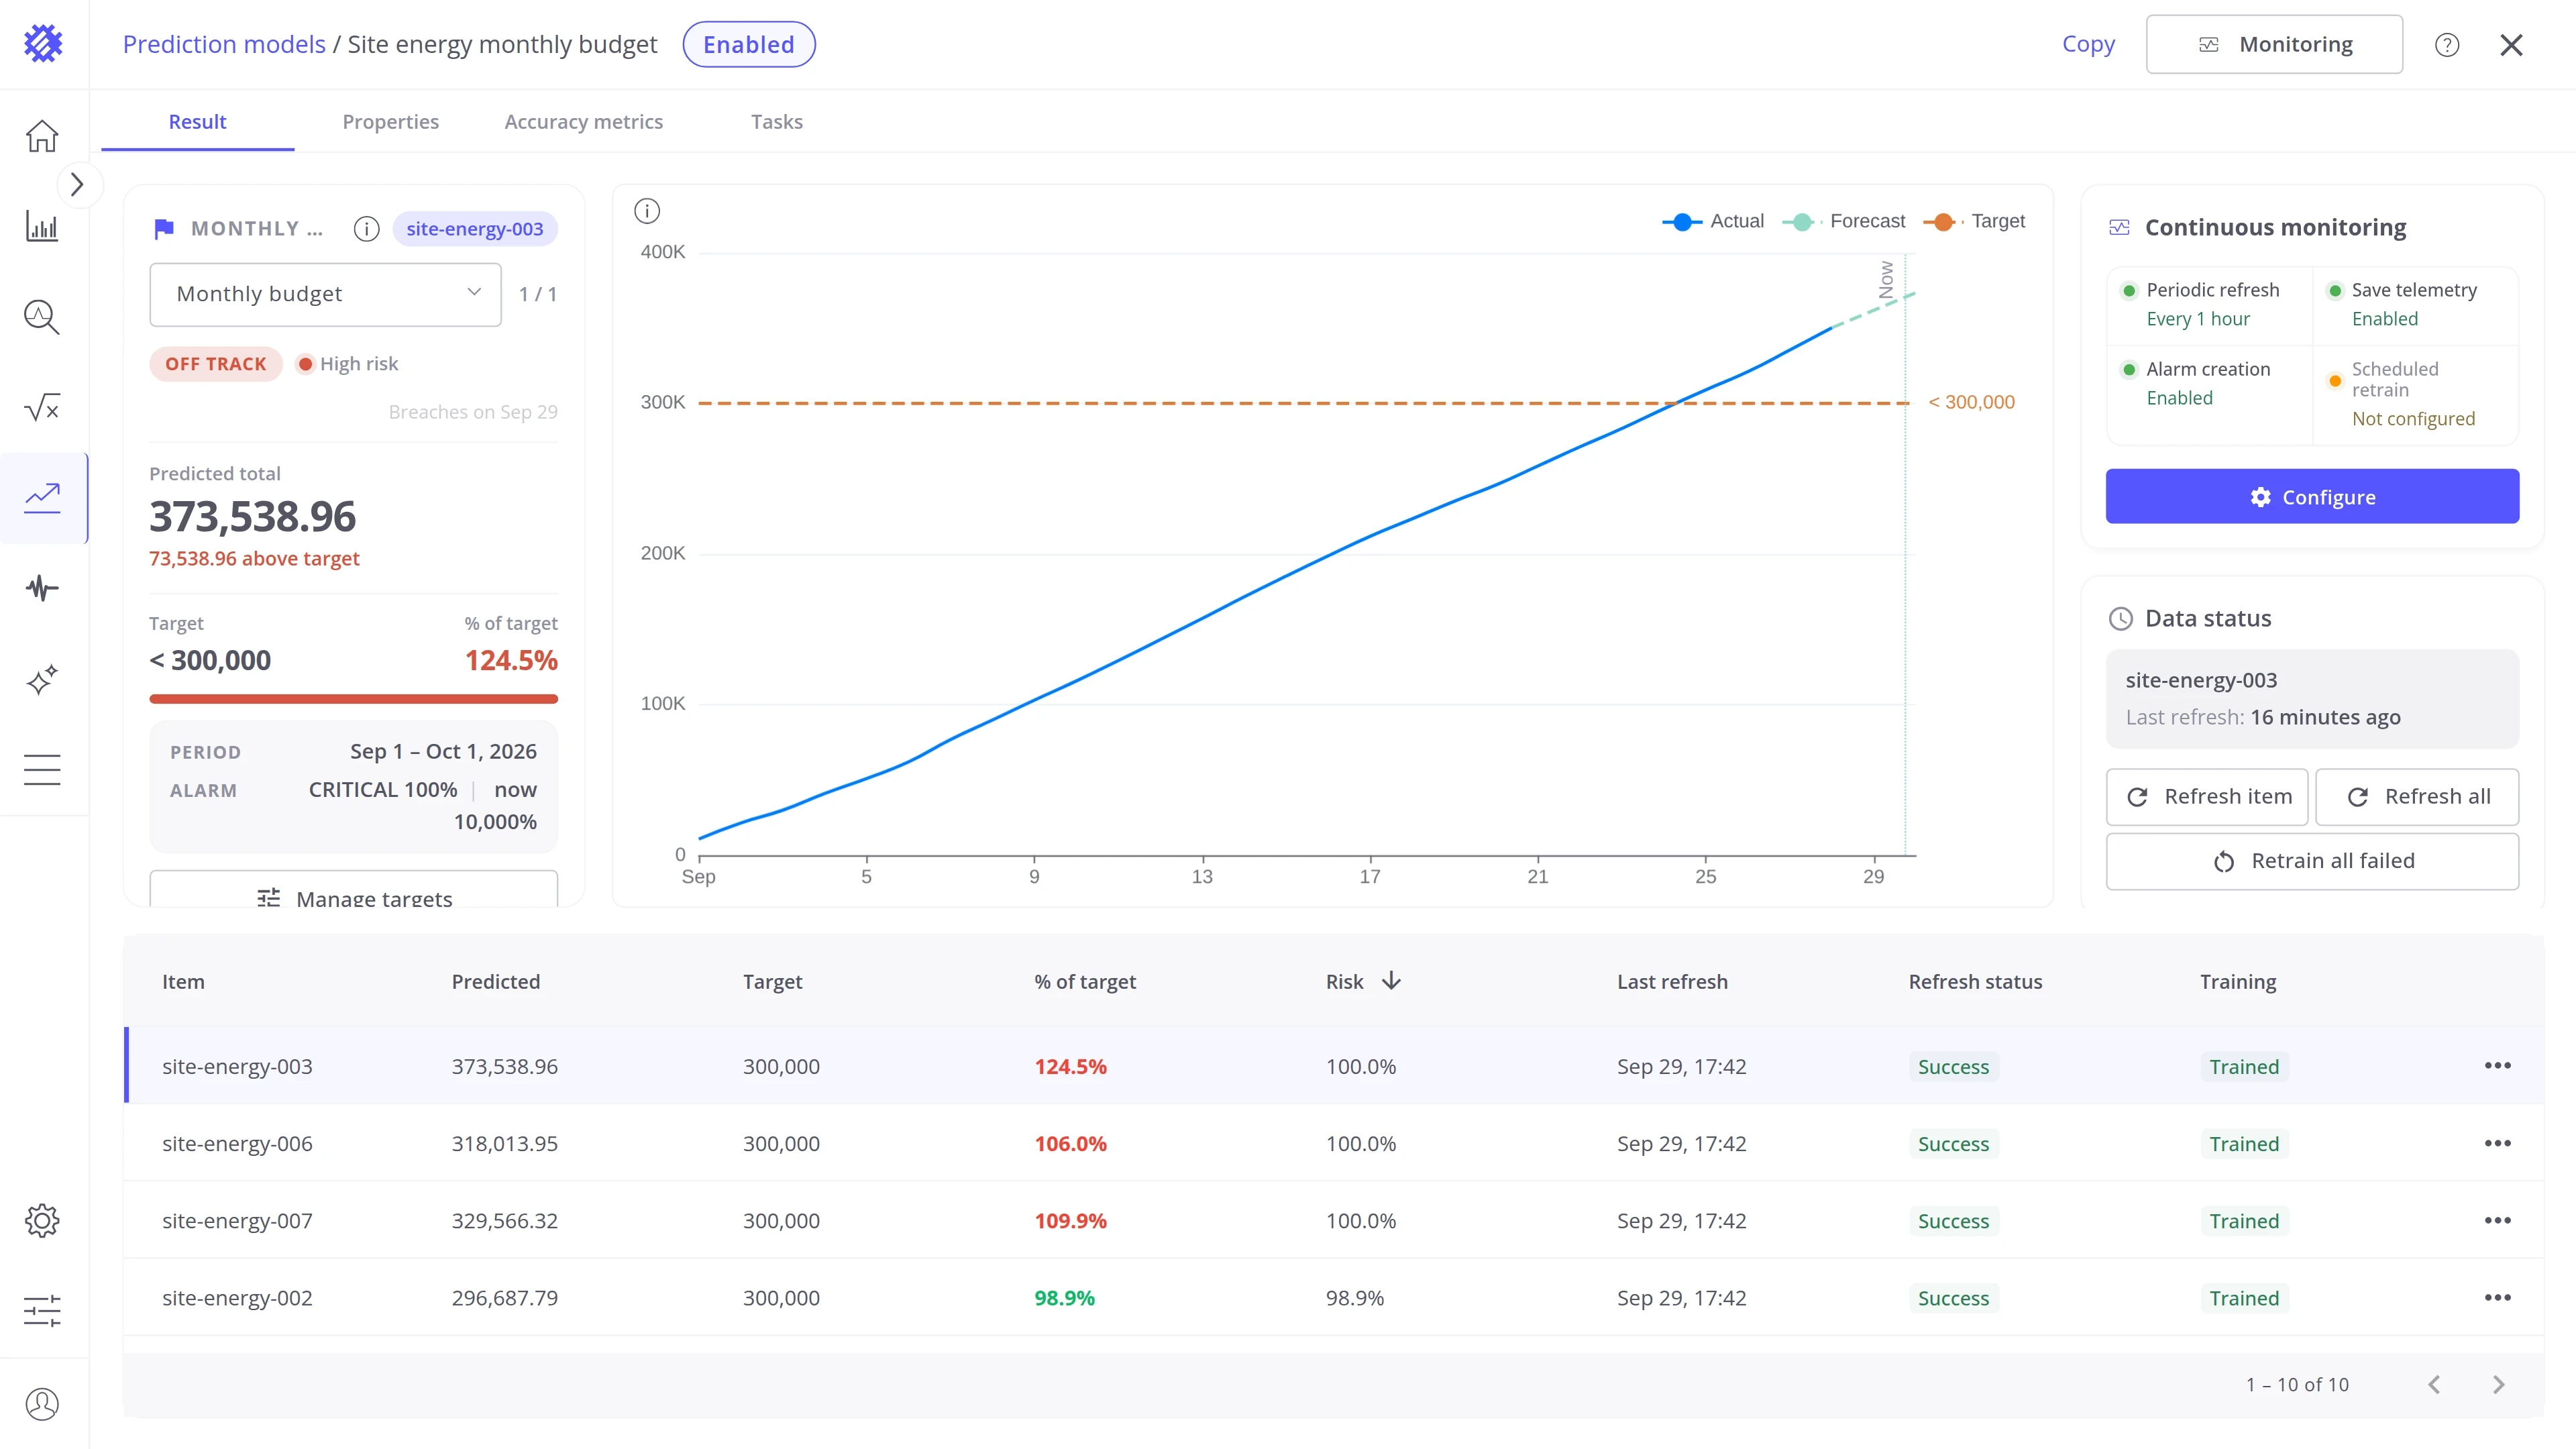
Open model opens the model page on its Result tab.
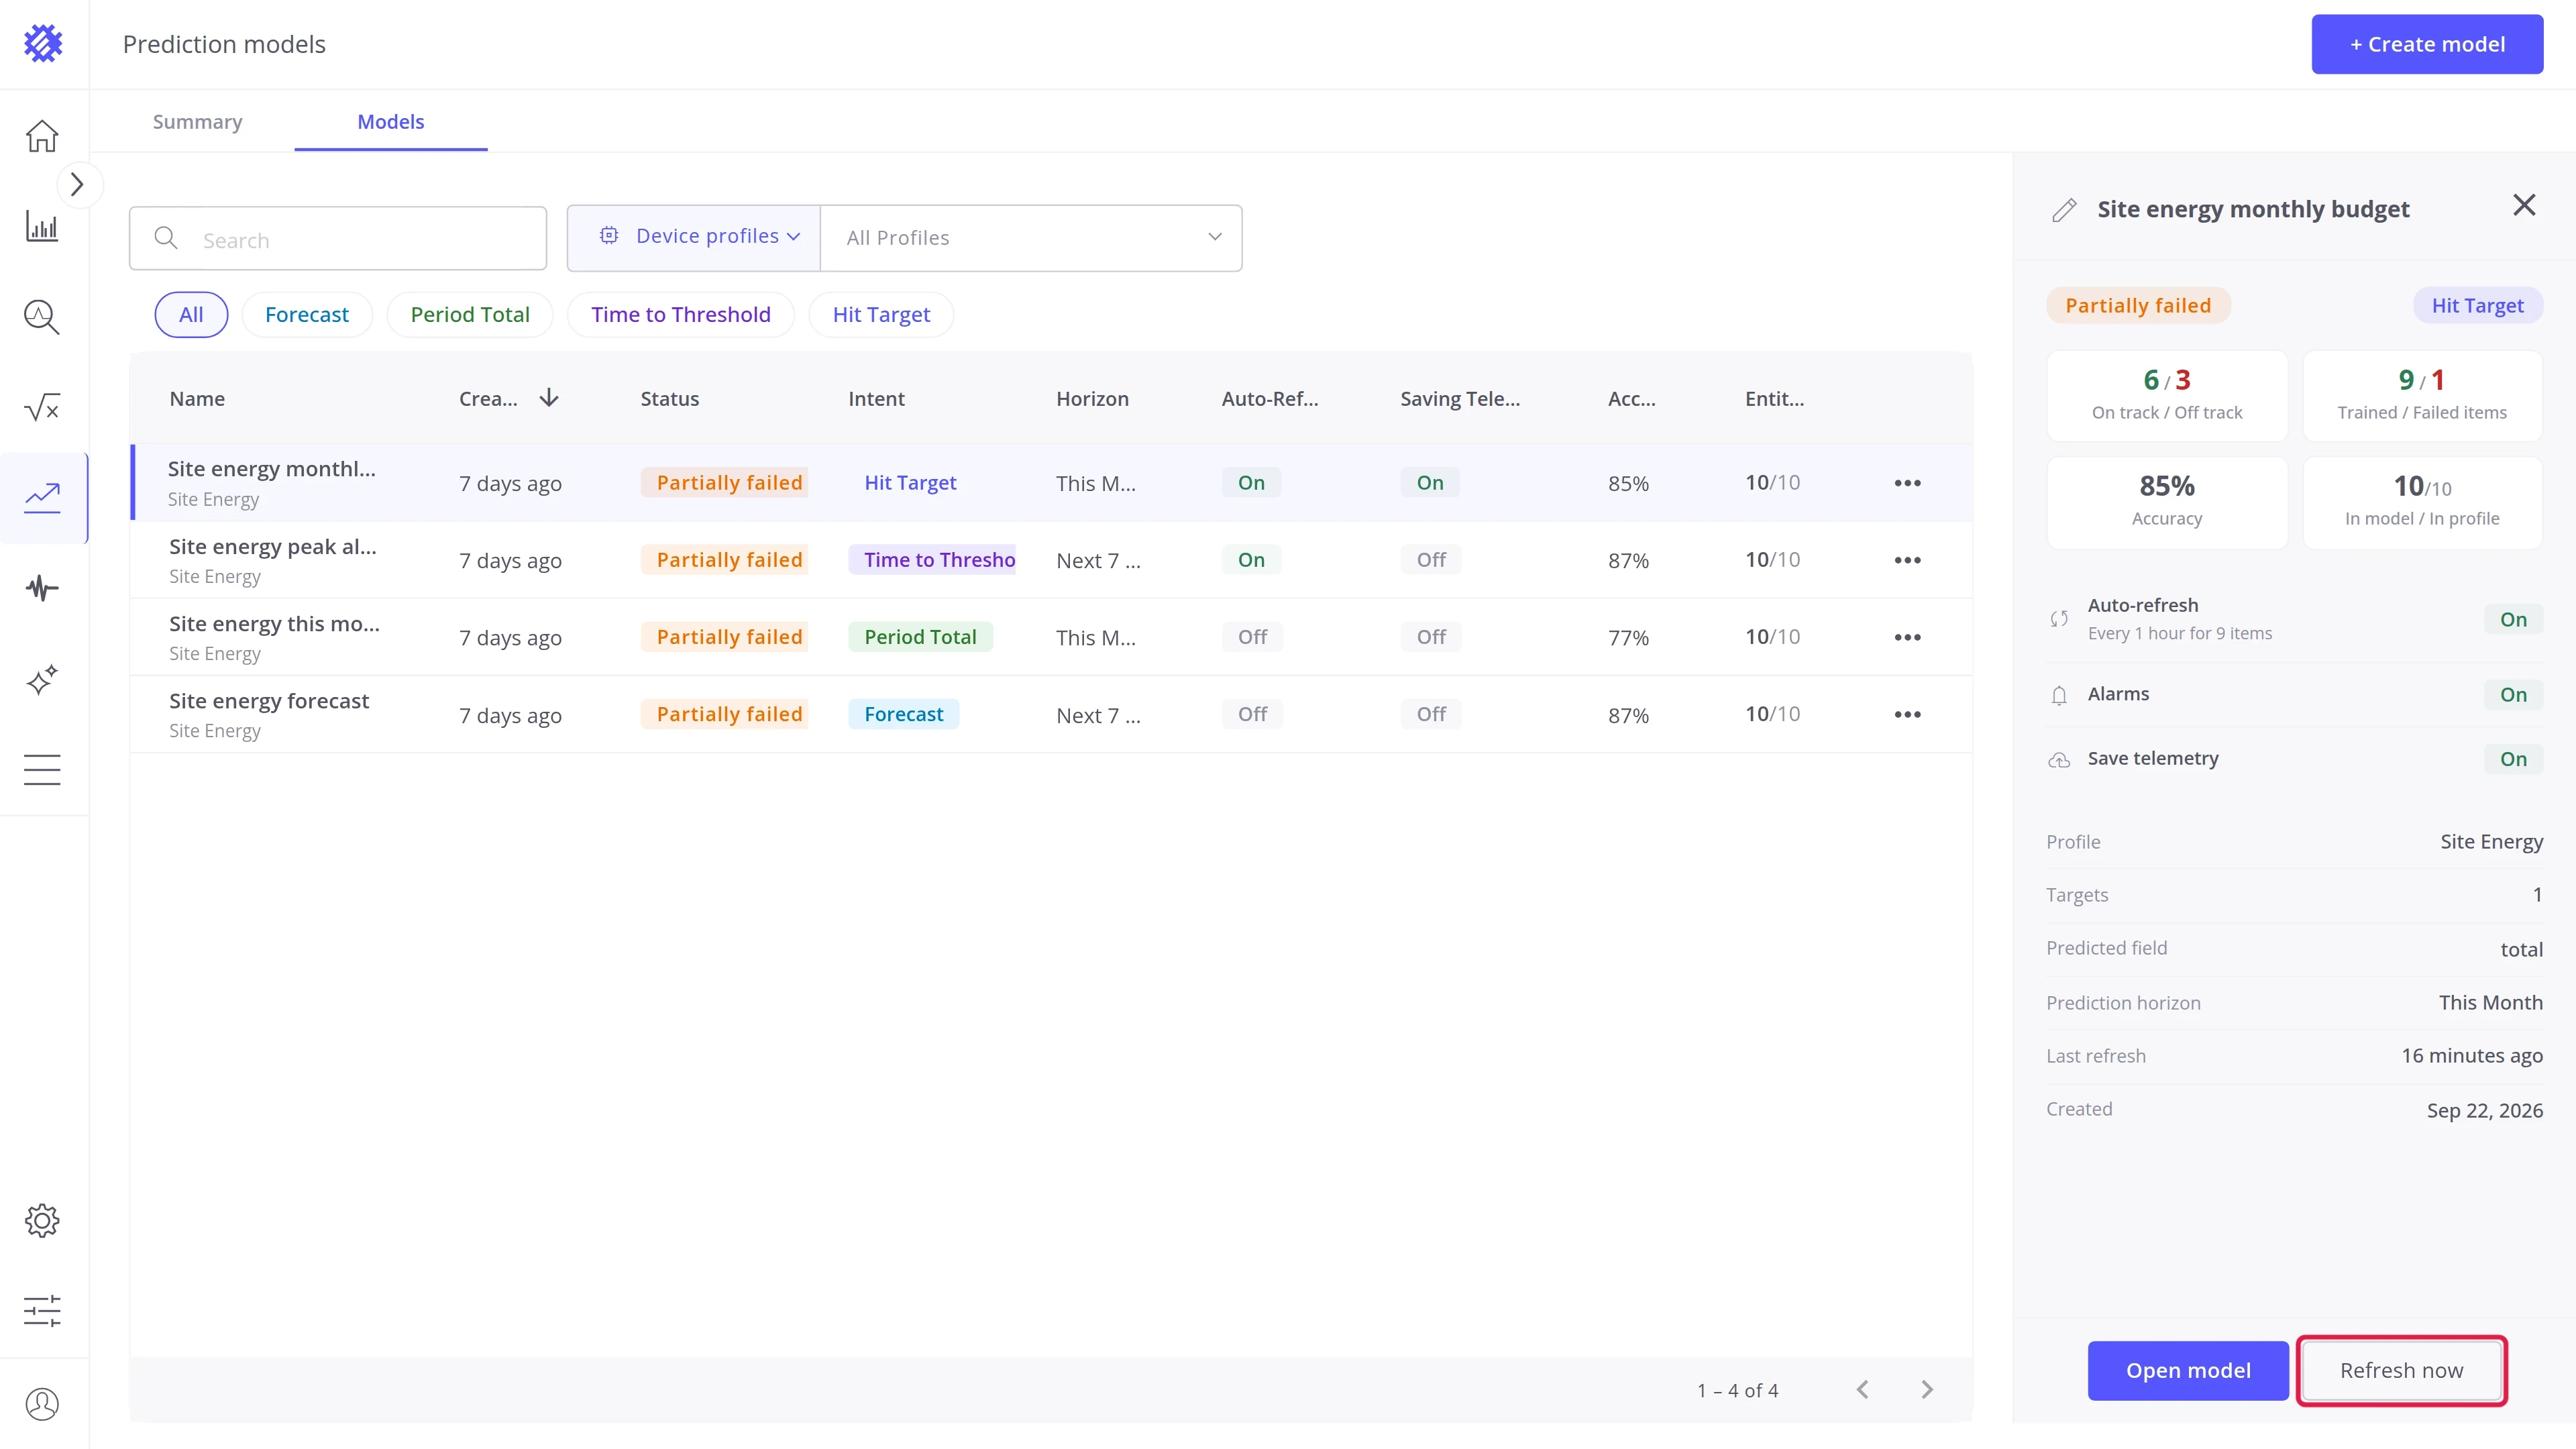
Refresh now refreshes the model at once, without waiting for its schedule. Last refresh reads Refreshing… until the run ends.
Model tabs
Section titled “Model tabs”The model page has up to five tabs. Click a tab name to switch to it.
- Result shows what the model predicts, in a layout that depends on its intent.
- Properties shows how the model is set up, and lets you change it.
- Events lists the predicted events. Time to Threshold models only.
- Accuracy metrics shows how close past forecasts came to what really happened.
- Tasks shows the training and refresh runs of the model.
The first four are described in detail on their own pages, linked below. Tasks is described here.
Result tab
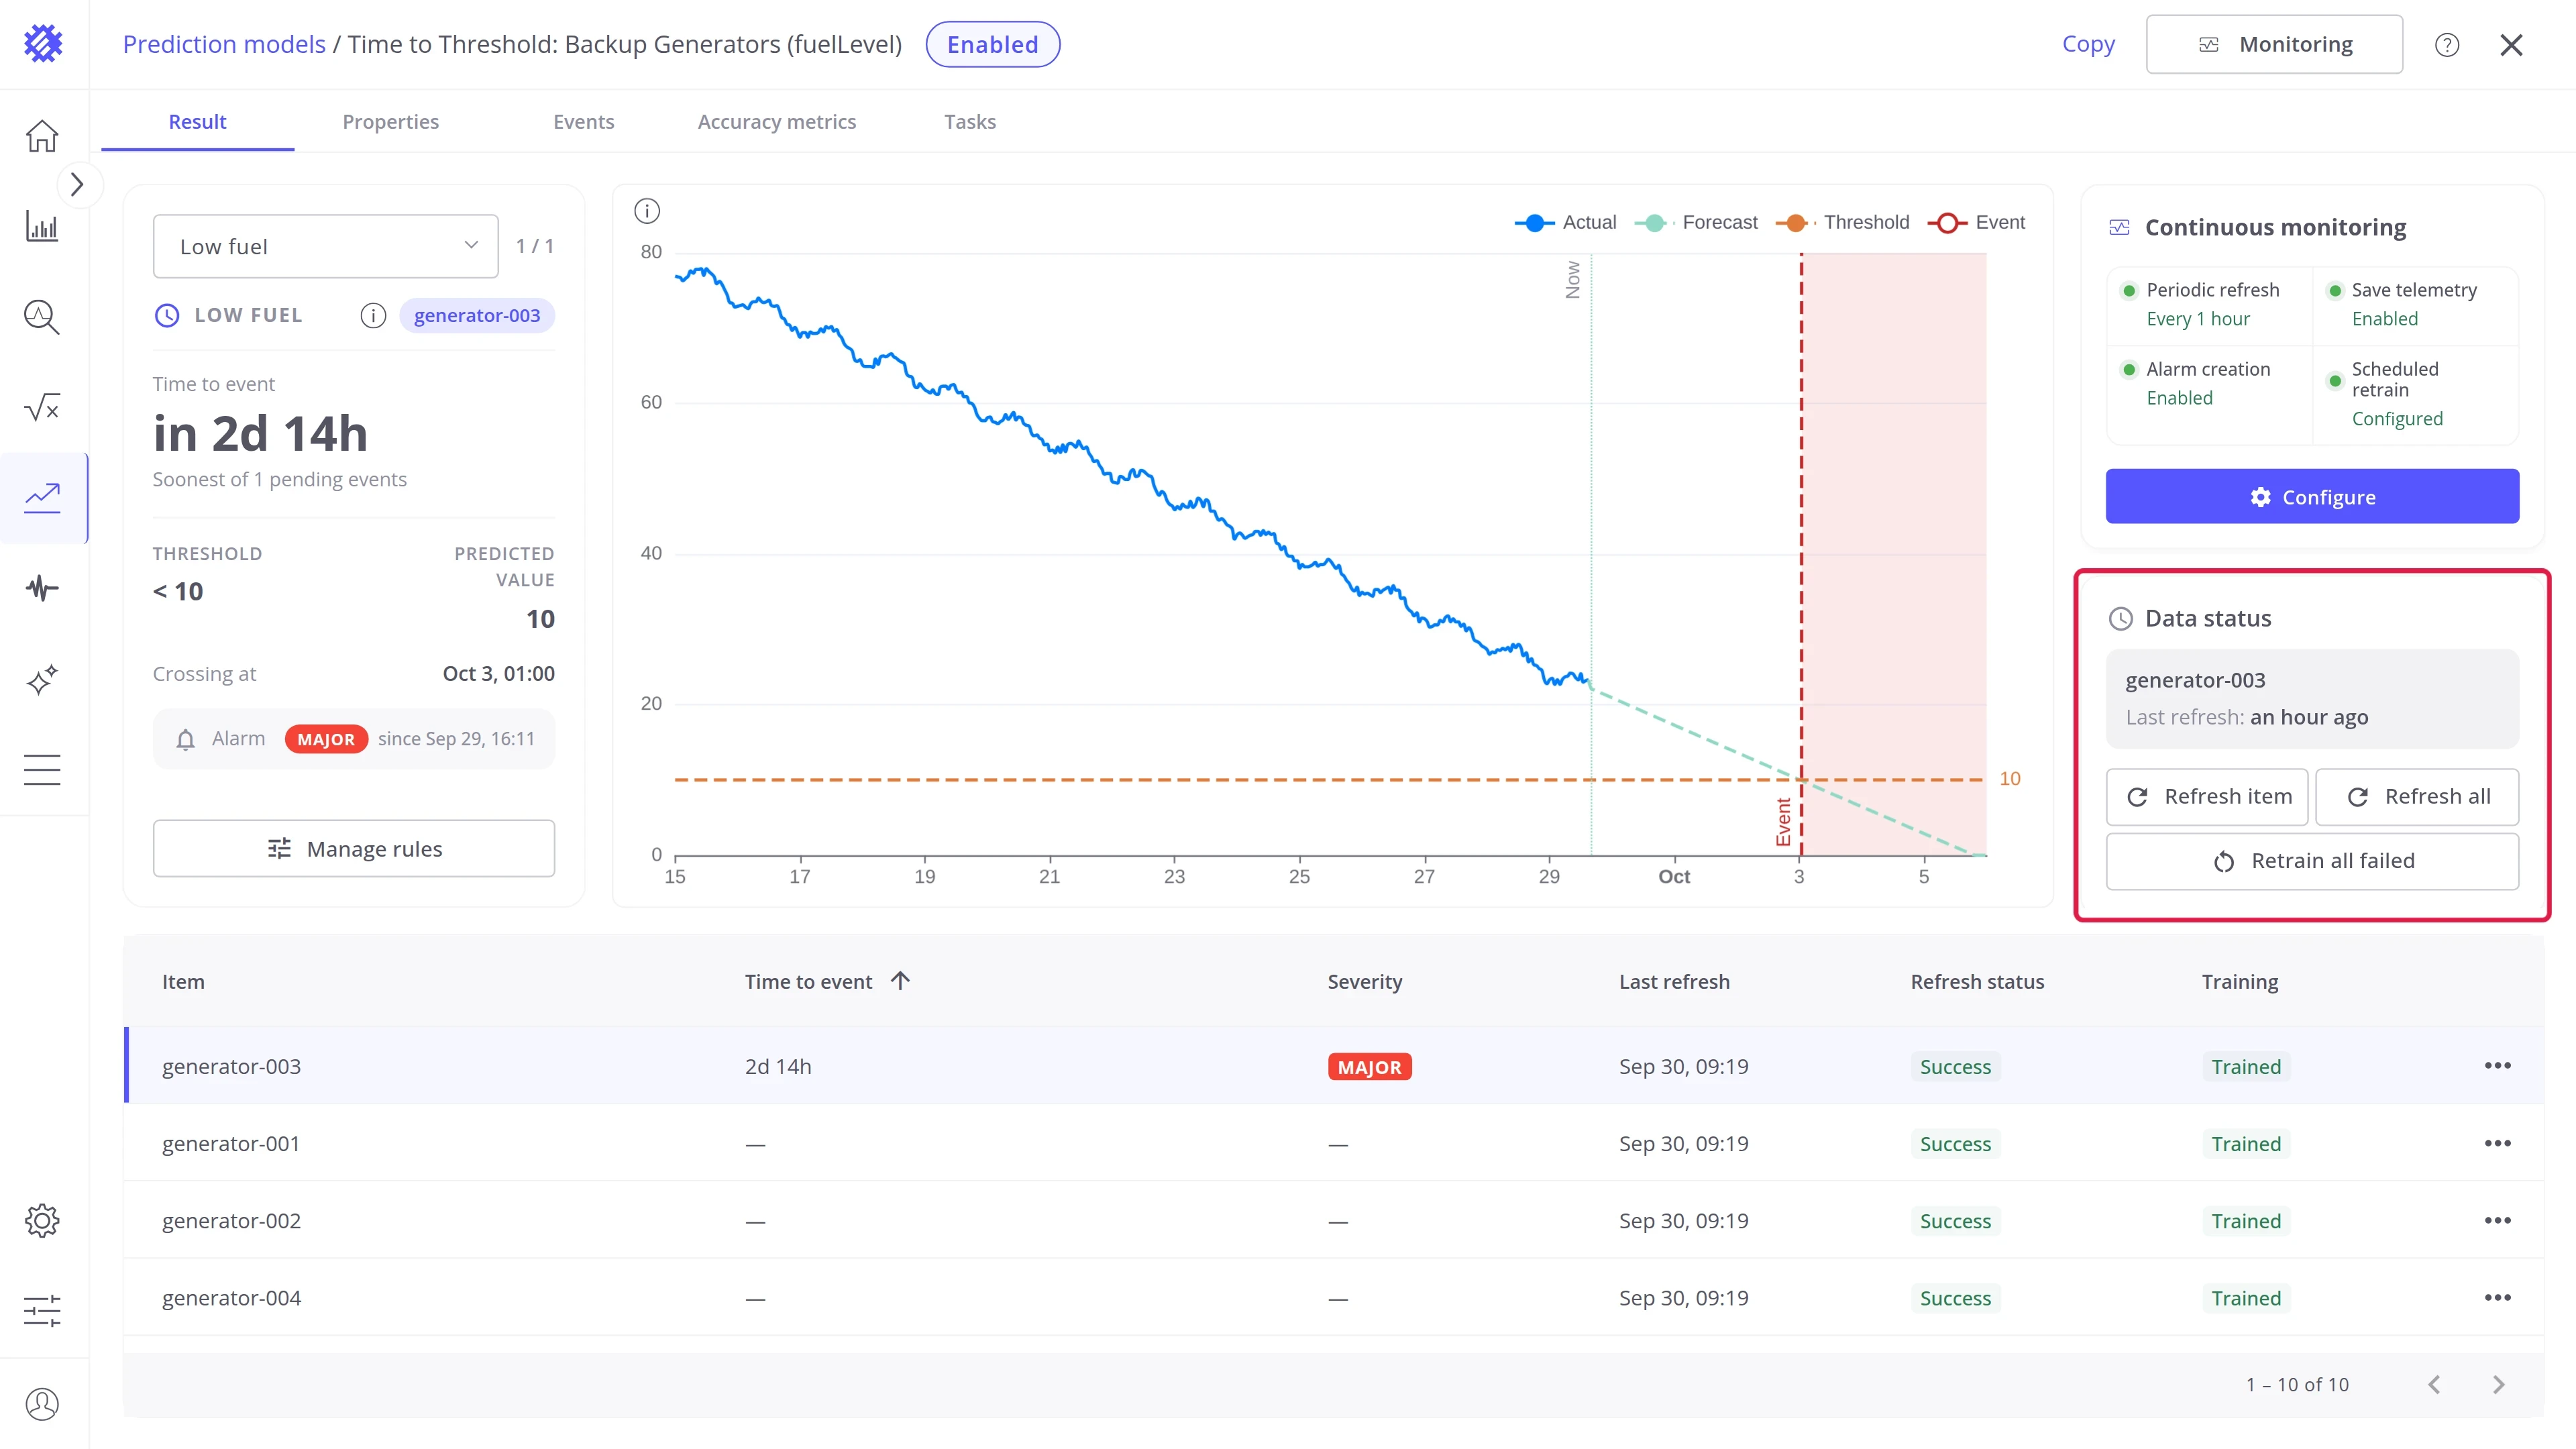
Section titled “Result tab”The predictions of every item. The chart shows the selected item, and the table lists all items.
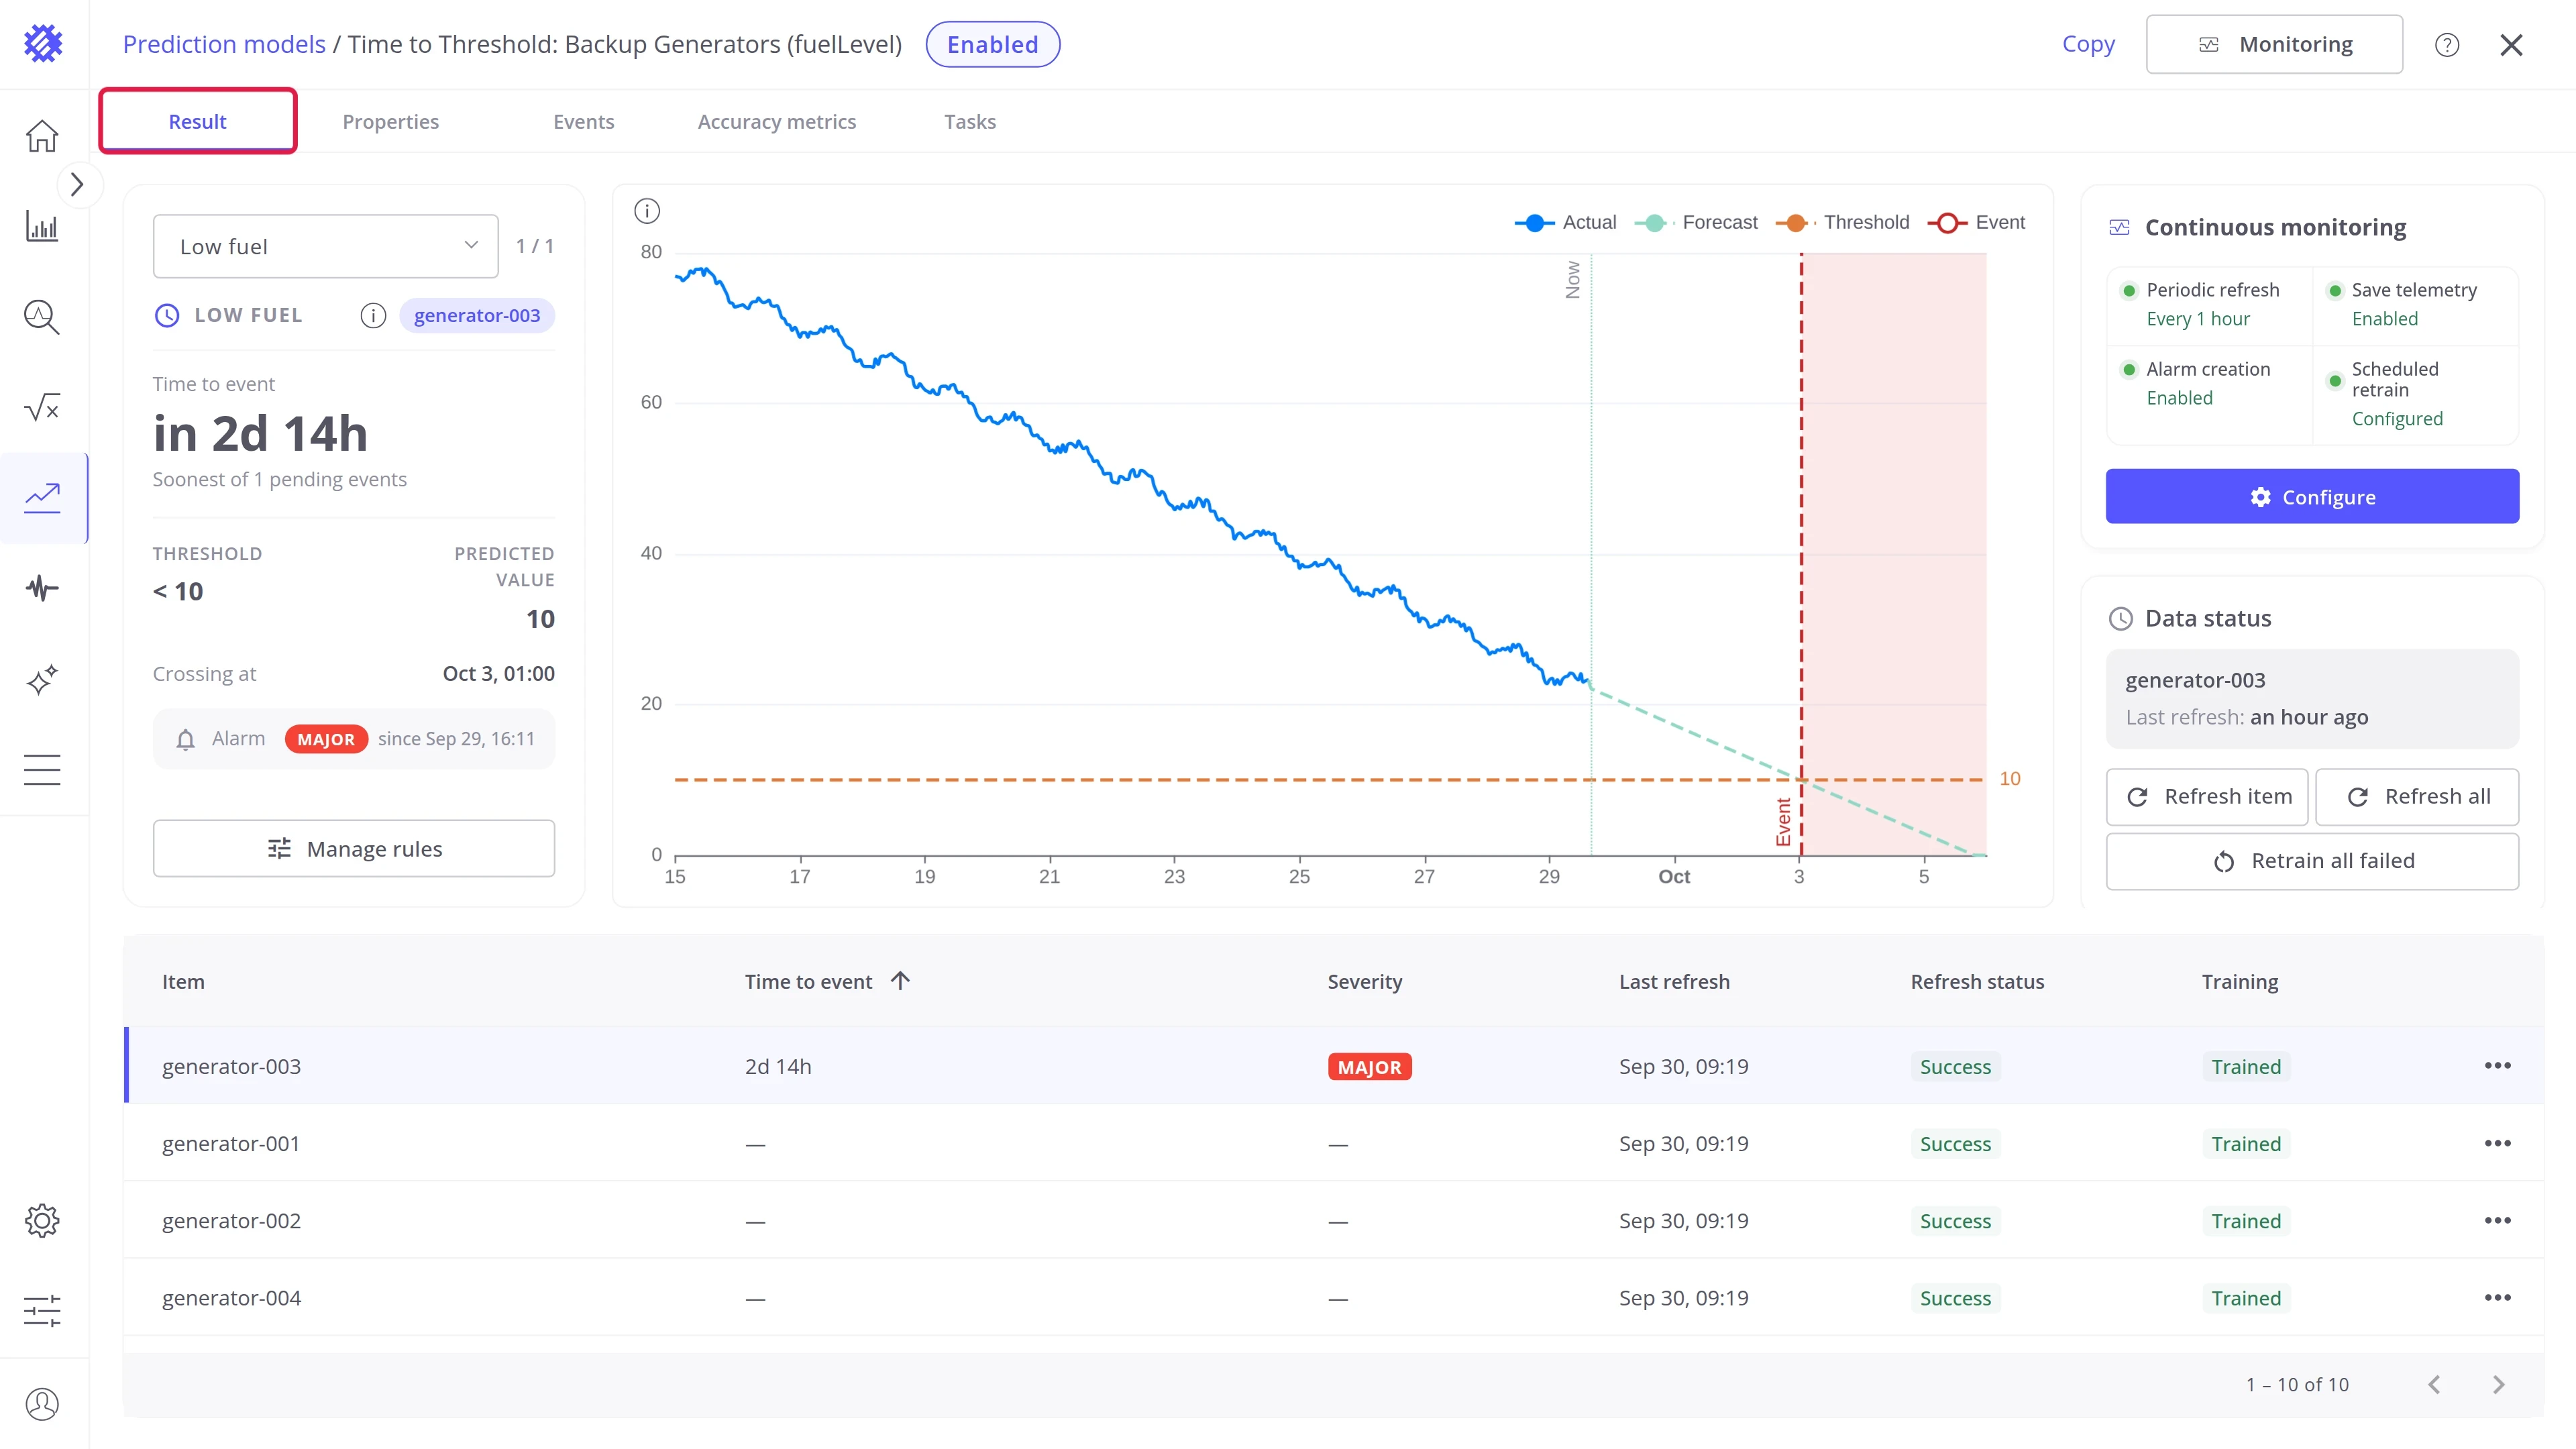
Its layout depends on the intent, and each one is described on its intent page:
| Intent | Result tab shows | Described in |
|---|---|---|
| Forecast | The predicted values over the horizon | Forecast |
| Period Total | The predicted total of the current period | Period Total |
| Time to Threshold | The time left until the value crosses a limit | Time to Threshold |
| Hit Target | Whether each item reaches its goal by the end of the period | Hit Target |
Two parts are the same for every intent: the item actions, and the Data status card.
Item actions
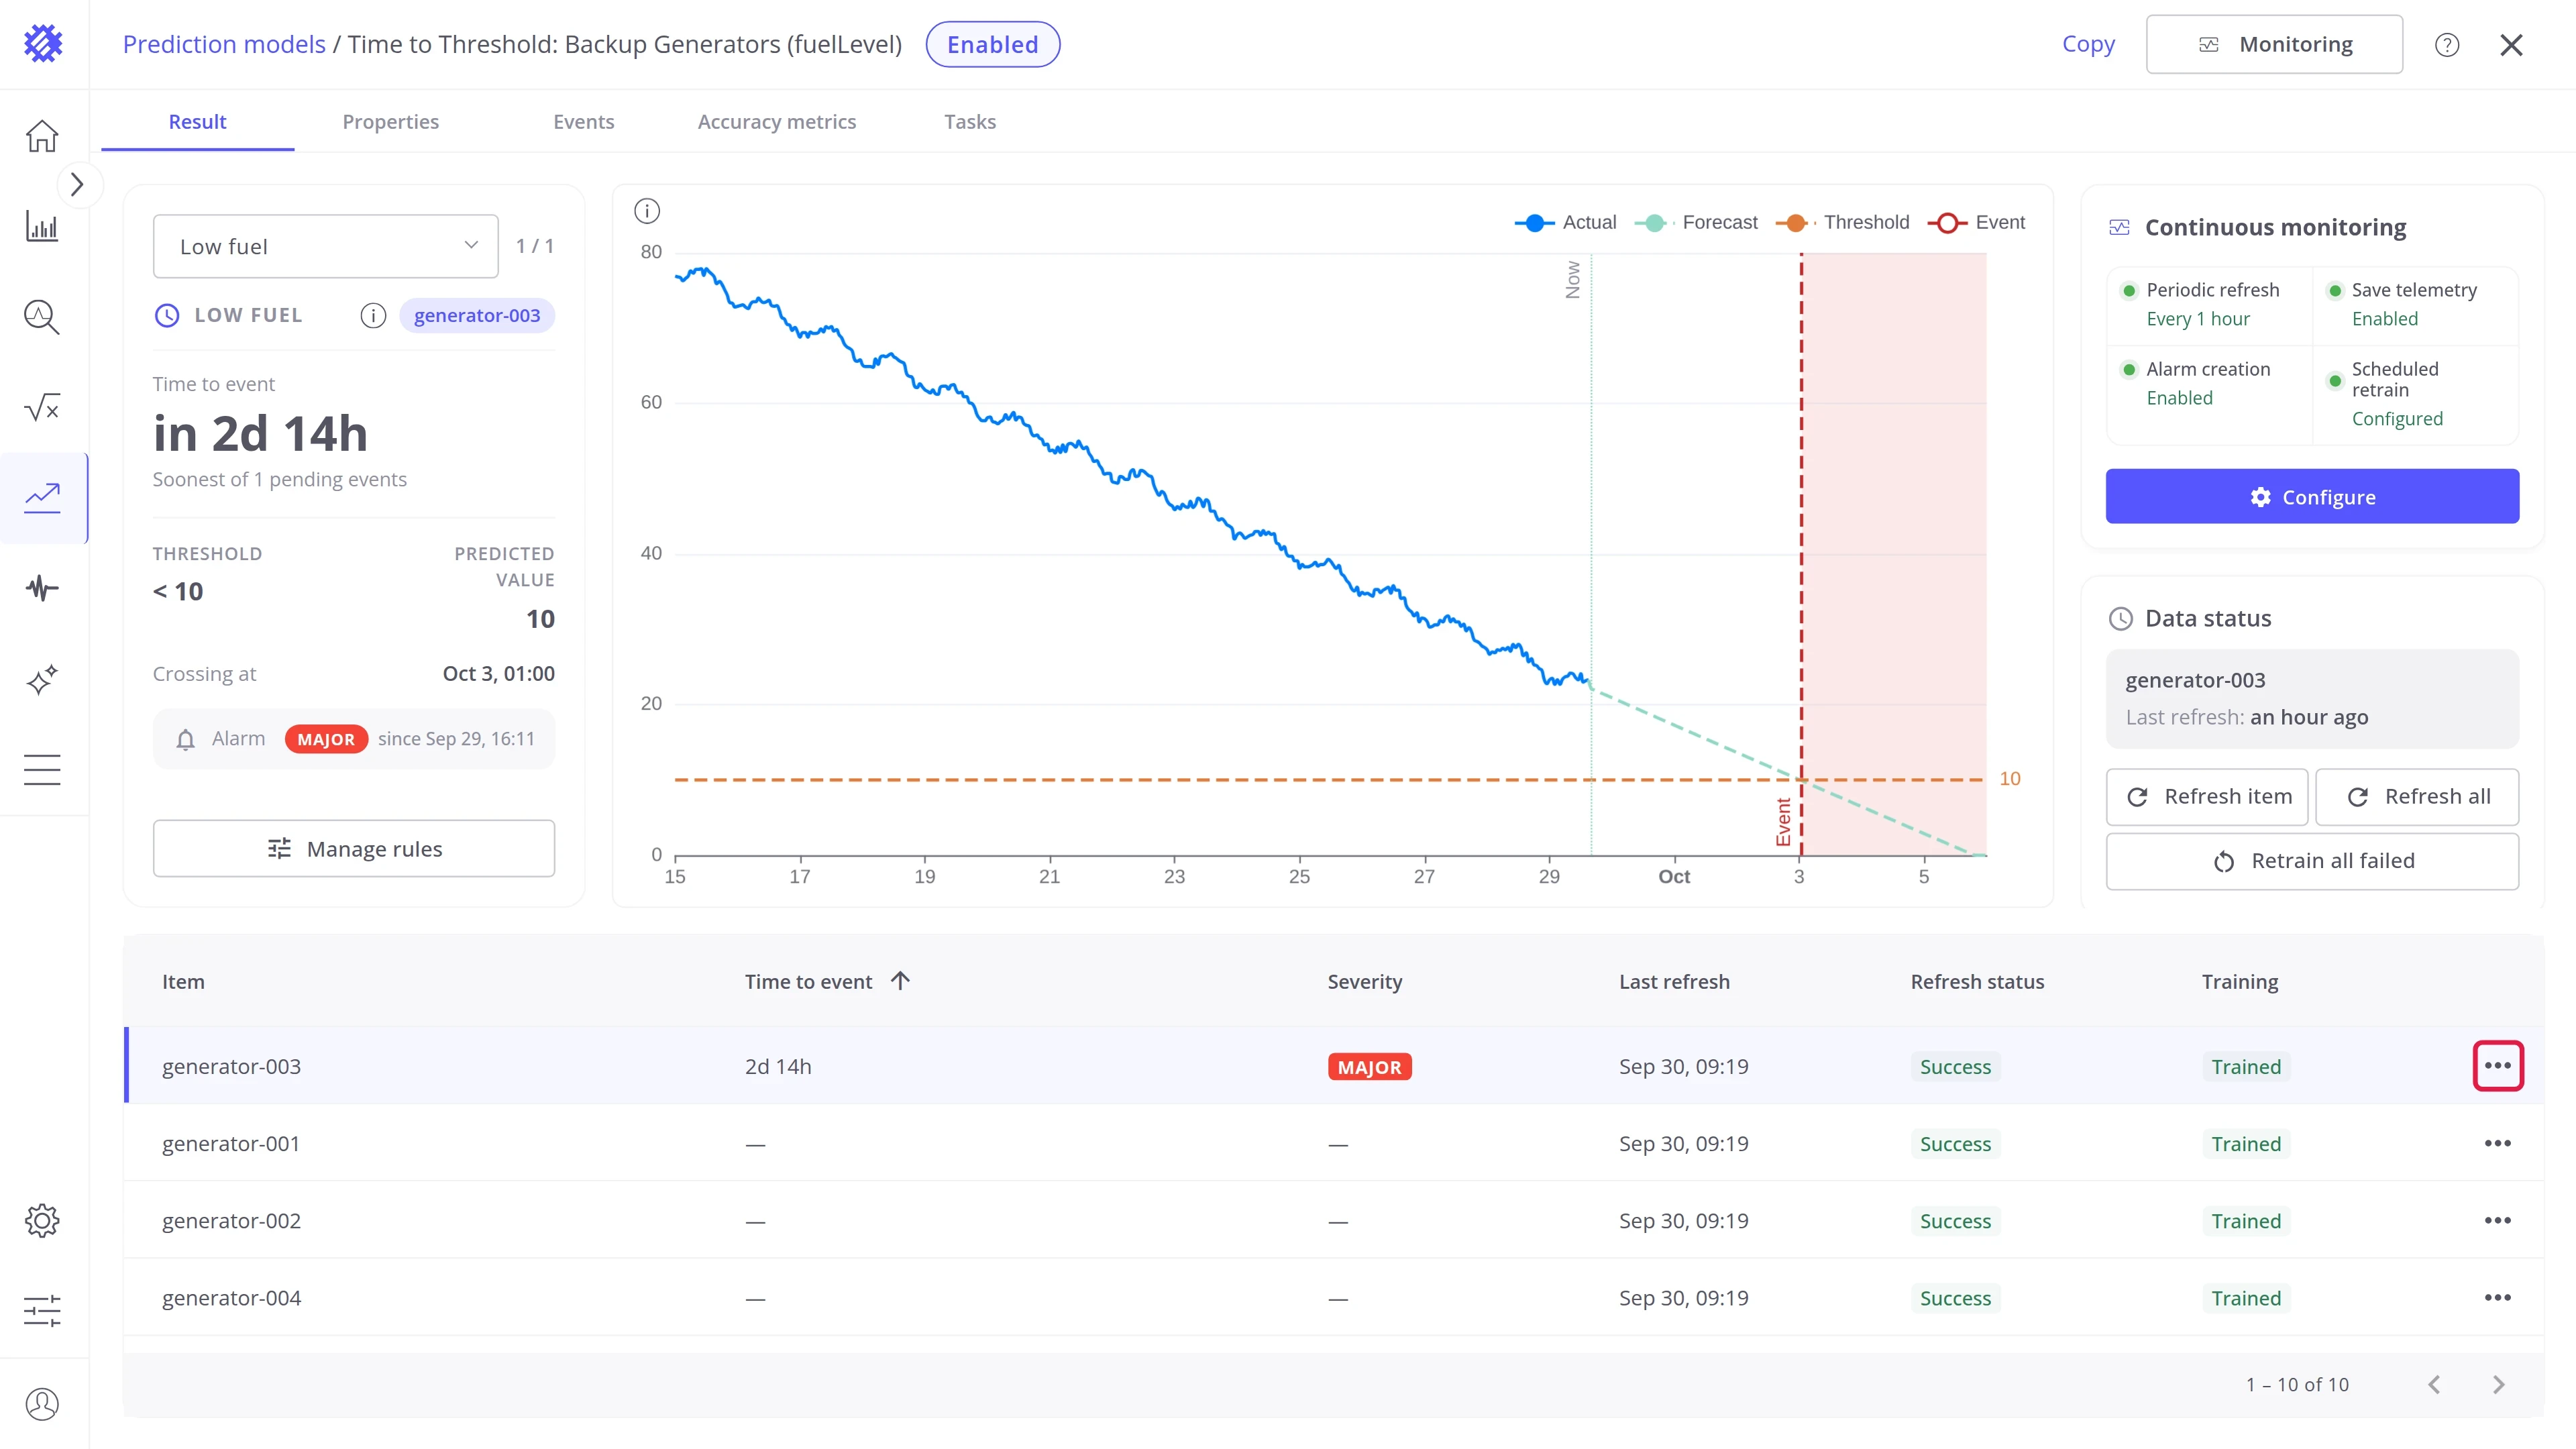
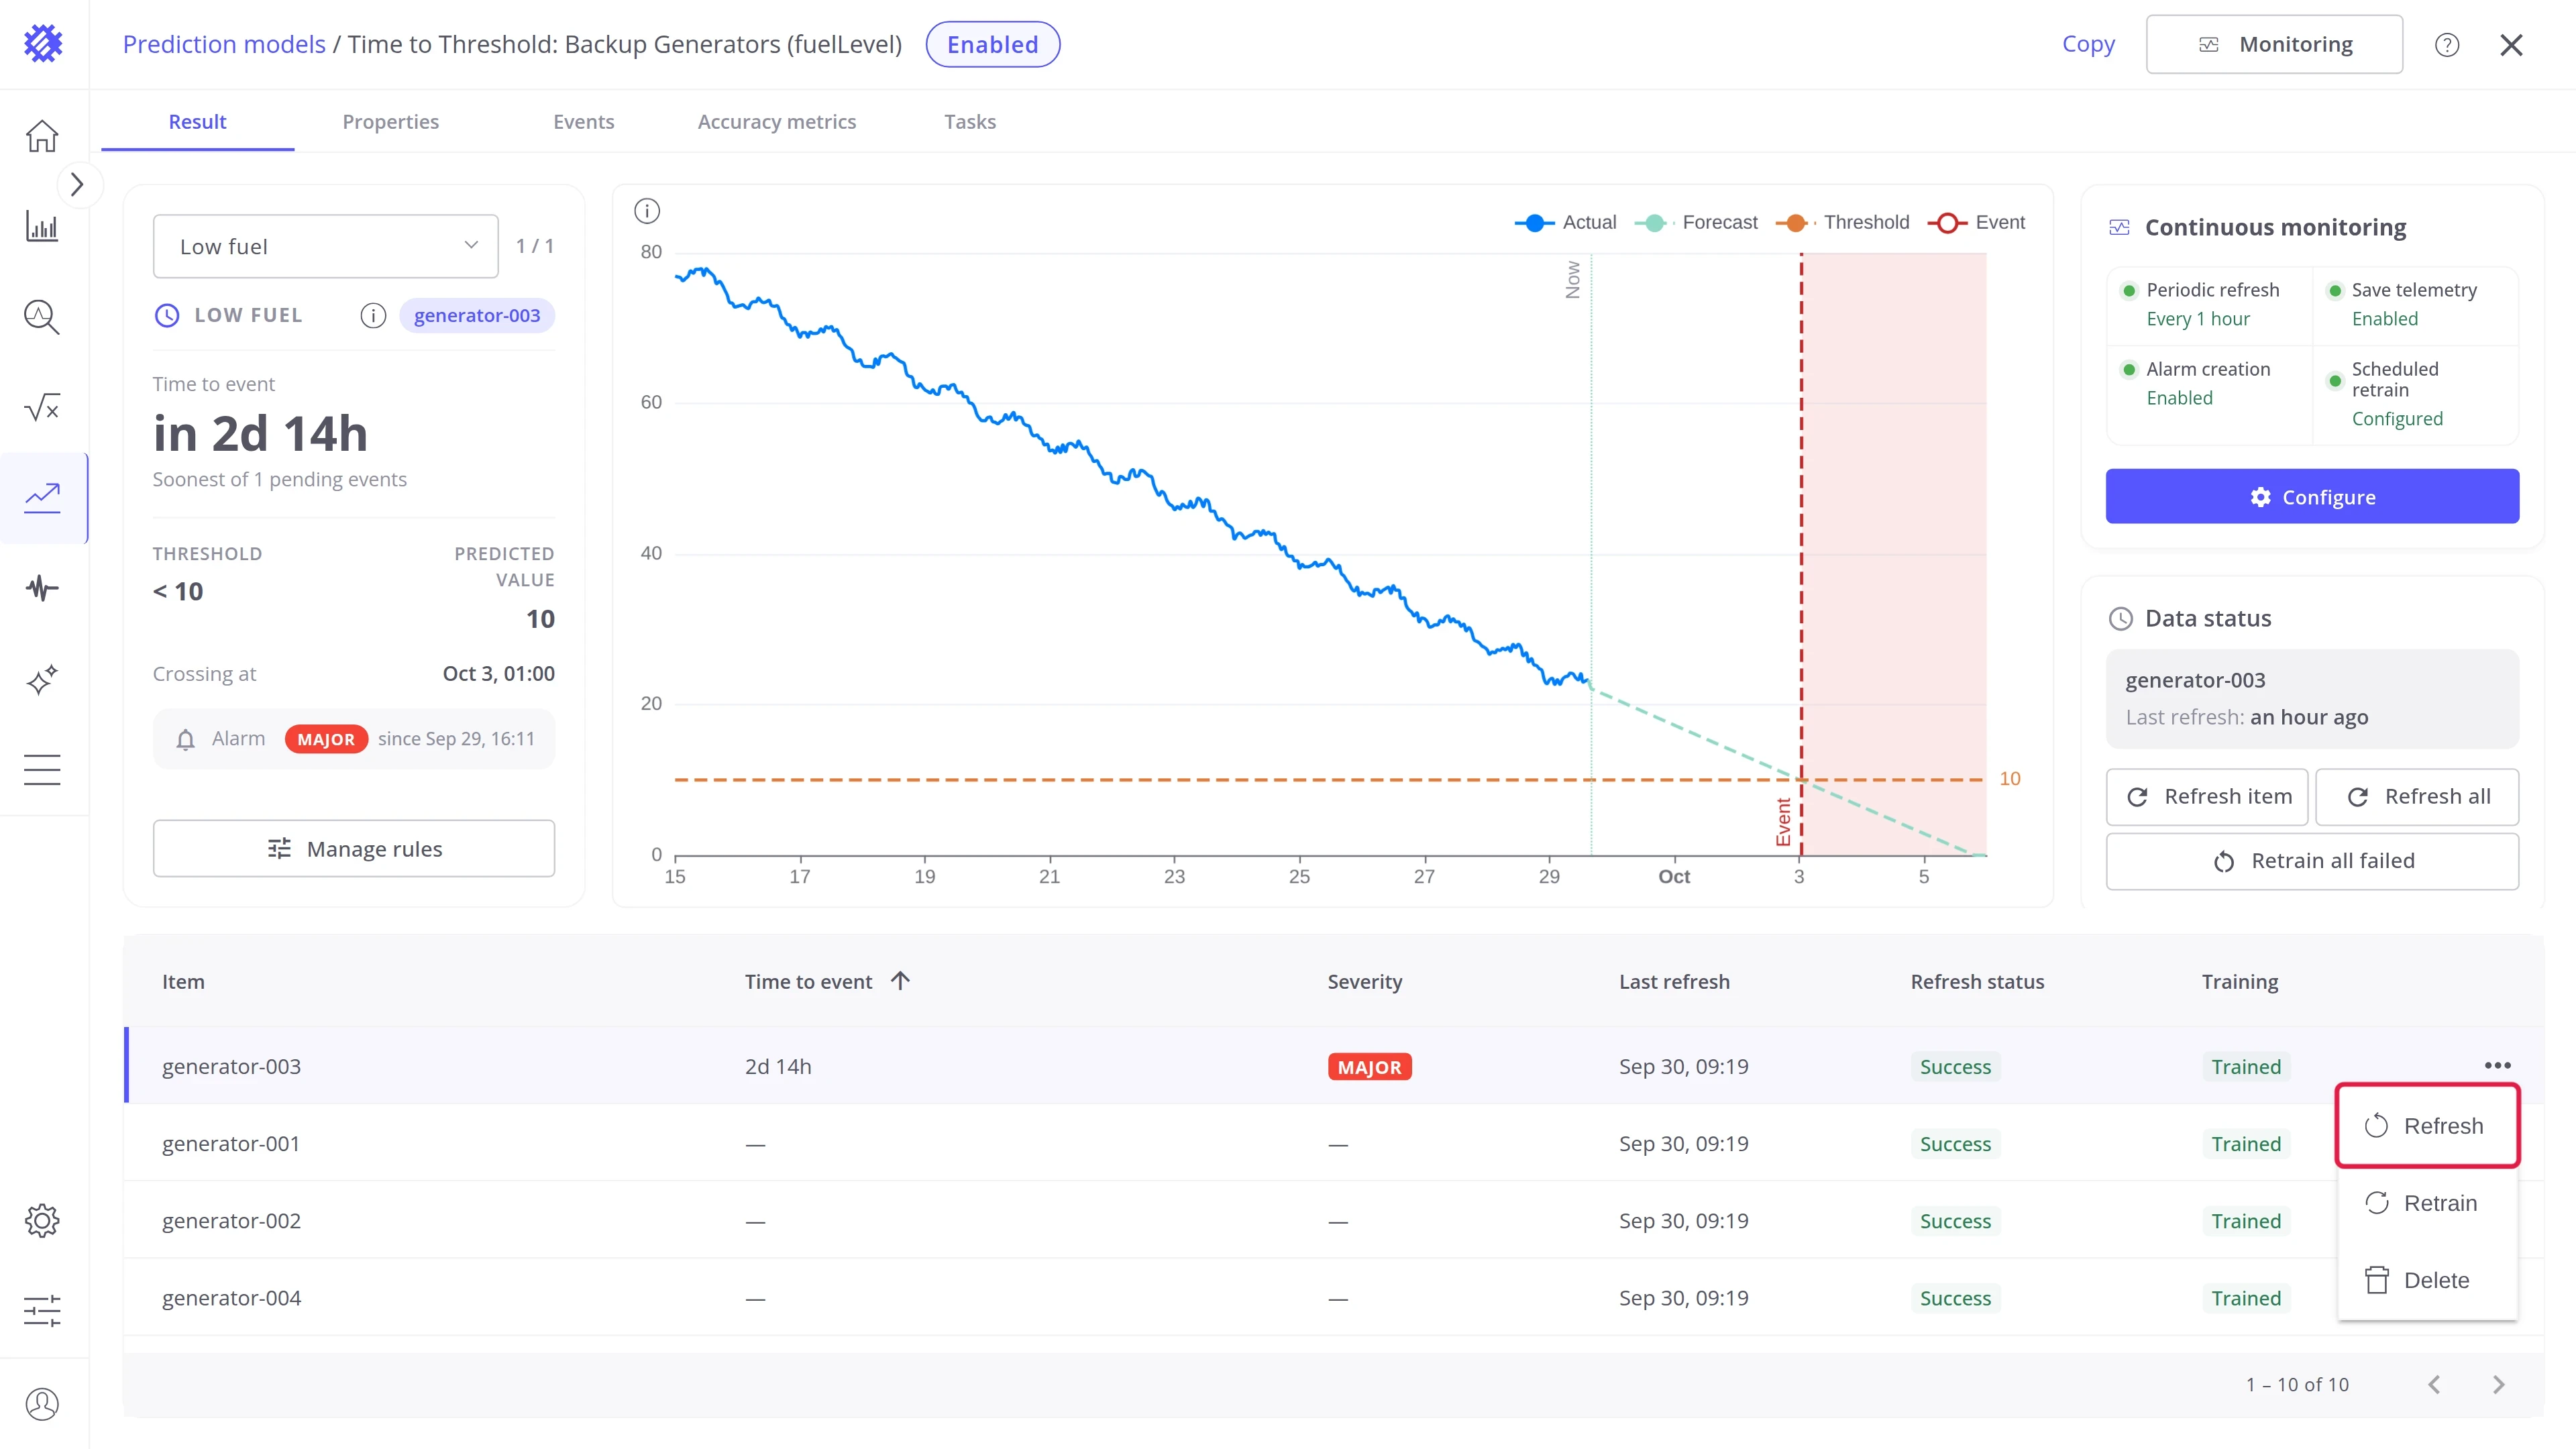
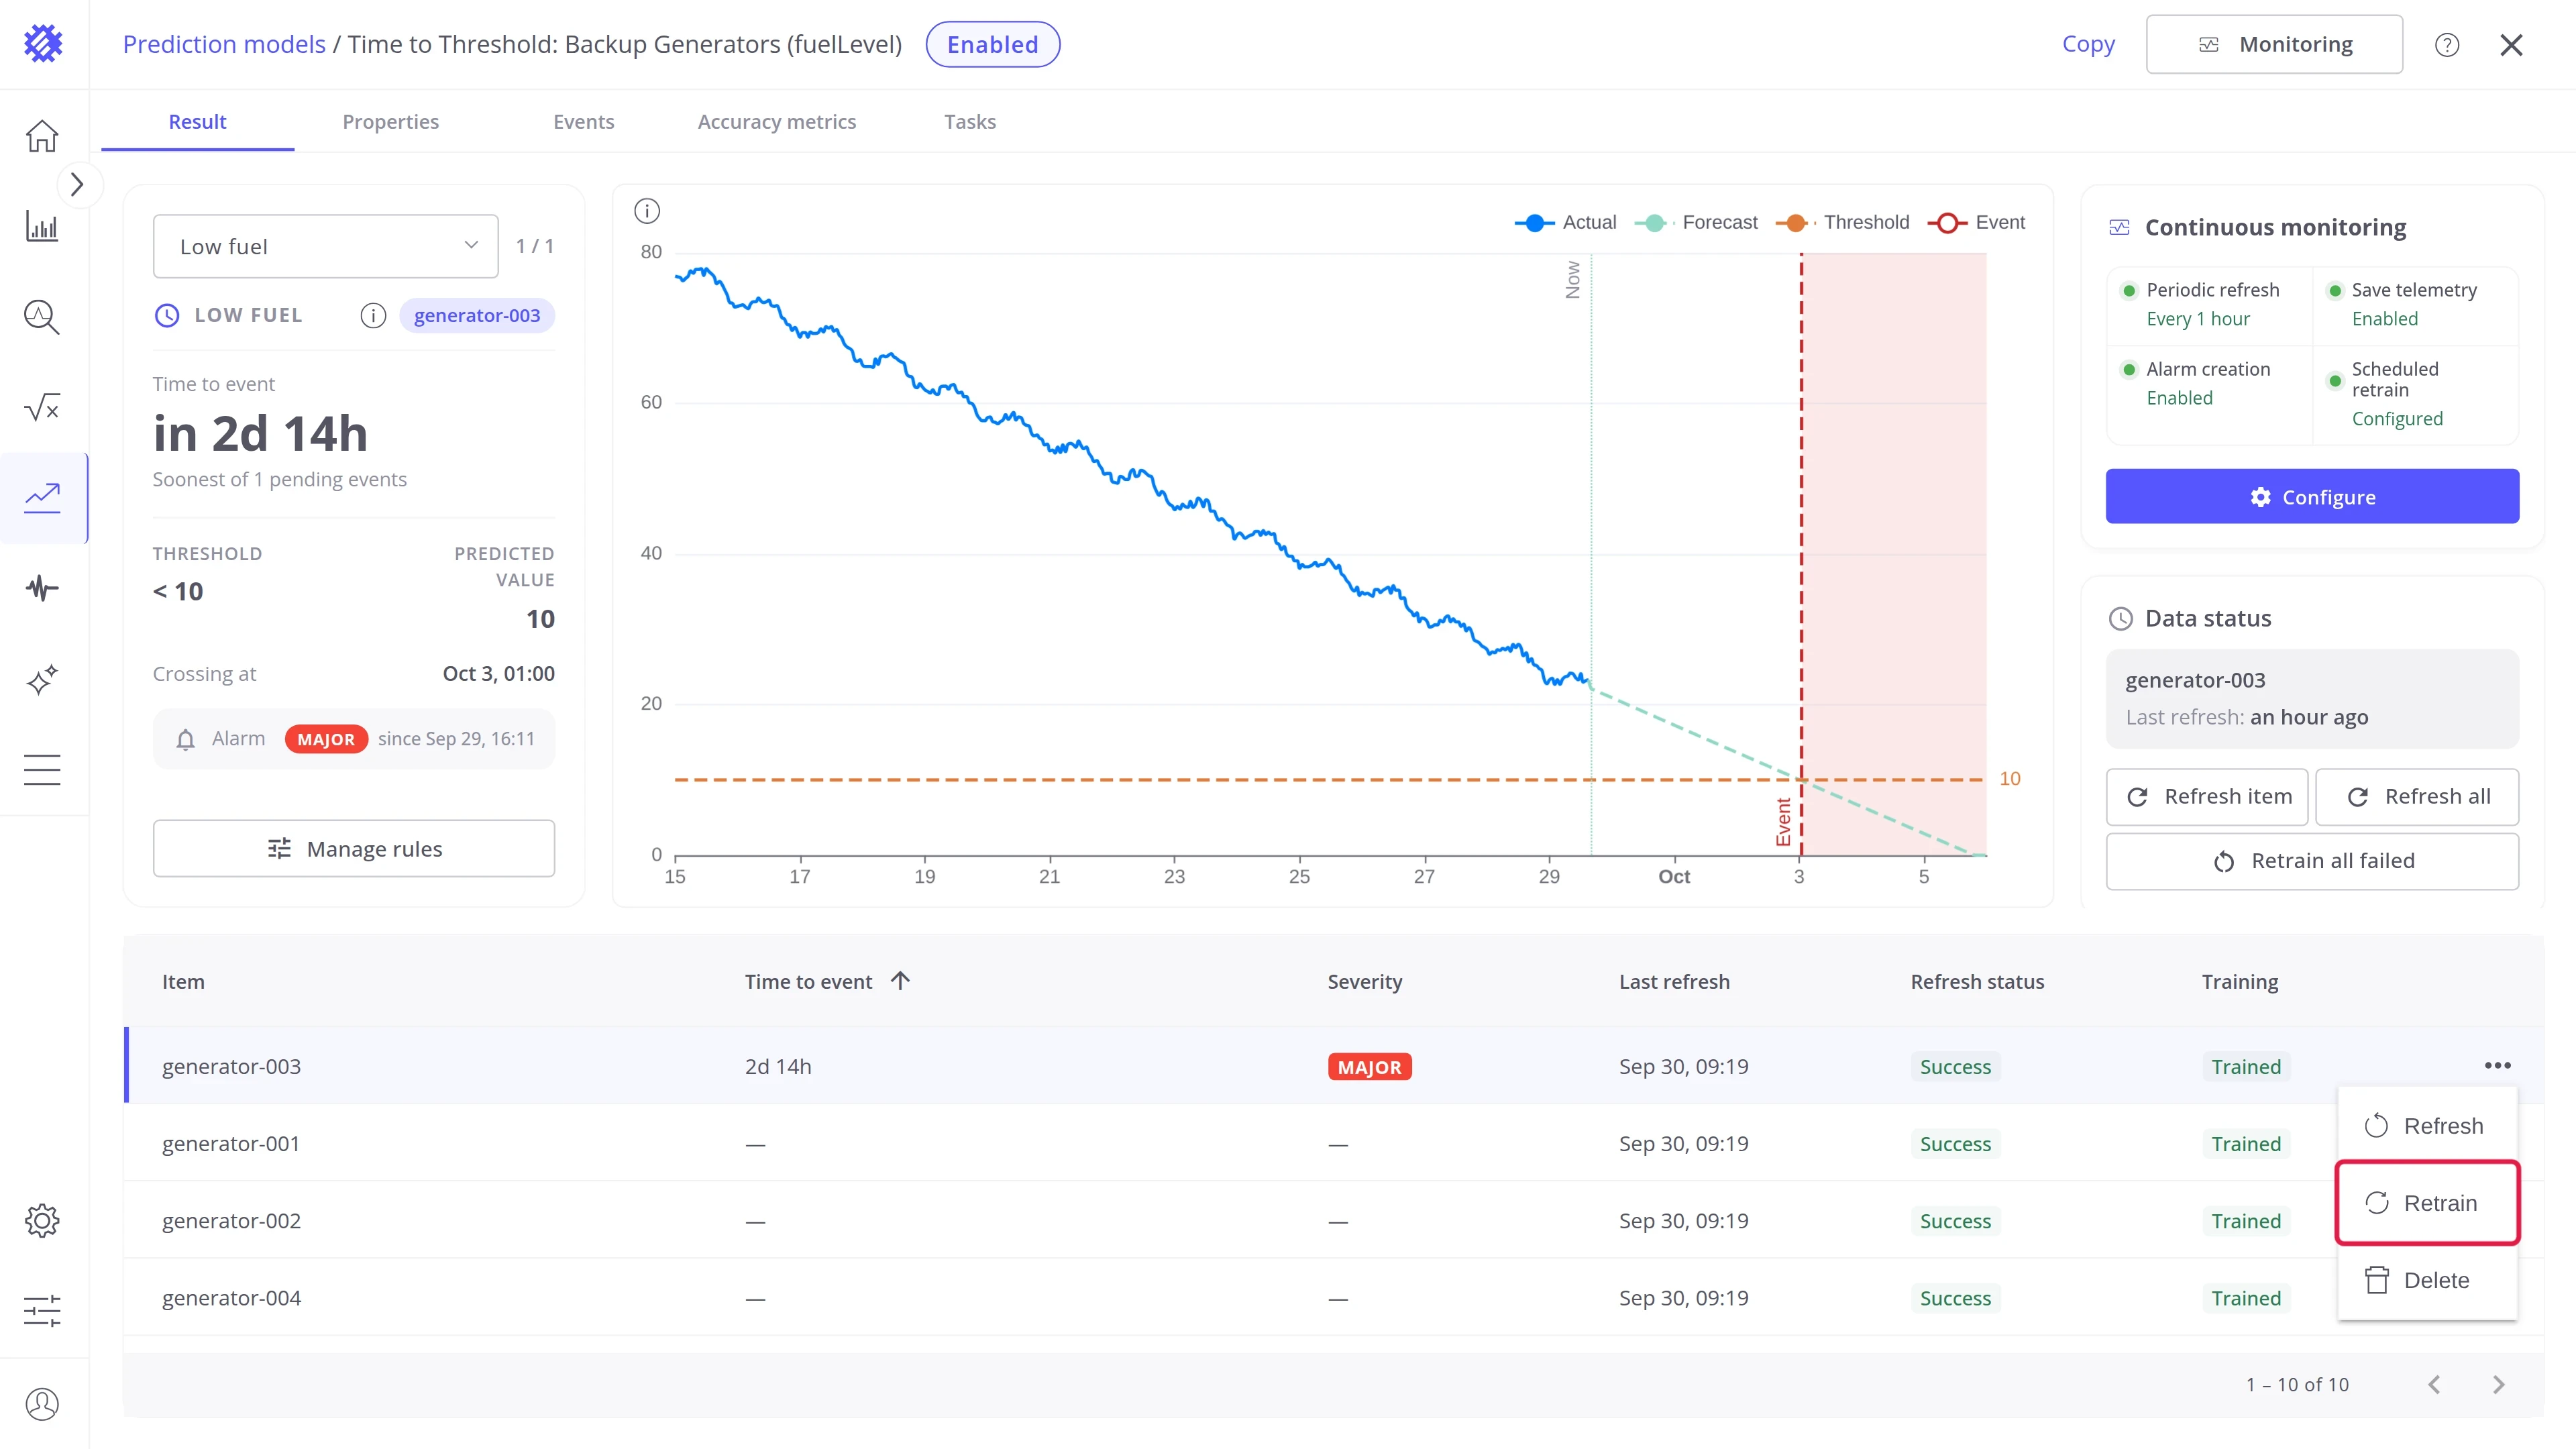
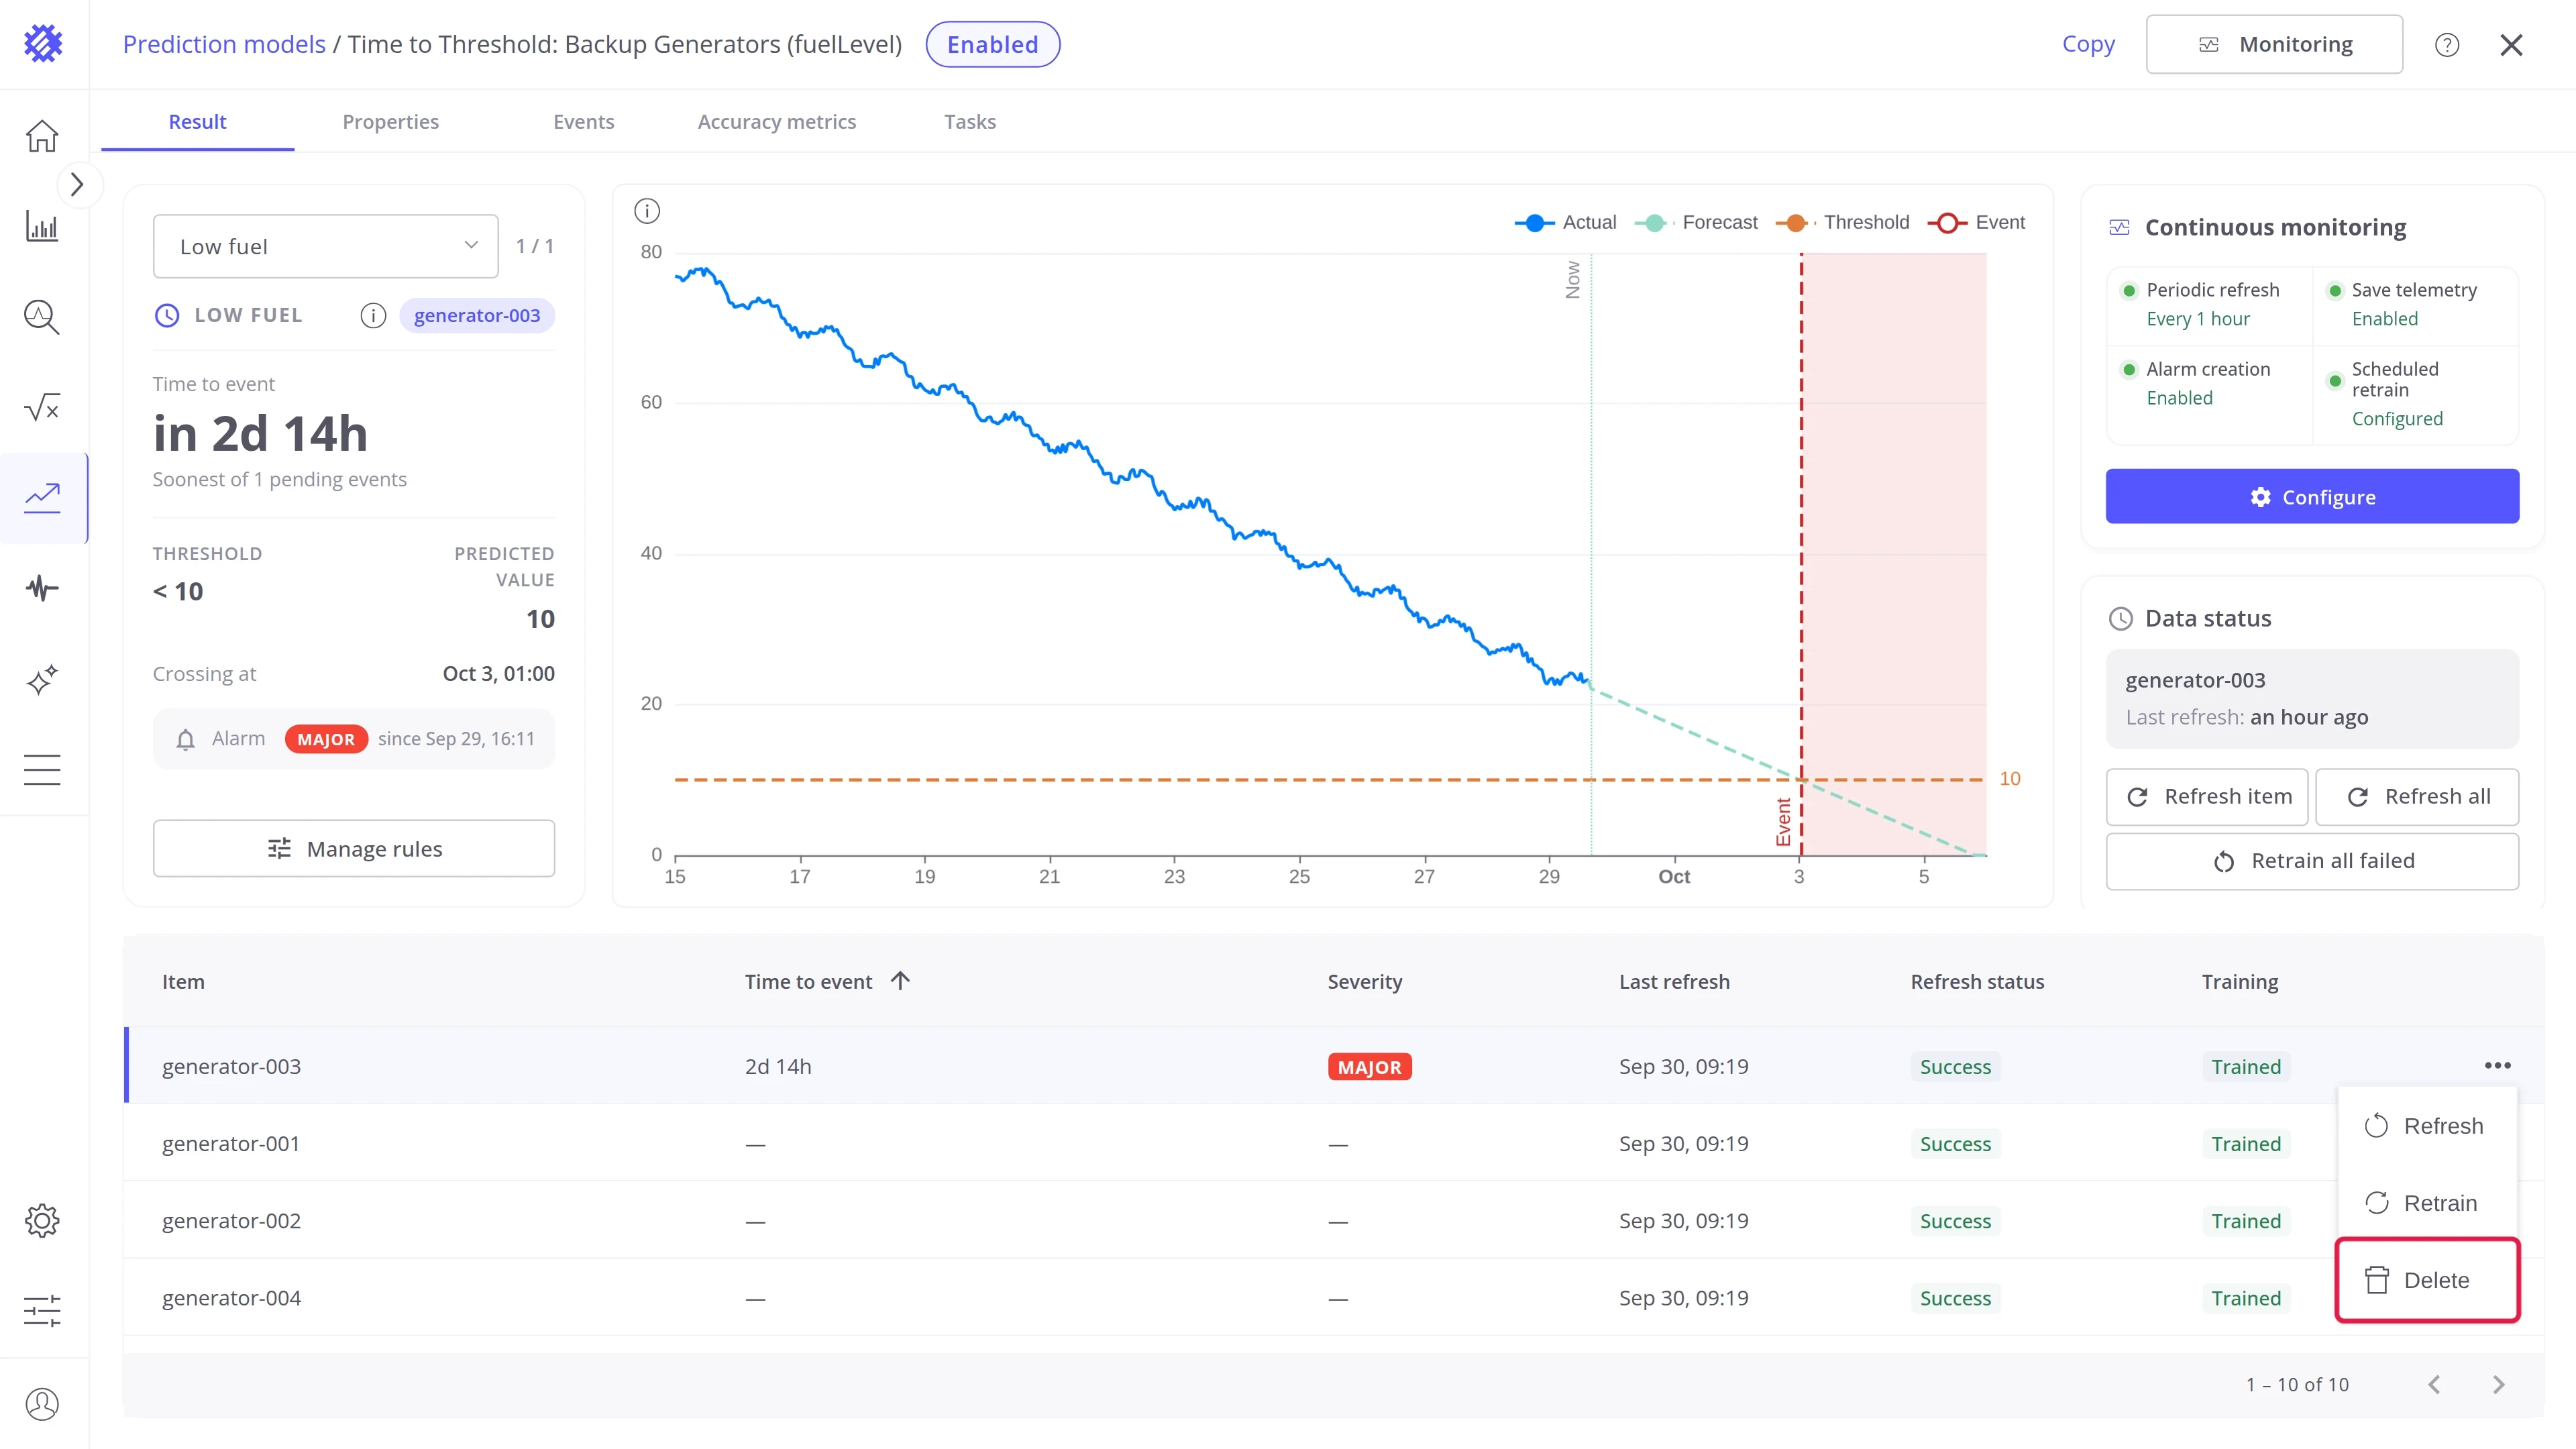
Section titled “Item actions”The ⋯ at the end of an item row opens the actions for that one item.
| Action | What it does |
|---|---|
| Refresh | Learns from the readings that arrived since the last refresh, and predicts again |
| Retrain | Trains the item again from its whole training period, for example after its behavior changed or its training failed |
| Delete | Takes the item out of the model. The device or asset in ThingsBoard stays as it is |
Data status
Section titled “Data status”The selected item and how long ago it was refreshed, with buttons that run the same work for more items at once:
- Refresh item refreshes the selected item.
- Refresh all refreshes every item of the model.
- Retrain all failed trains again every item whose training failed.
Properties tab
Section titled “Properties tab”Every setting of the model: the data it learns from, how far ahead it predicts, and how it learns.
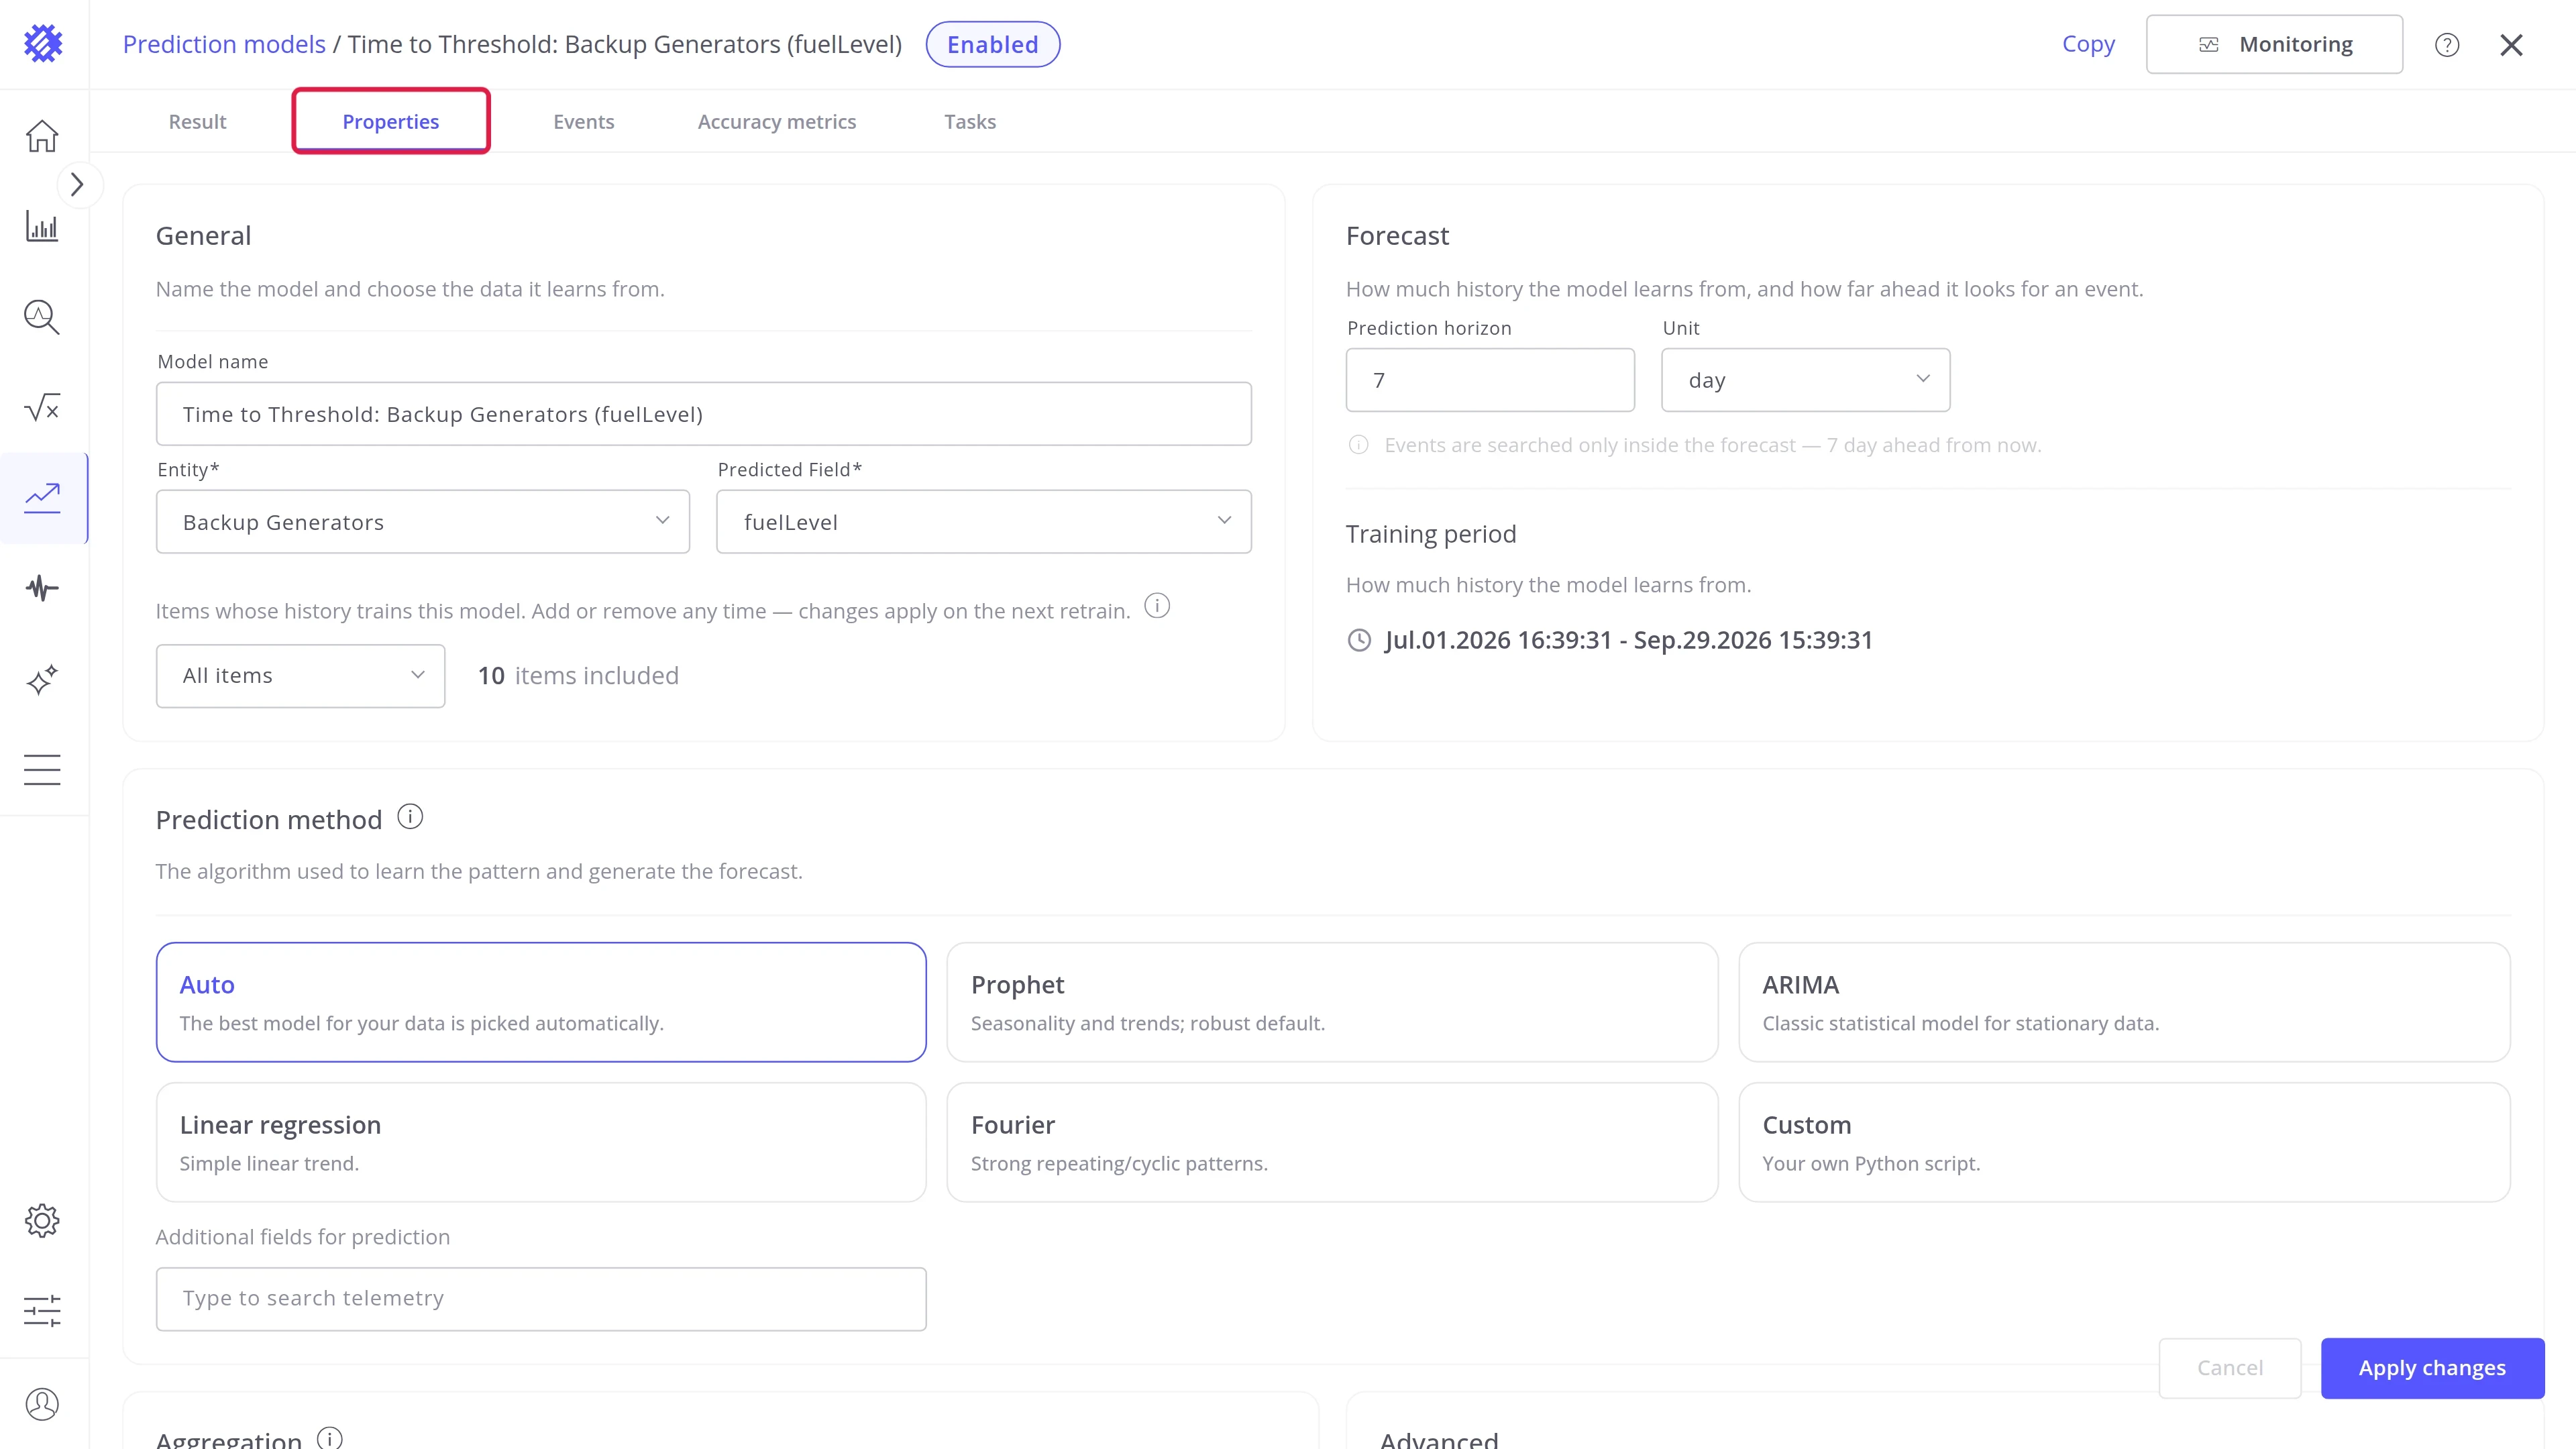
See Properties tab.
Events tab
Section titled “Events tab”Every predicted event of a Time to Threshold model, across all items and rules. Click an event to see it on the chart.
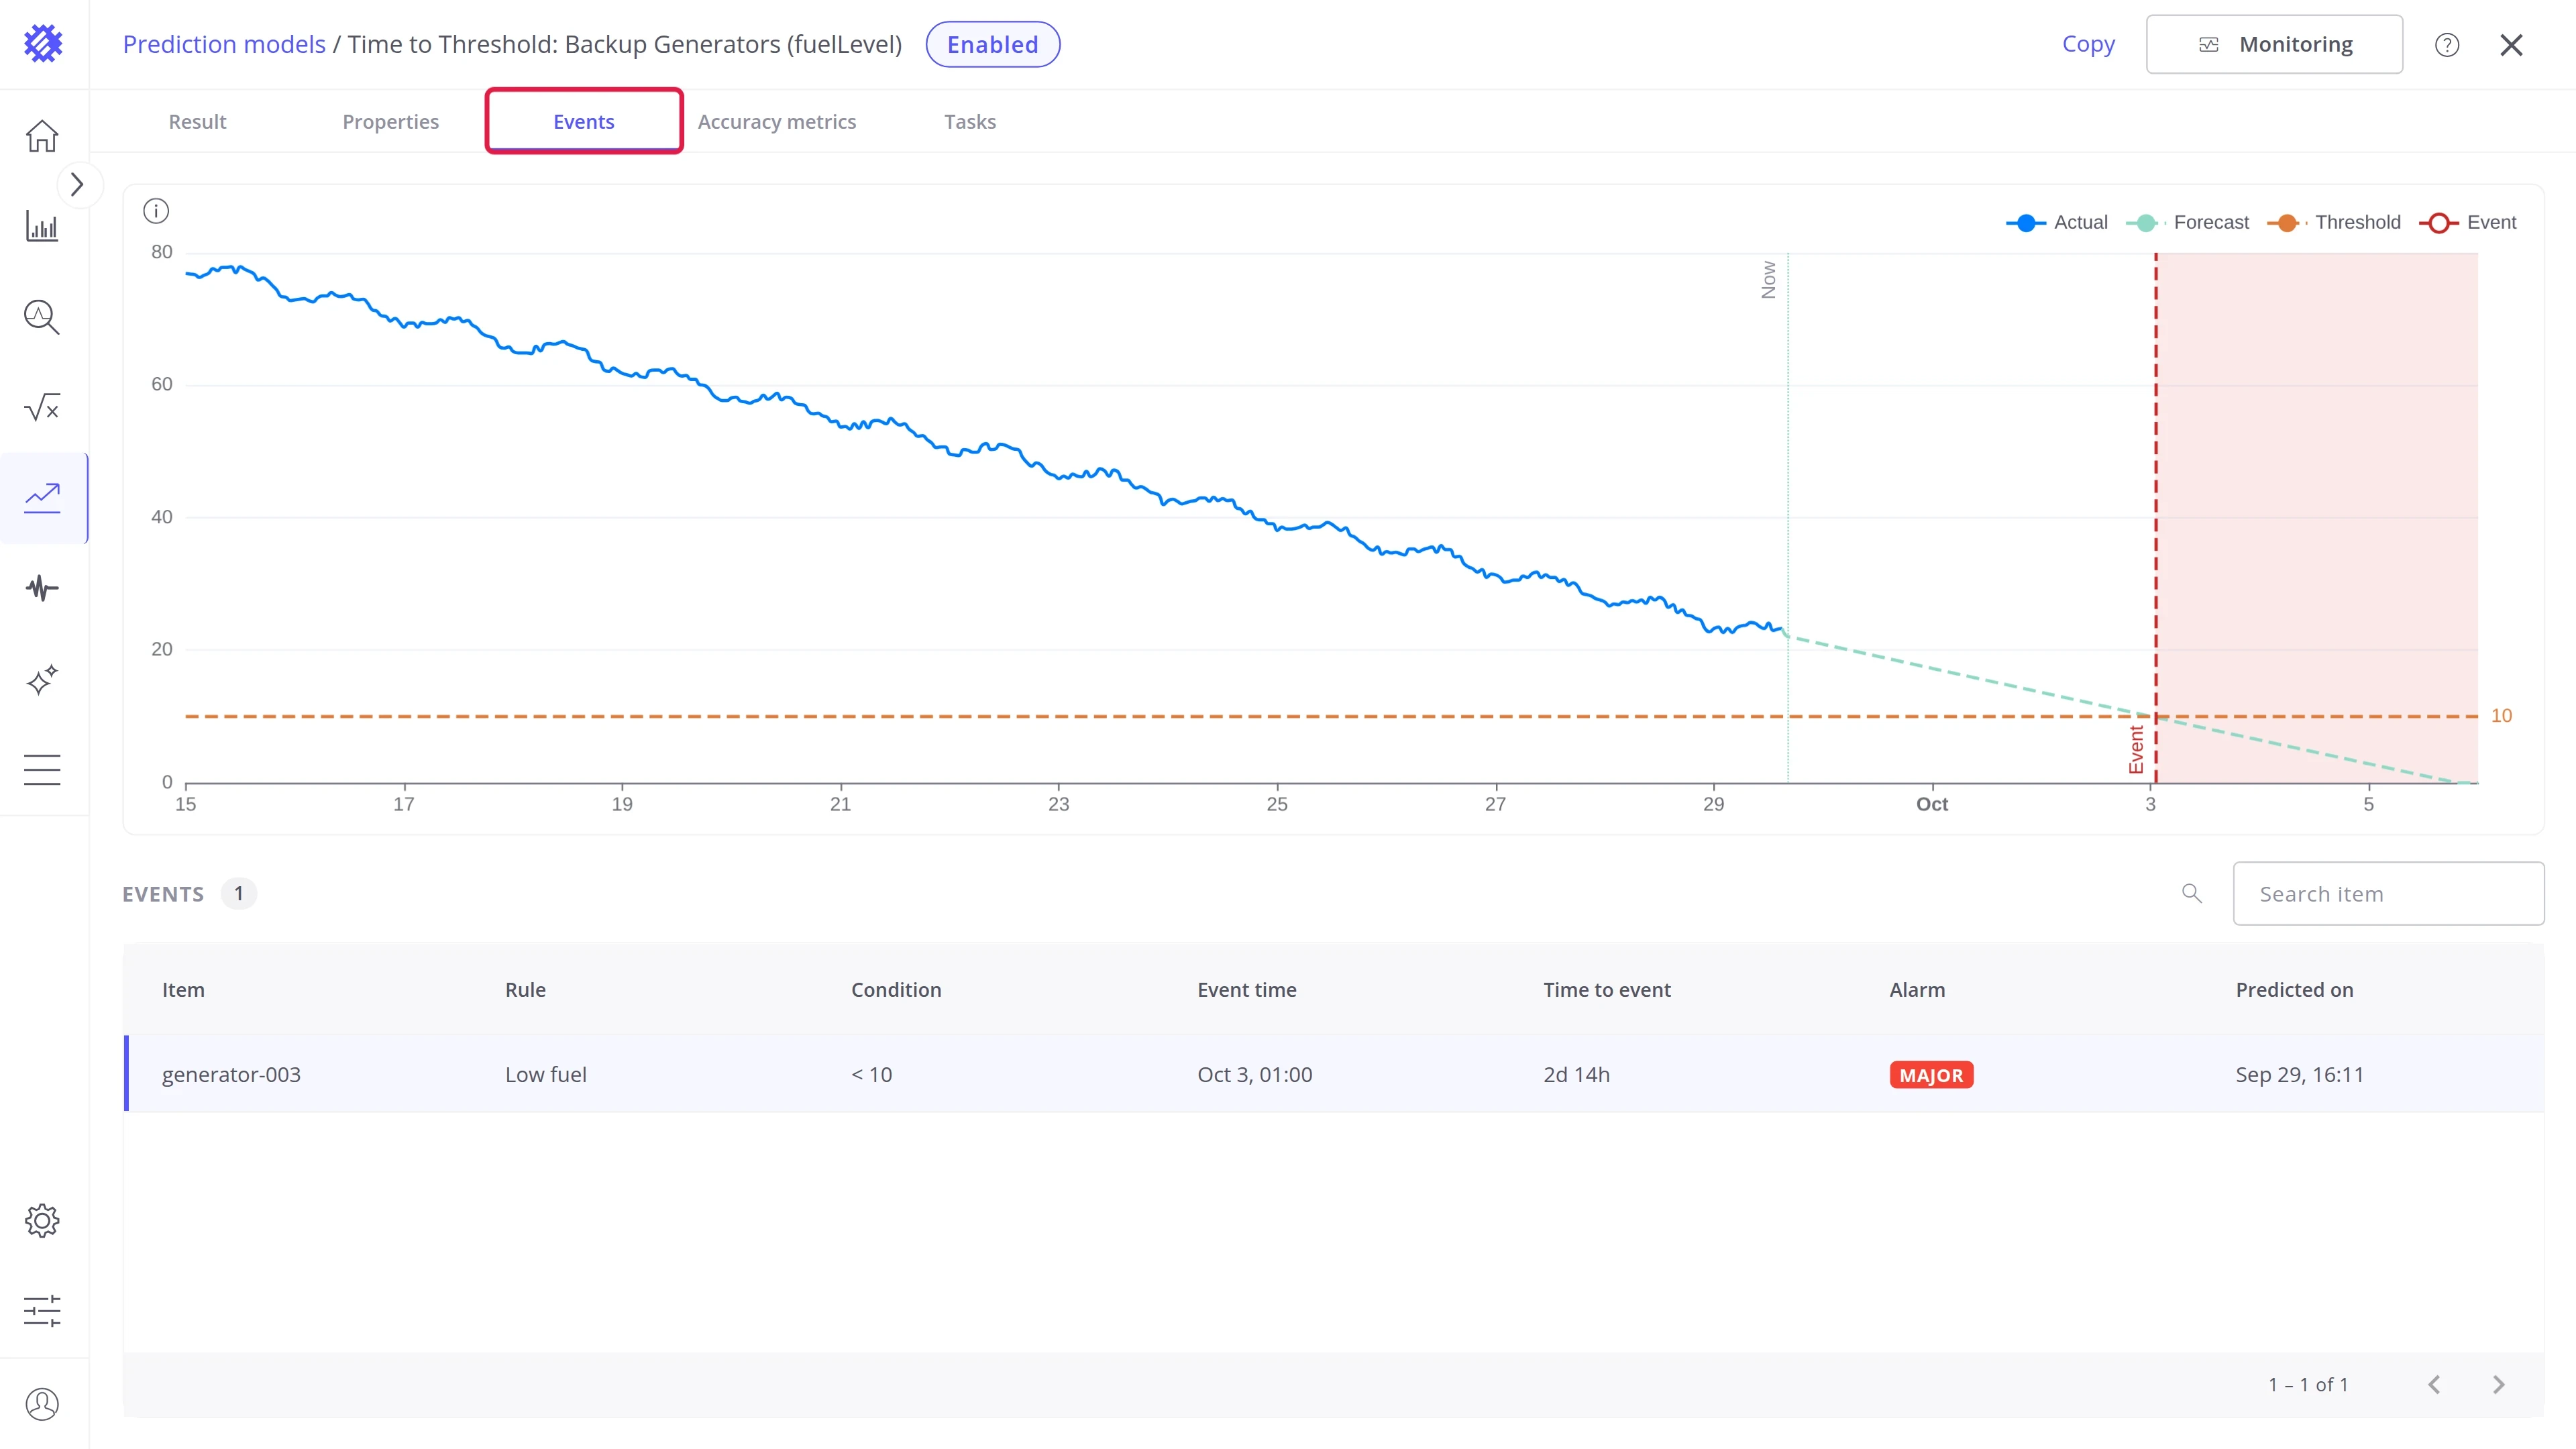
See Time to Threshold.
Accuracy metrics tab
Section titled “Accuracy metrics tab”How close past forecasts came to what really happened, for the whole model and for each item.
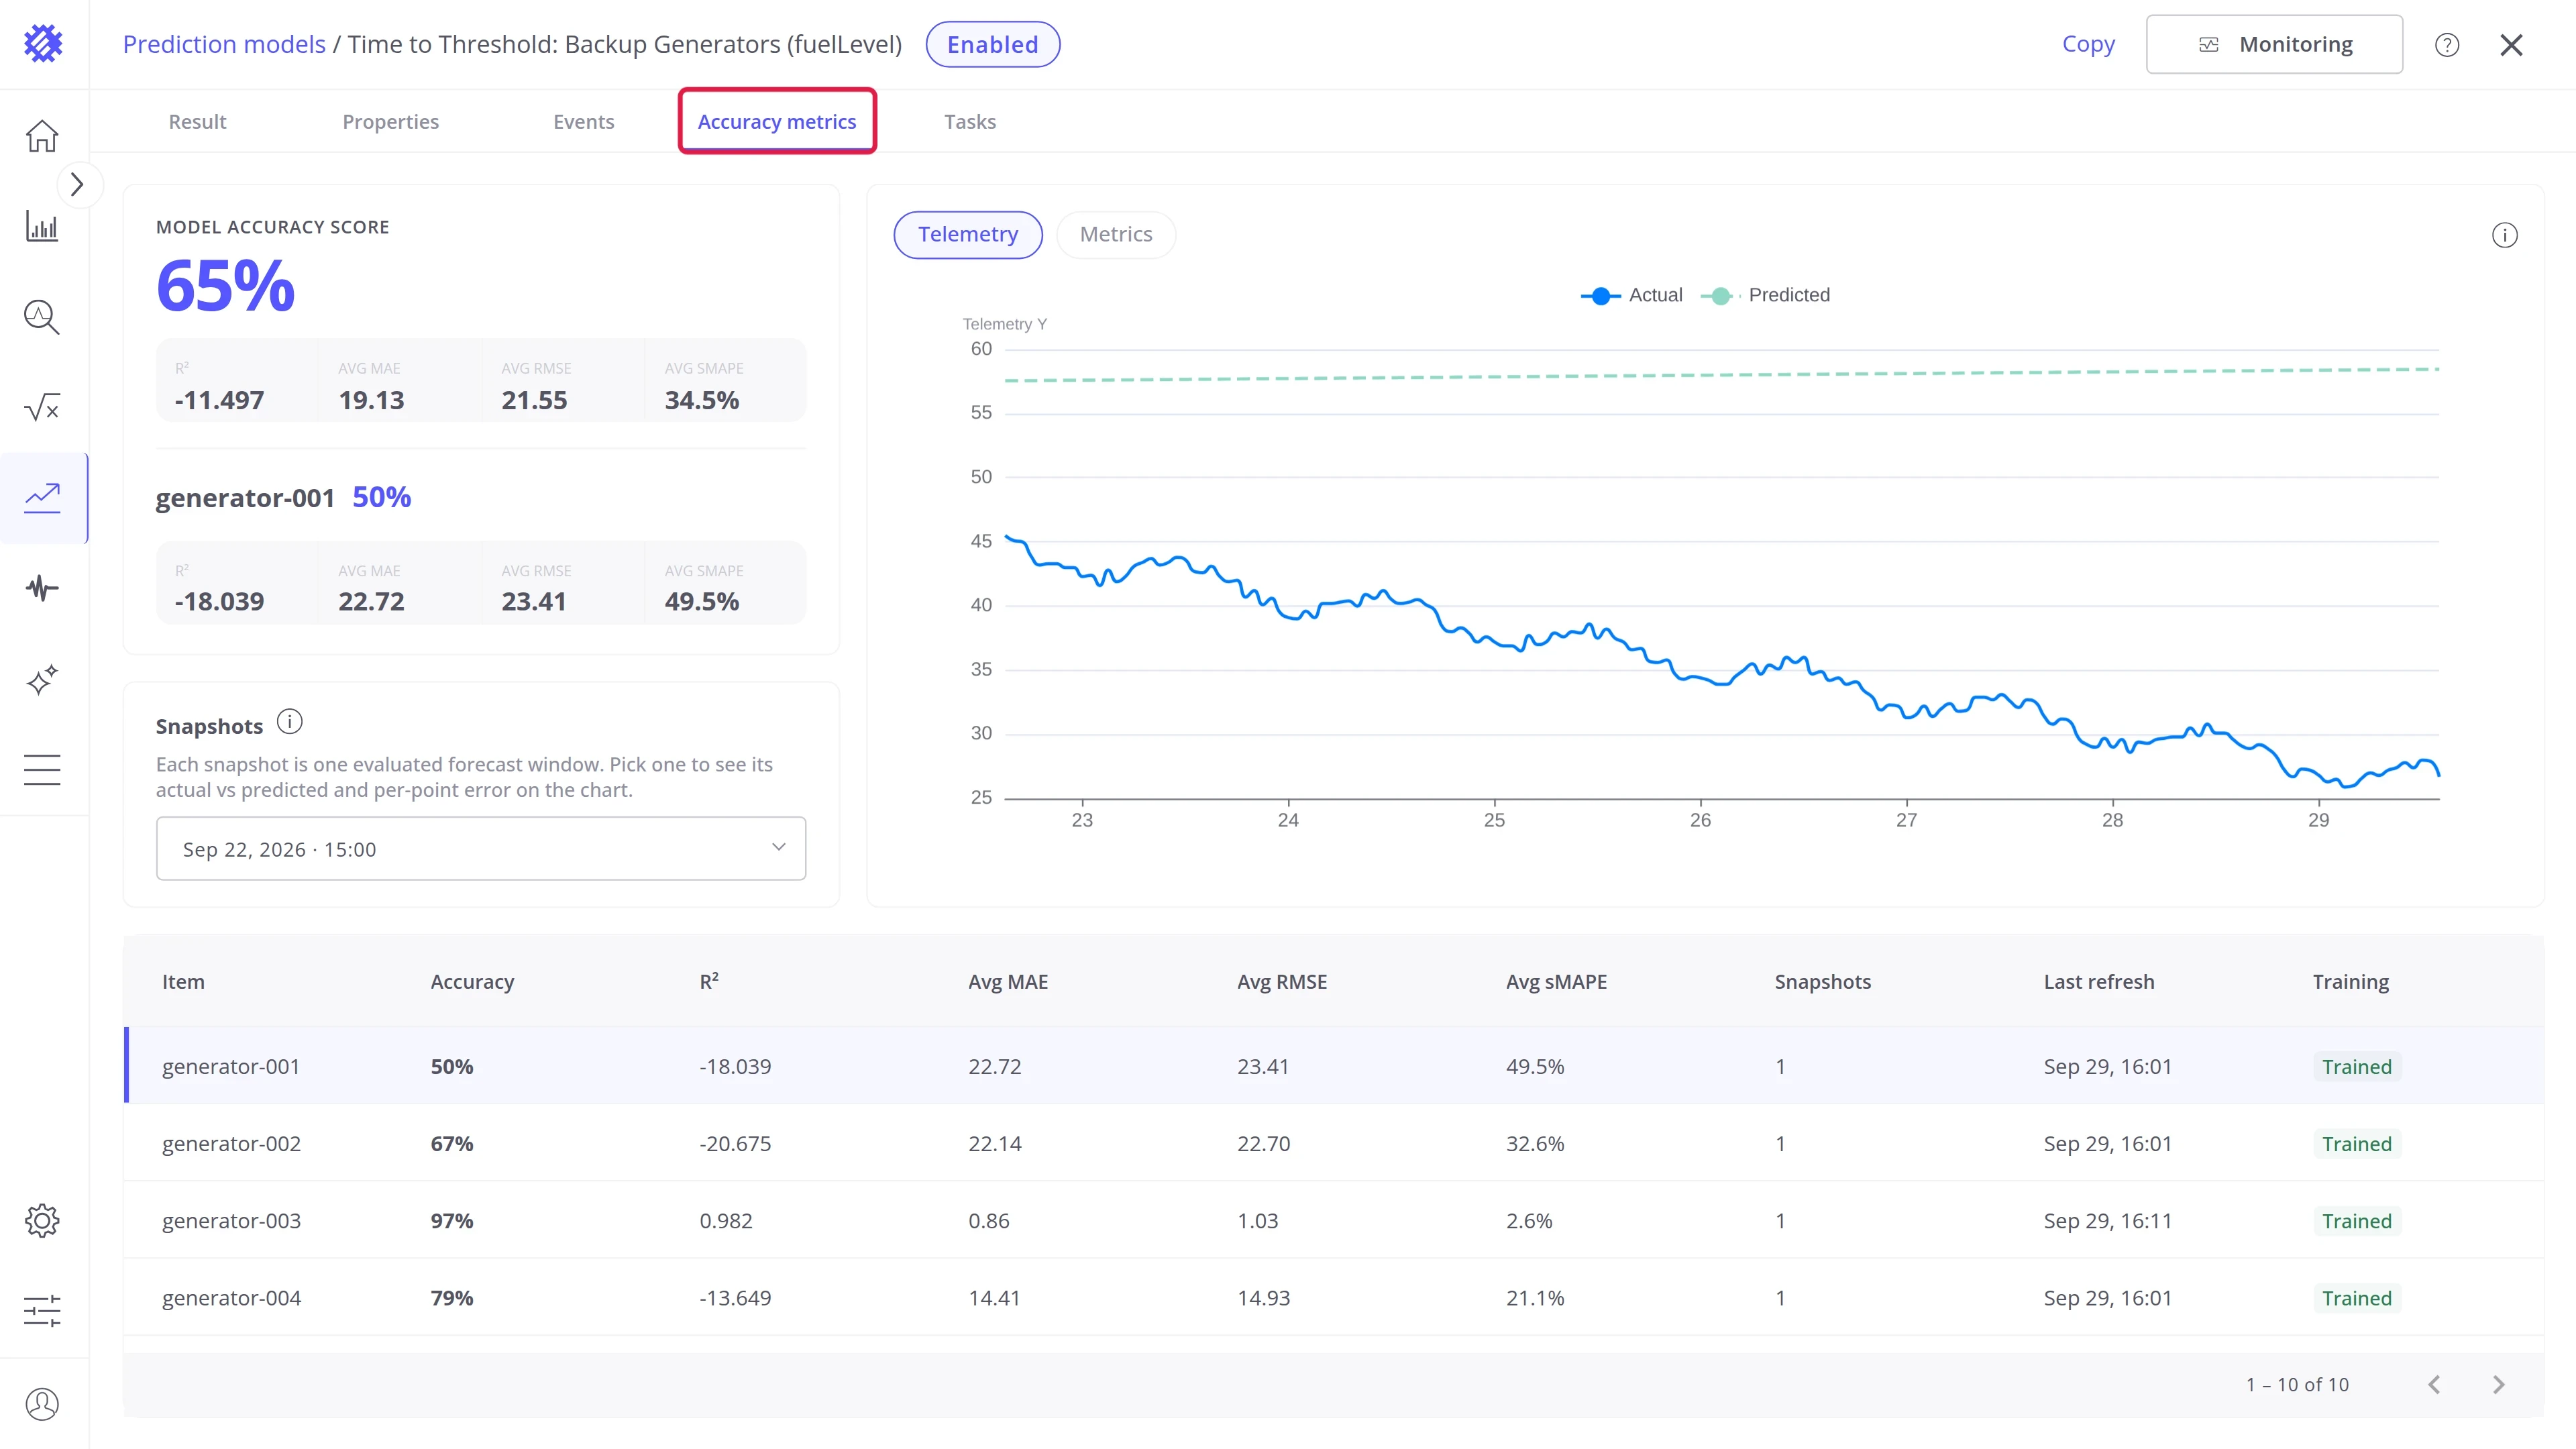
See Accuracy.
Tasks tab
Section titled “Tasks tab”Trendz runs the work of a model as tasks: one that trains it, and one that refreshes it on a schedule while periodic refresh is on. The Tasks tab lists them, so you can check when each run happened and whether it finished.
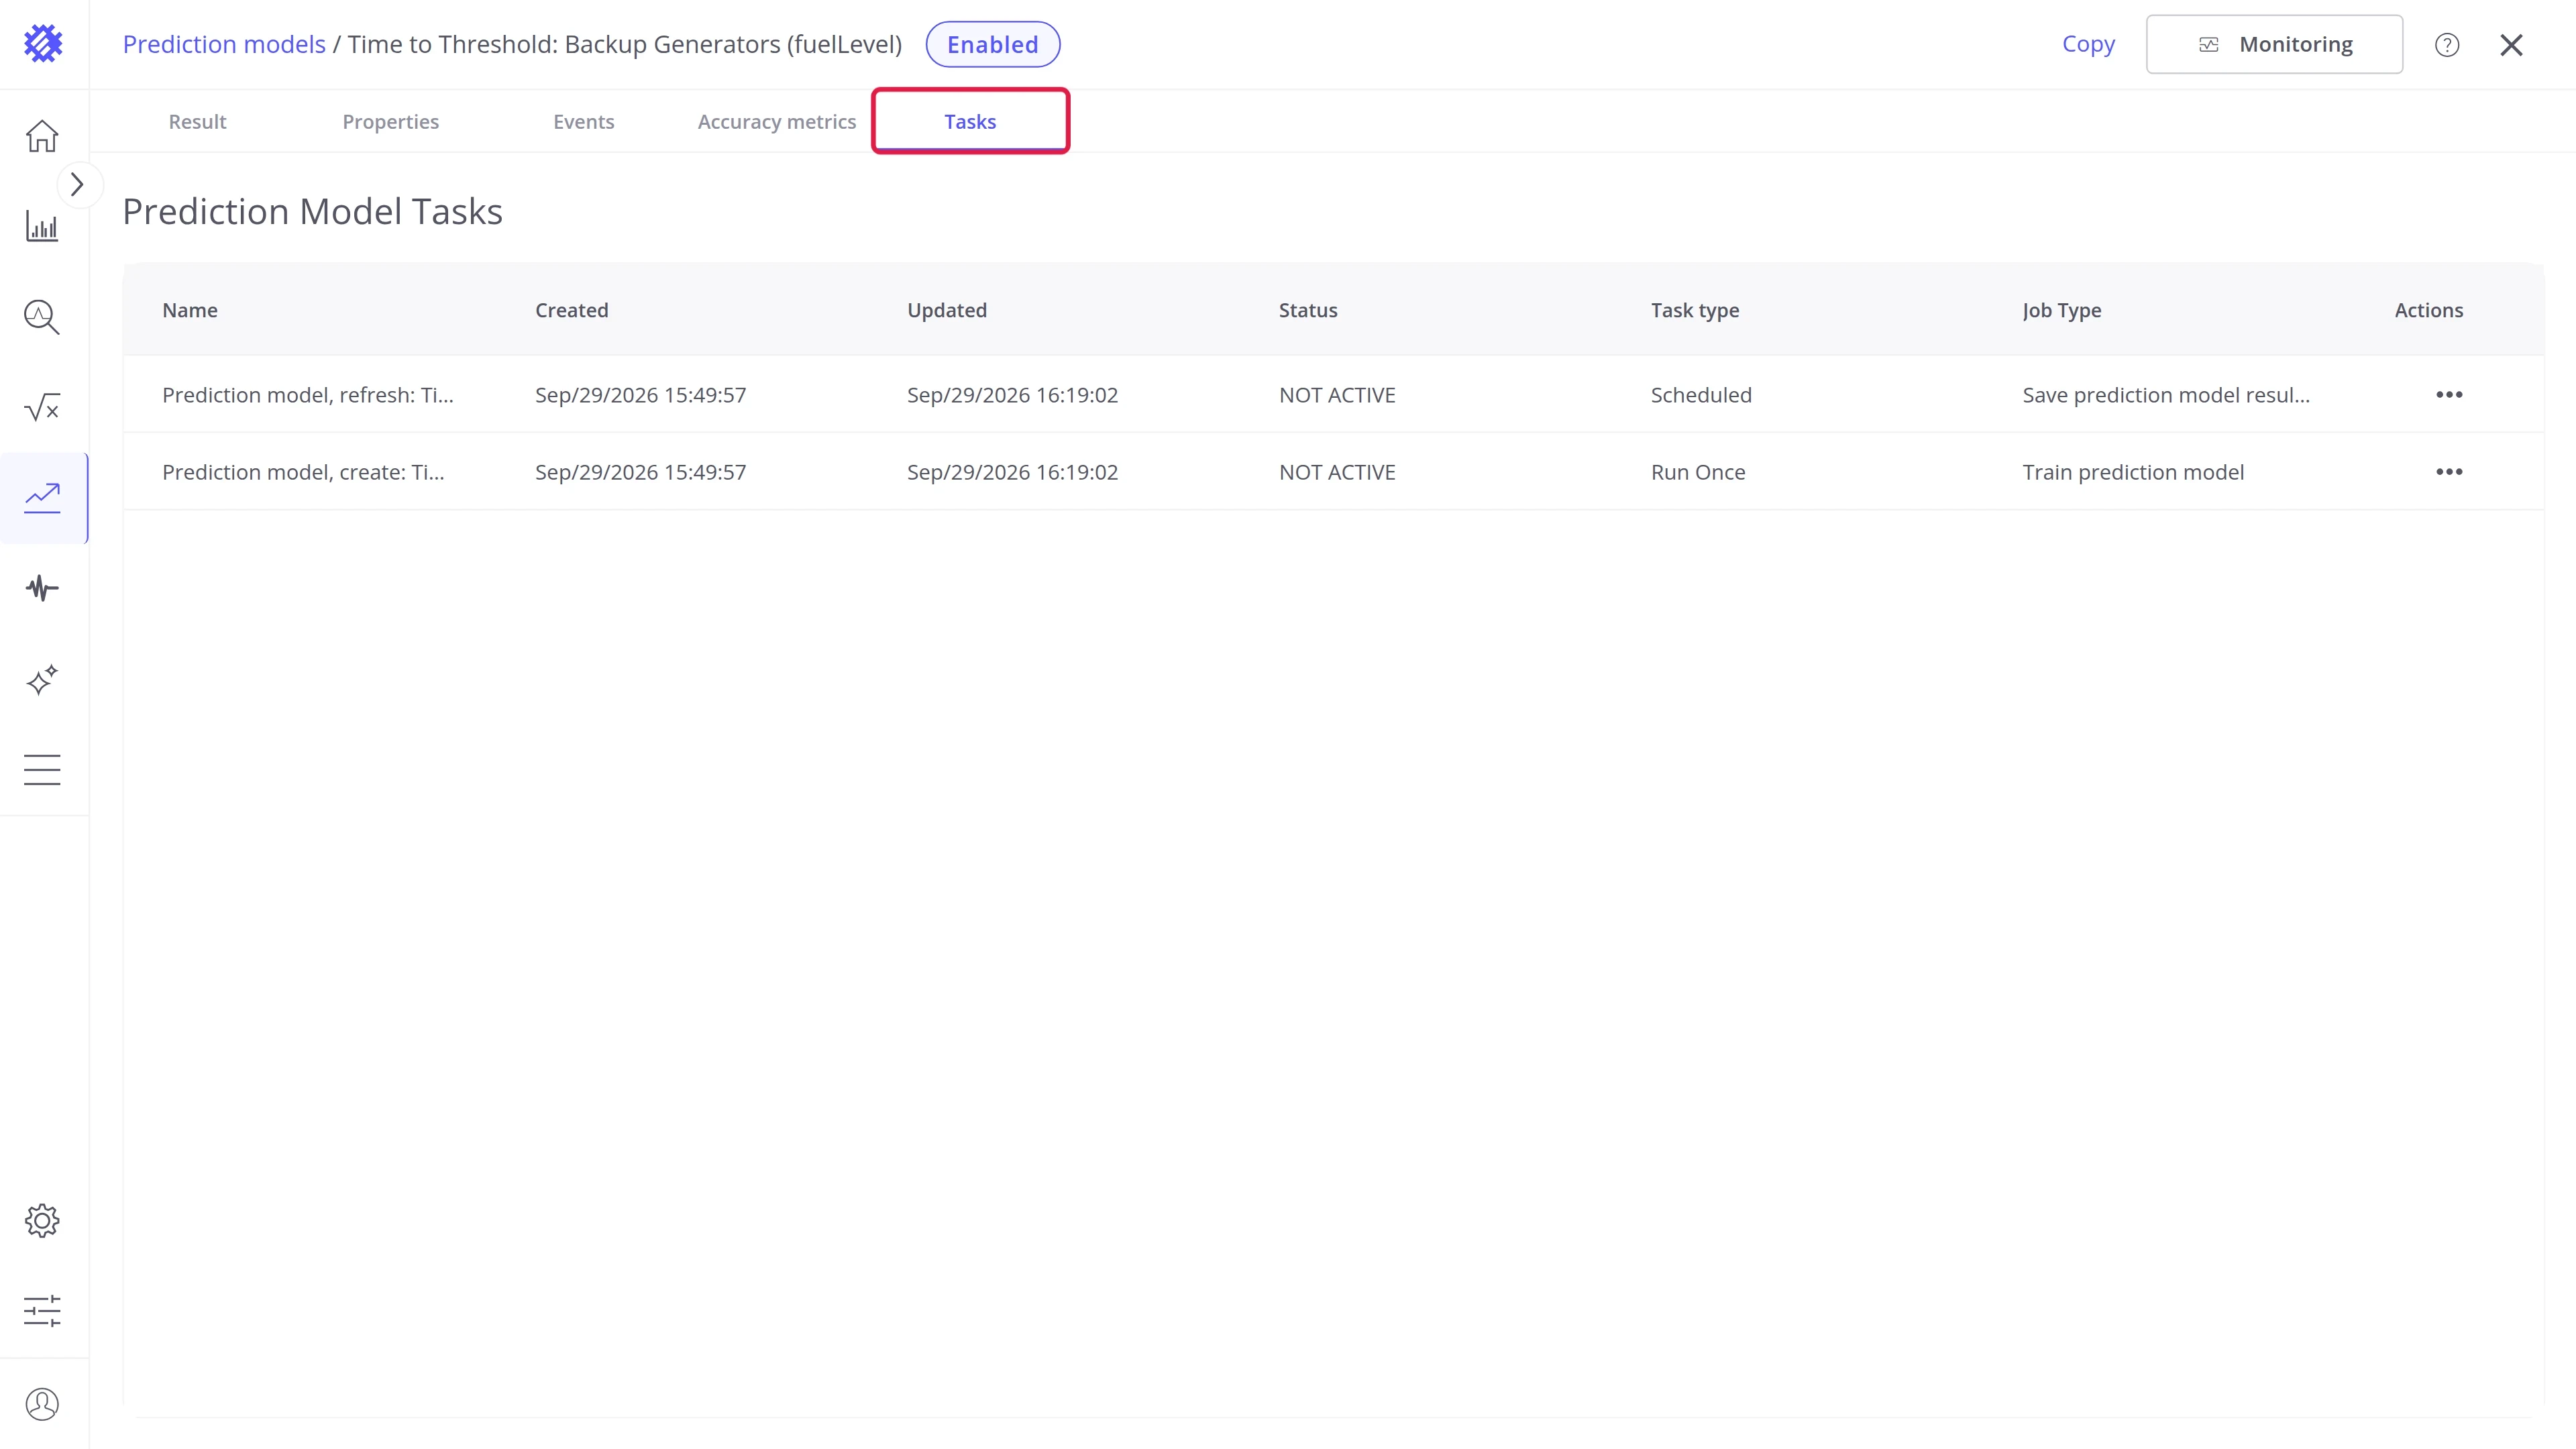
| Column | Description |
|---|---|
| Name | The task and the model, for example Prediction model, refresh: Time to Threshold: Backup Generators (fuelLevel) |
| Created | When the task was created |
| Updated | When the task last changed |
| Status | RUNNING while a run is in progress, NOT ACTIVE between runs |
| Task type | Run Once for training, Scheduled for the periodic refresh |
| Job Type | Train prediction model or Save prediction model result to TB |
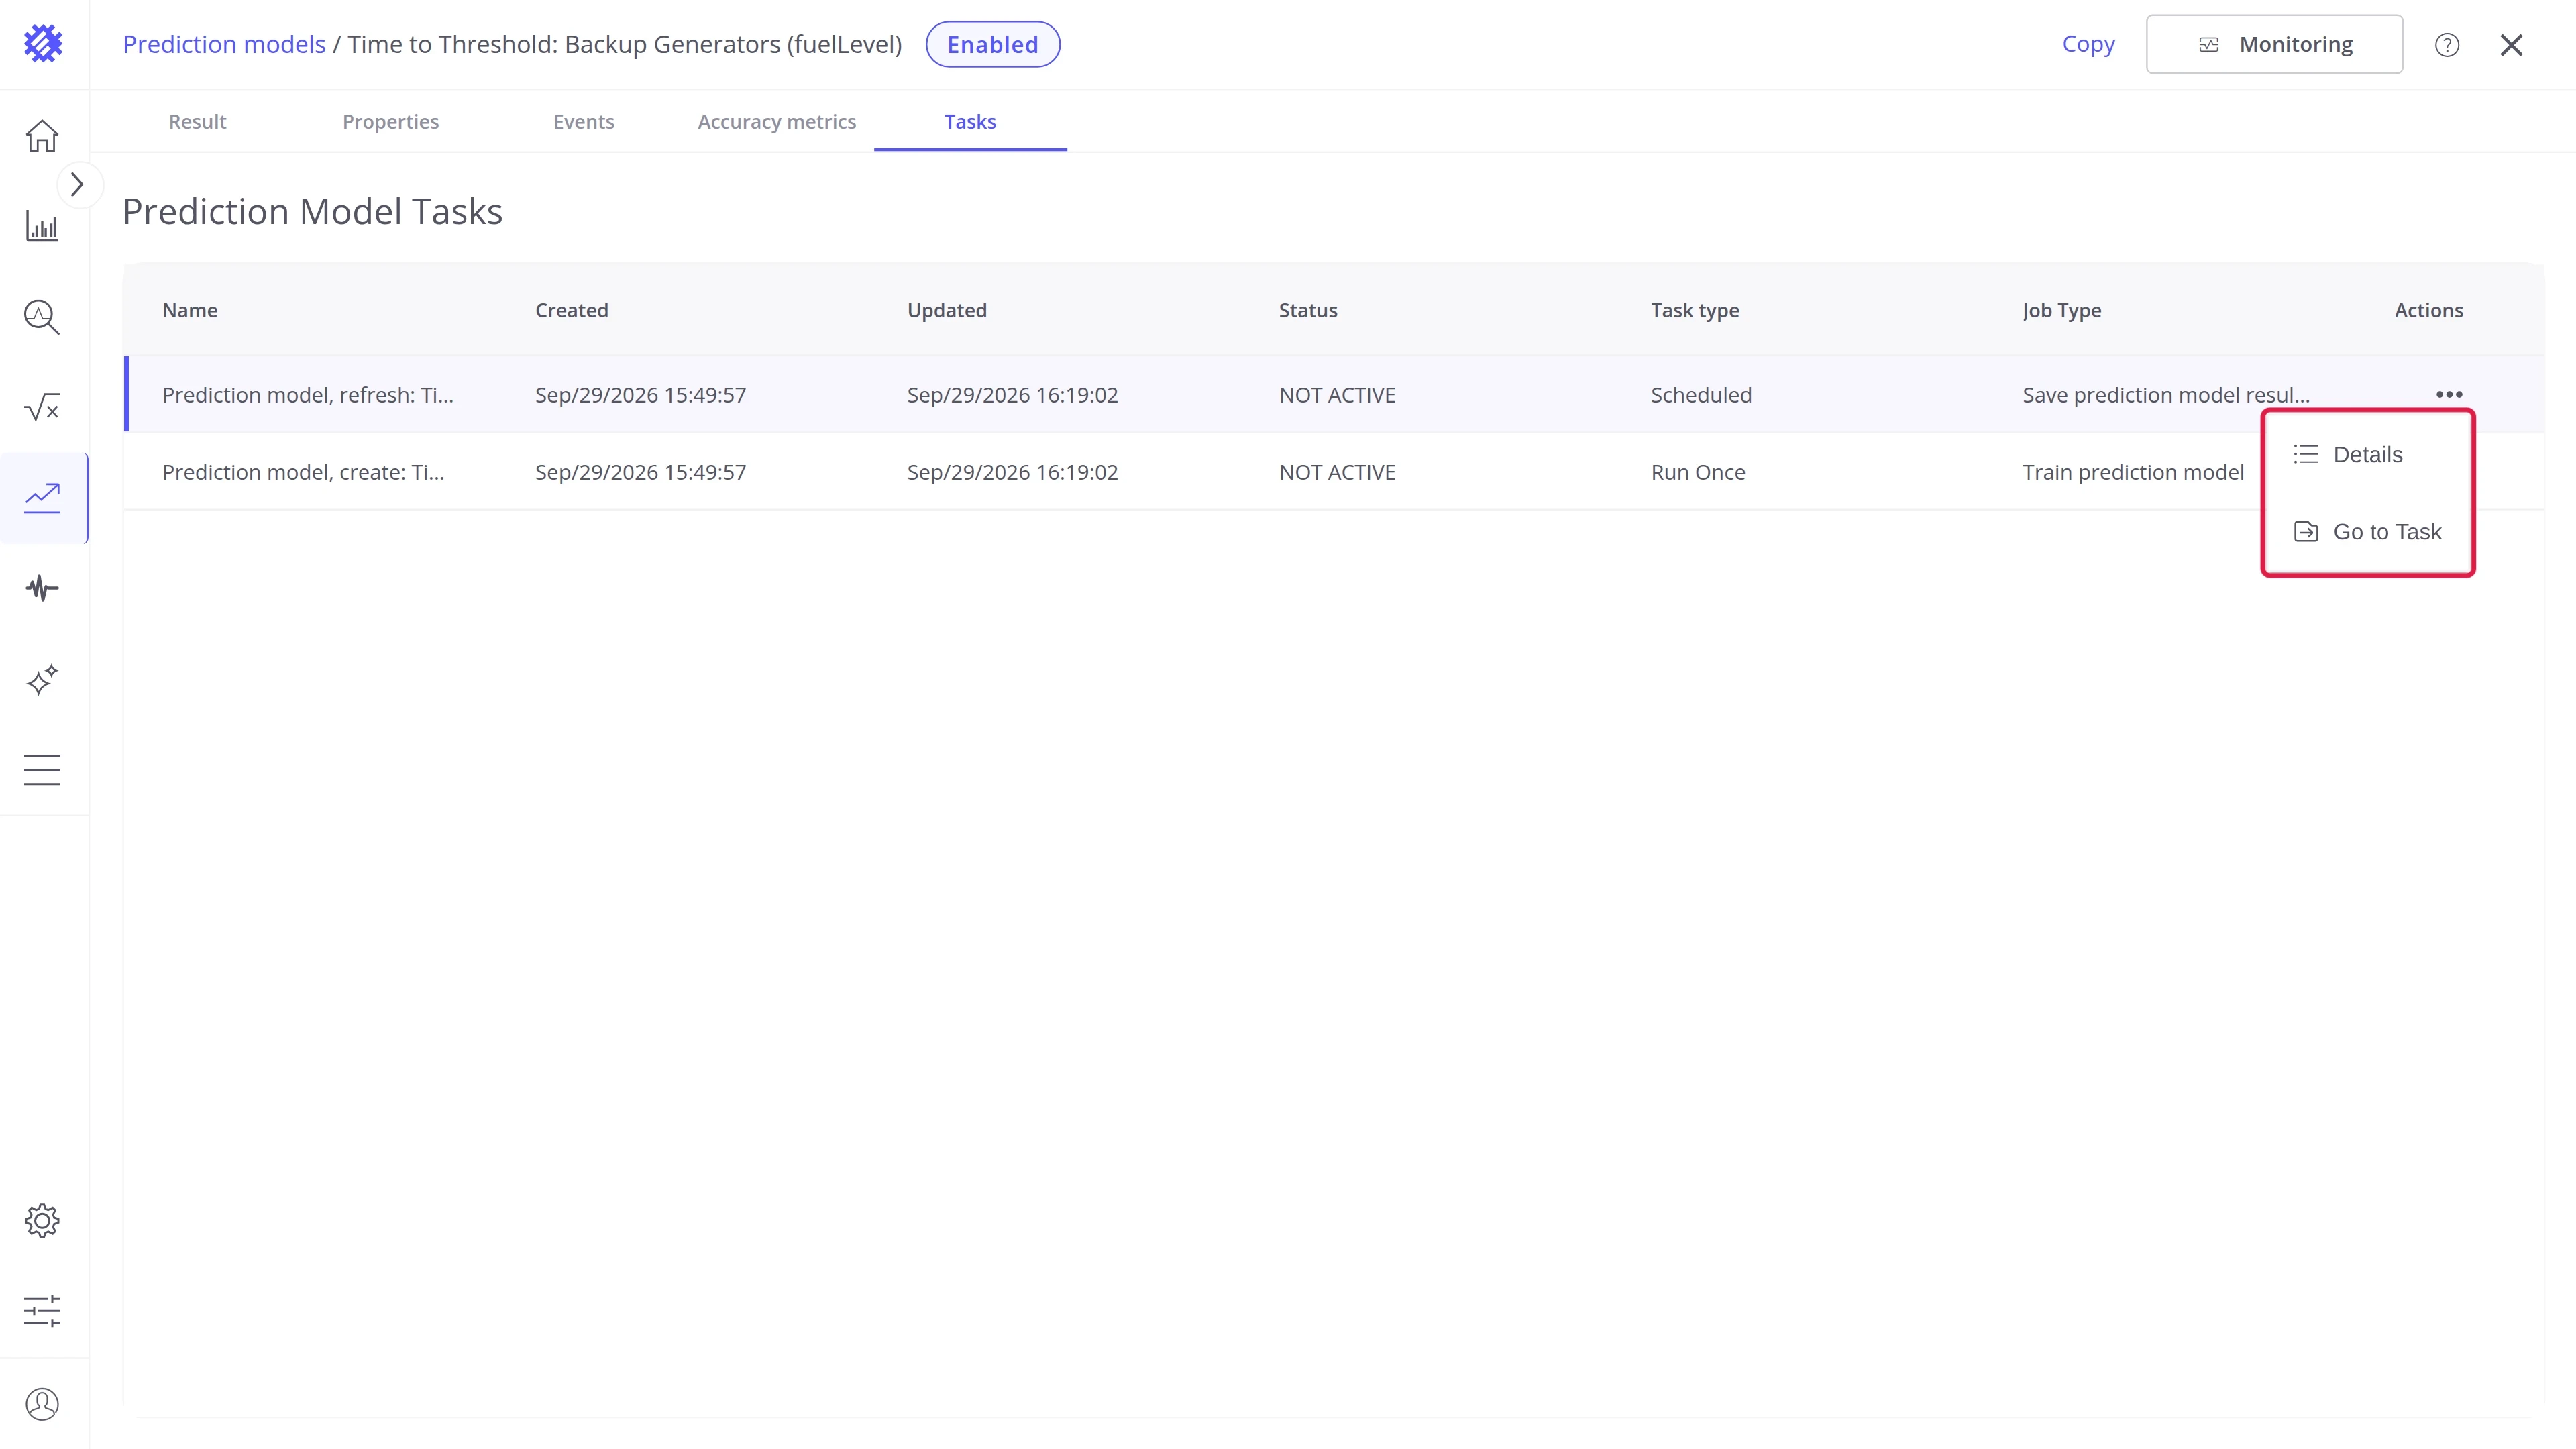
The ⋯ menu at the end of a row holds two actions:
- Details opens the runs of the task: when each started and finished, how long it took, and its status. Clicking the row does the same.
- Go to Task opens the task on the global Tasks page, in a new browser tab. The page is described in Tasks service.
Actions
Section titled “Actions”The top right of the model page holds the actions for the whole model.
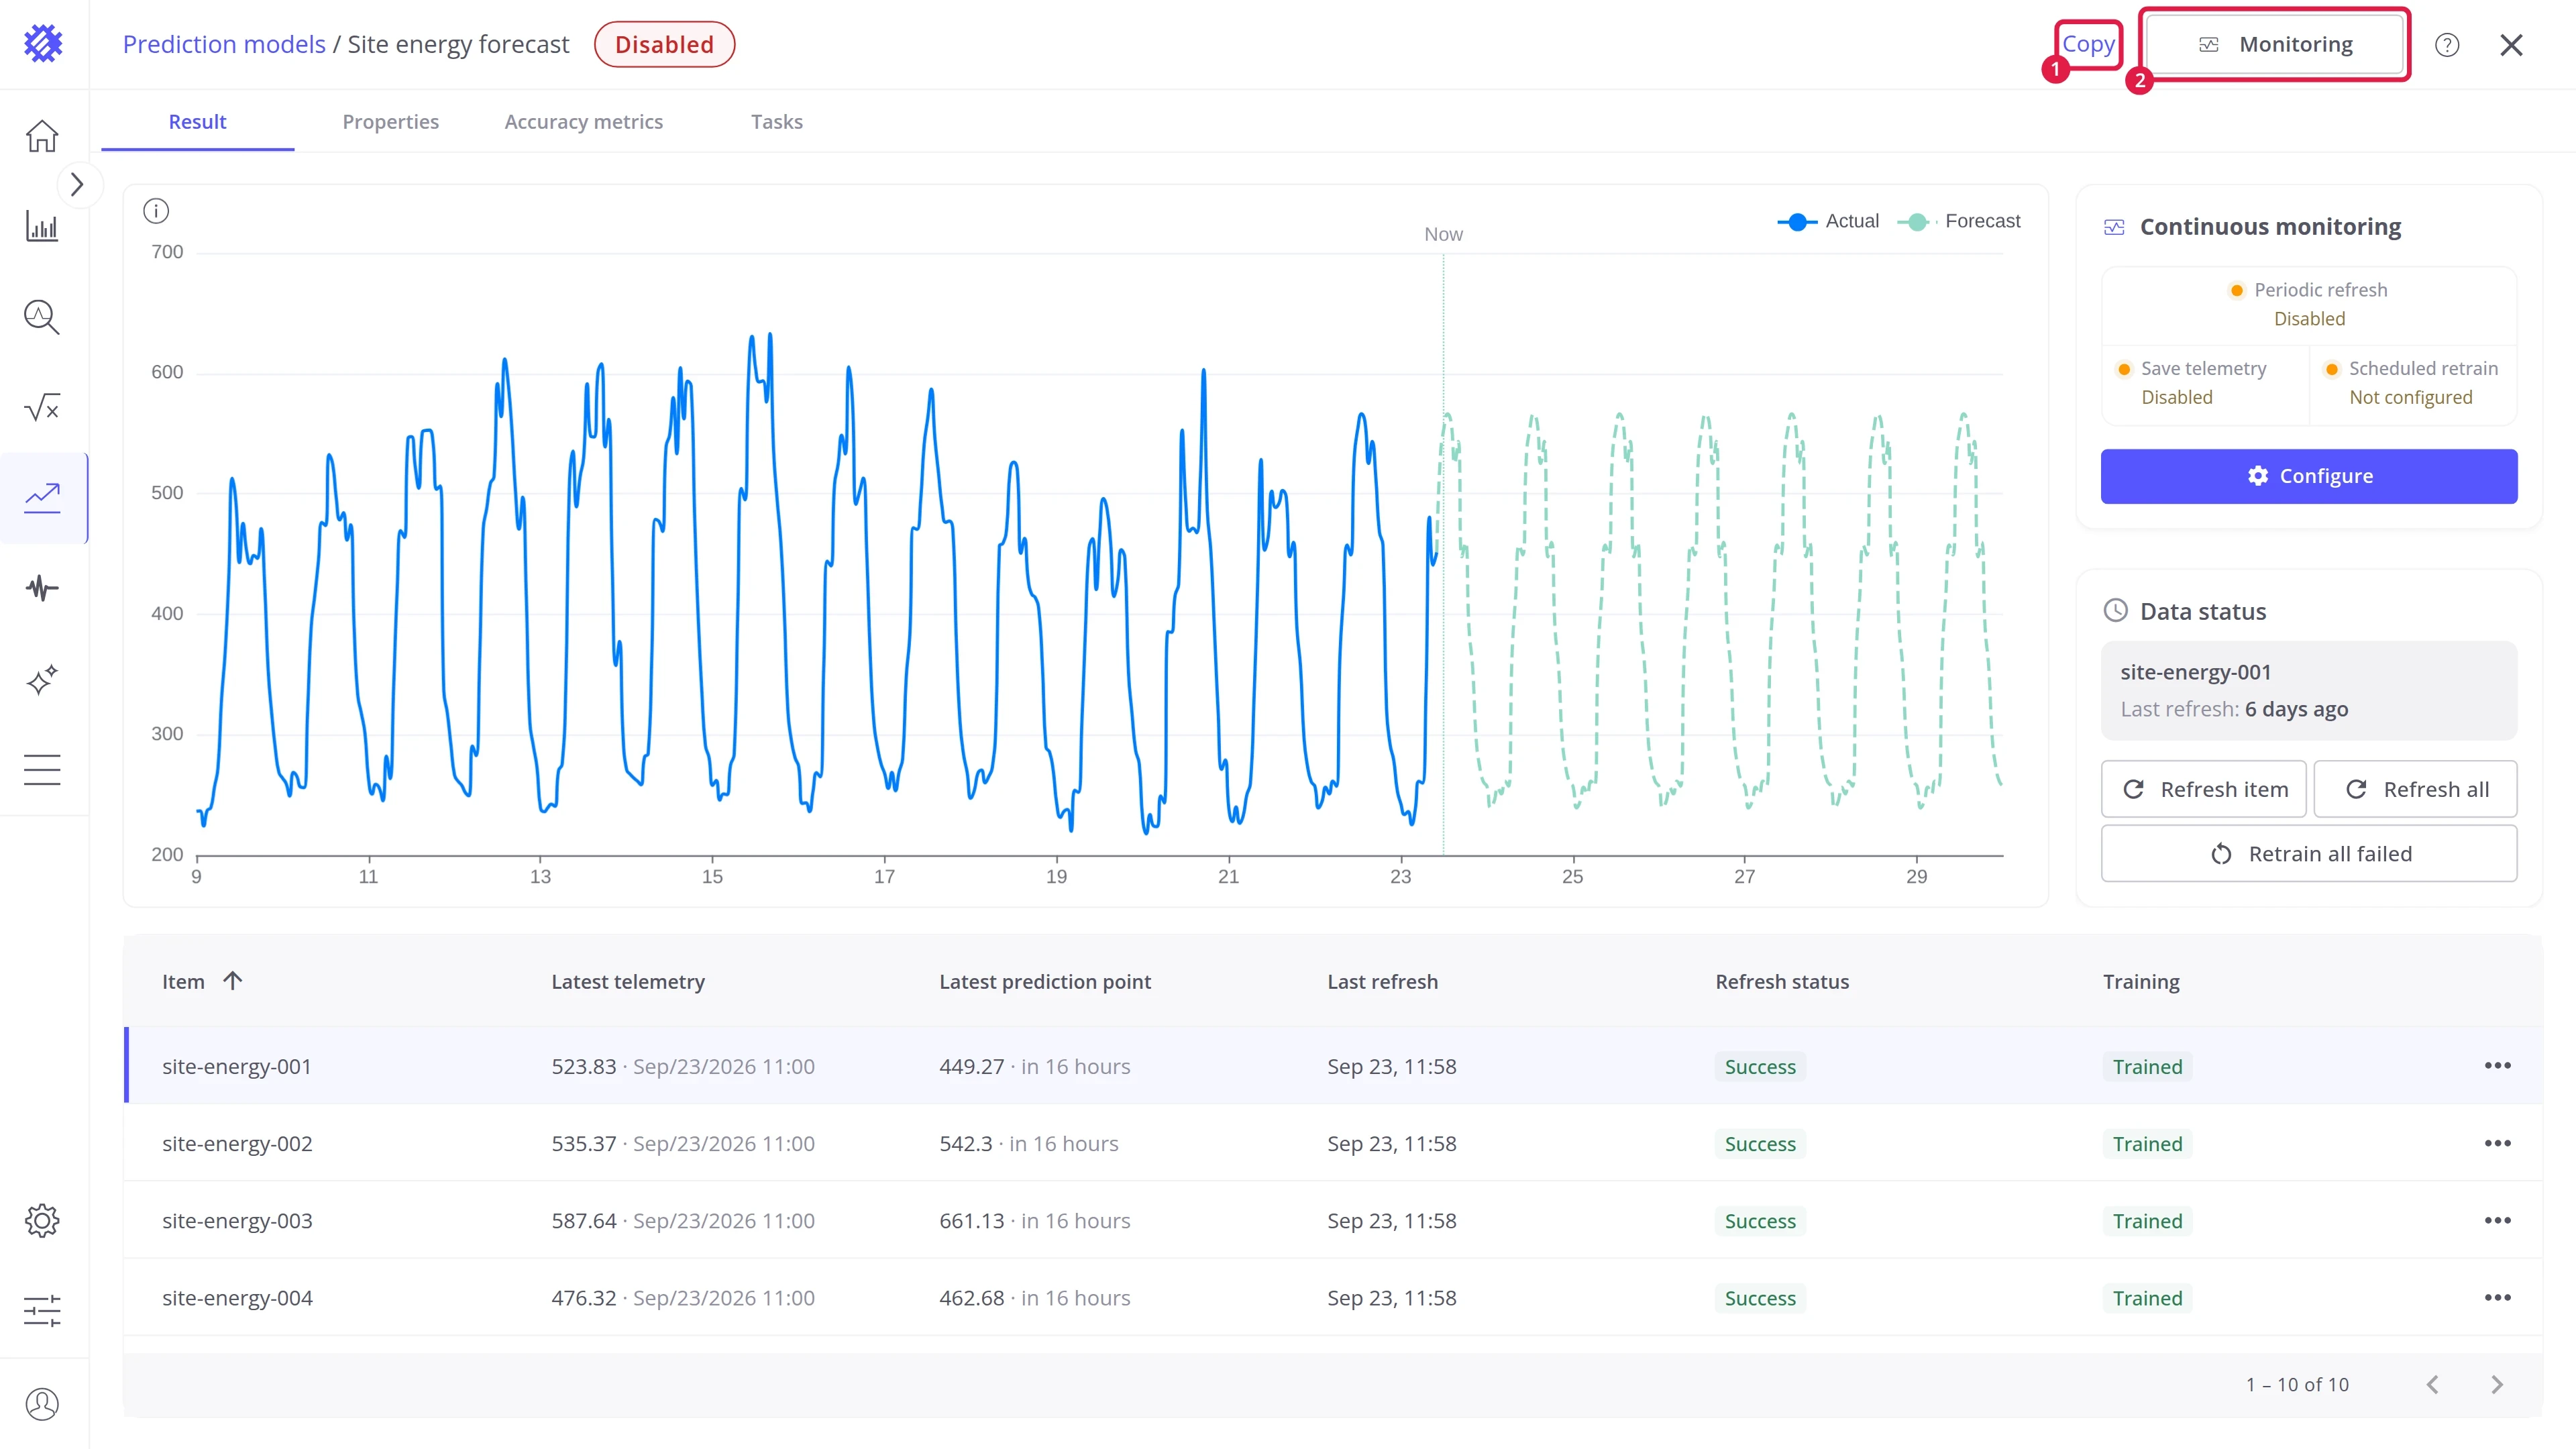
| # | Action | What it does |
|---|---|---|
| 1 | Copy | Creates a copy of the model |
| 2 | Monitoring | Turns on refreshing on a schedule, retraining, saving to ThingsBoard, and alarms |
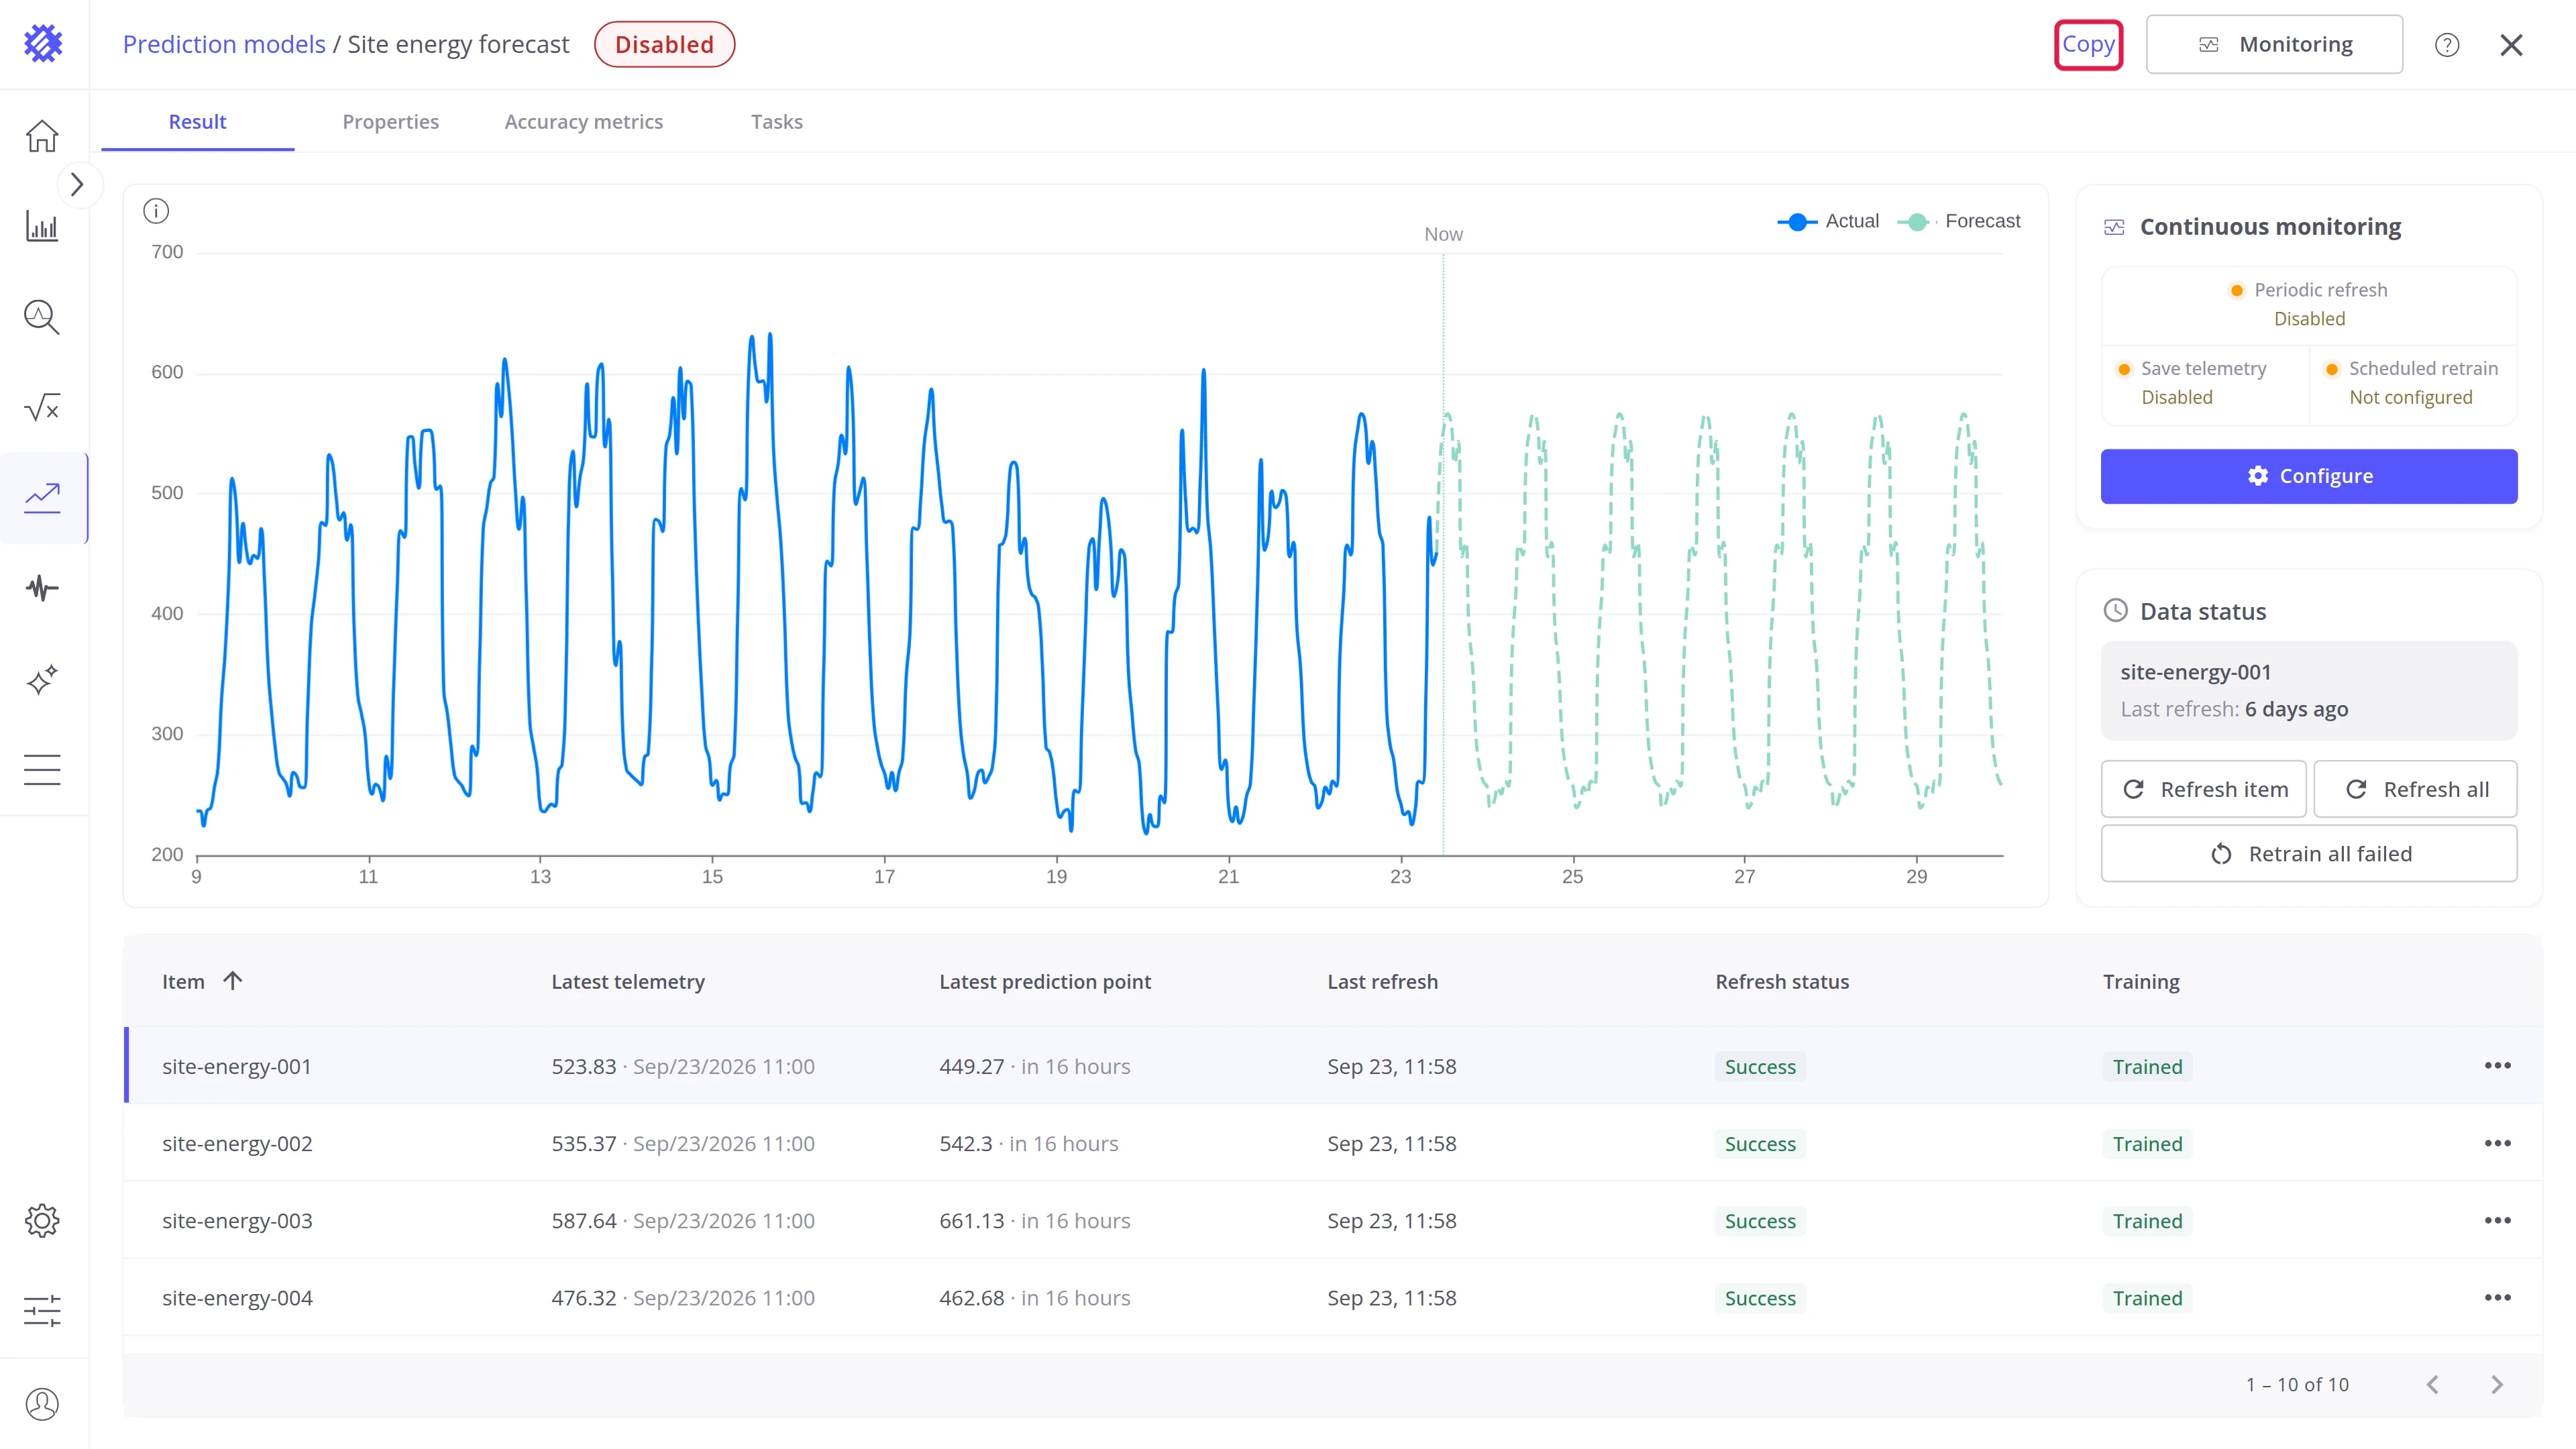
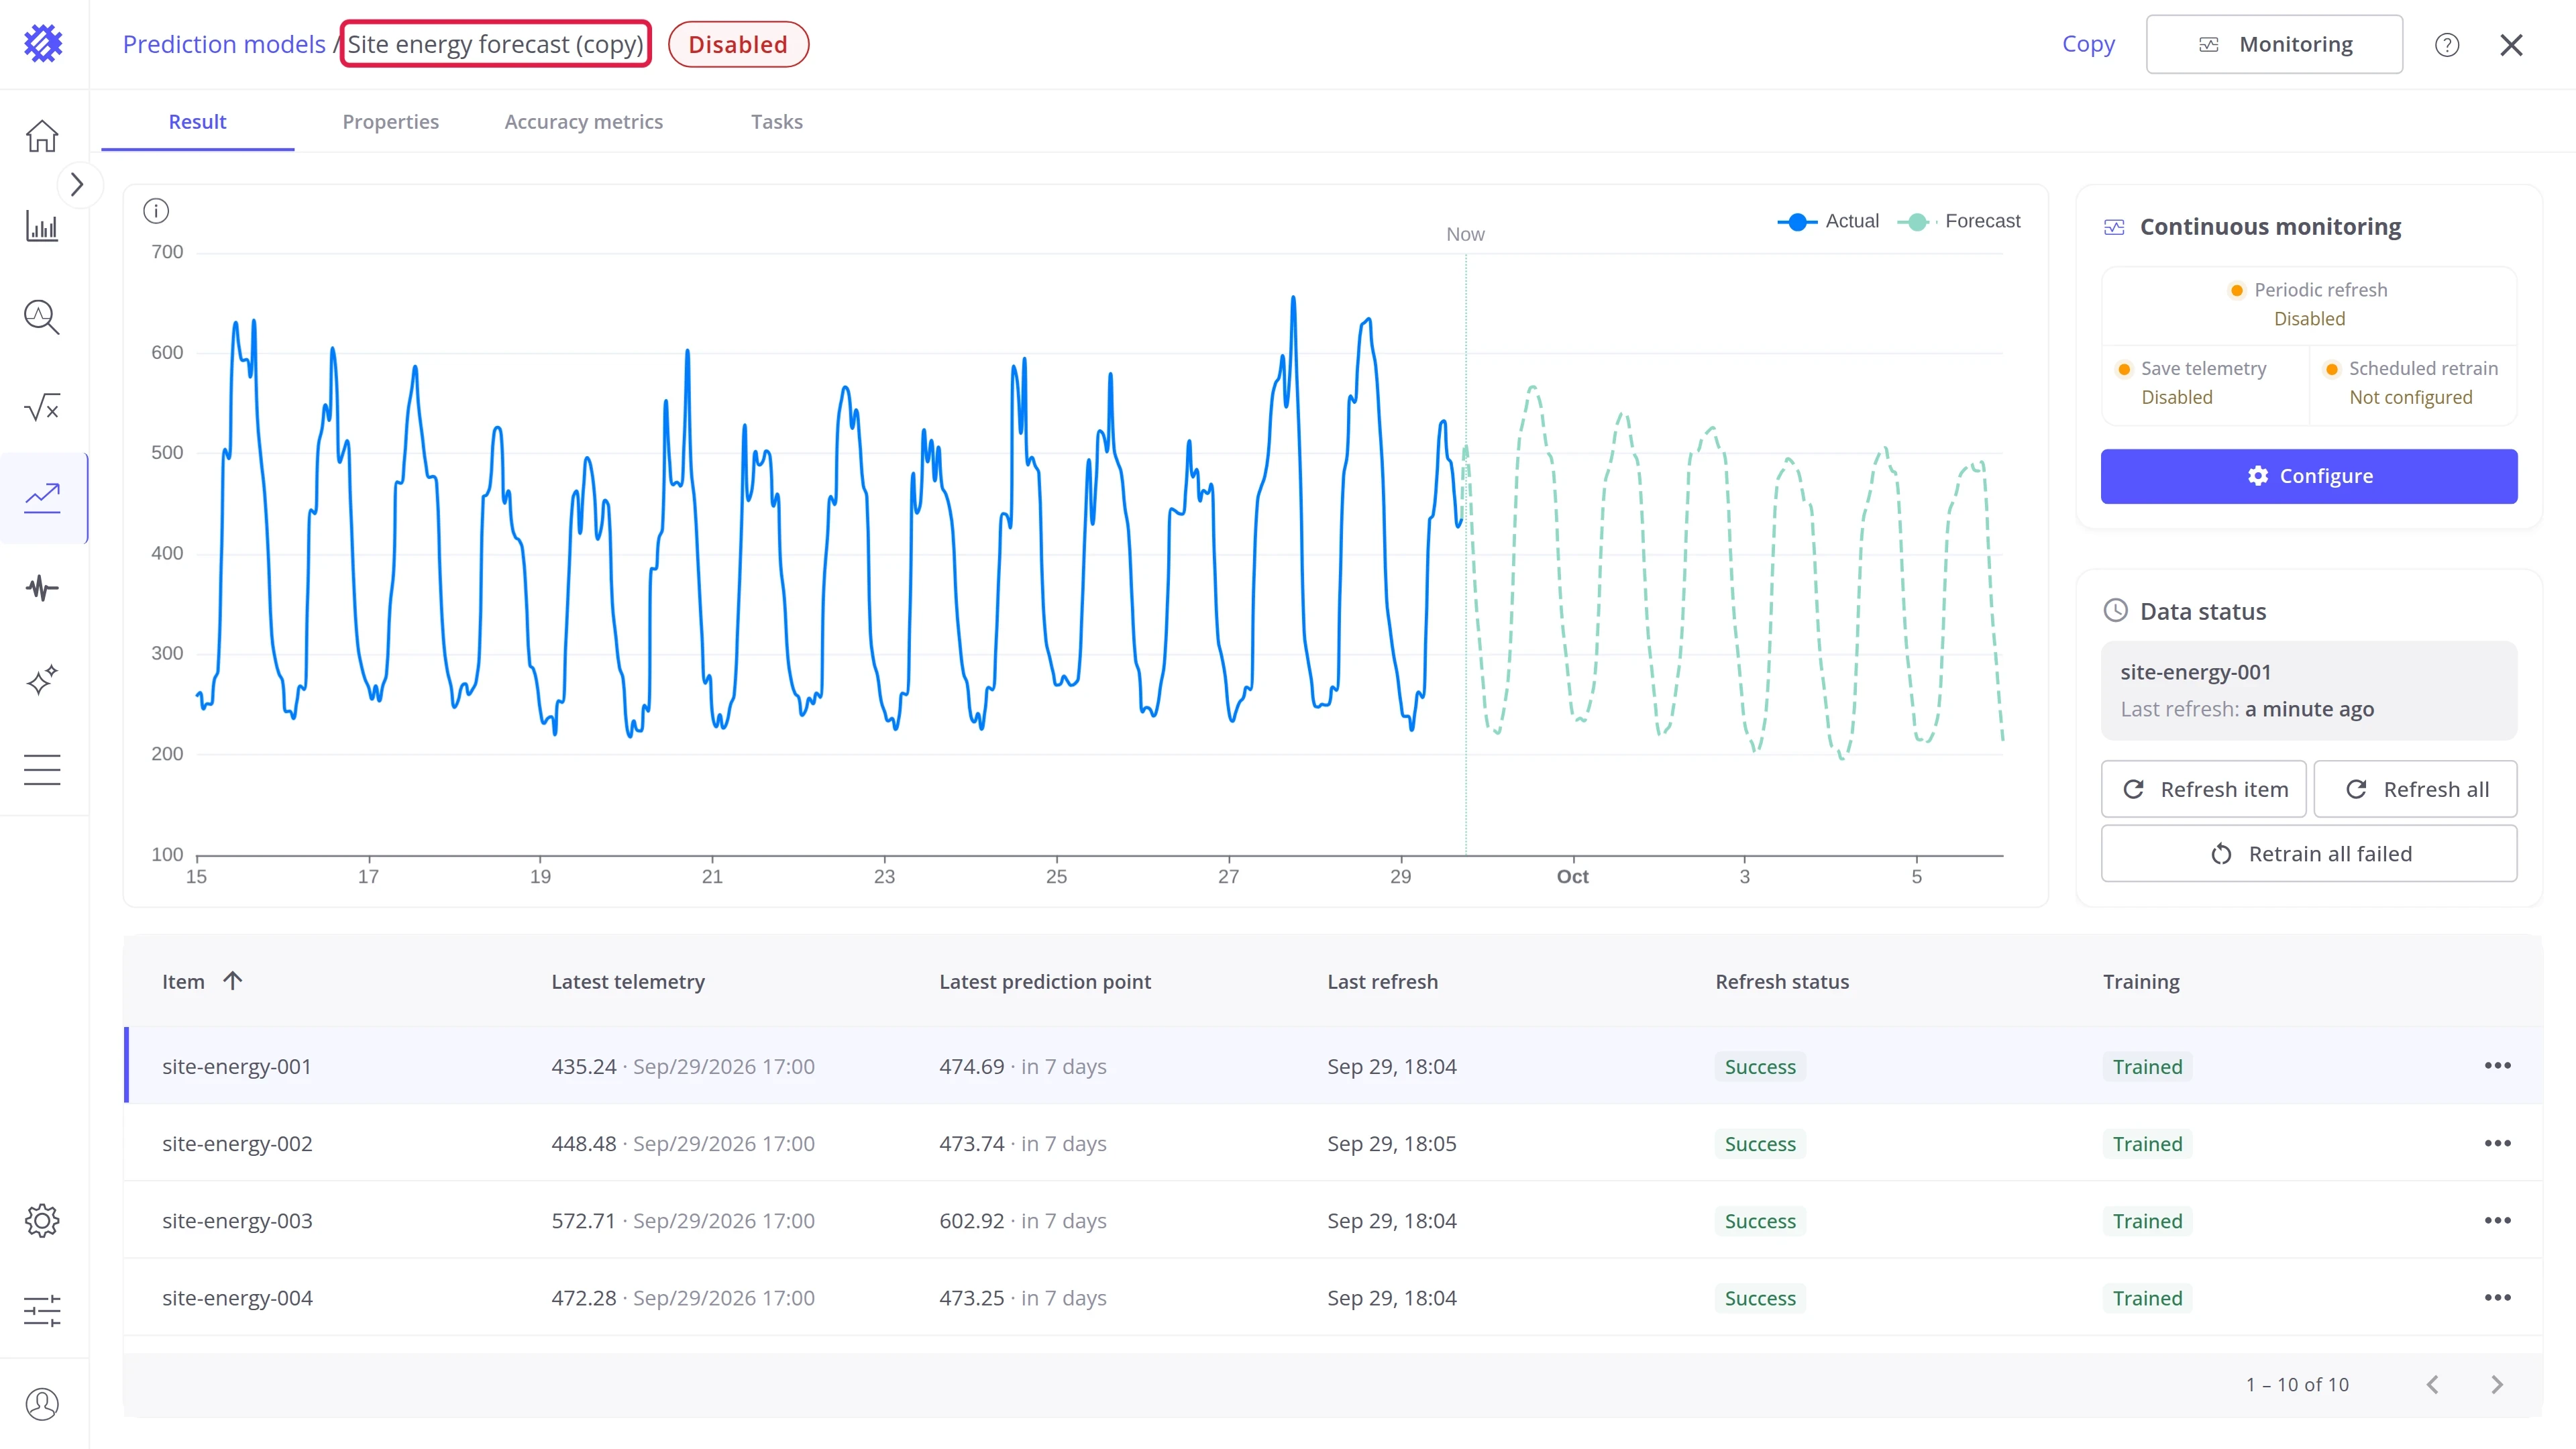
Create a copy of the model, for example to try another setting without touching the model in use.
- Click Copy in the page header.
- The copy opens in a new browser tab, named with (copy) at the end.
Monitoring
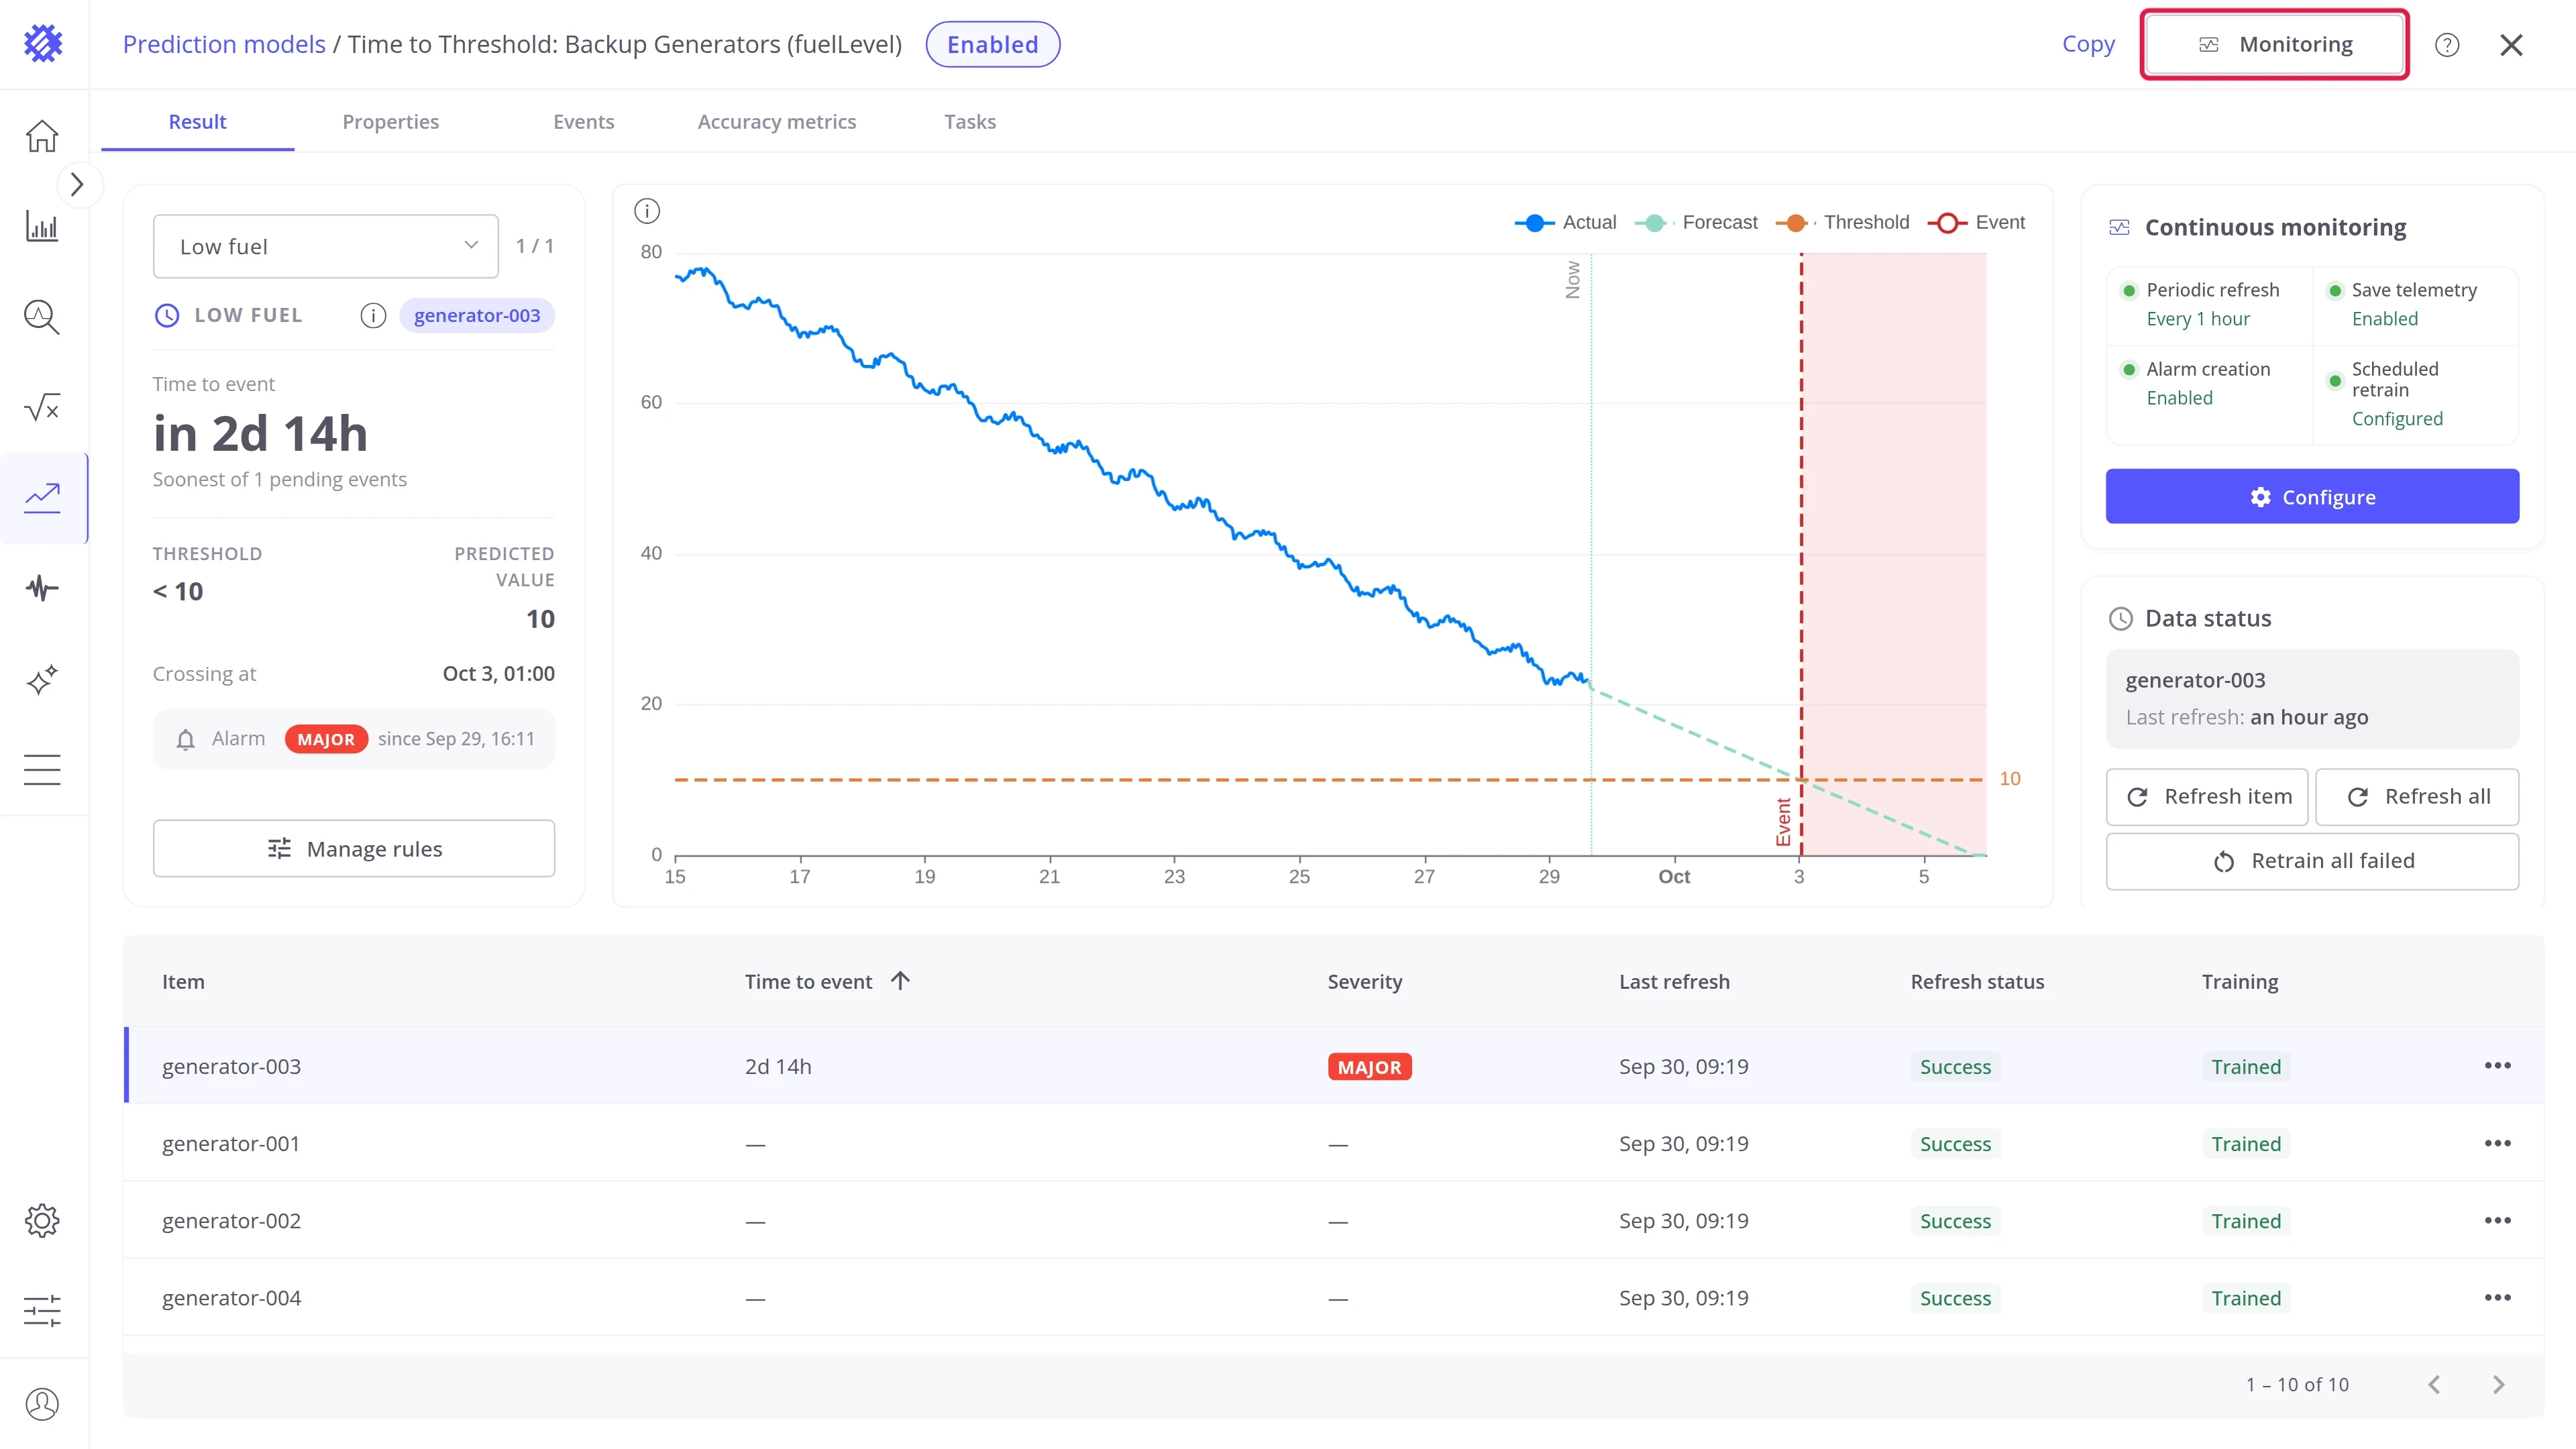
Section titled “Monitoring”Set how the model keeps working on its own: refreshing on a schedule, retraining, saving predictions to ThingsBoard, and raising alarms. Click Monitoring in the page header, switch on what you need, and click Save changes. Each switch is described in Monitoring & Alarms.
Where to go next
Section titled “Where to go next”Explore intents
Section titled “Explore intents”-
Forecast
Predict the next values of a metric, like the energy of the next 7 days.
-
Time to Threshold
Predict when a metric crosses a limit, and raise an alarm before it happens.
-
Period Total
Predict the total, peak, or average of a period, such as the energy of this month.
-
Hit Target
Predict whether a goal is reached by the end of a period, and how far off it is.
Explore more
Section titled “Explore more”Was this helpful?