Vibration Monitoring Tab: Trends & Alarms
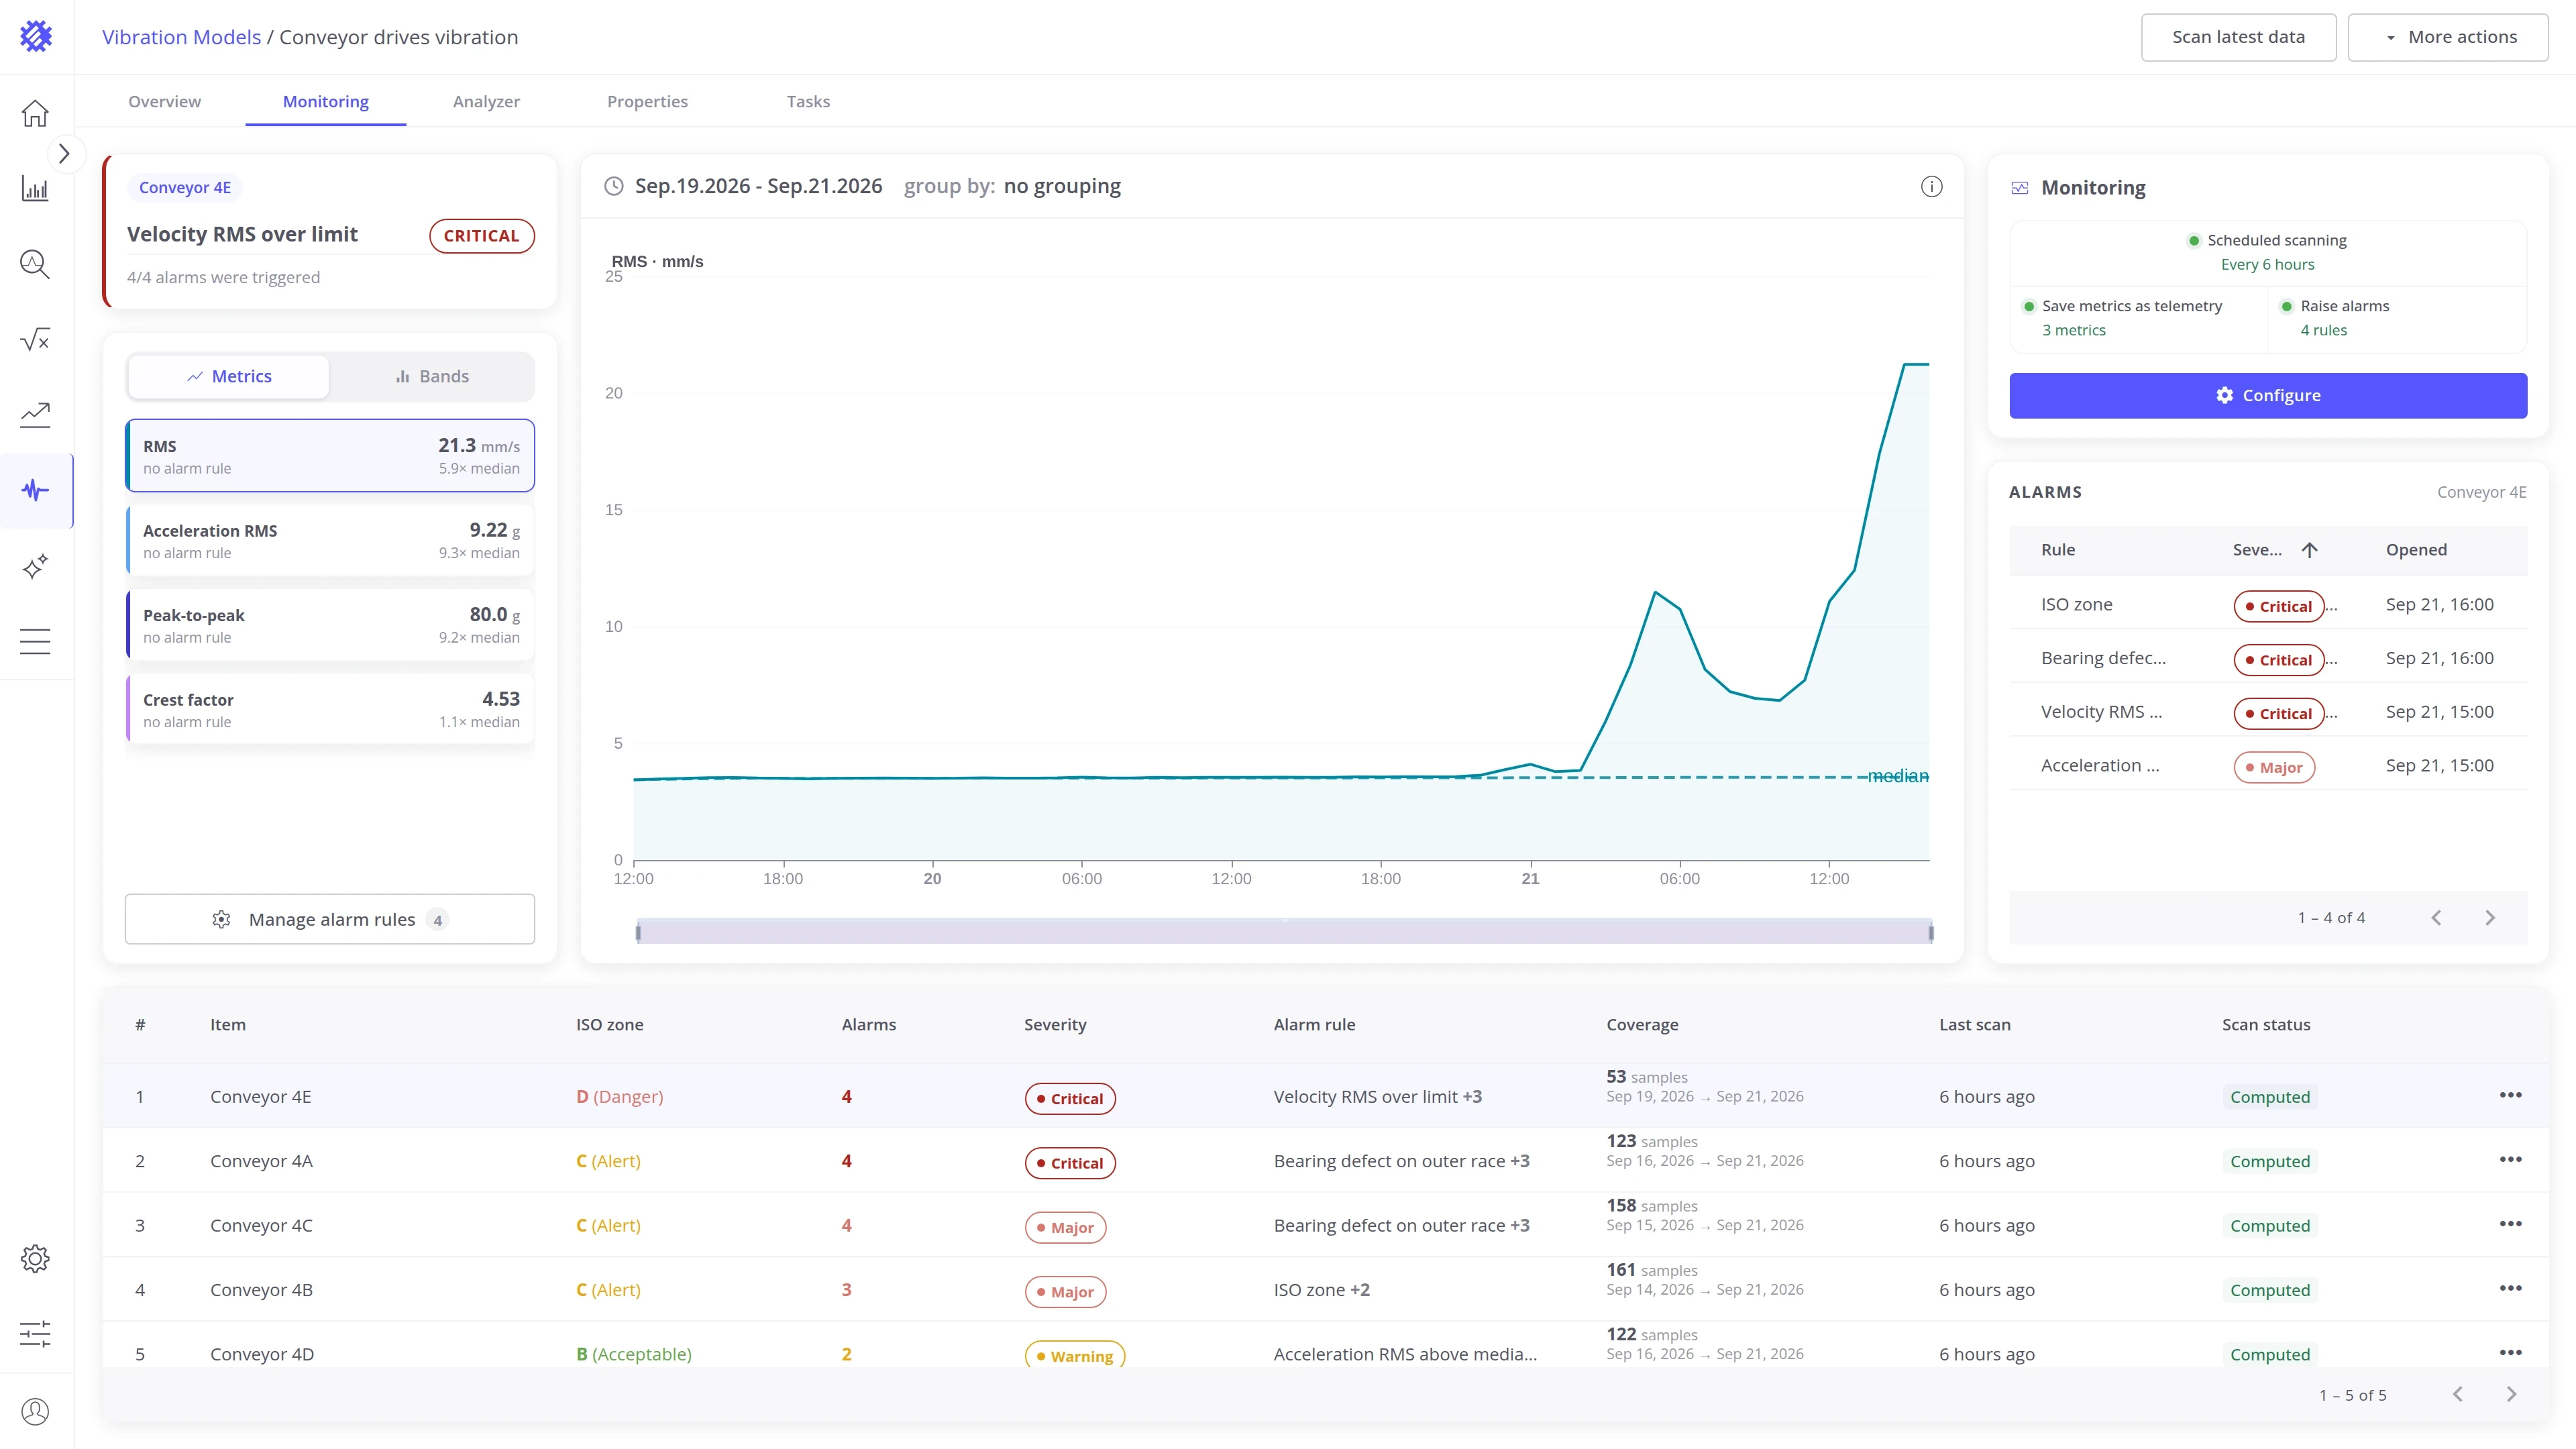
The Monitoring tab answers whether a machine is getting worse, and since when. The Overview tab grades the latest sample; this tab follows each machine over time against its own median and against the alarm rules of the model, and lists every alarm the rules have raised.
Open it when an alarm arrives in ThingsBoard, to see which series broke which rule and how long it has been open, or to check that the schedule, the telemetry, and the alarms are running for the whole fleet.
Layout
Section titled “Layout”Pick a machine in the items table, and every card above it switches to that machine.
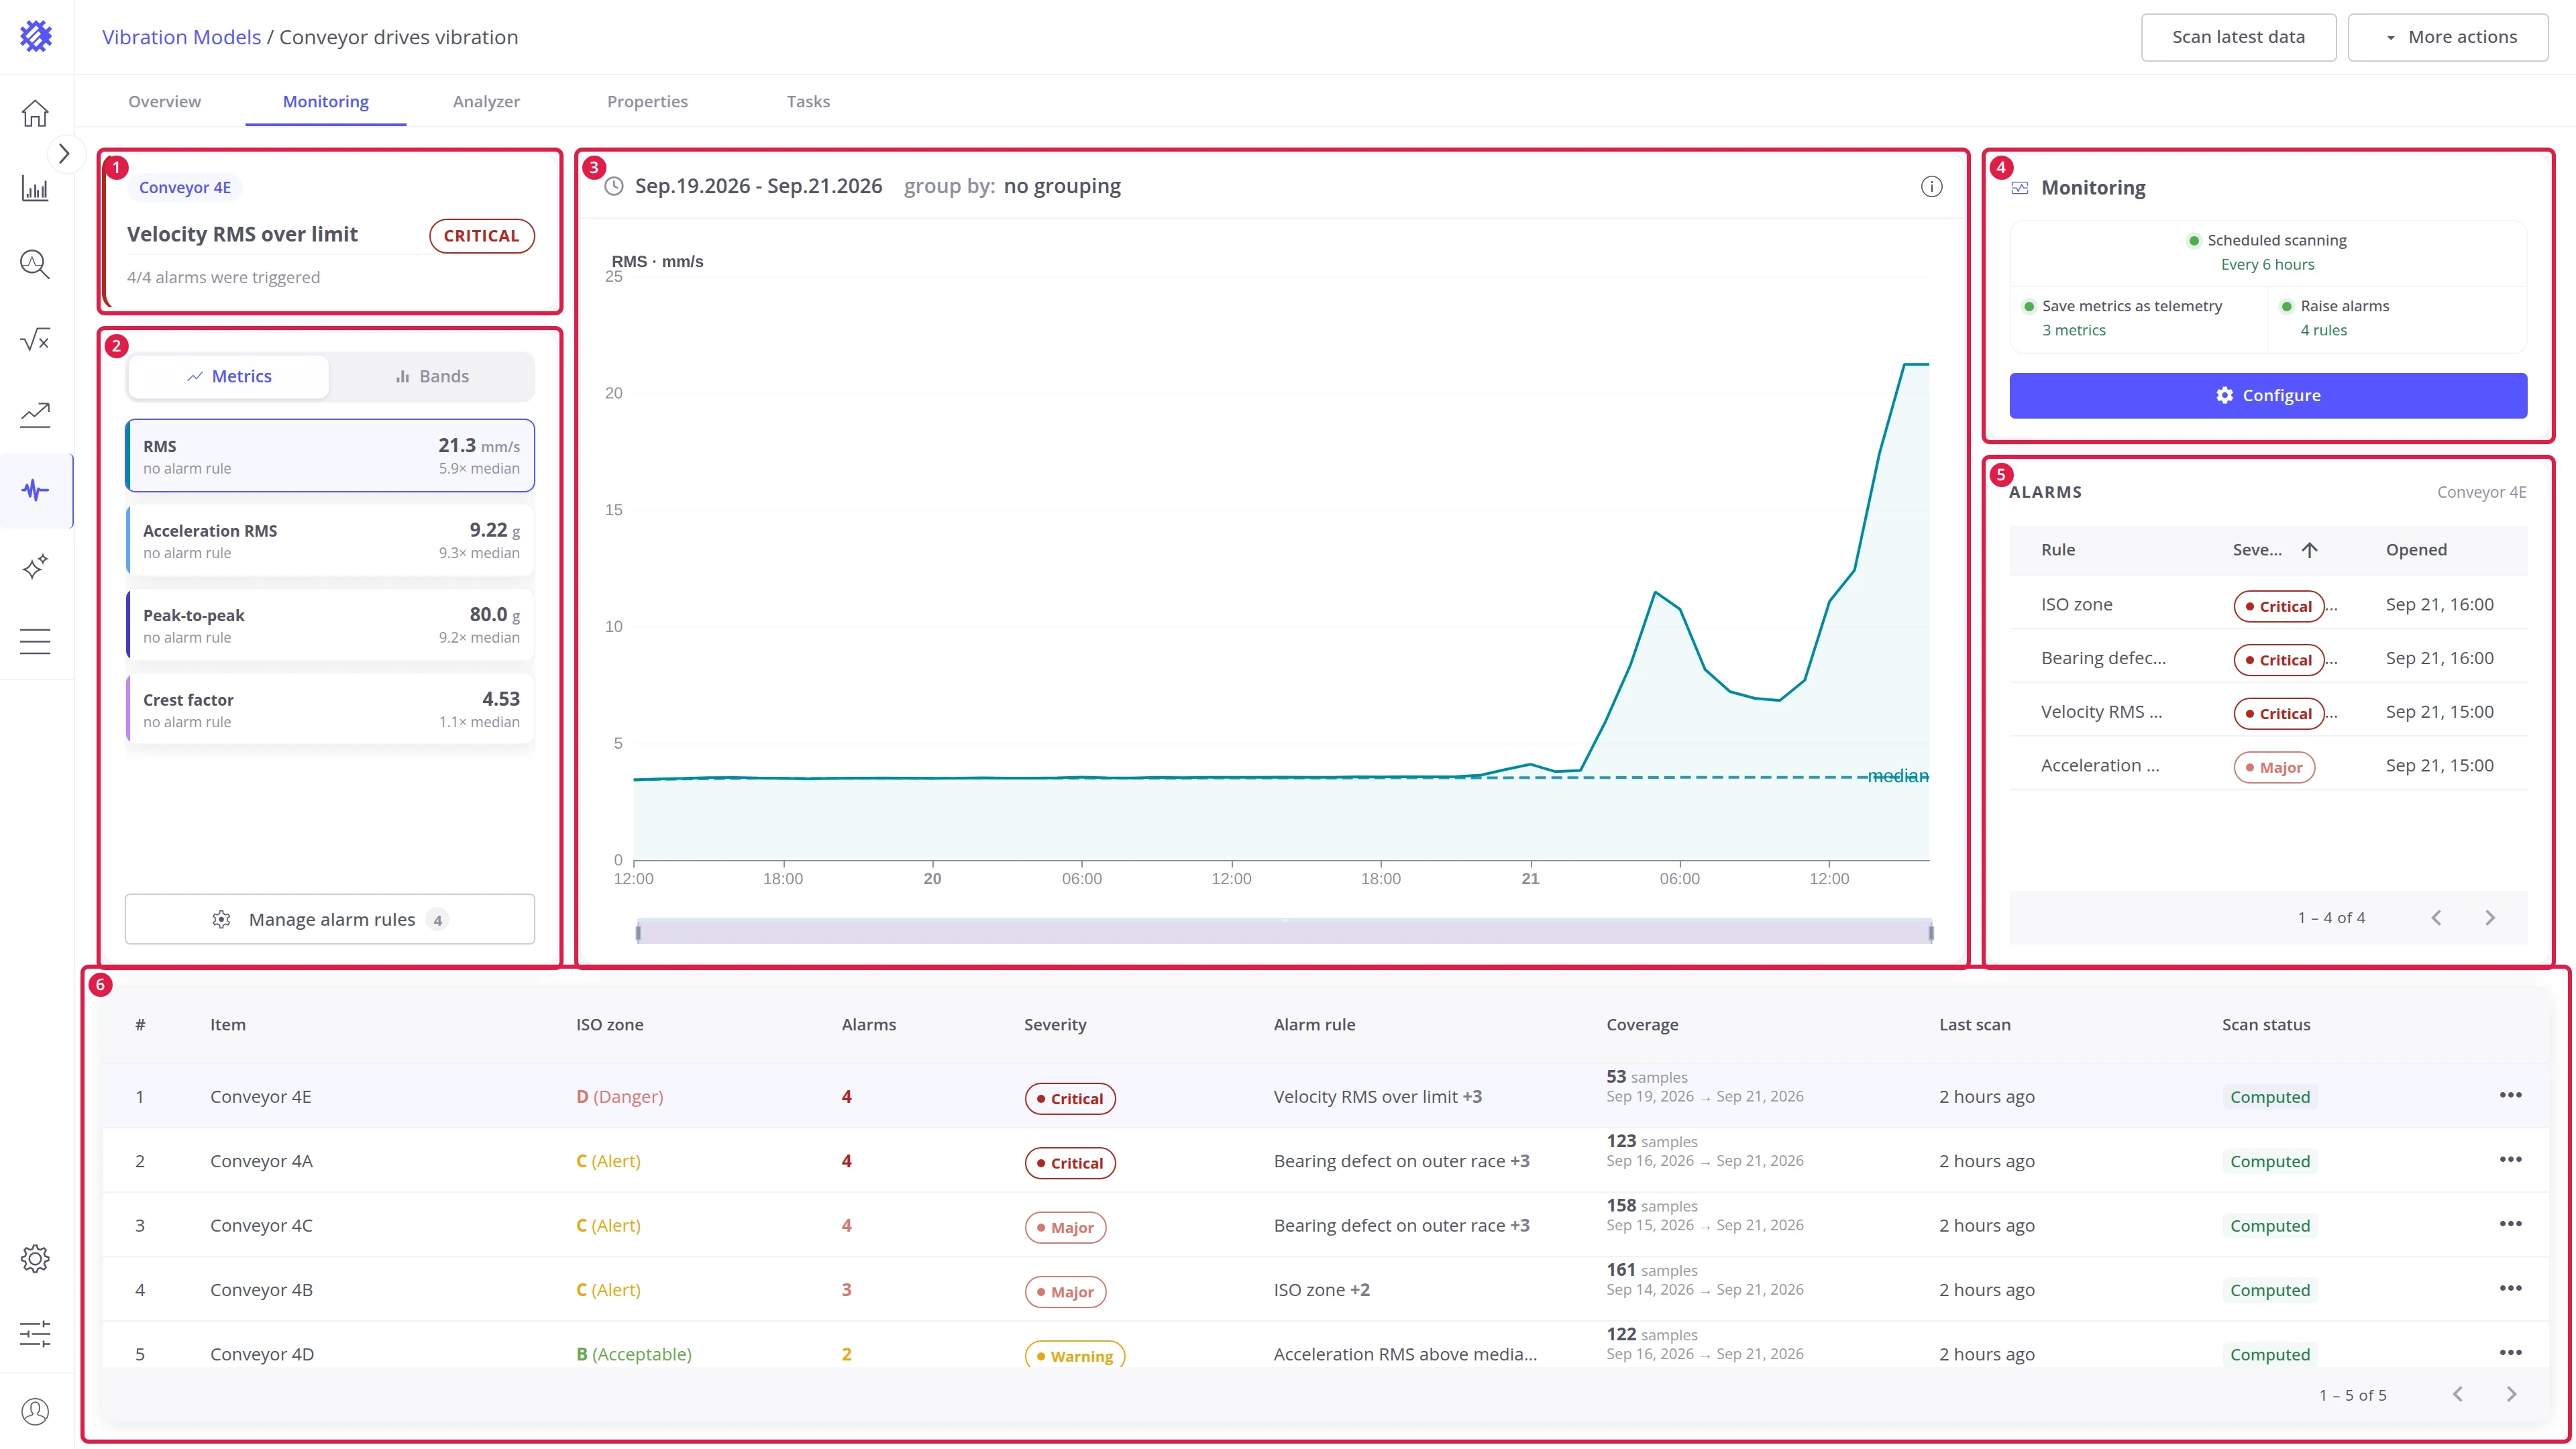
| # | Area | Contents |
|---|---|---|
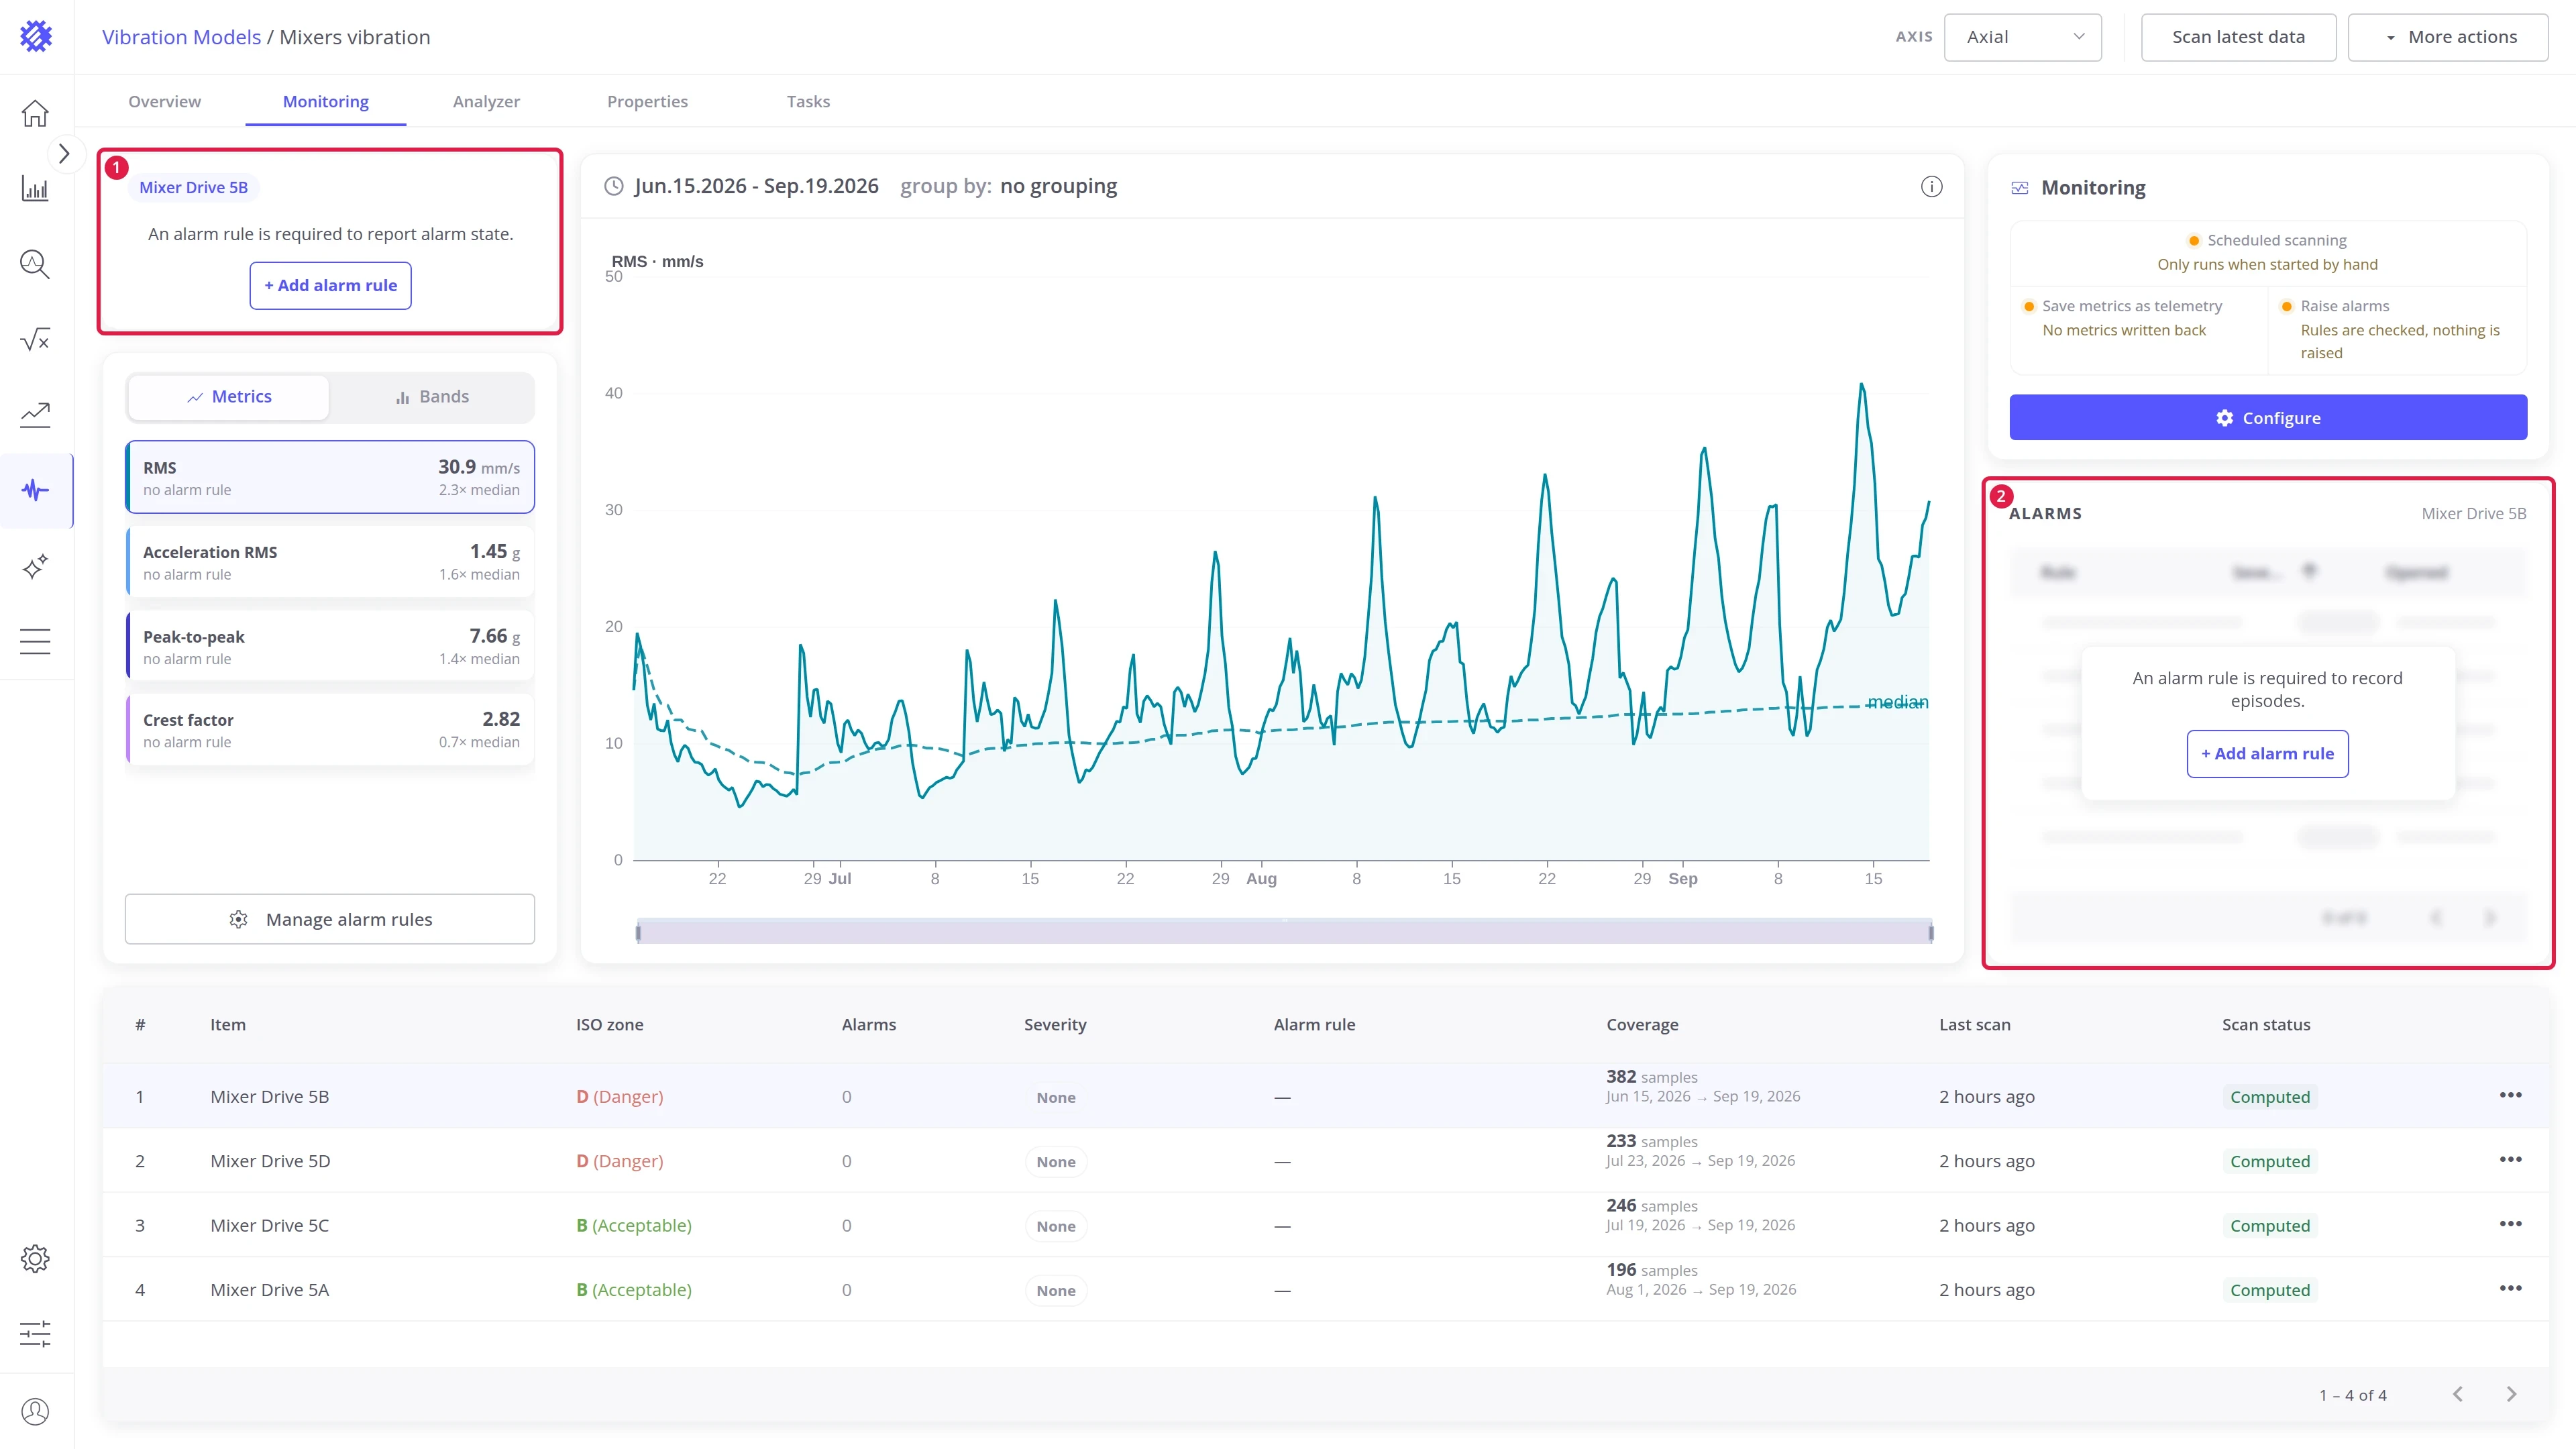
| 1 | Alarm state | The worst alarm open on the selected machine |
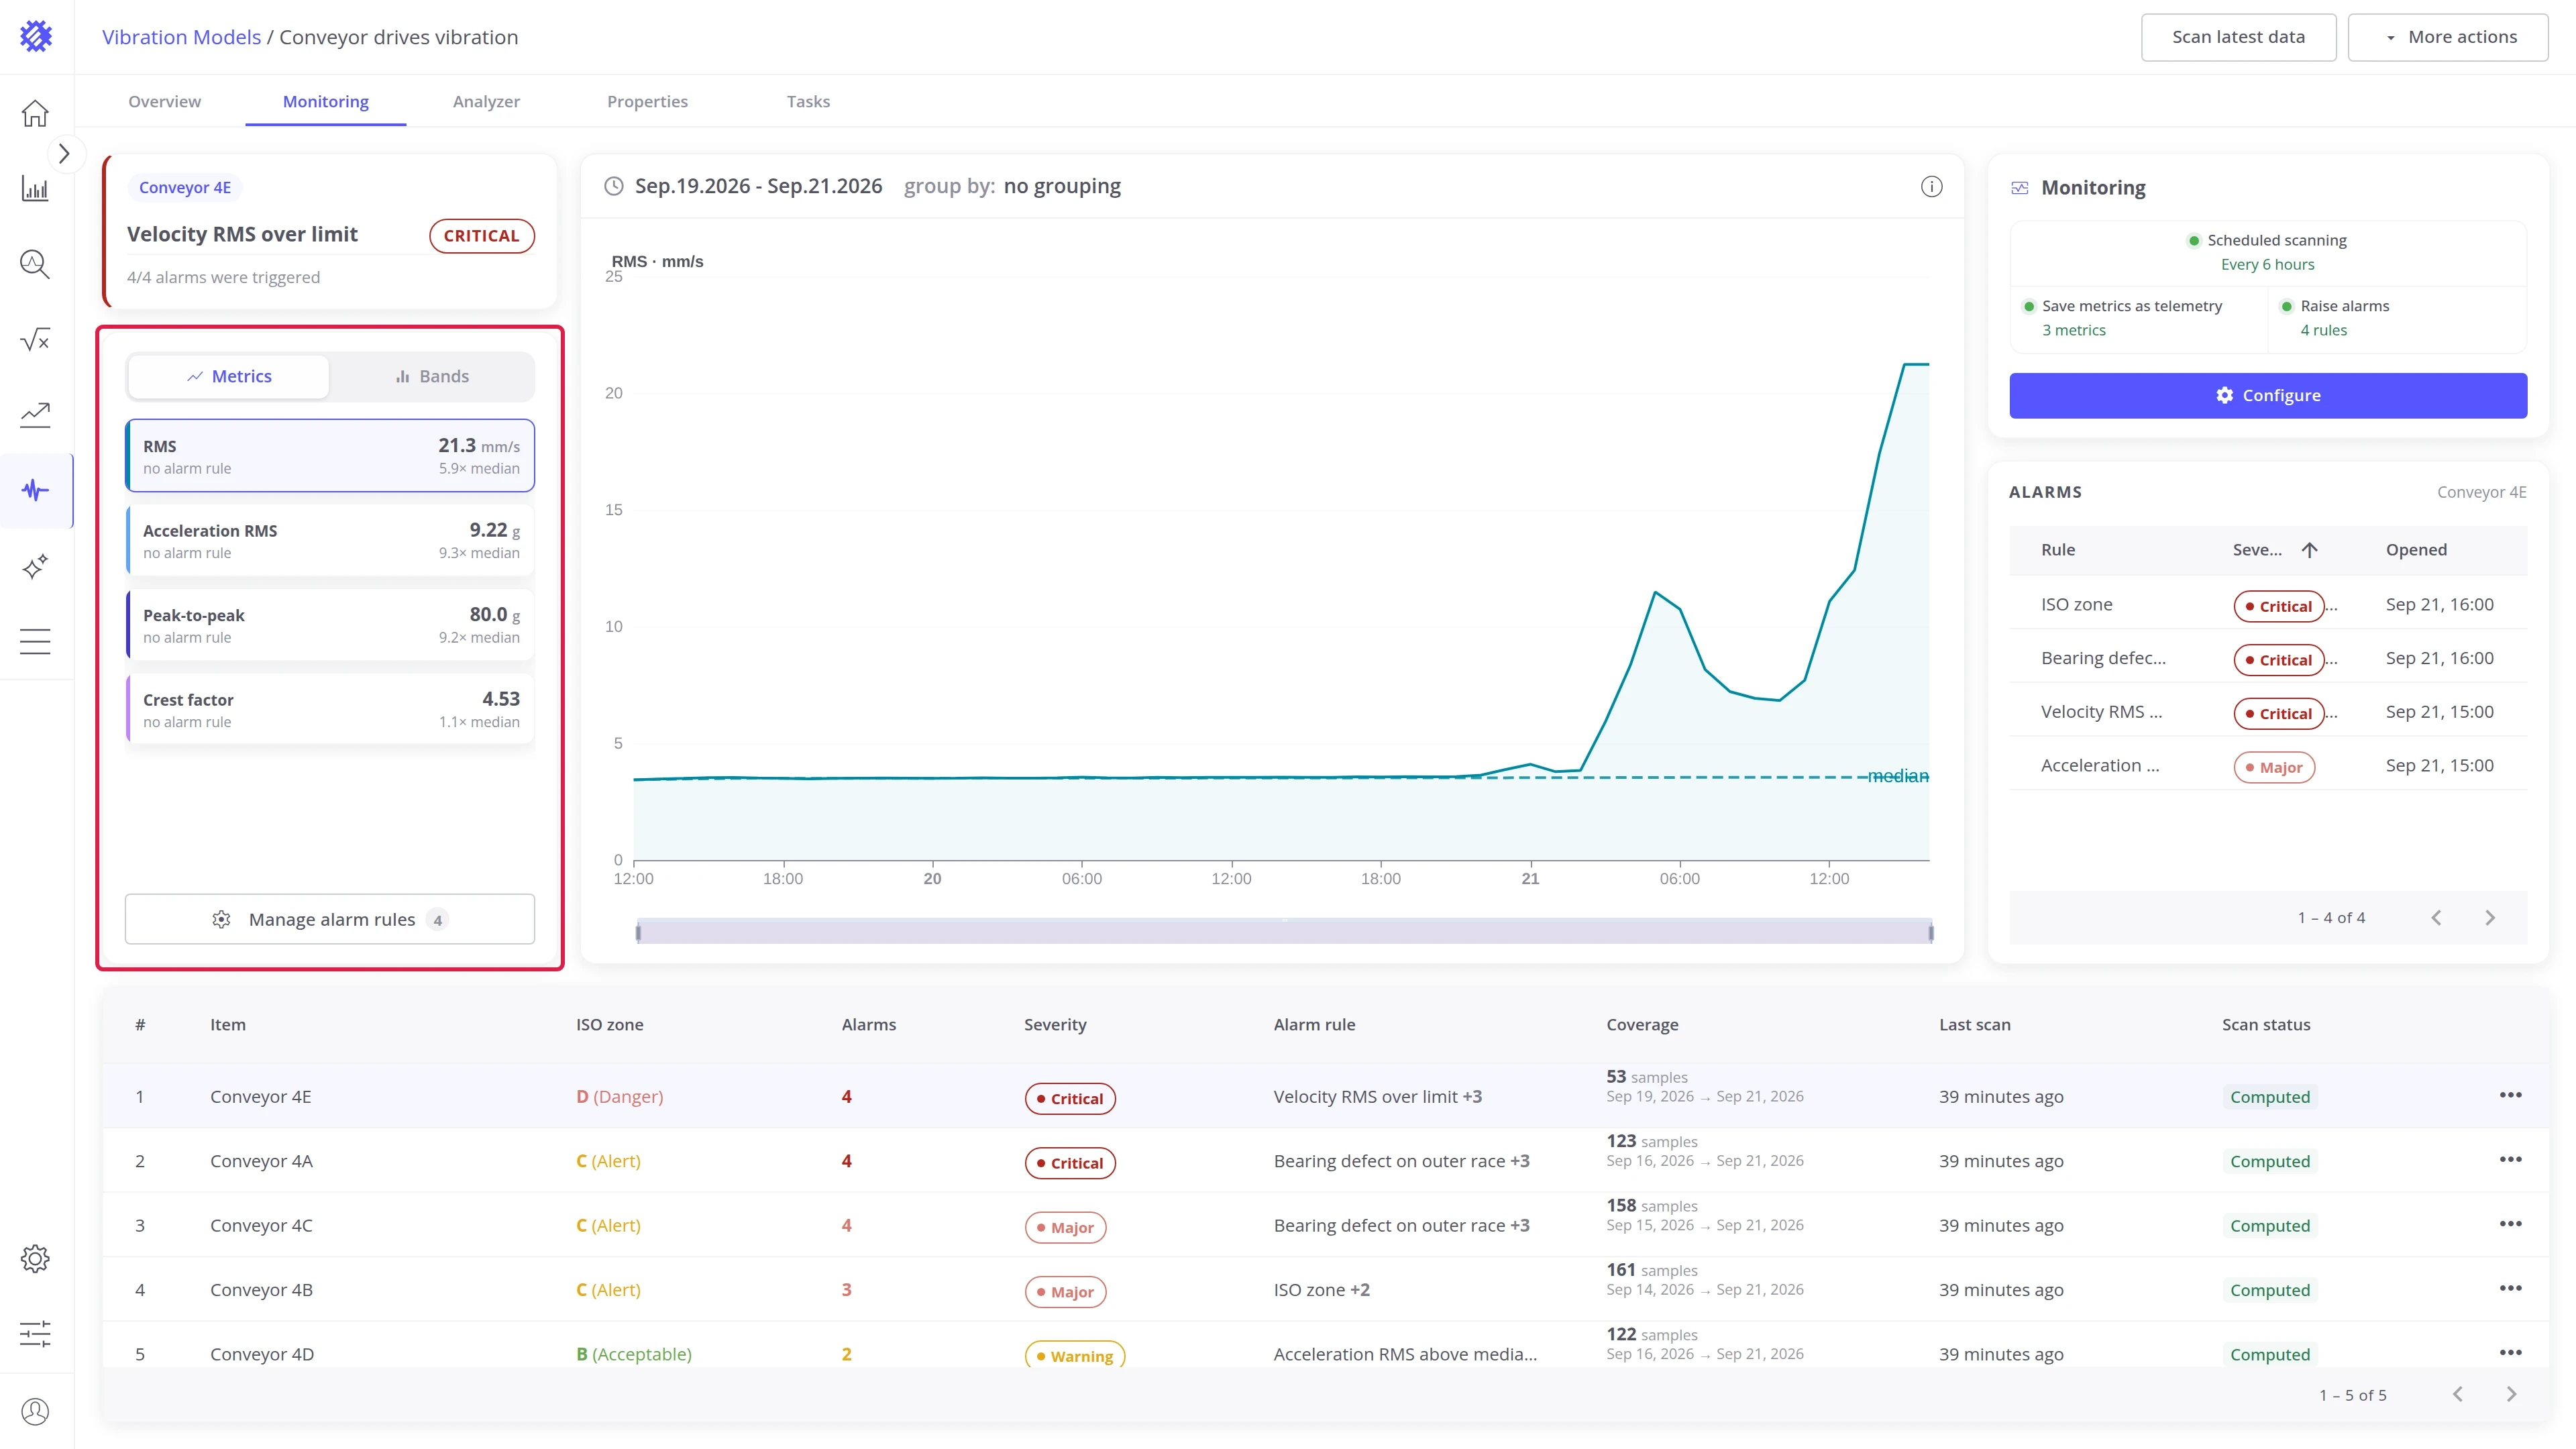
| 2 | Series tiles | The latest value of each metric or band, against the machine’s median |
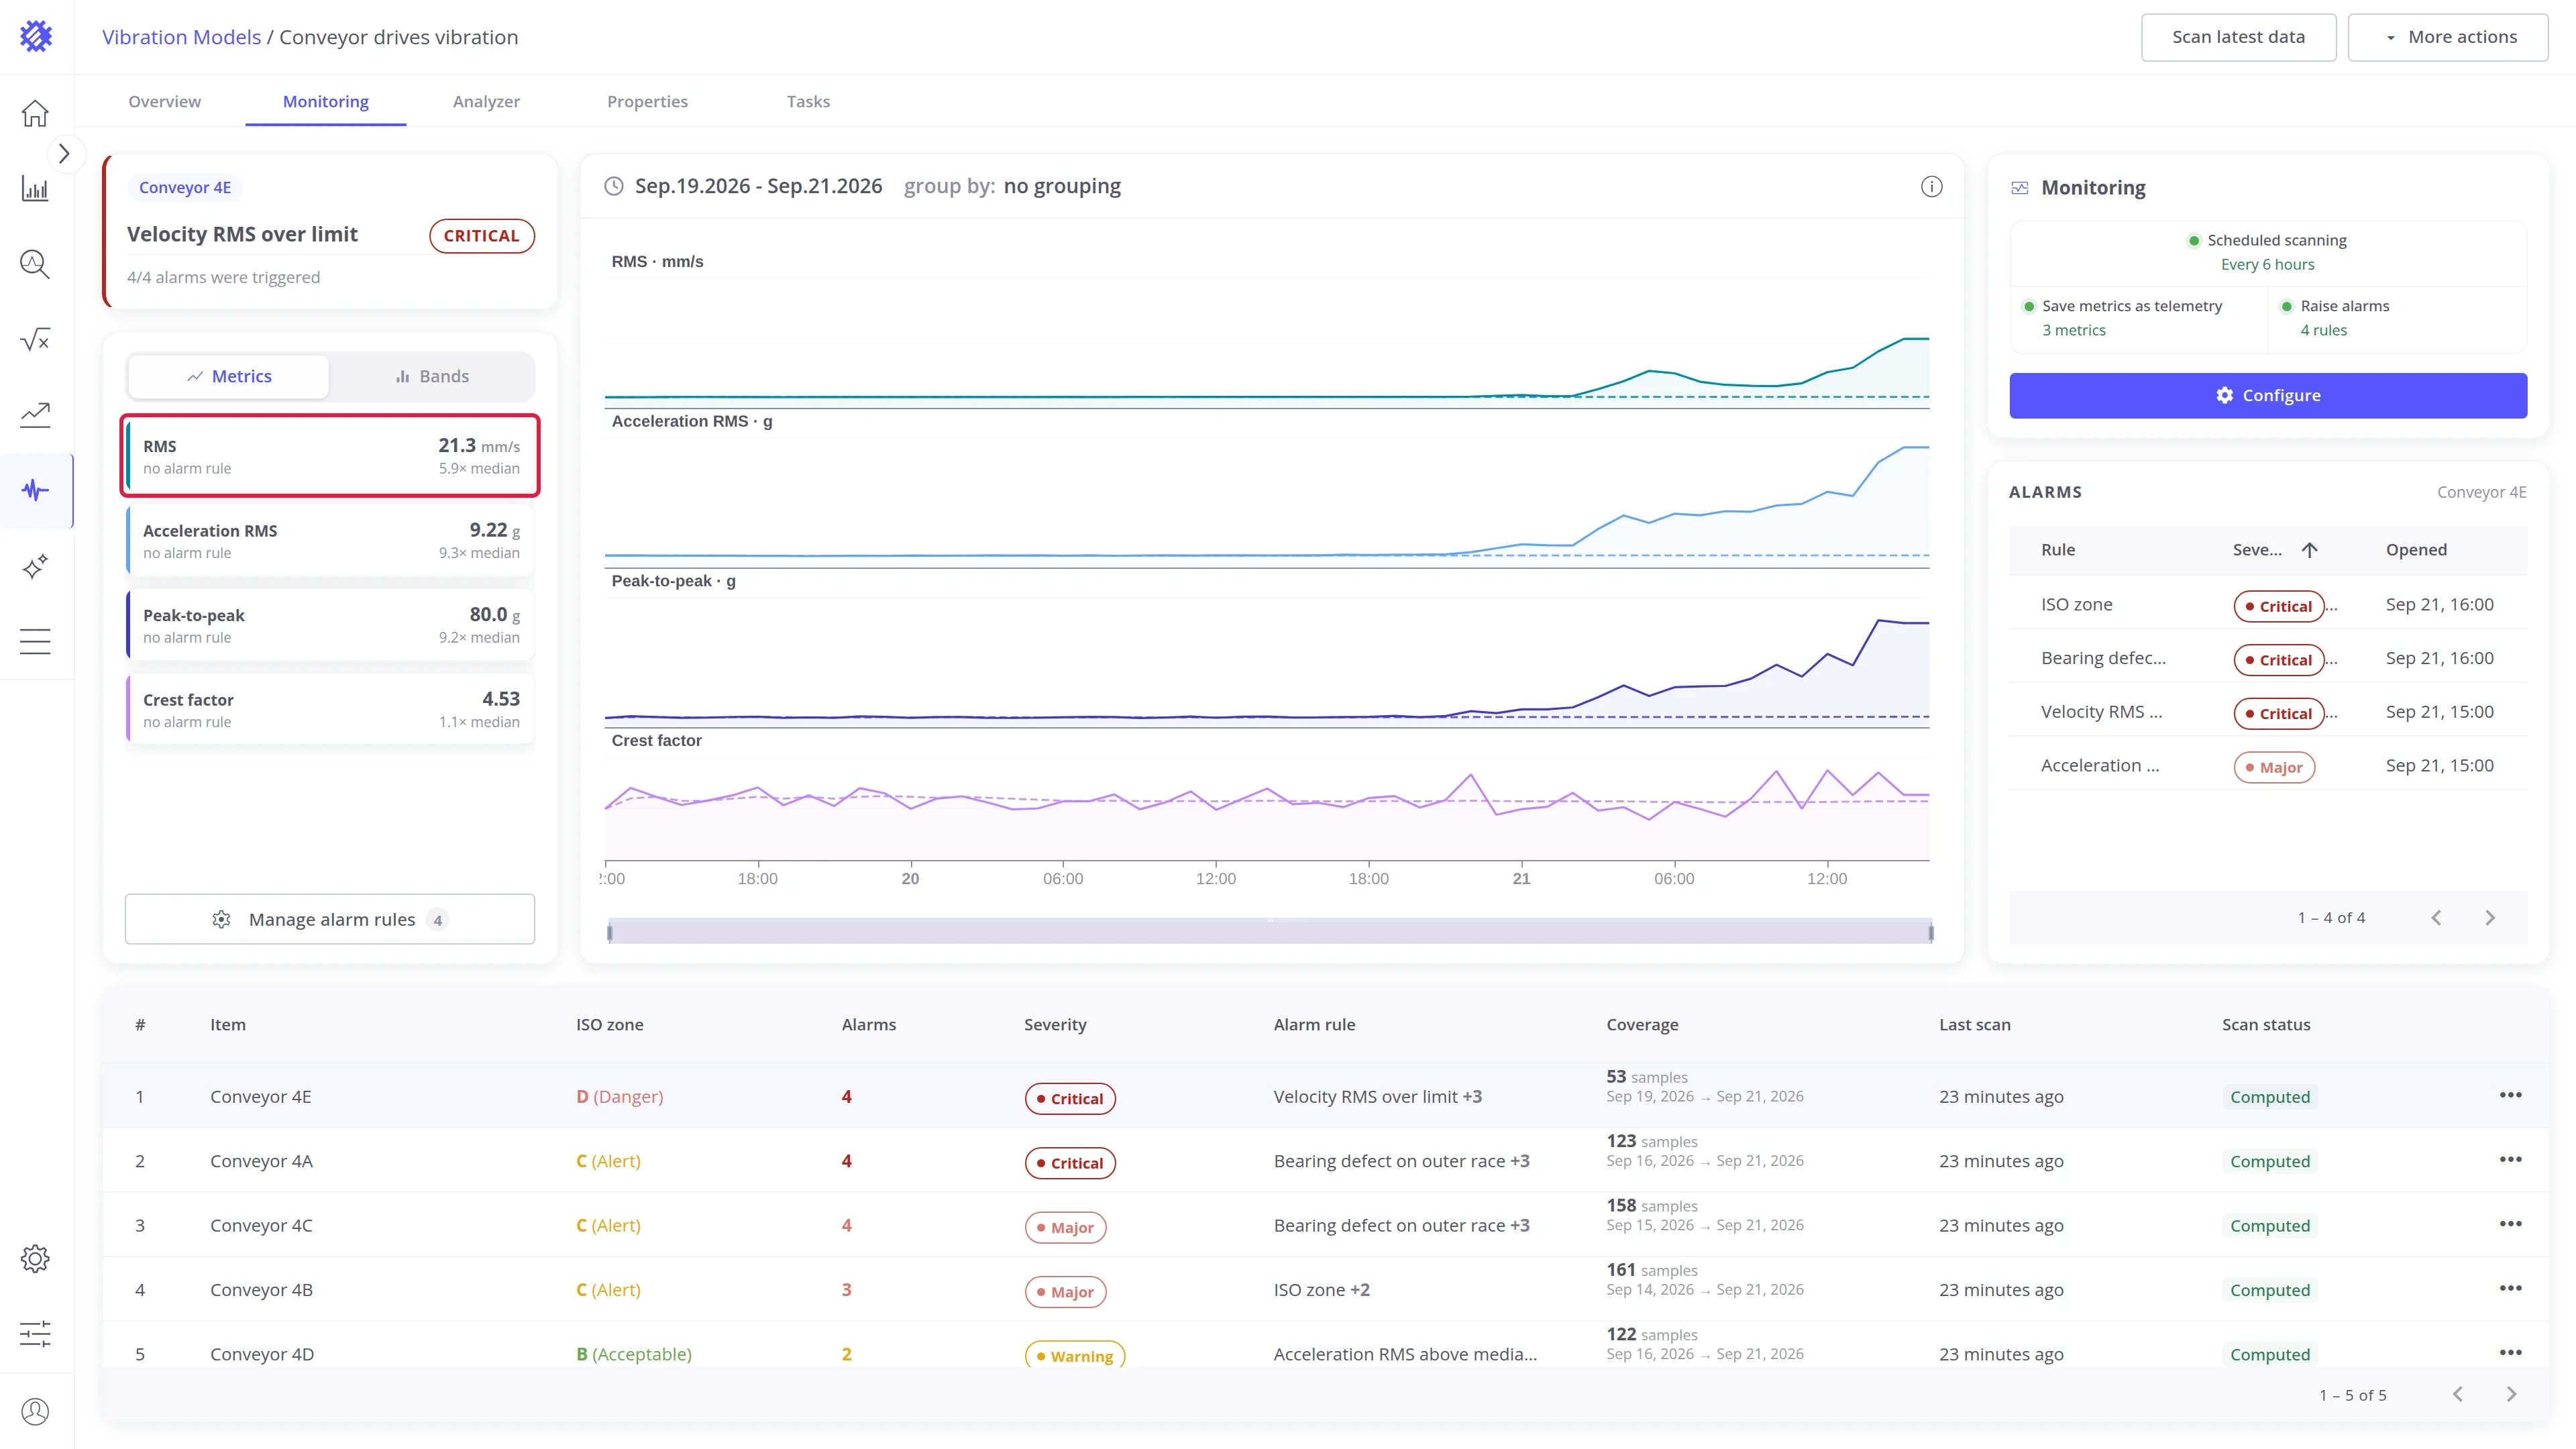
| 3 | Trend chart | The selected series over time, with its median |
| 4 | Monitoring card | The state of continuous monitoring for the model |
| 5 | Alarms card | The alarm episodes of the selected machine |
| 6 | Items table | Every machine with its ISO zone and alarms |
Components
Section titled “Components”Alarm state
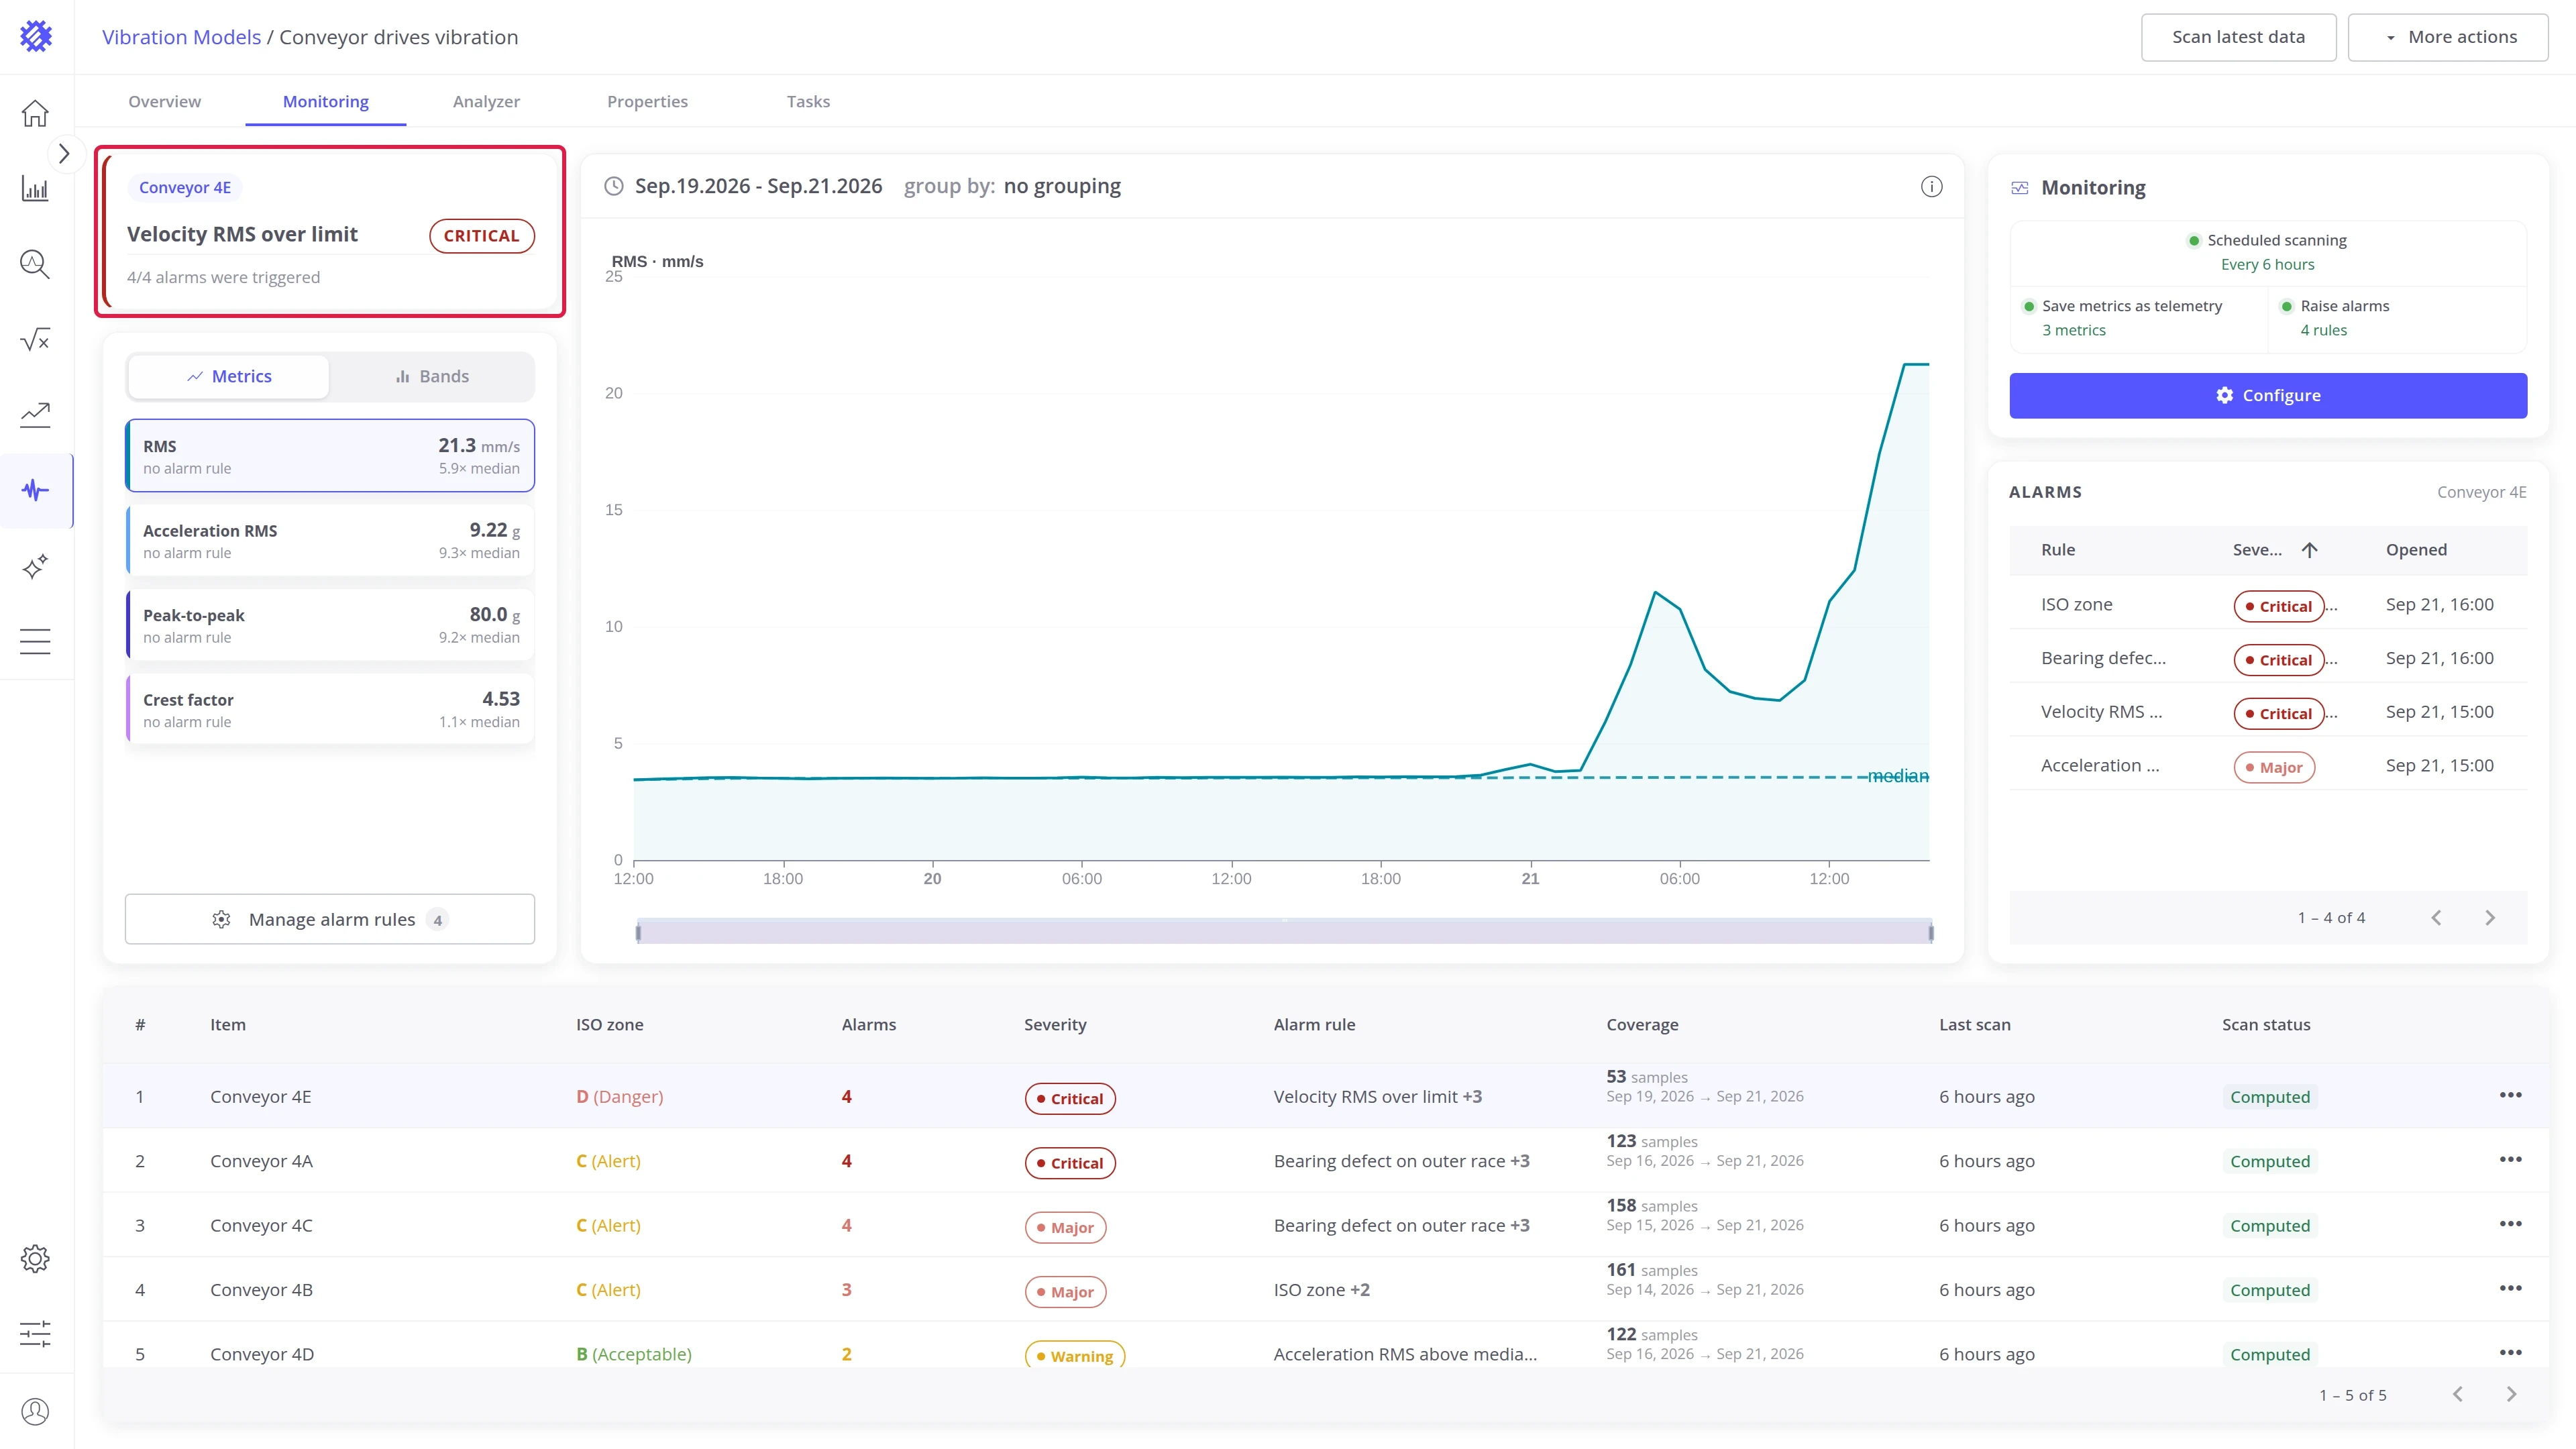
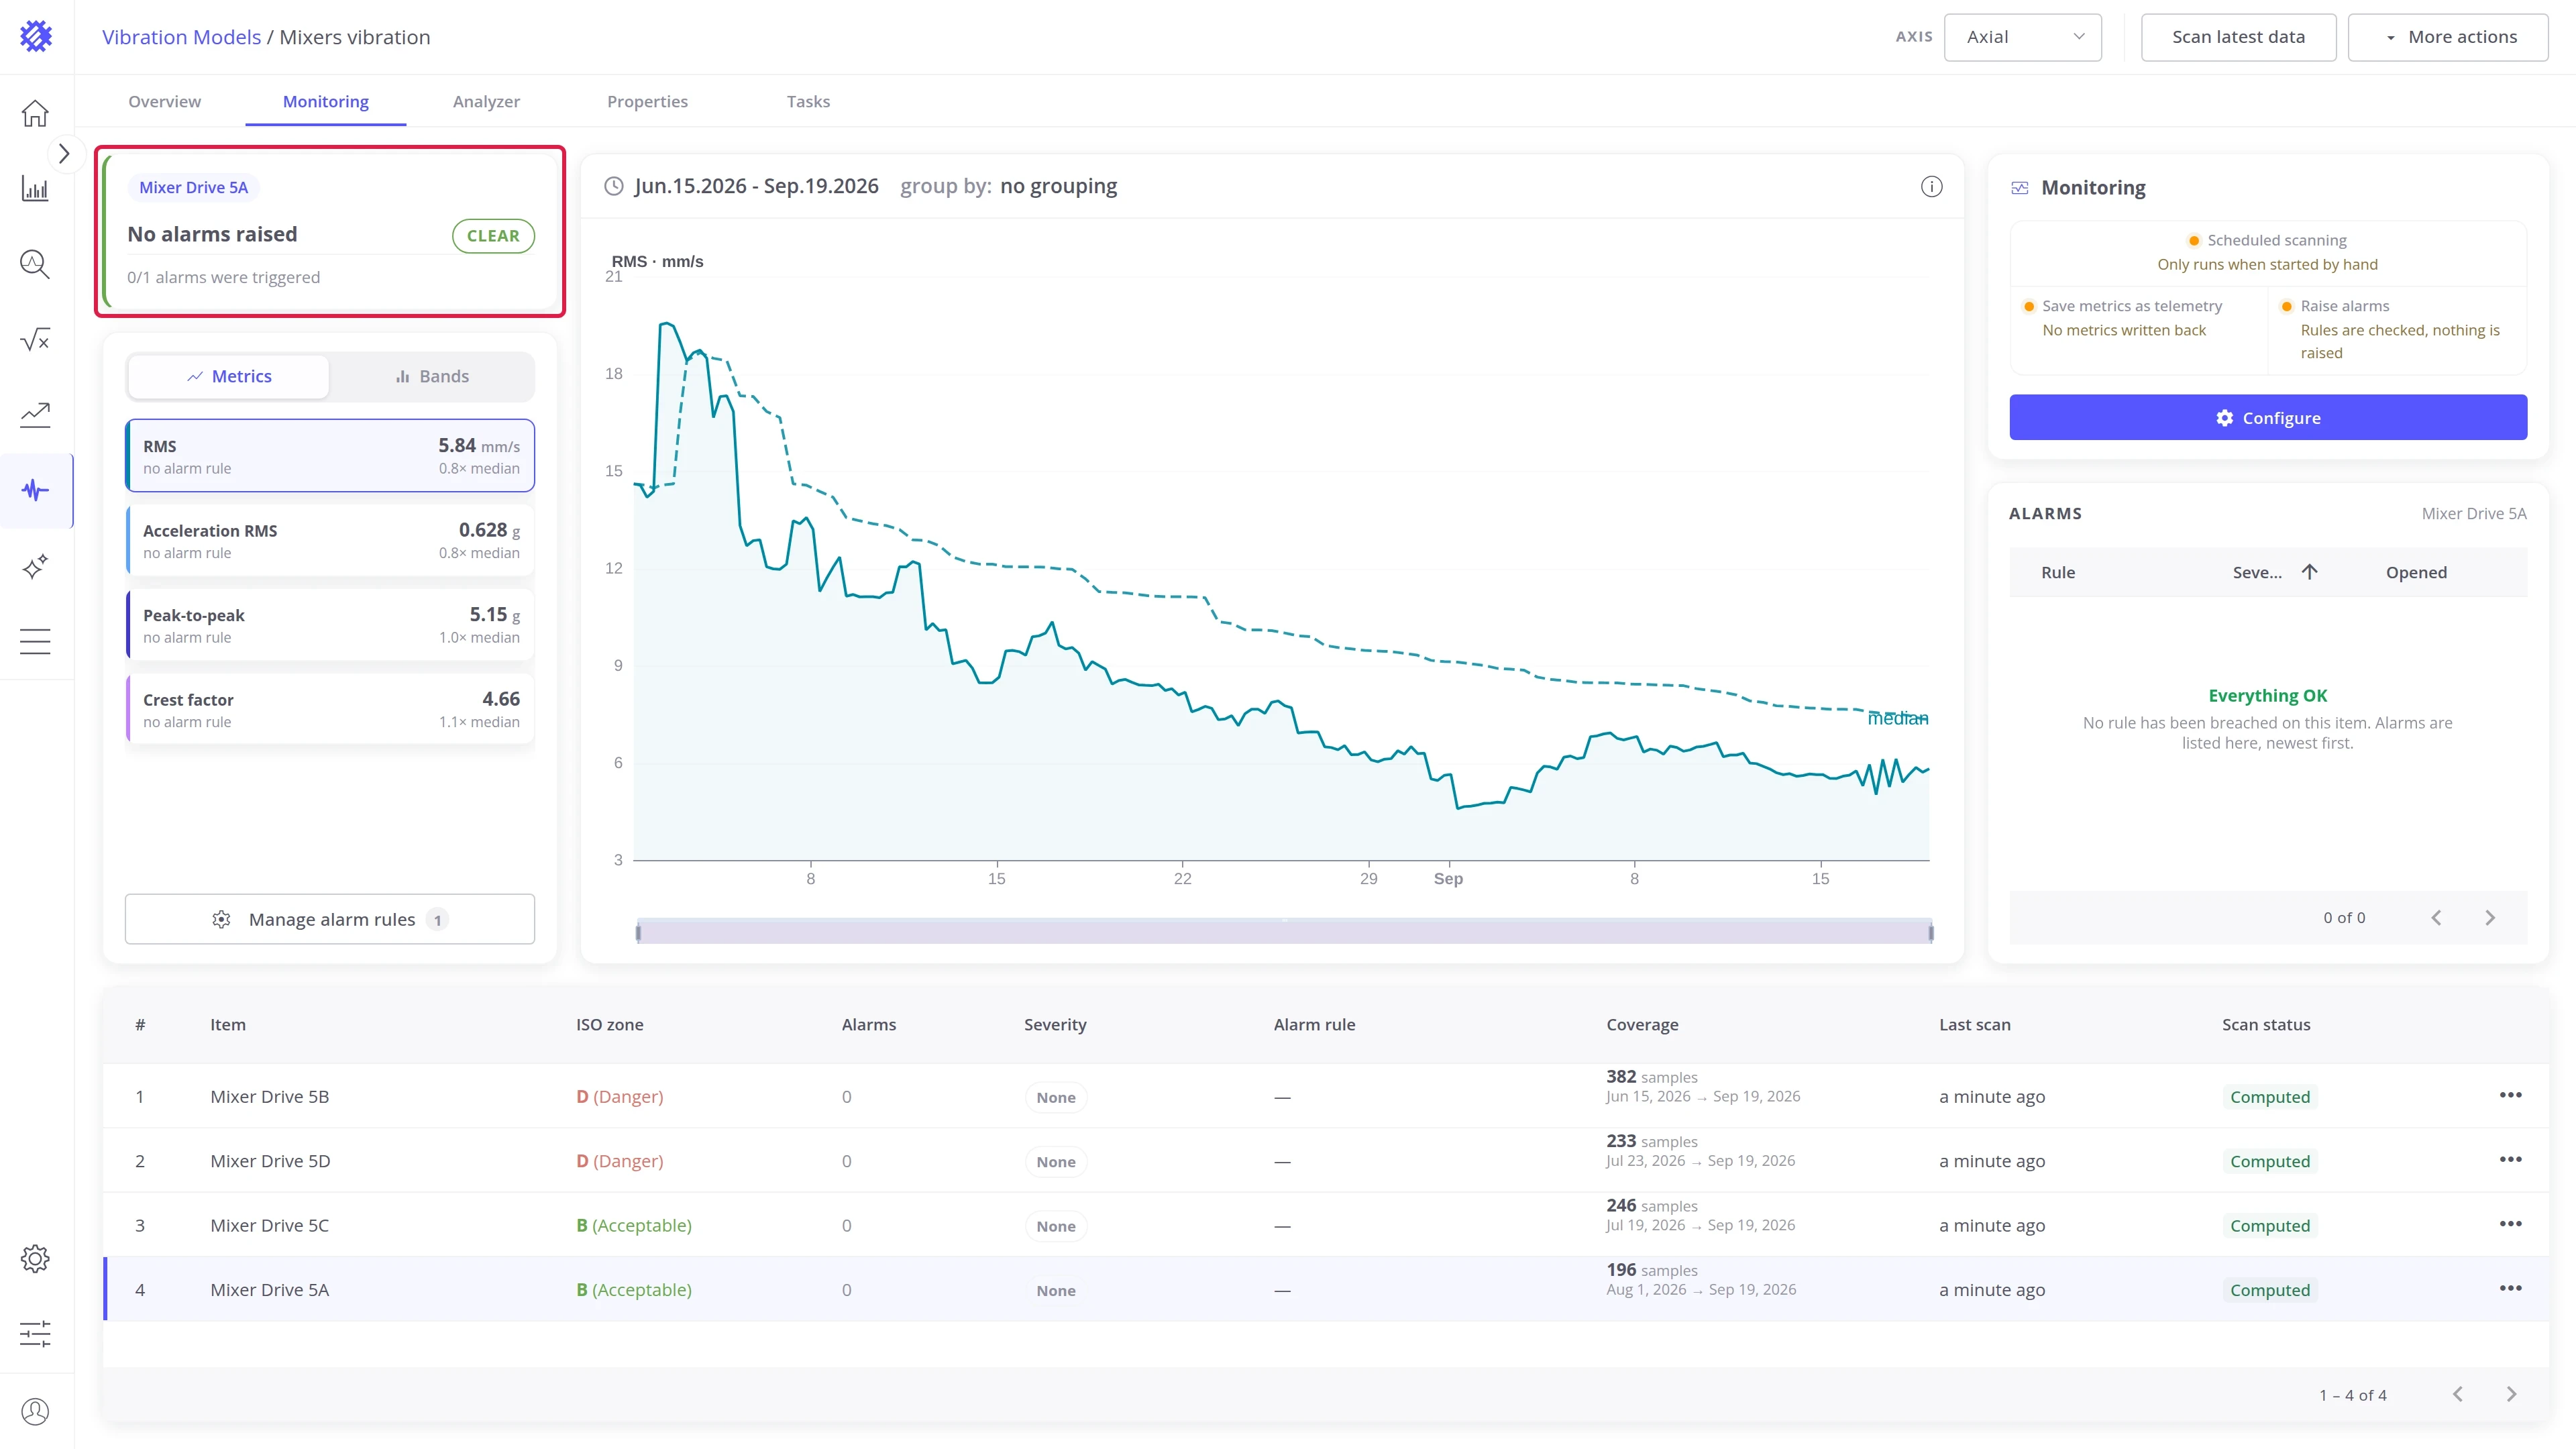
Section titled “Alarm state”The card at the top left names the selected machine and its alarm state:
- With an alarm: the worst alarm open on the machine, its severity, and how many of the model’s rules are firing.
- Without an alarm: No alarms raised and CLEAR. The rules are checked, and nothing breaks them.
A model with no alarm rules has no alarm state to report. The card (1) and the Alarms card (2) offer + Add alarm rule instead, which opens the rule editor.
Series tiles
Section titled “Series tiles”The tiles list the latest value of each series, its alarm rule, and how far it sits above the machine’s own median. A tile whose rule is firing takes the severity color.
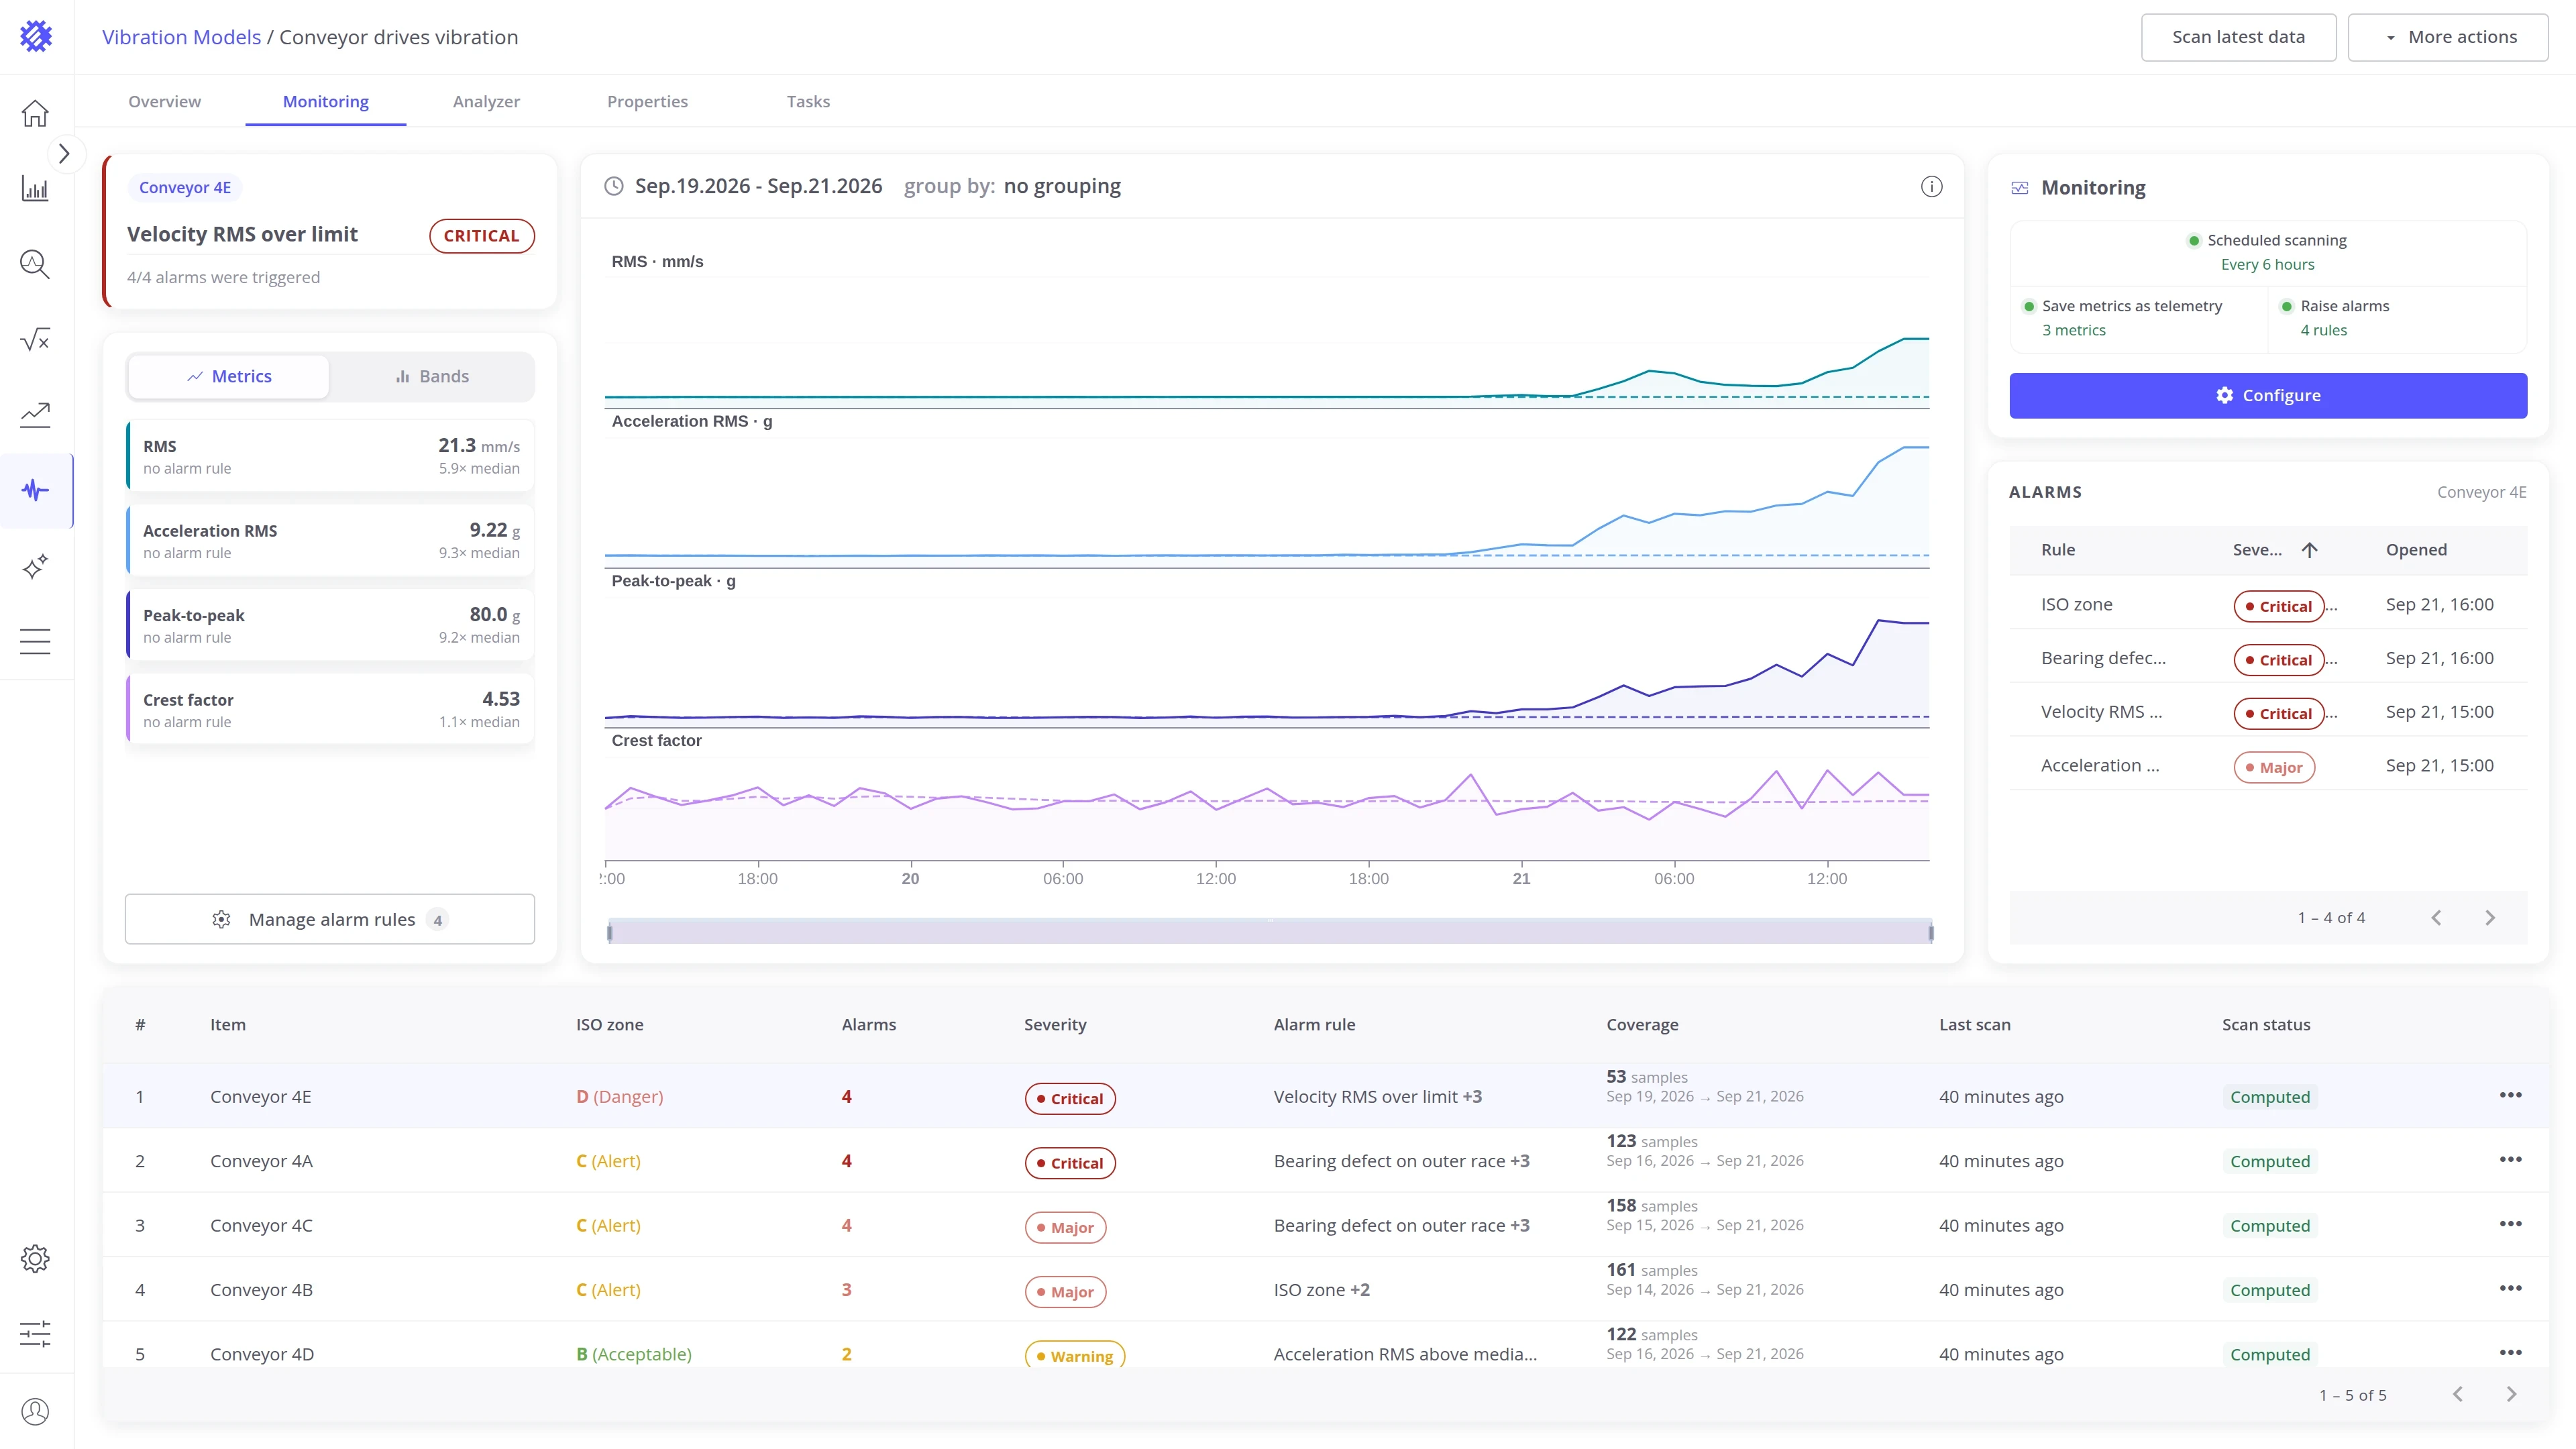
The tiles and the chart show one of two groups. Metrics shows RMS, acceleration RMS, peak-to-peak, and crest factor. Bands shows the five frequency bands around the shaft speed. Use the switch at the top of the tiles to switch between them.
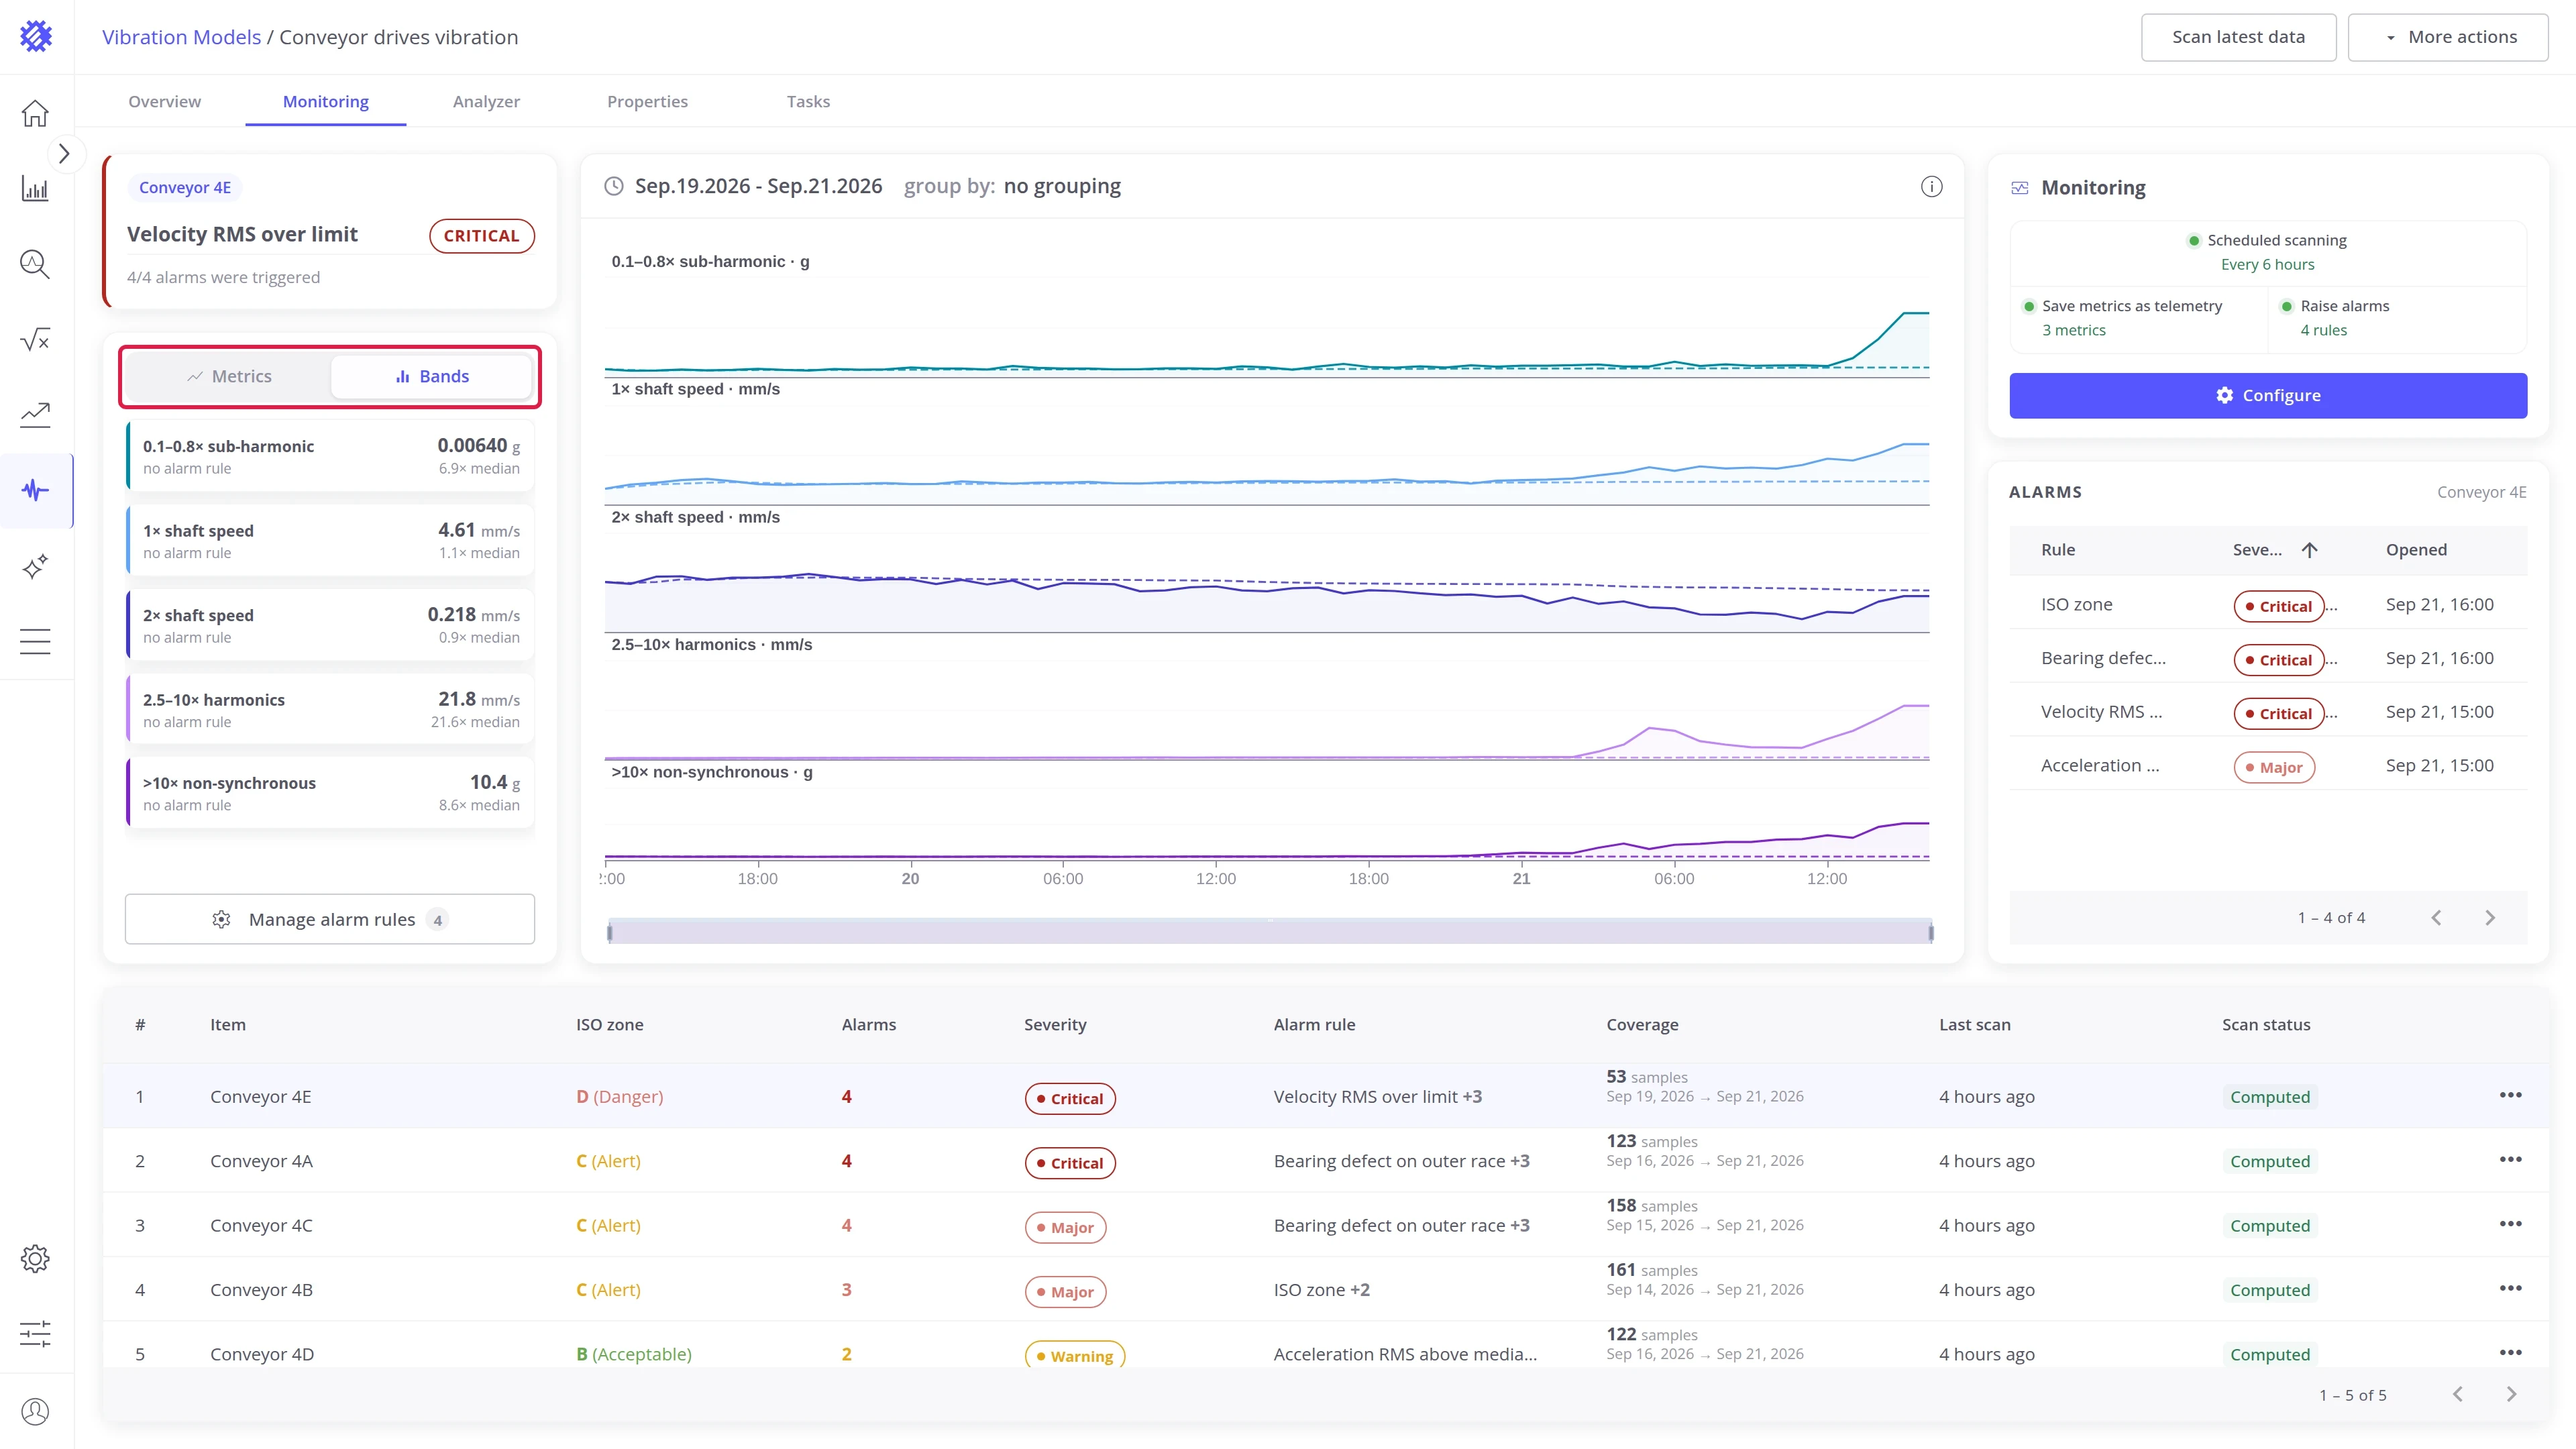
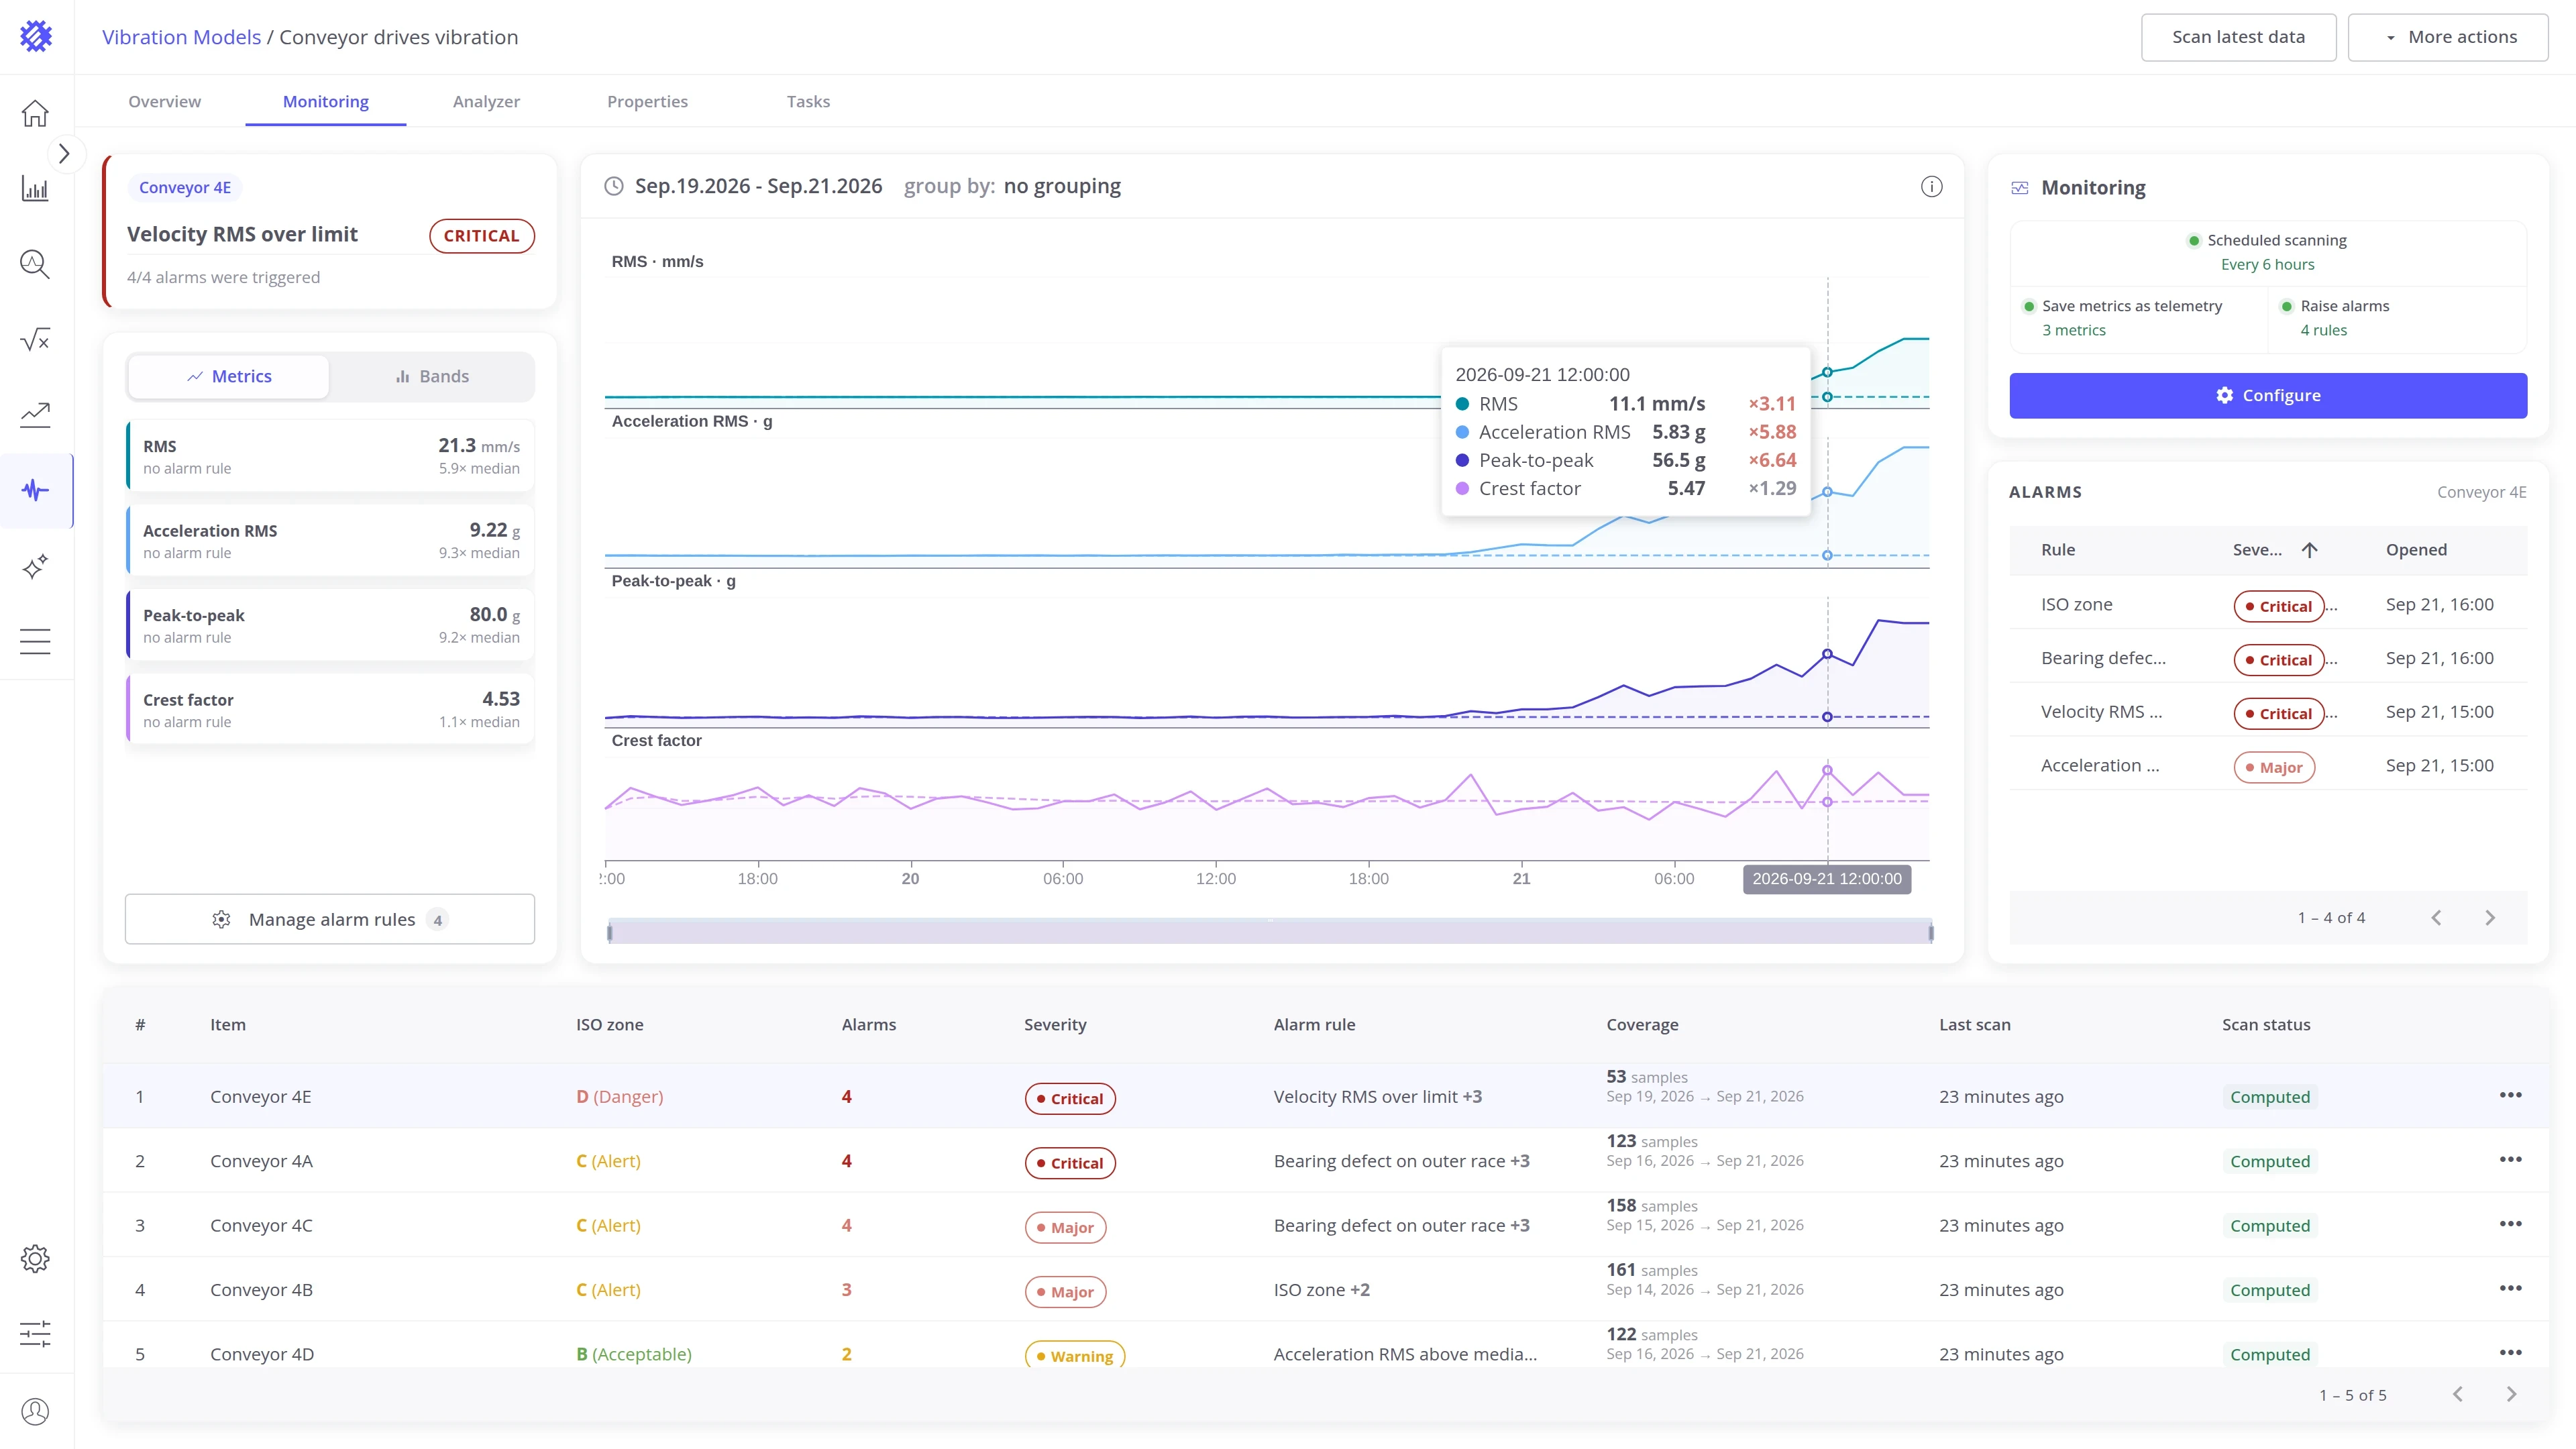
With no tile selected, the chart shows every series of the category, one panel each. Click a tile to chart that series alone, and click it again to go back to all of them.
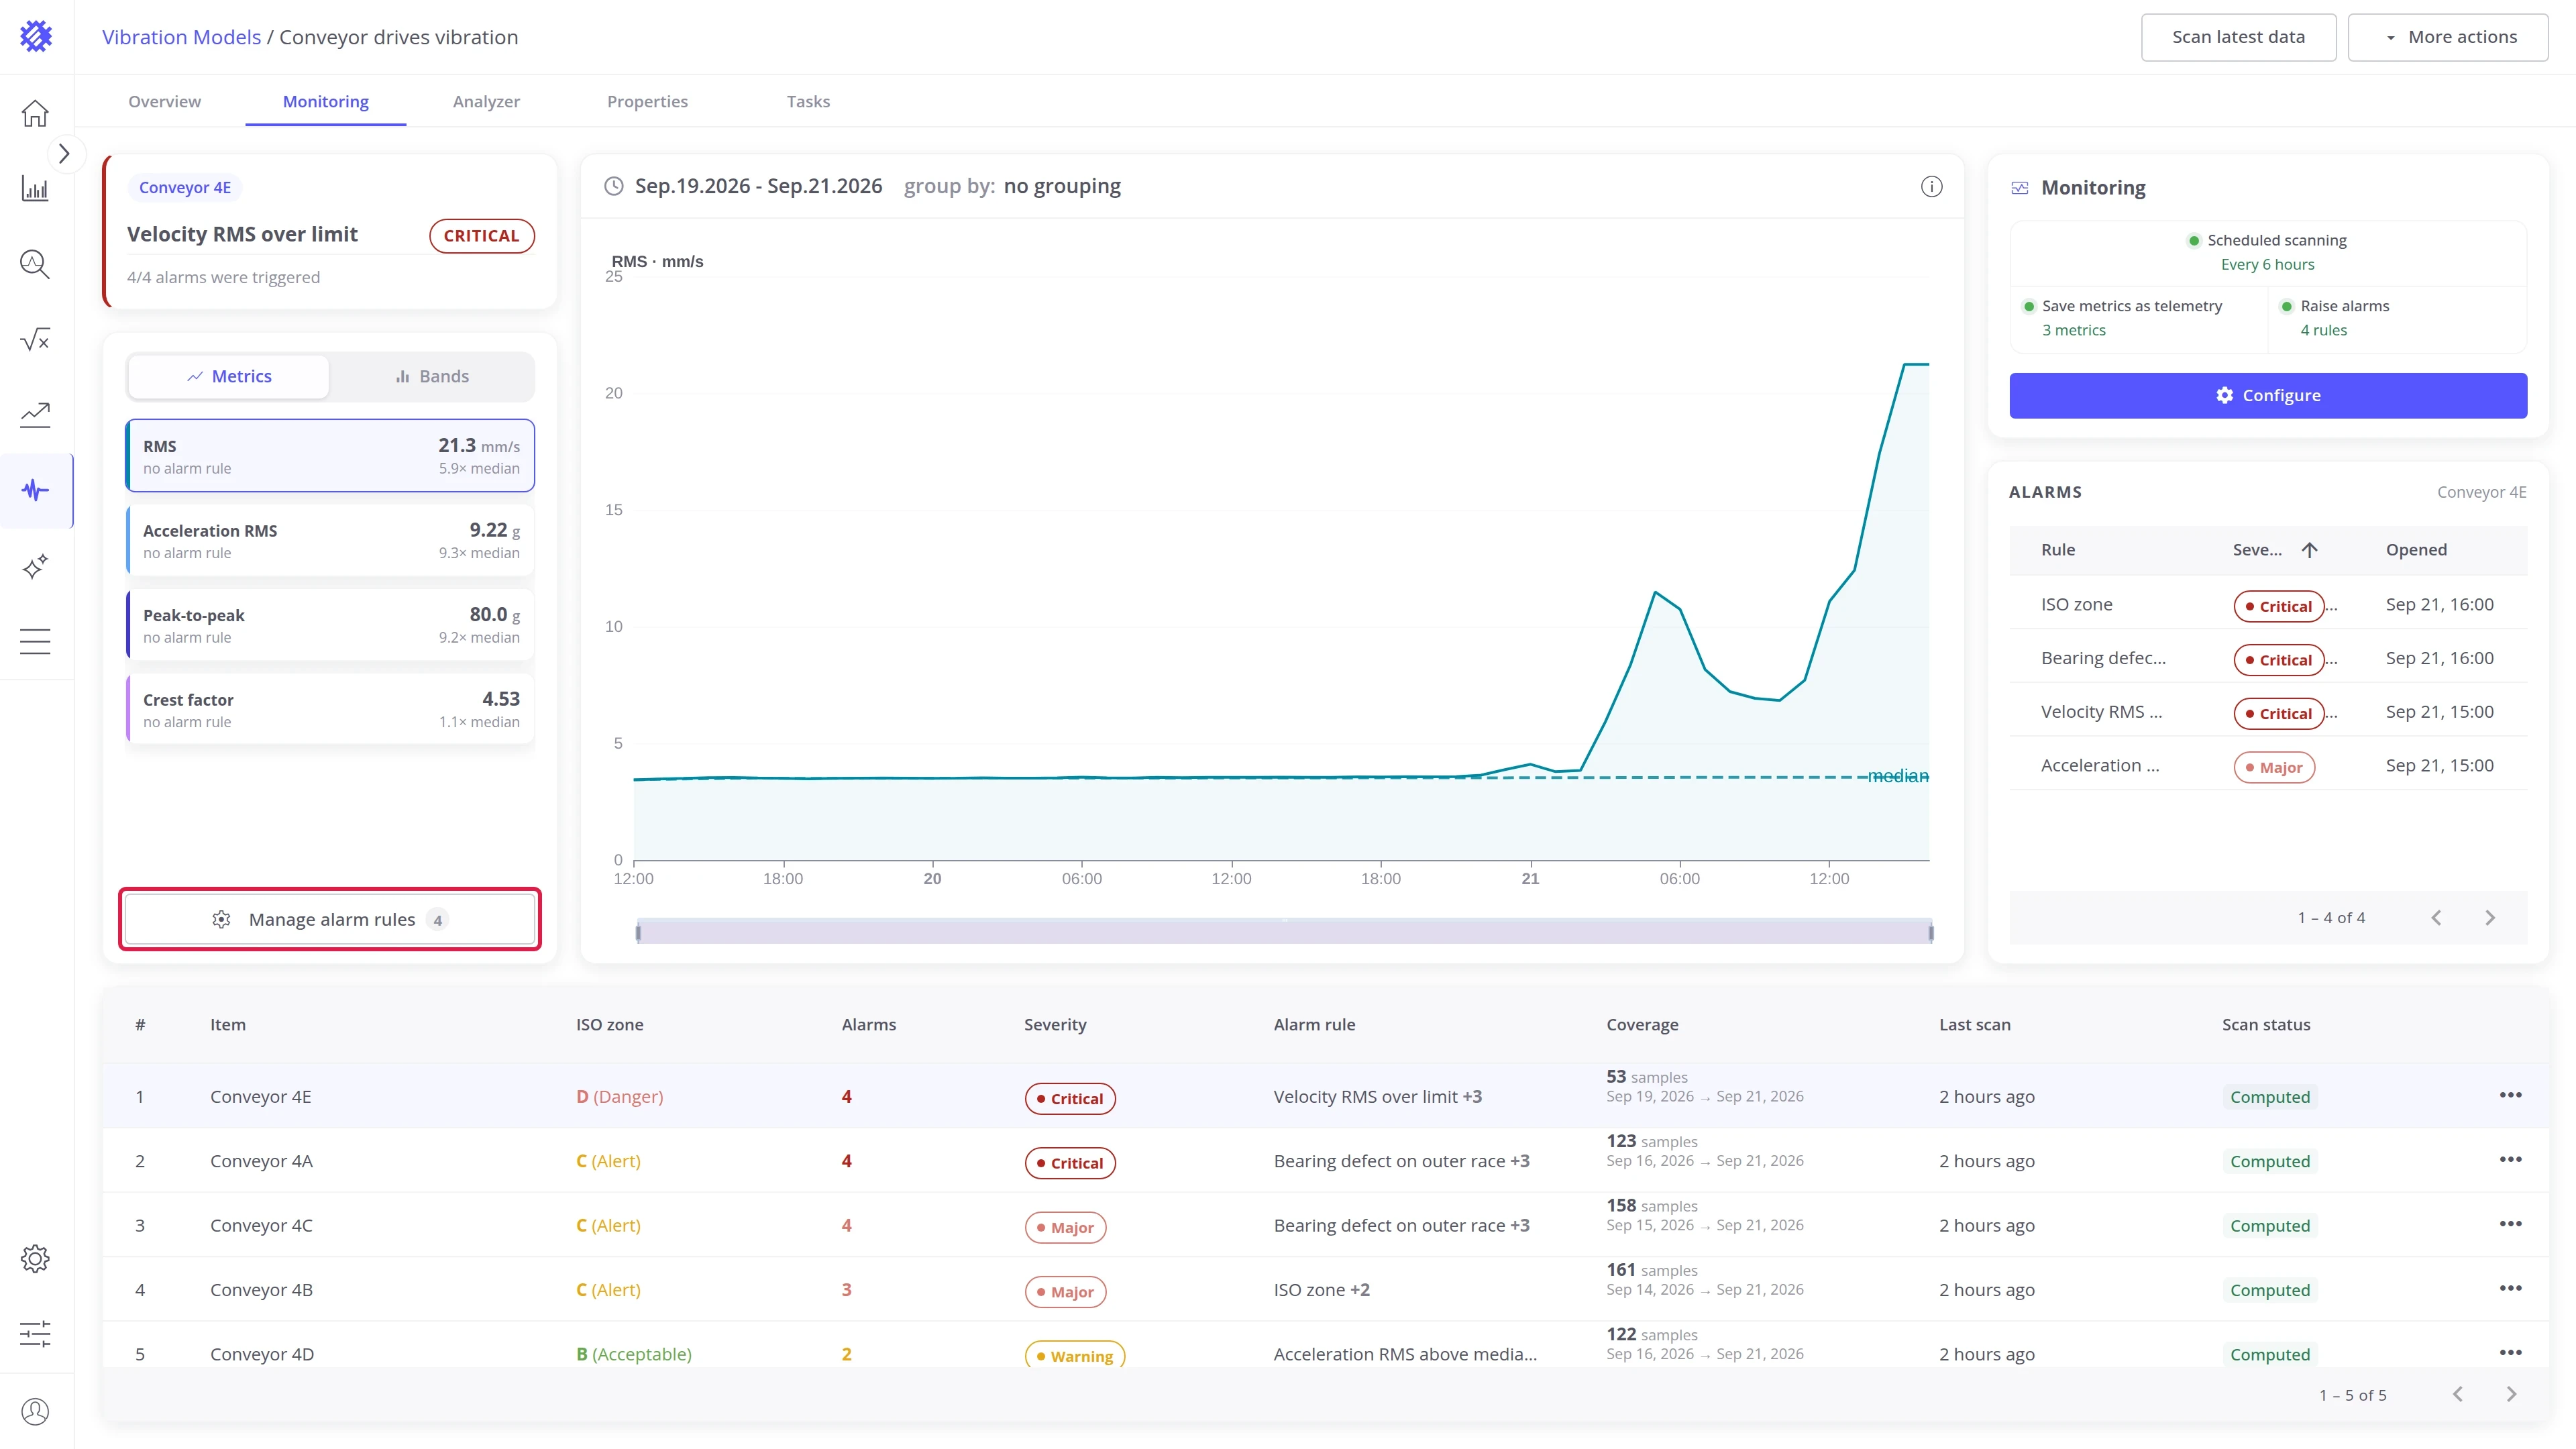
Manage alarm rules under the tiles opens the rule editor. The number beside it is how many rules the model has. Writing rules is described in Monitoring & Alarms.
Trend chart
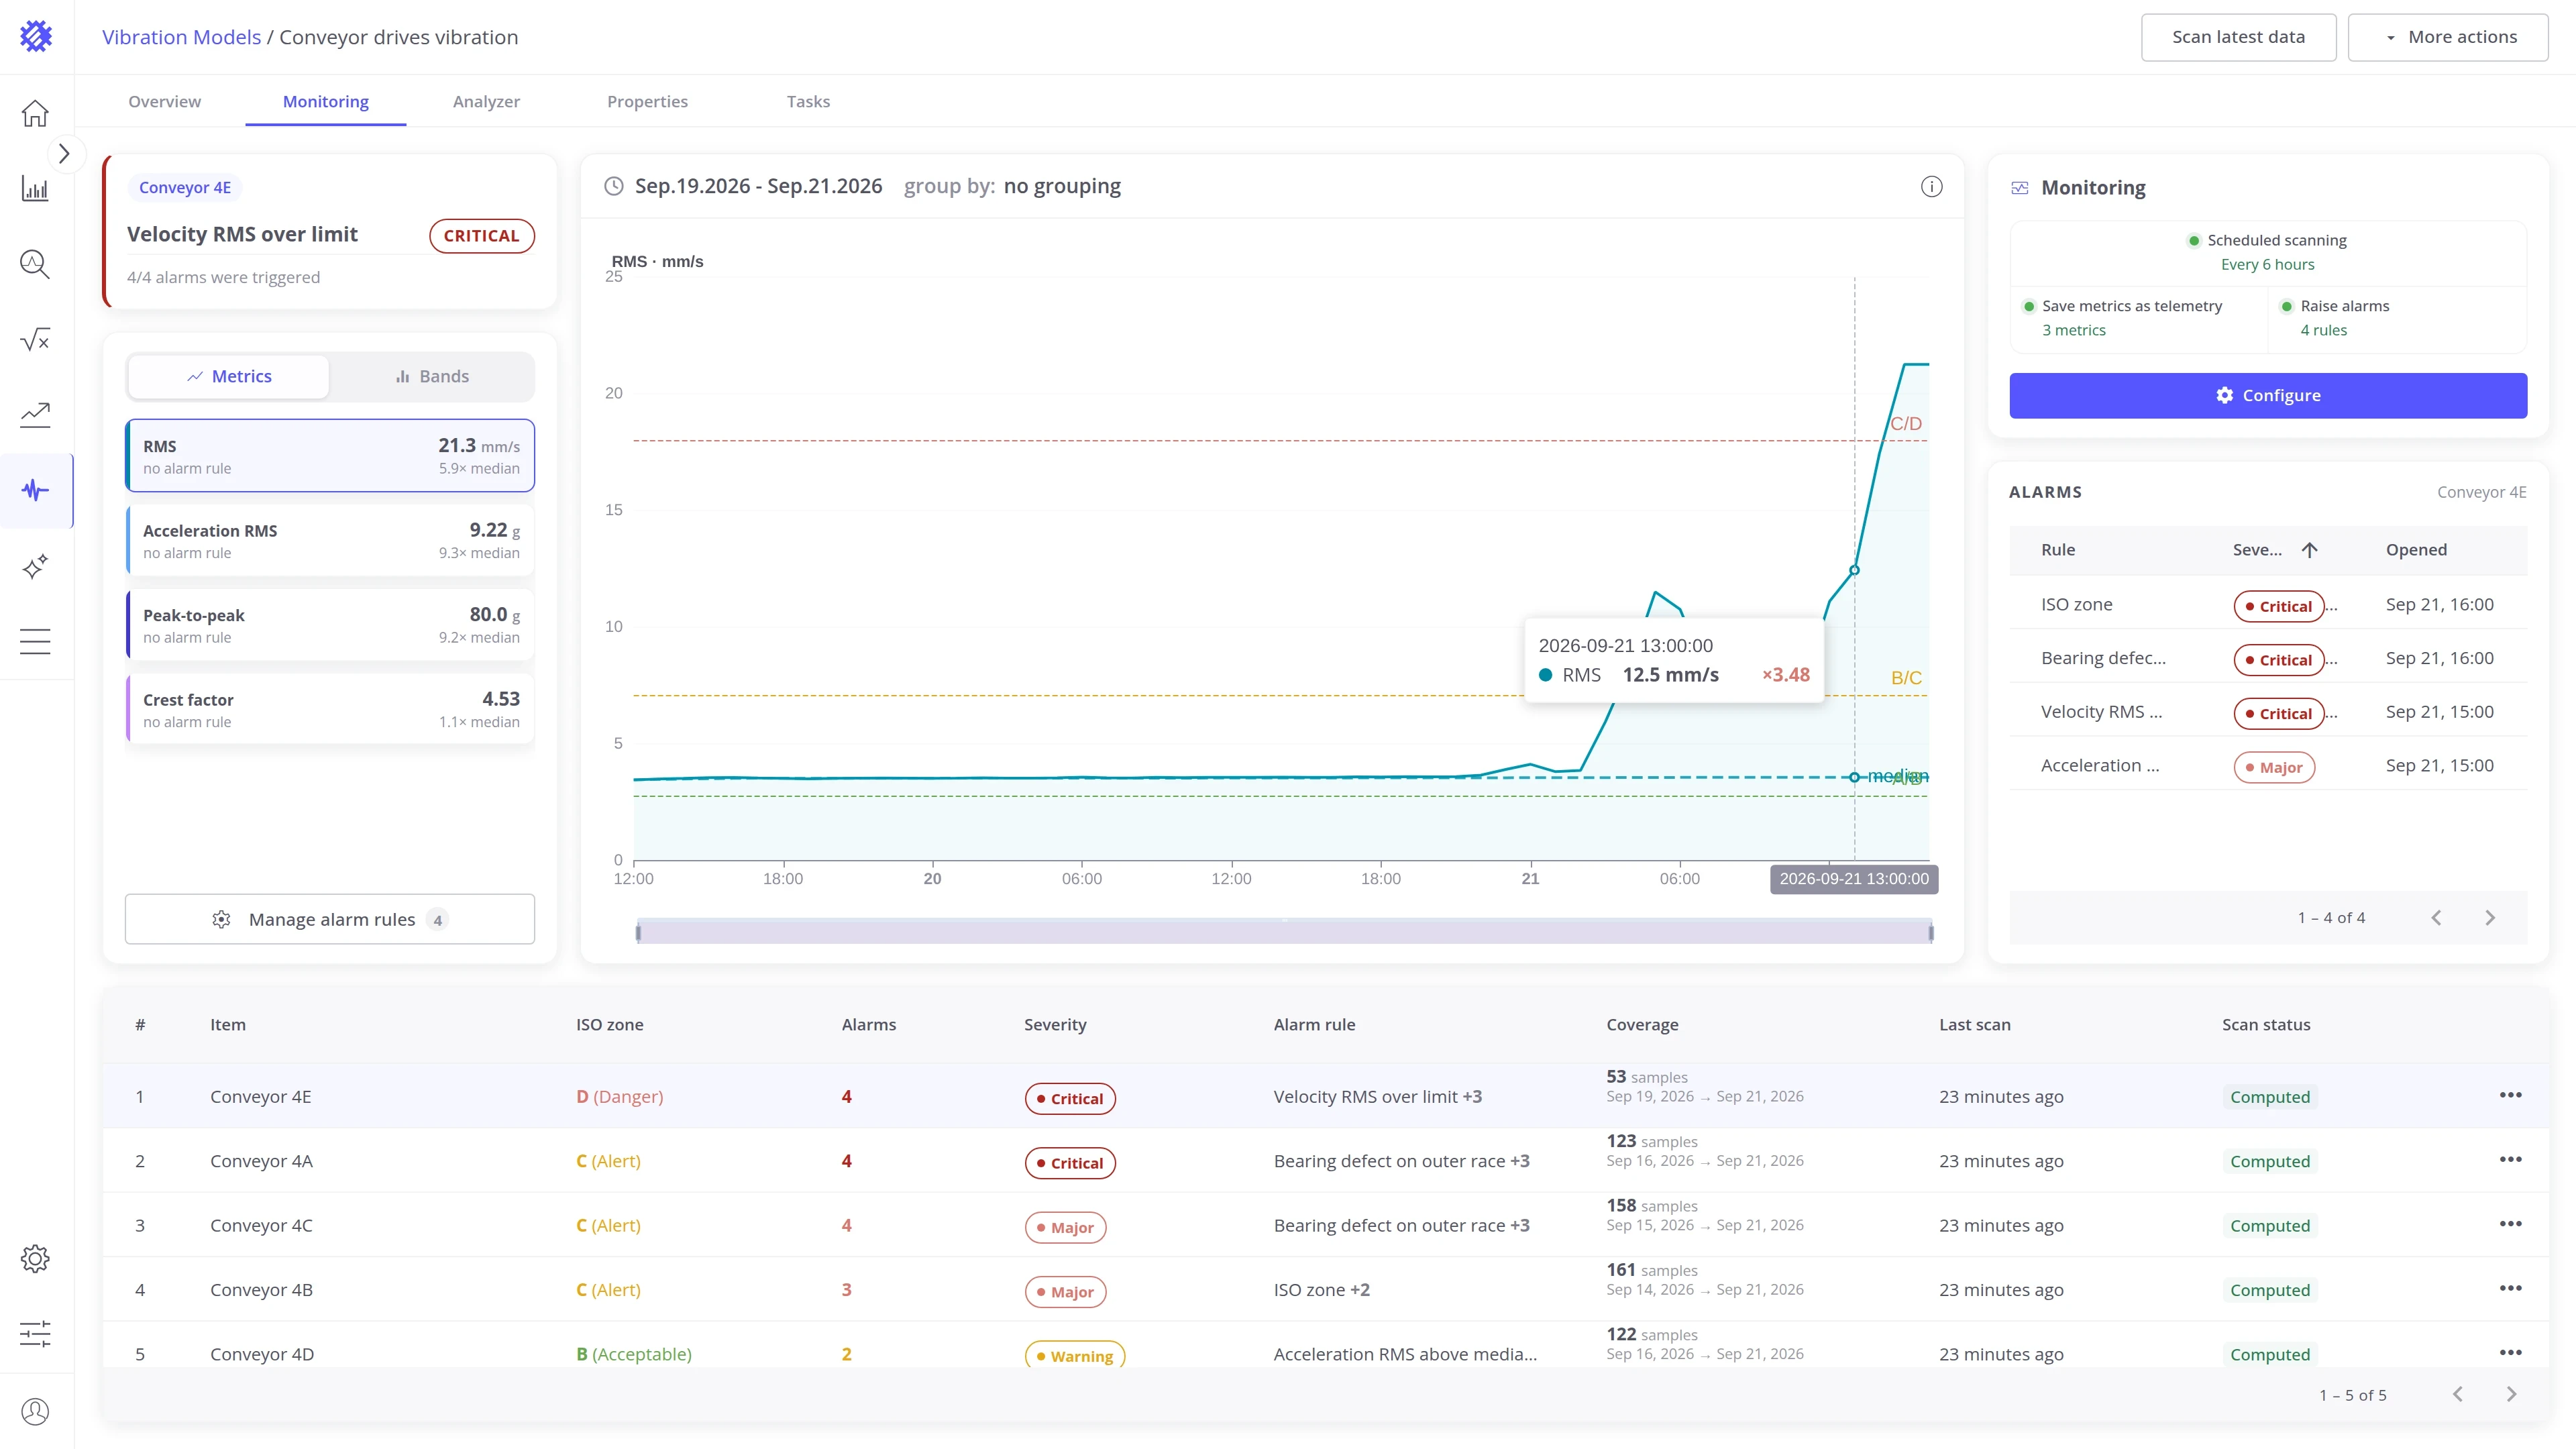
Section titled “Trend chart”The chart draws the selected series on every sample in the time range, with the machine’s median dashed.
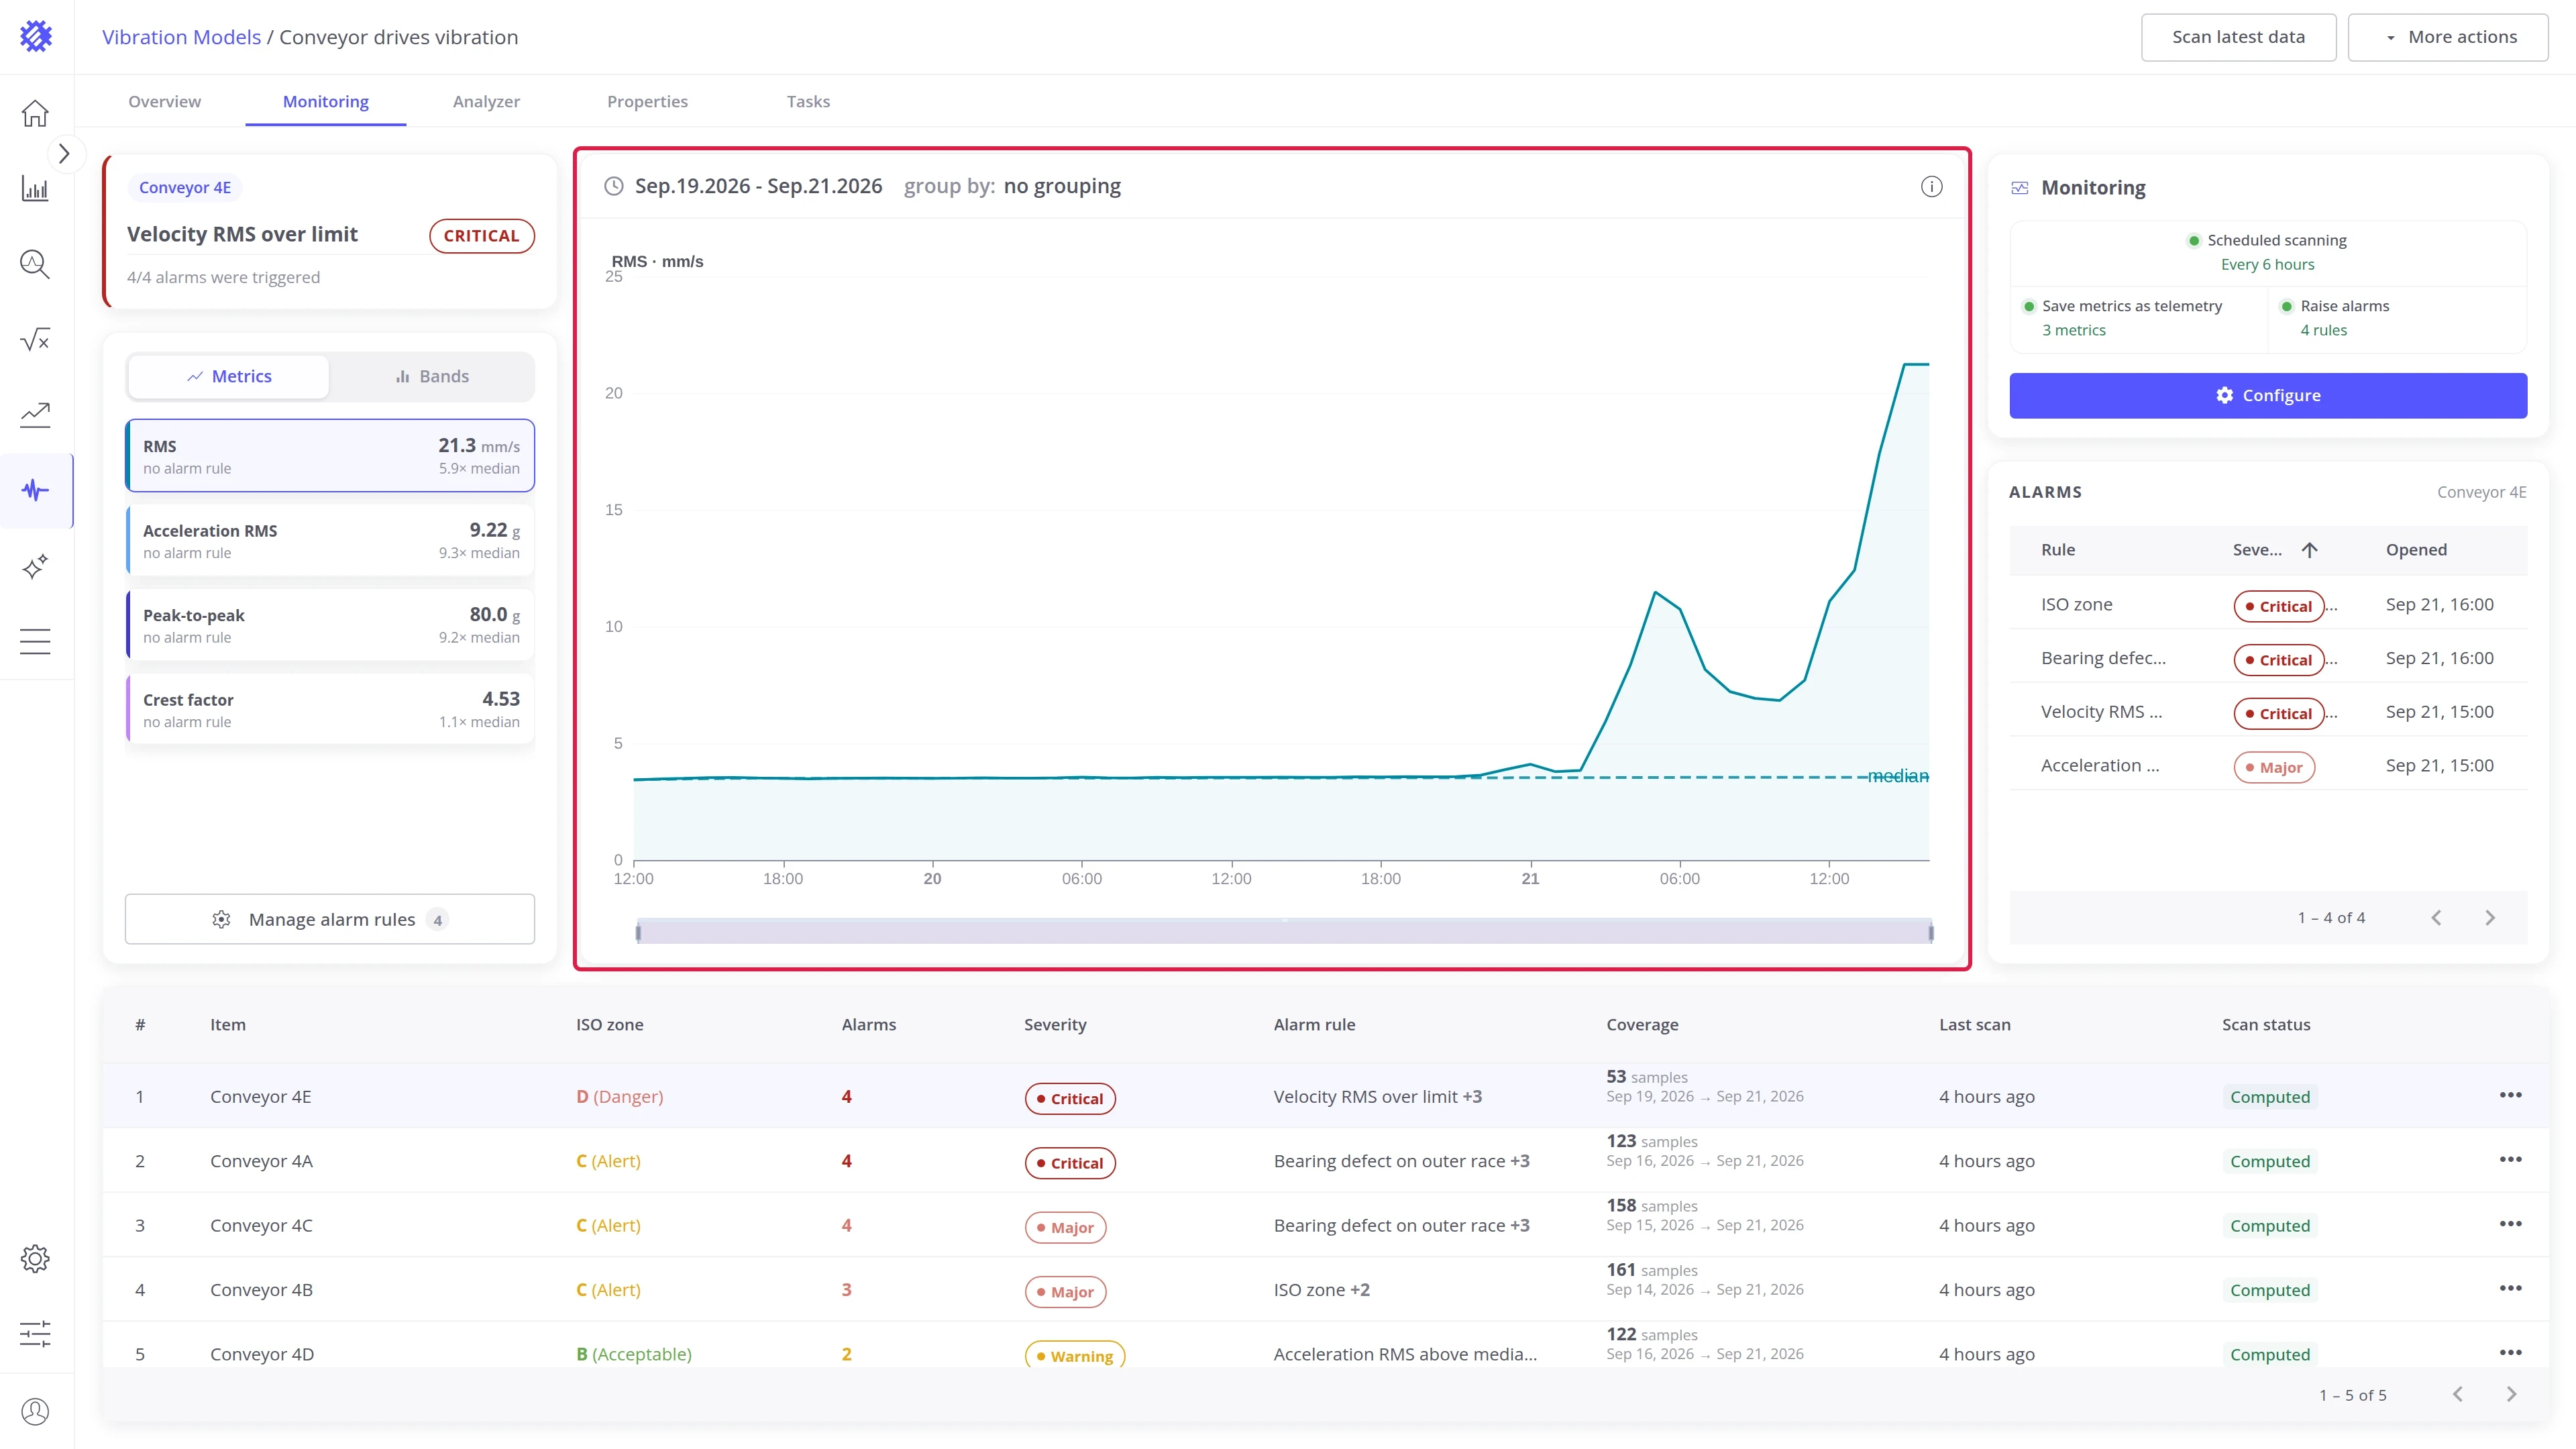
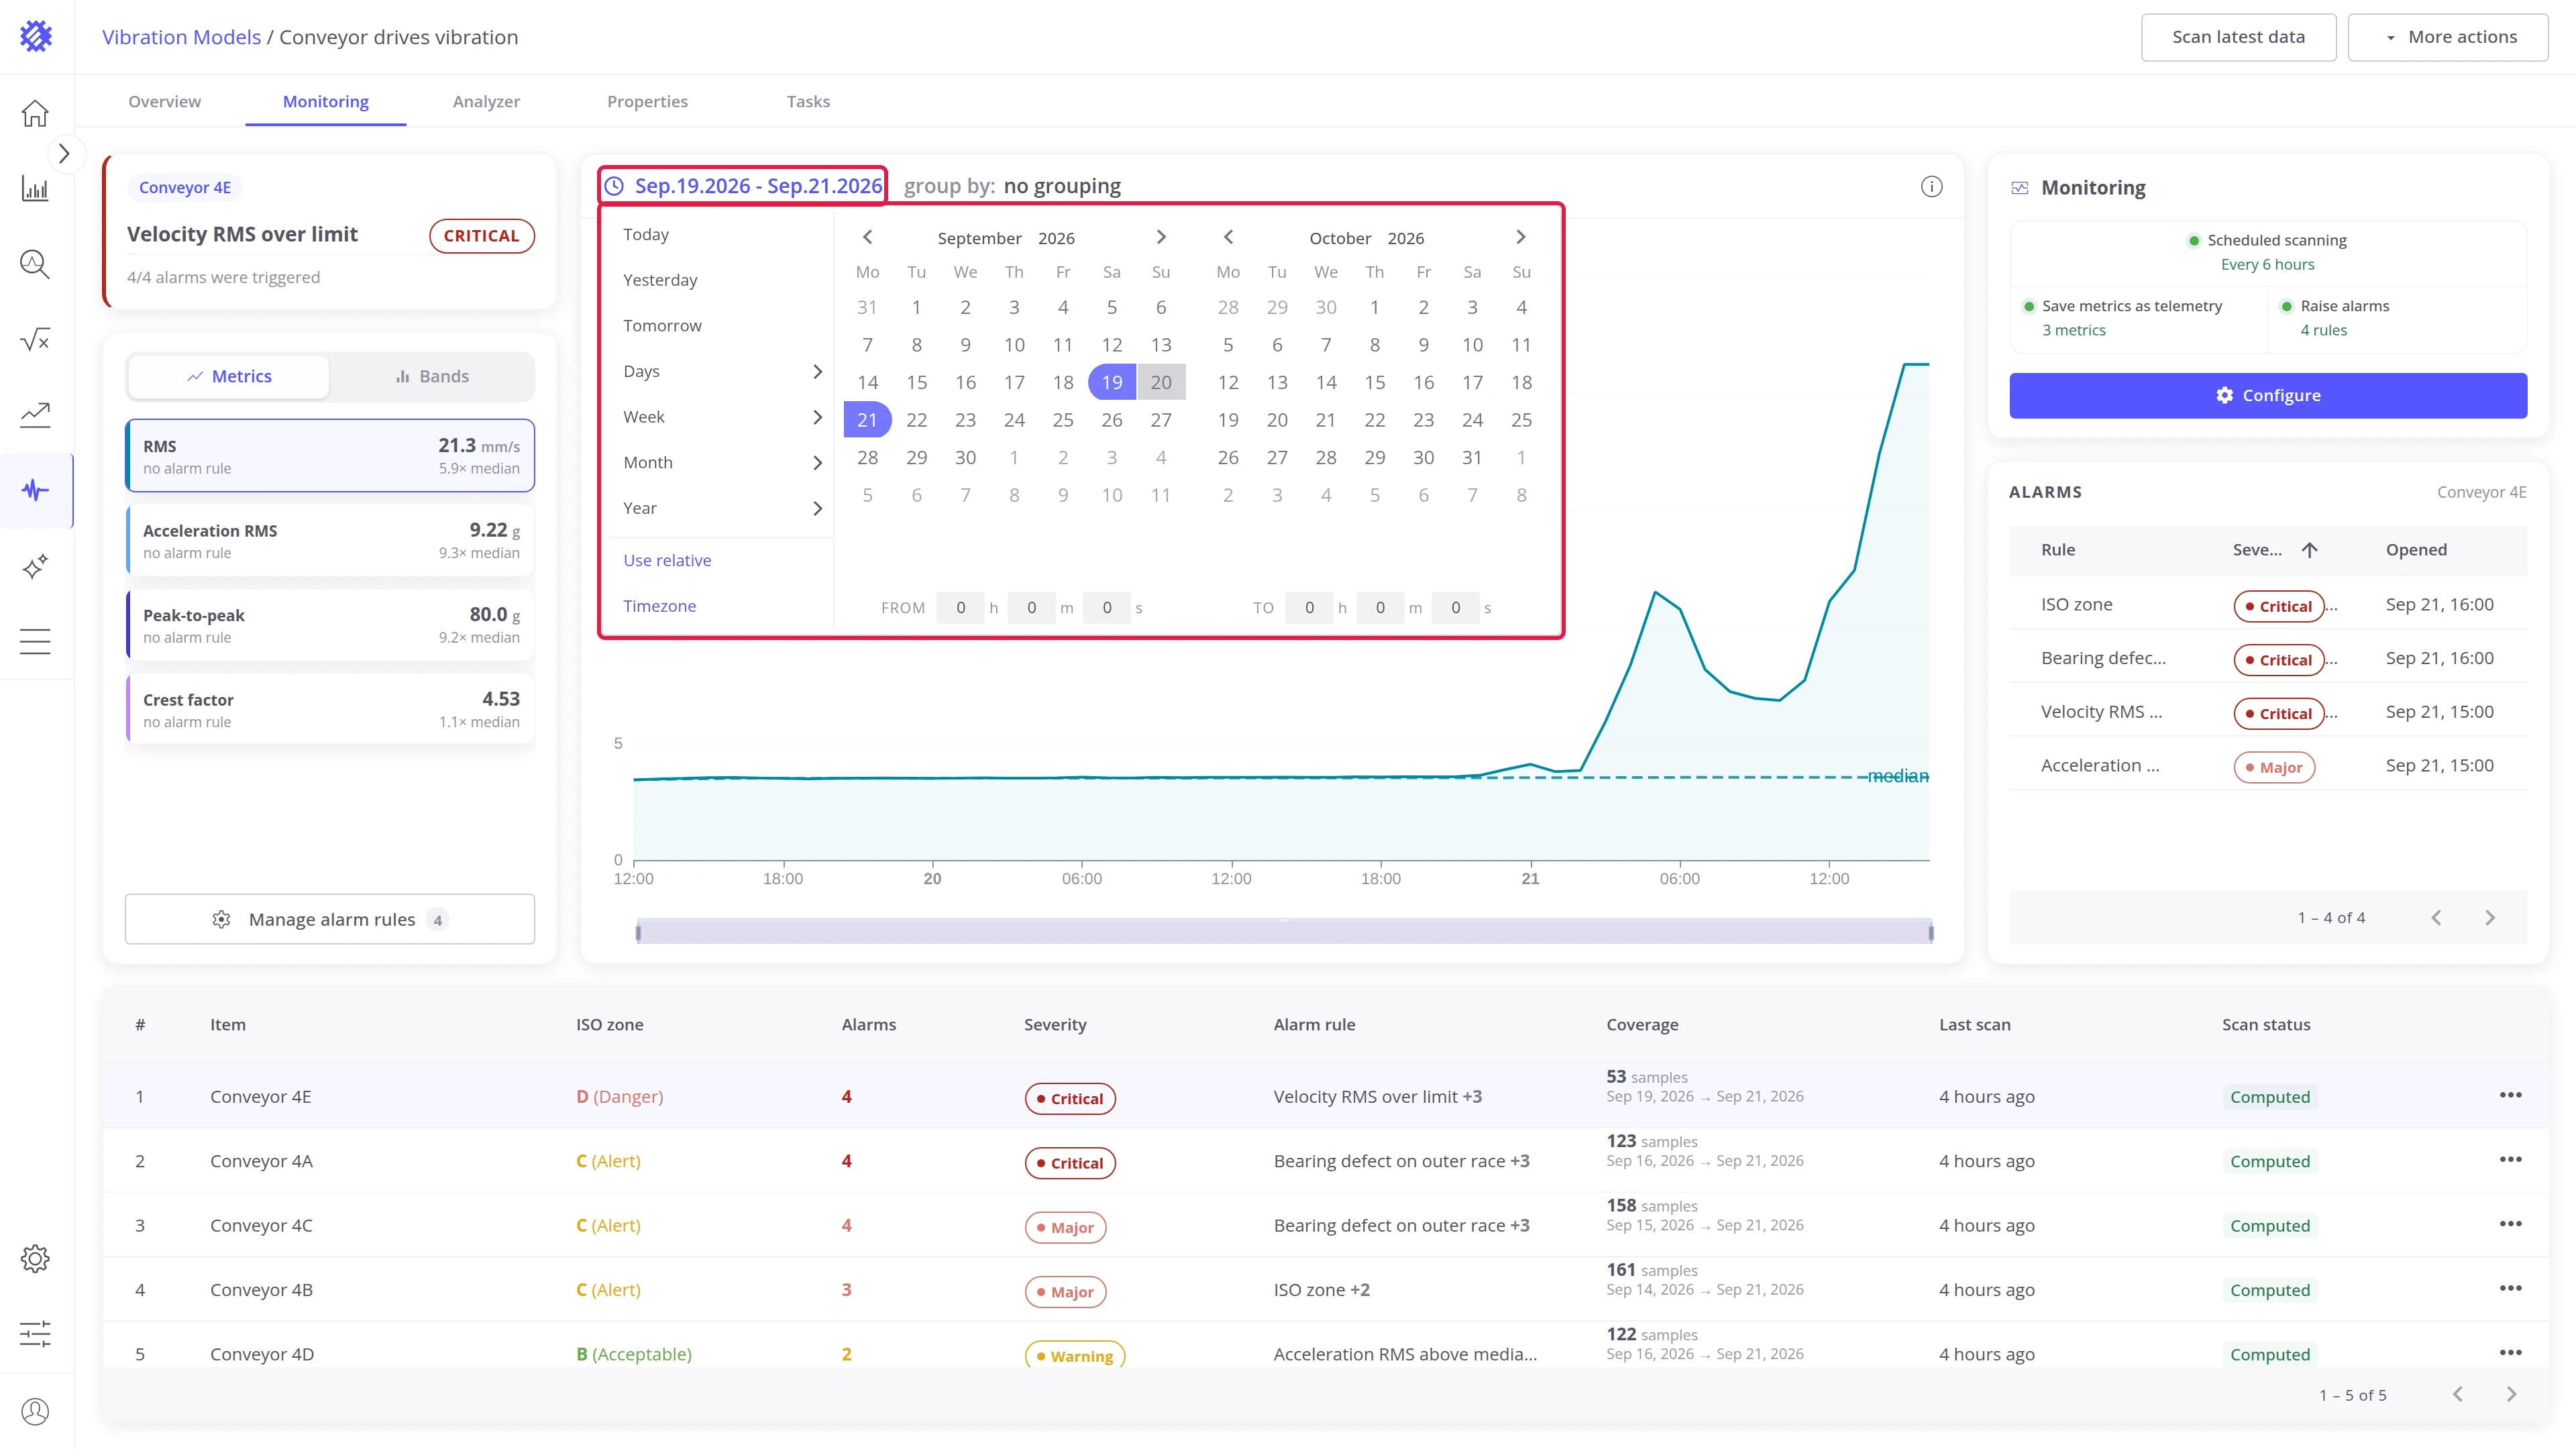
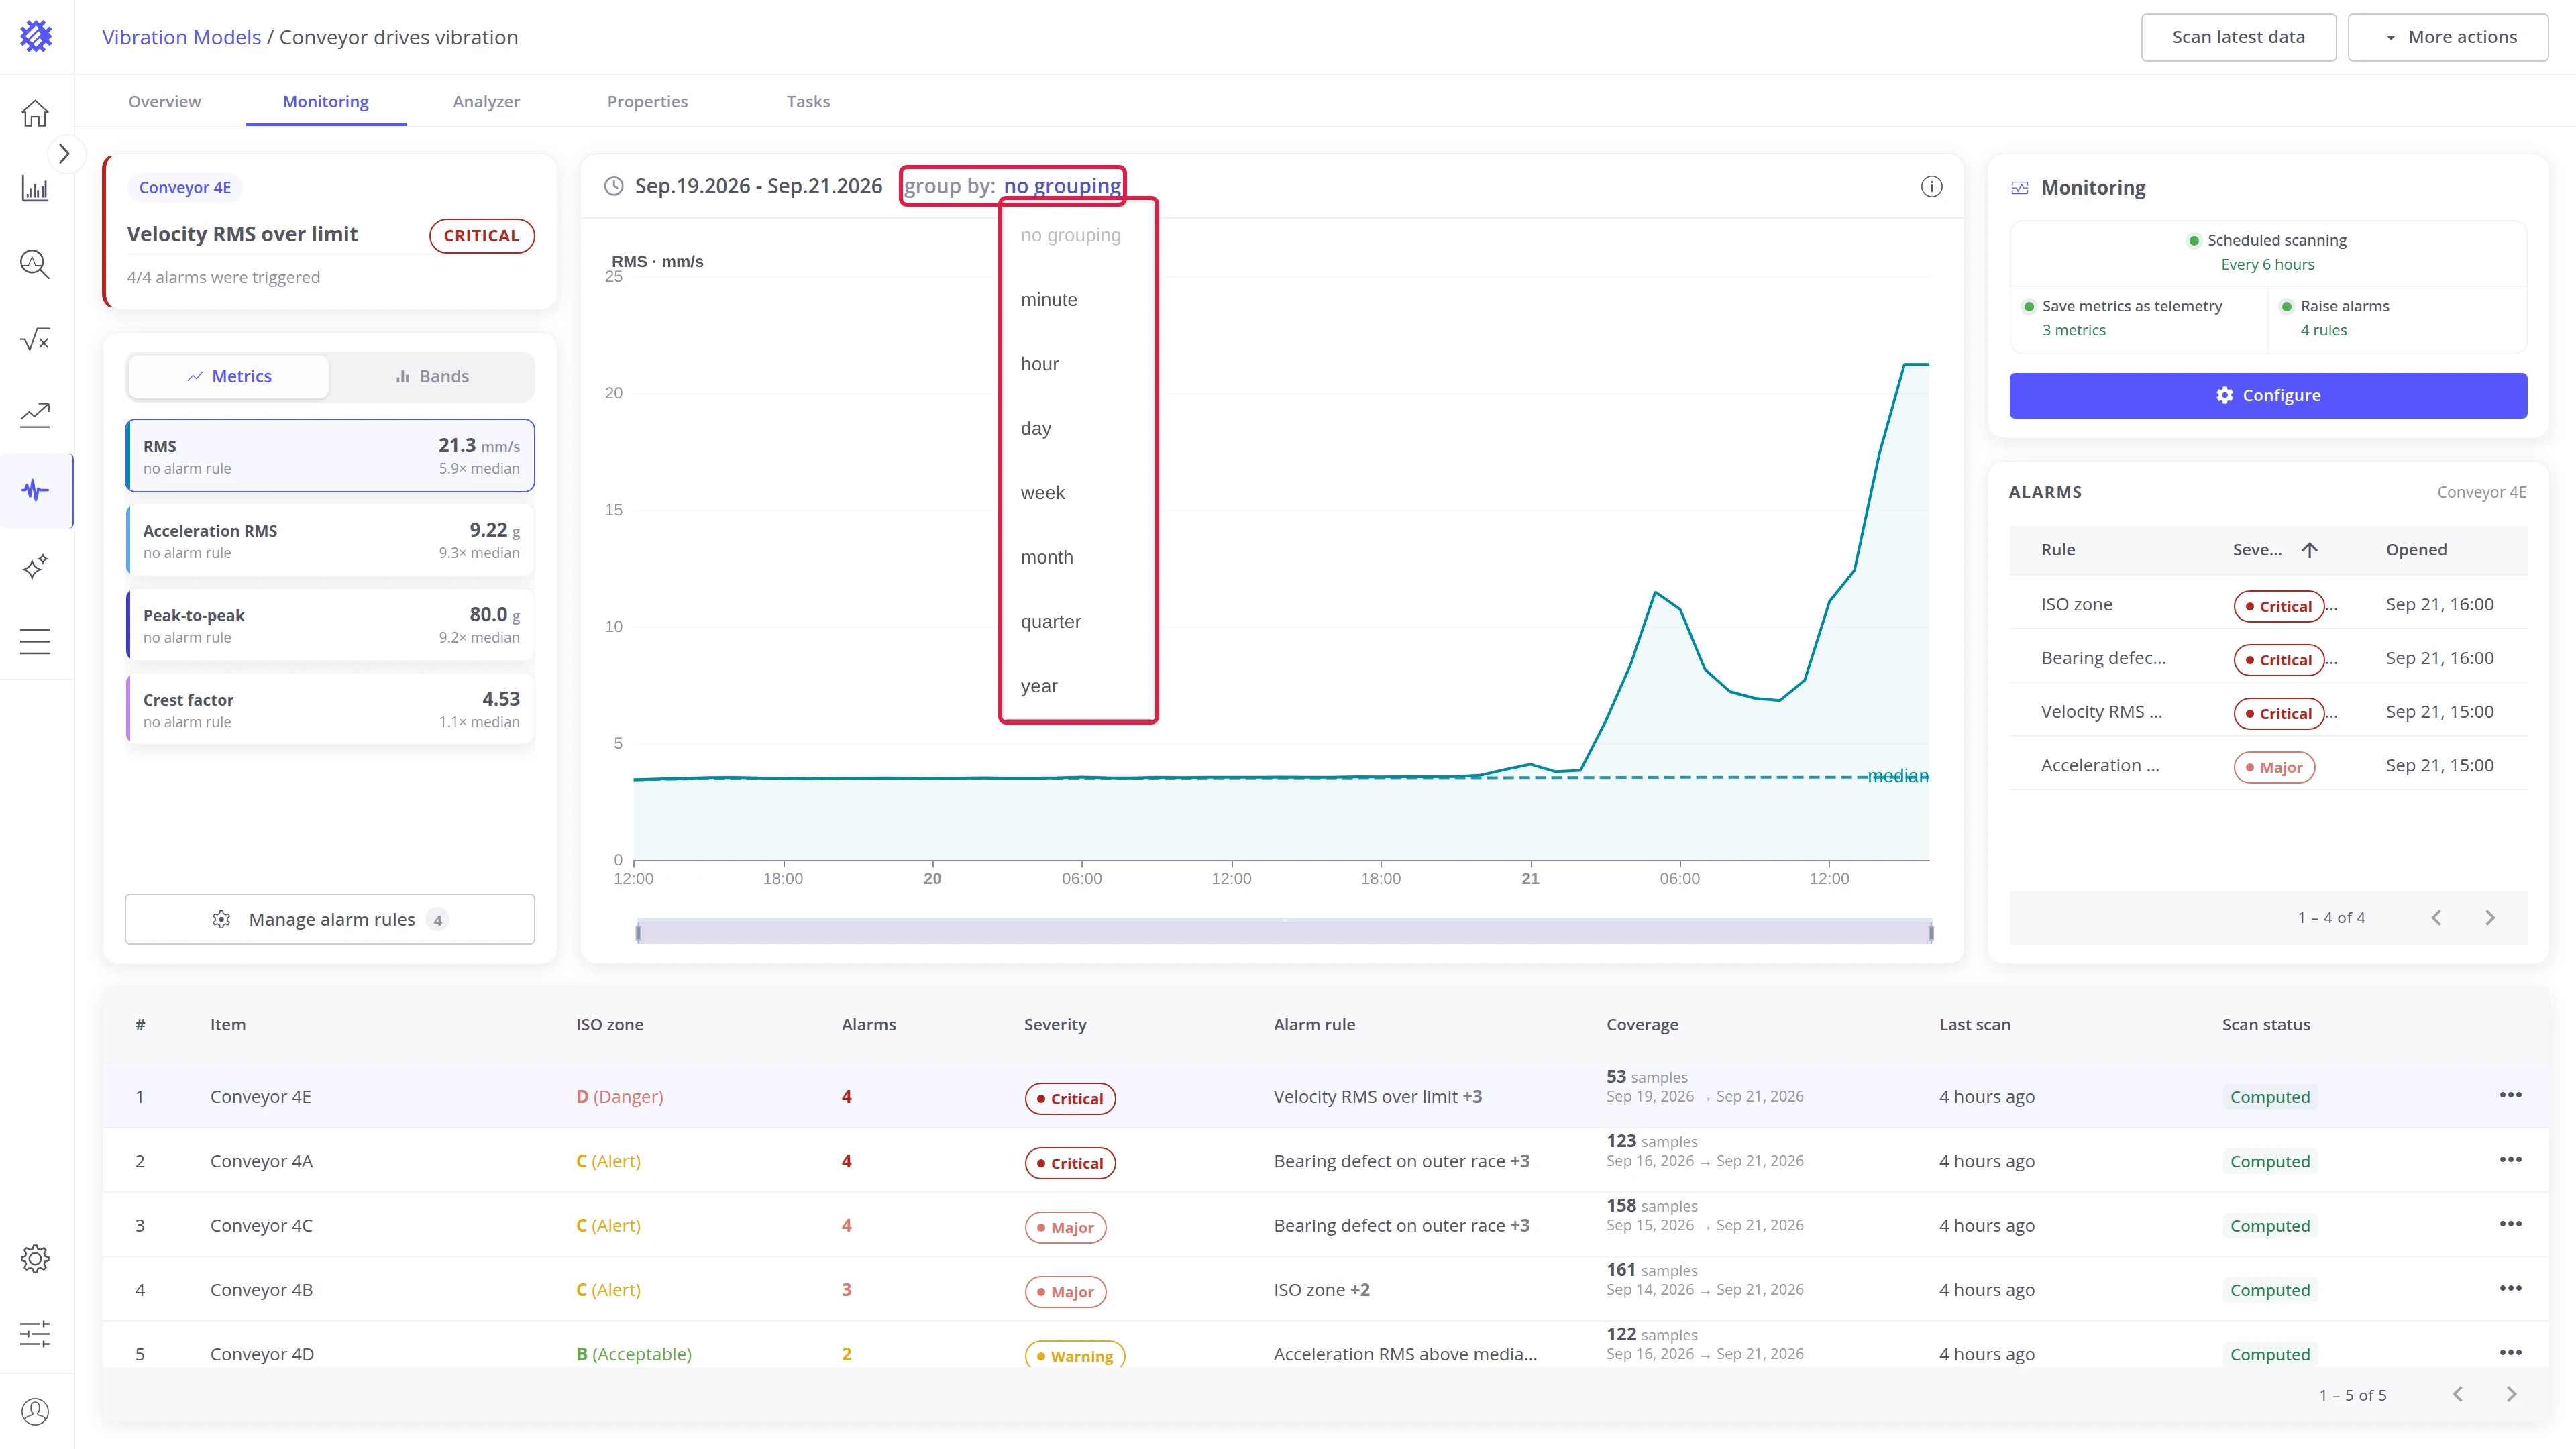
Use the date picker to change the time range, or Group by to plot one point per minute, hour, day, week, month, quarter, or year instead of every sample. Each point shows the highest value in its period.
Hover the chart to read a sample. With one series selected, the readout shows its value and its factor against the median; with all series charted, it shows every series at that moment.
Click a point to open that sample in the Analyzer tab. With grouping on, the point opens the sample with the highest value in its bucket. Drag the slider under the chart to zoom in on part of the window.
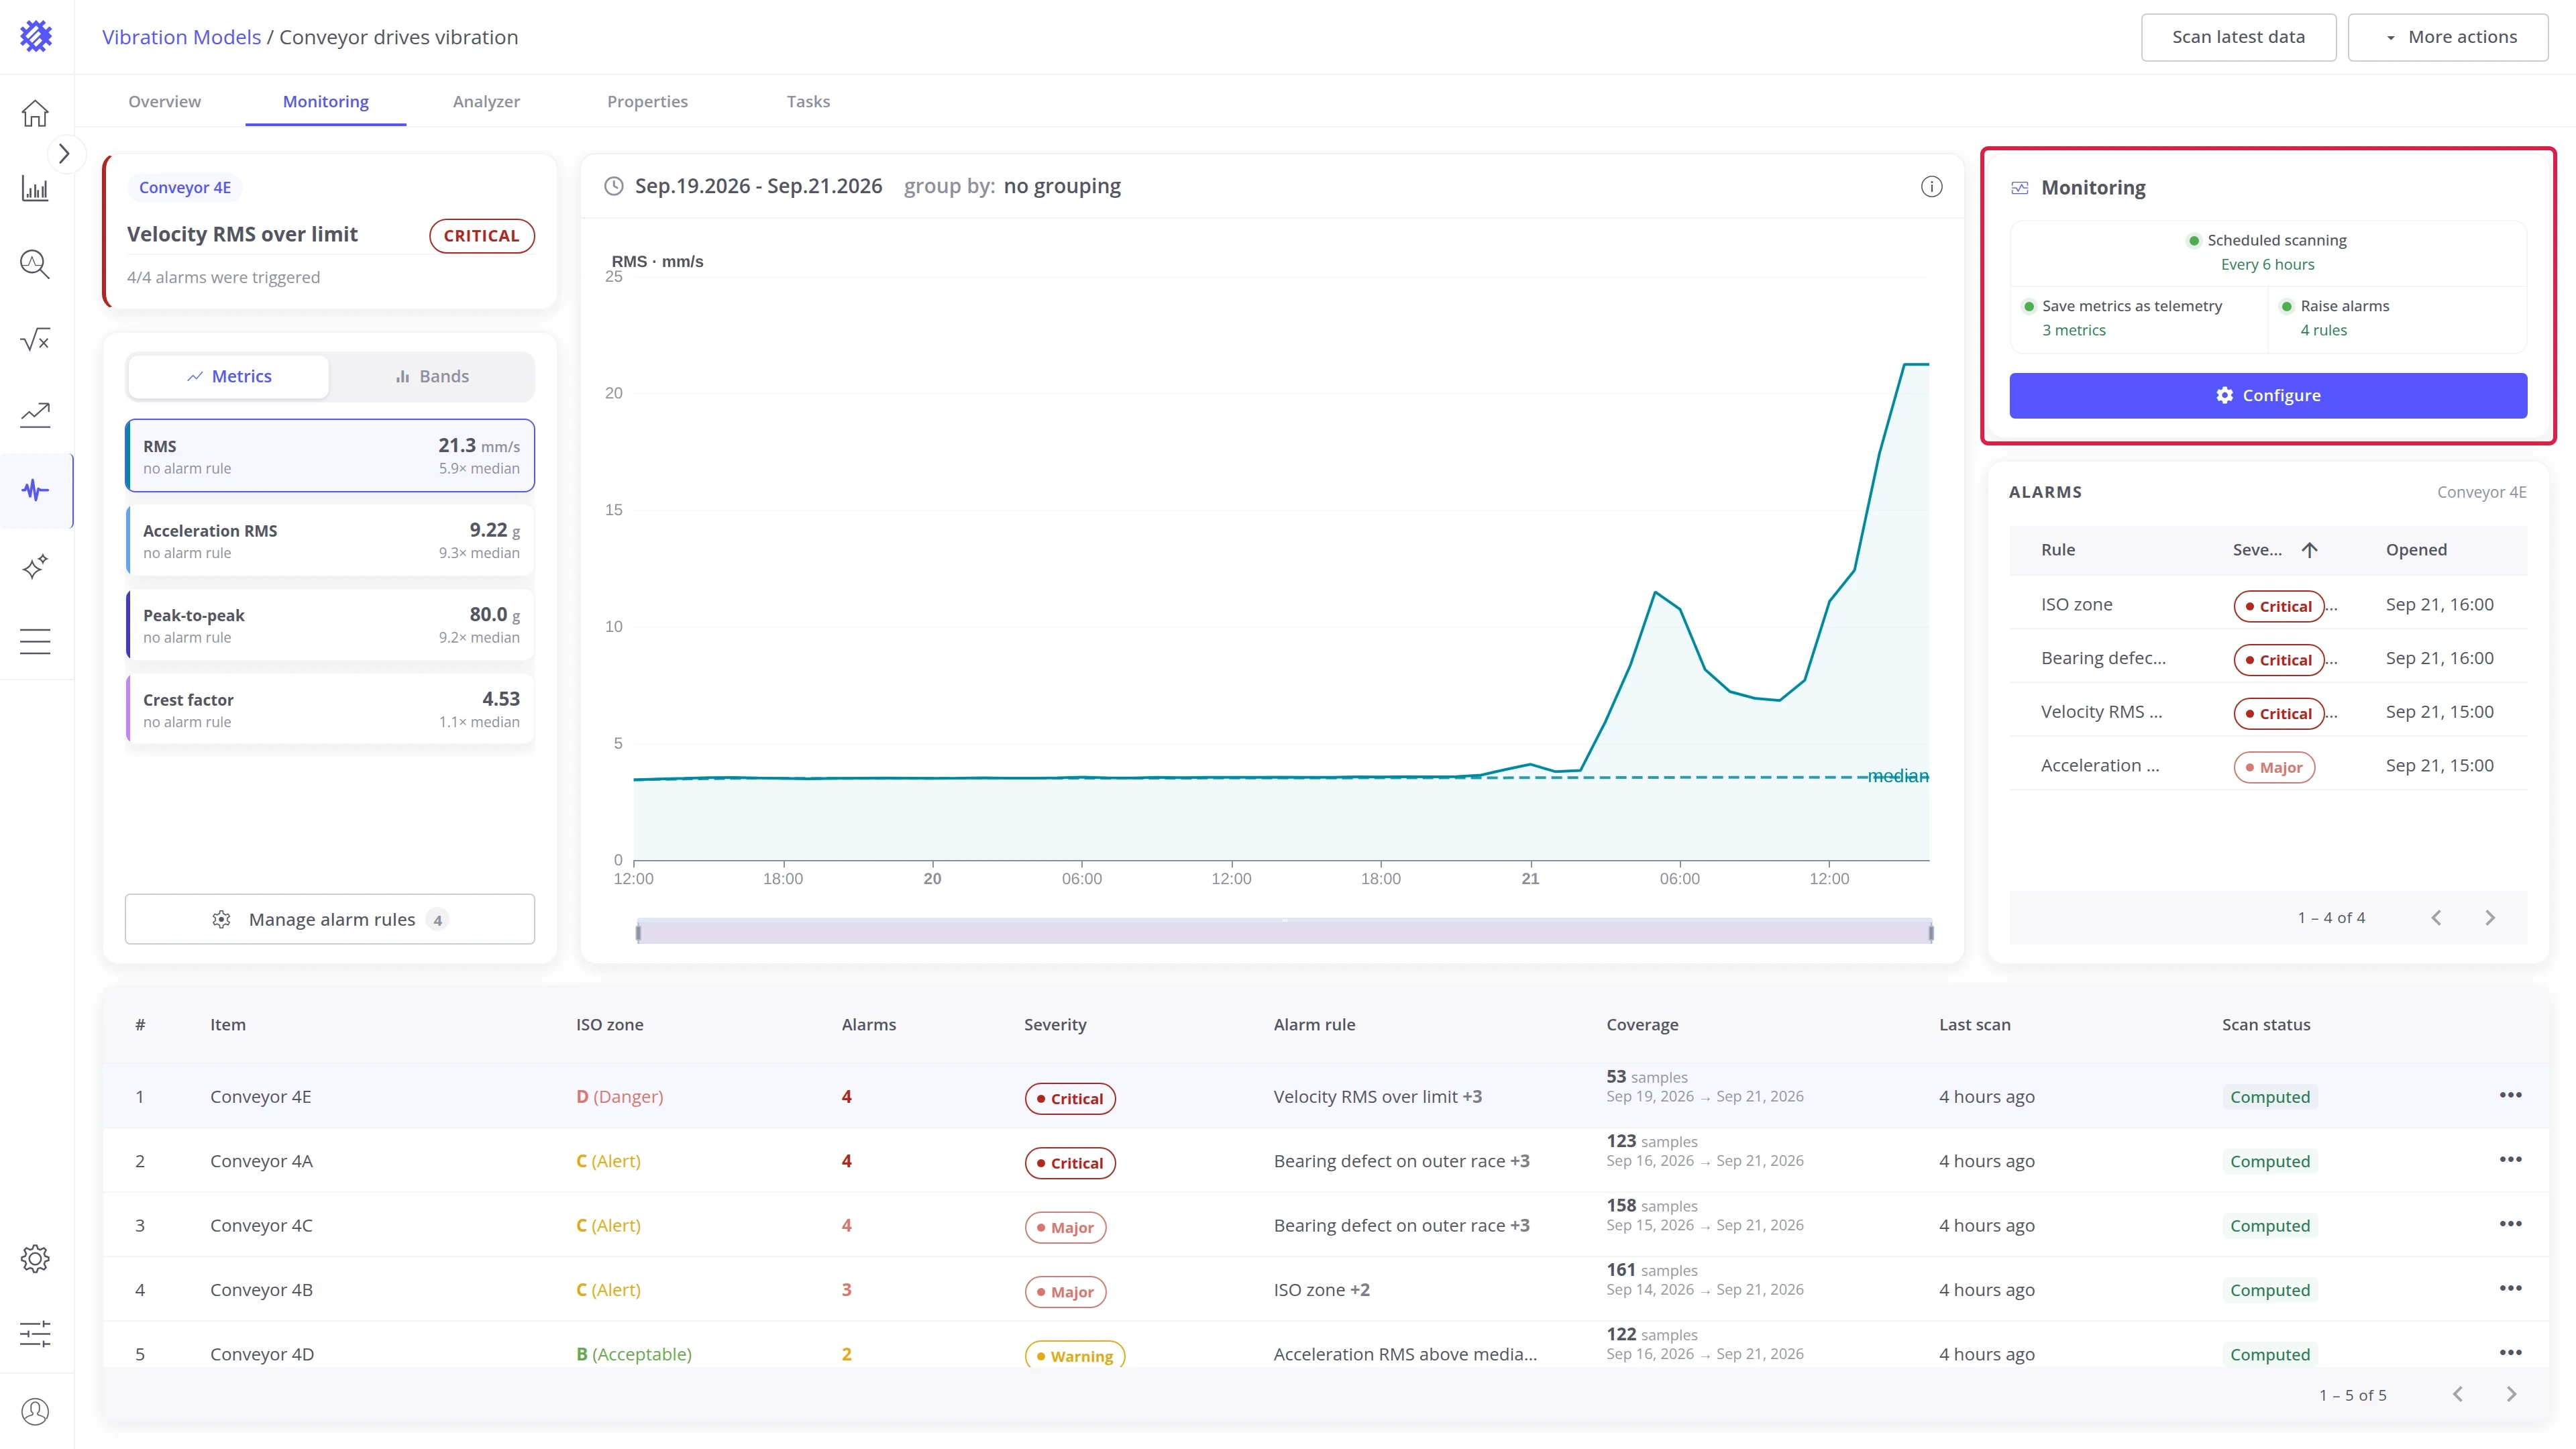
Monitoring card
Section titled “Monitoring card”The card on the right shows the state of continuous monitoring for the model. How continuous monitoring works is described in Monitoring & Alarms.
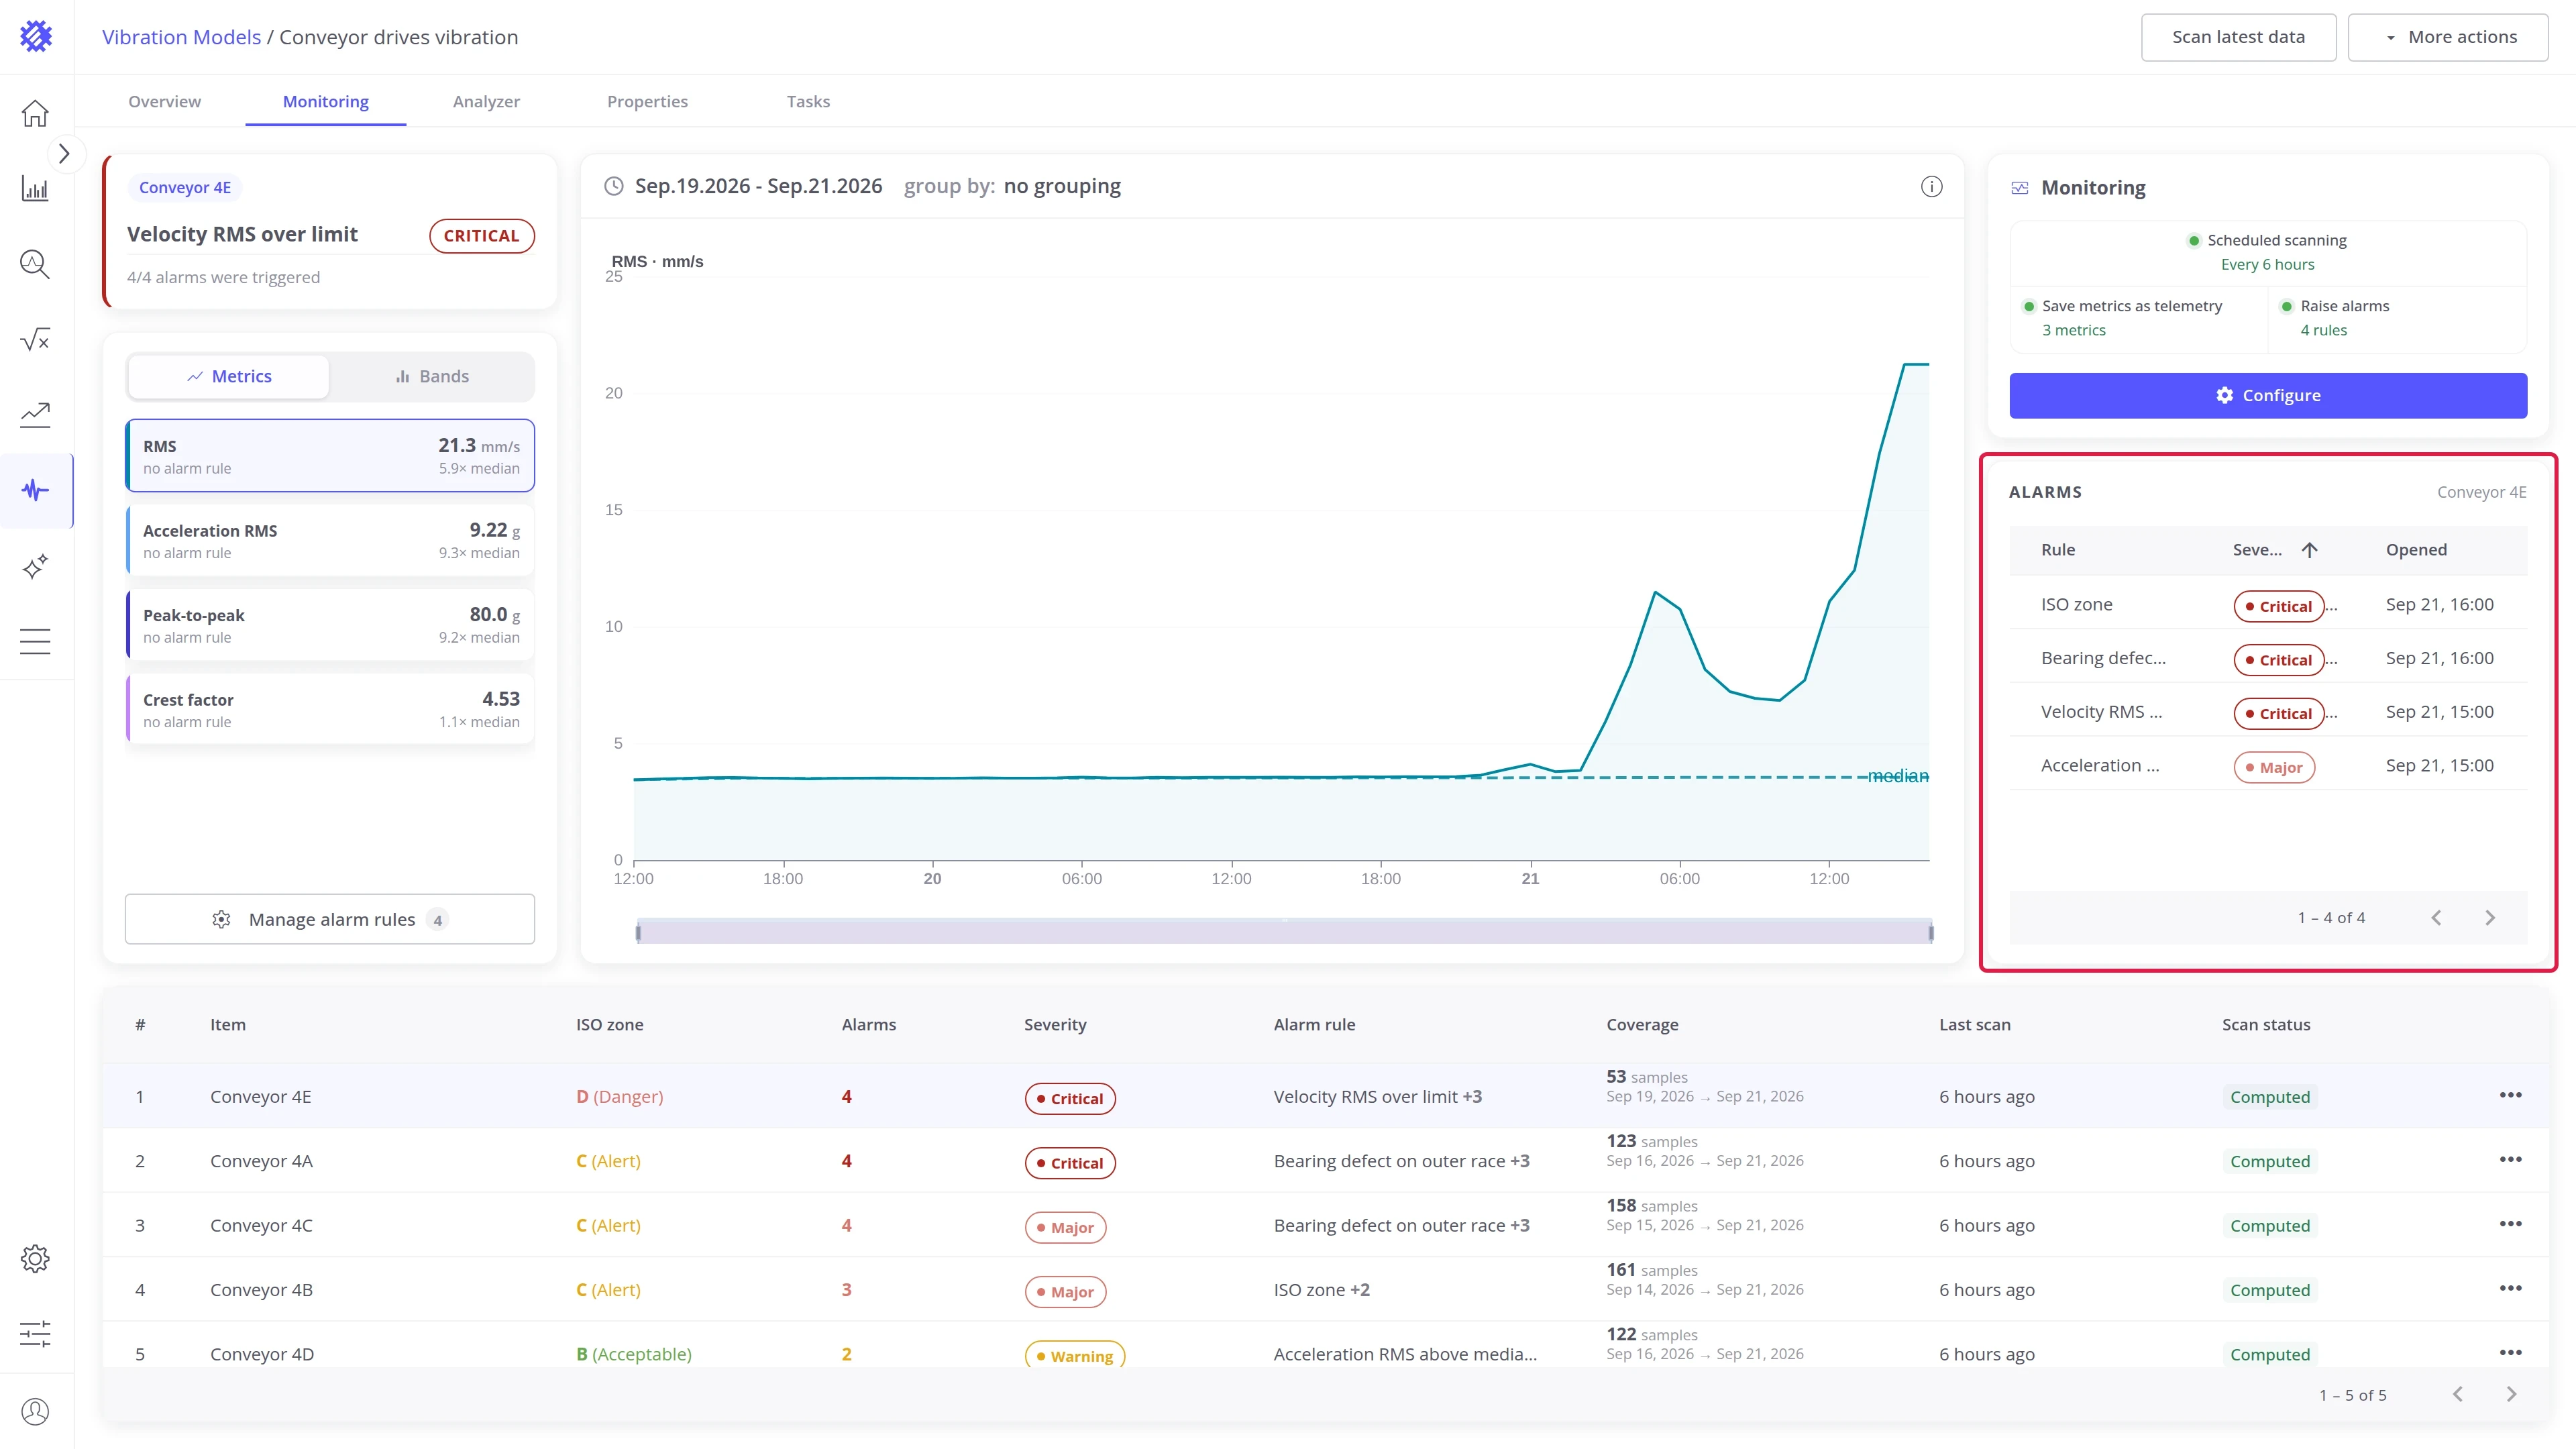
Alarms card
Section titled “Alarms card”The alarm episodes of the selected machine: the Rule that fired, its Severity, and when it Opened. Sort by any column, and page through with the arrows at the bottom. With nothing open, the card reads Everything OK.
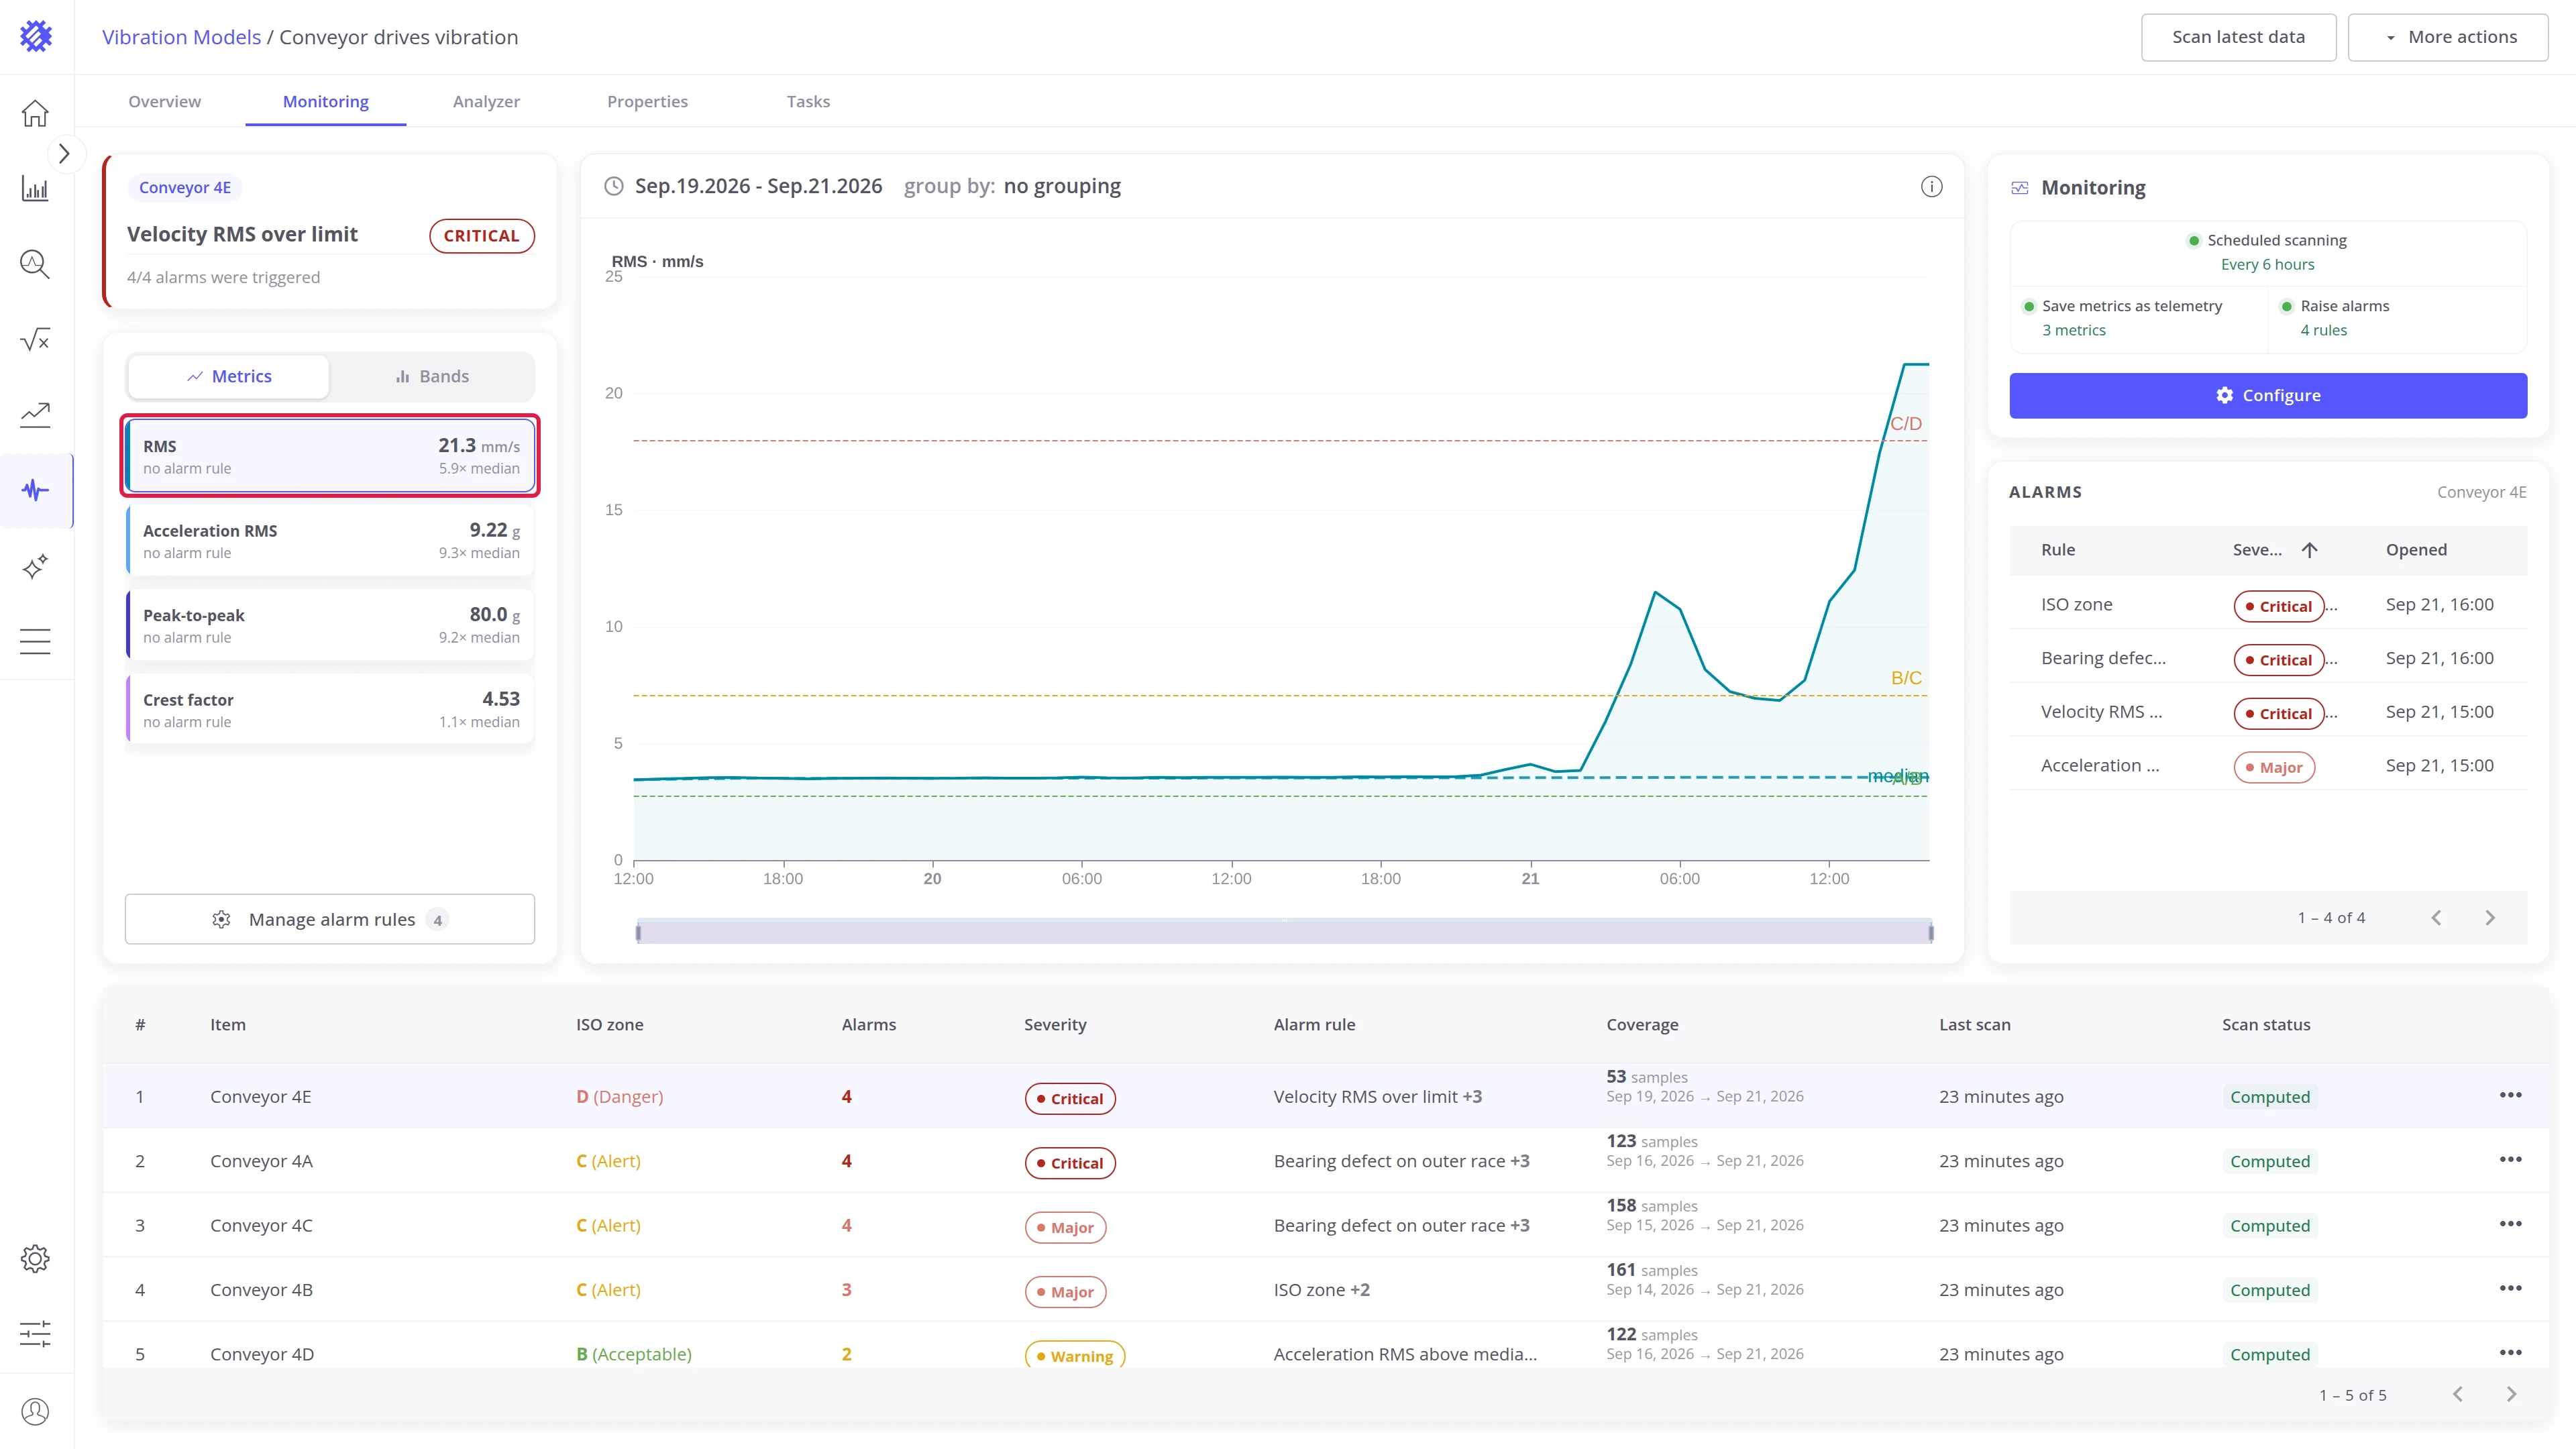
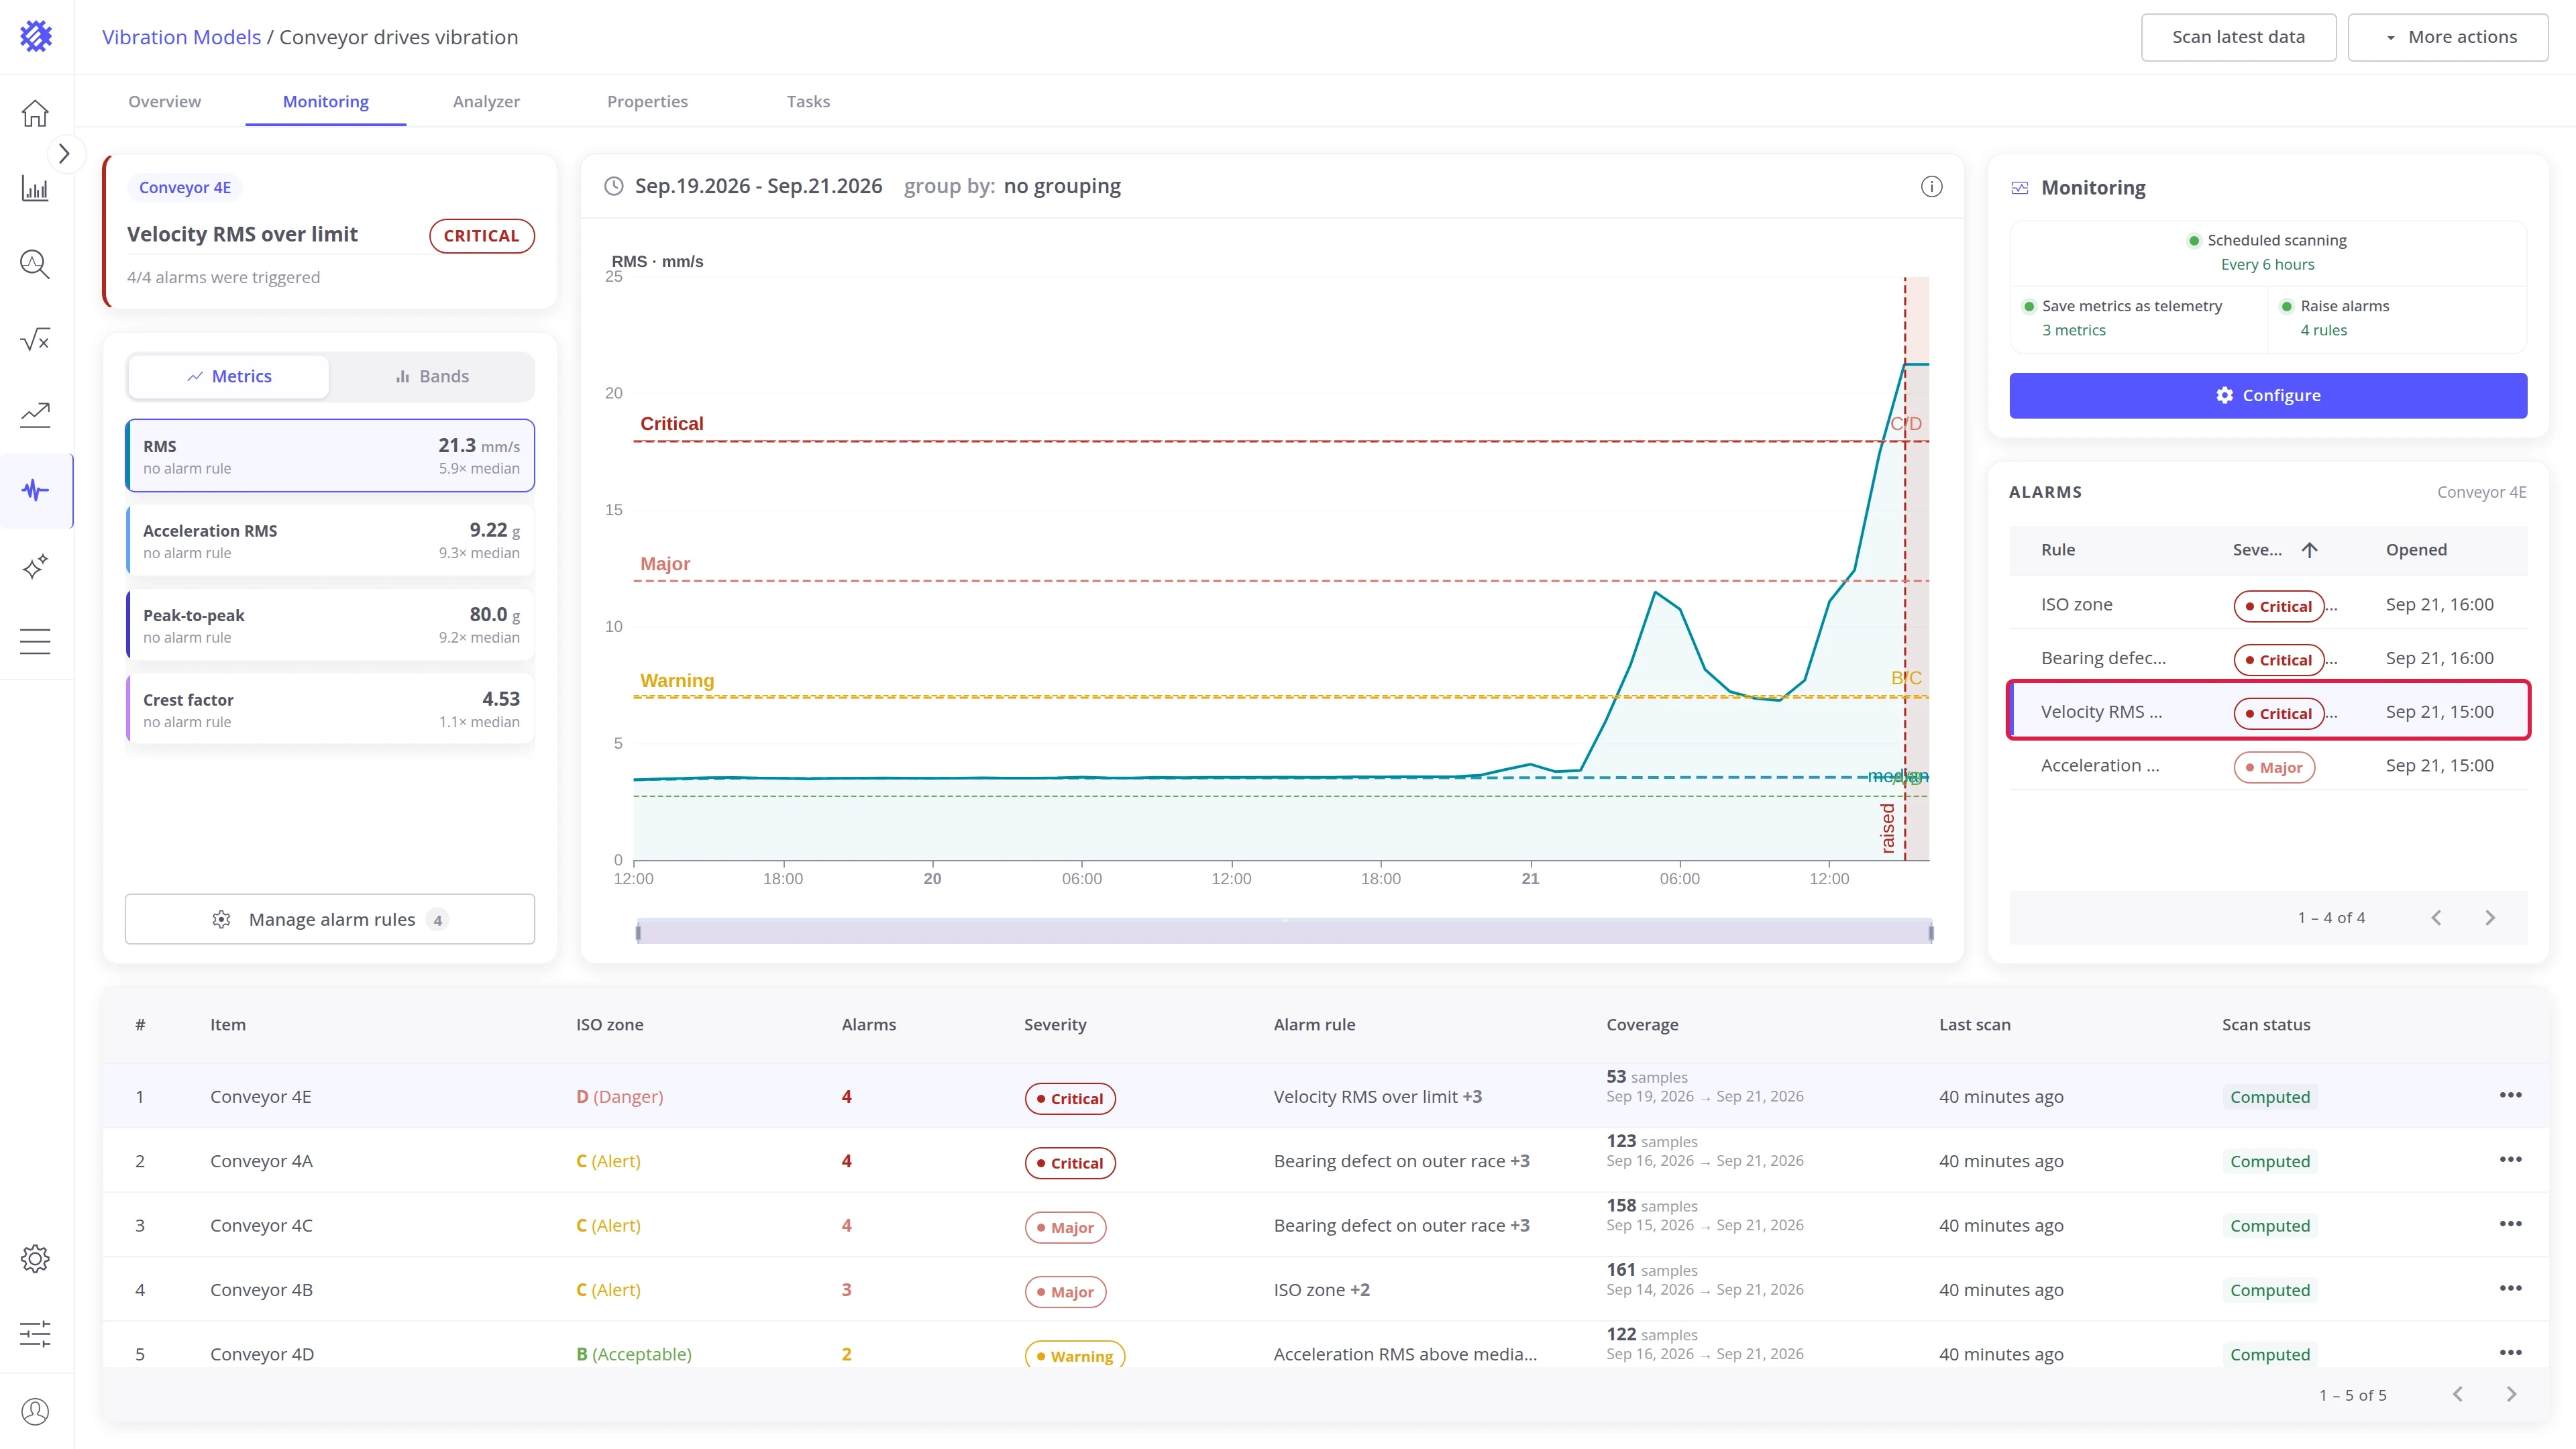
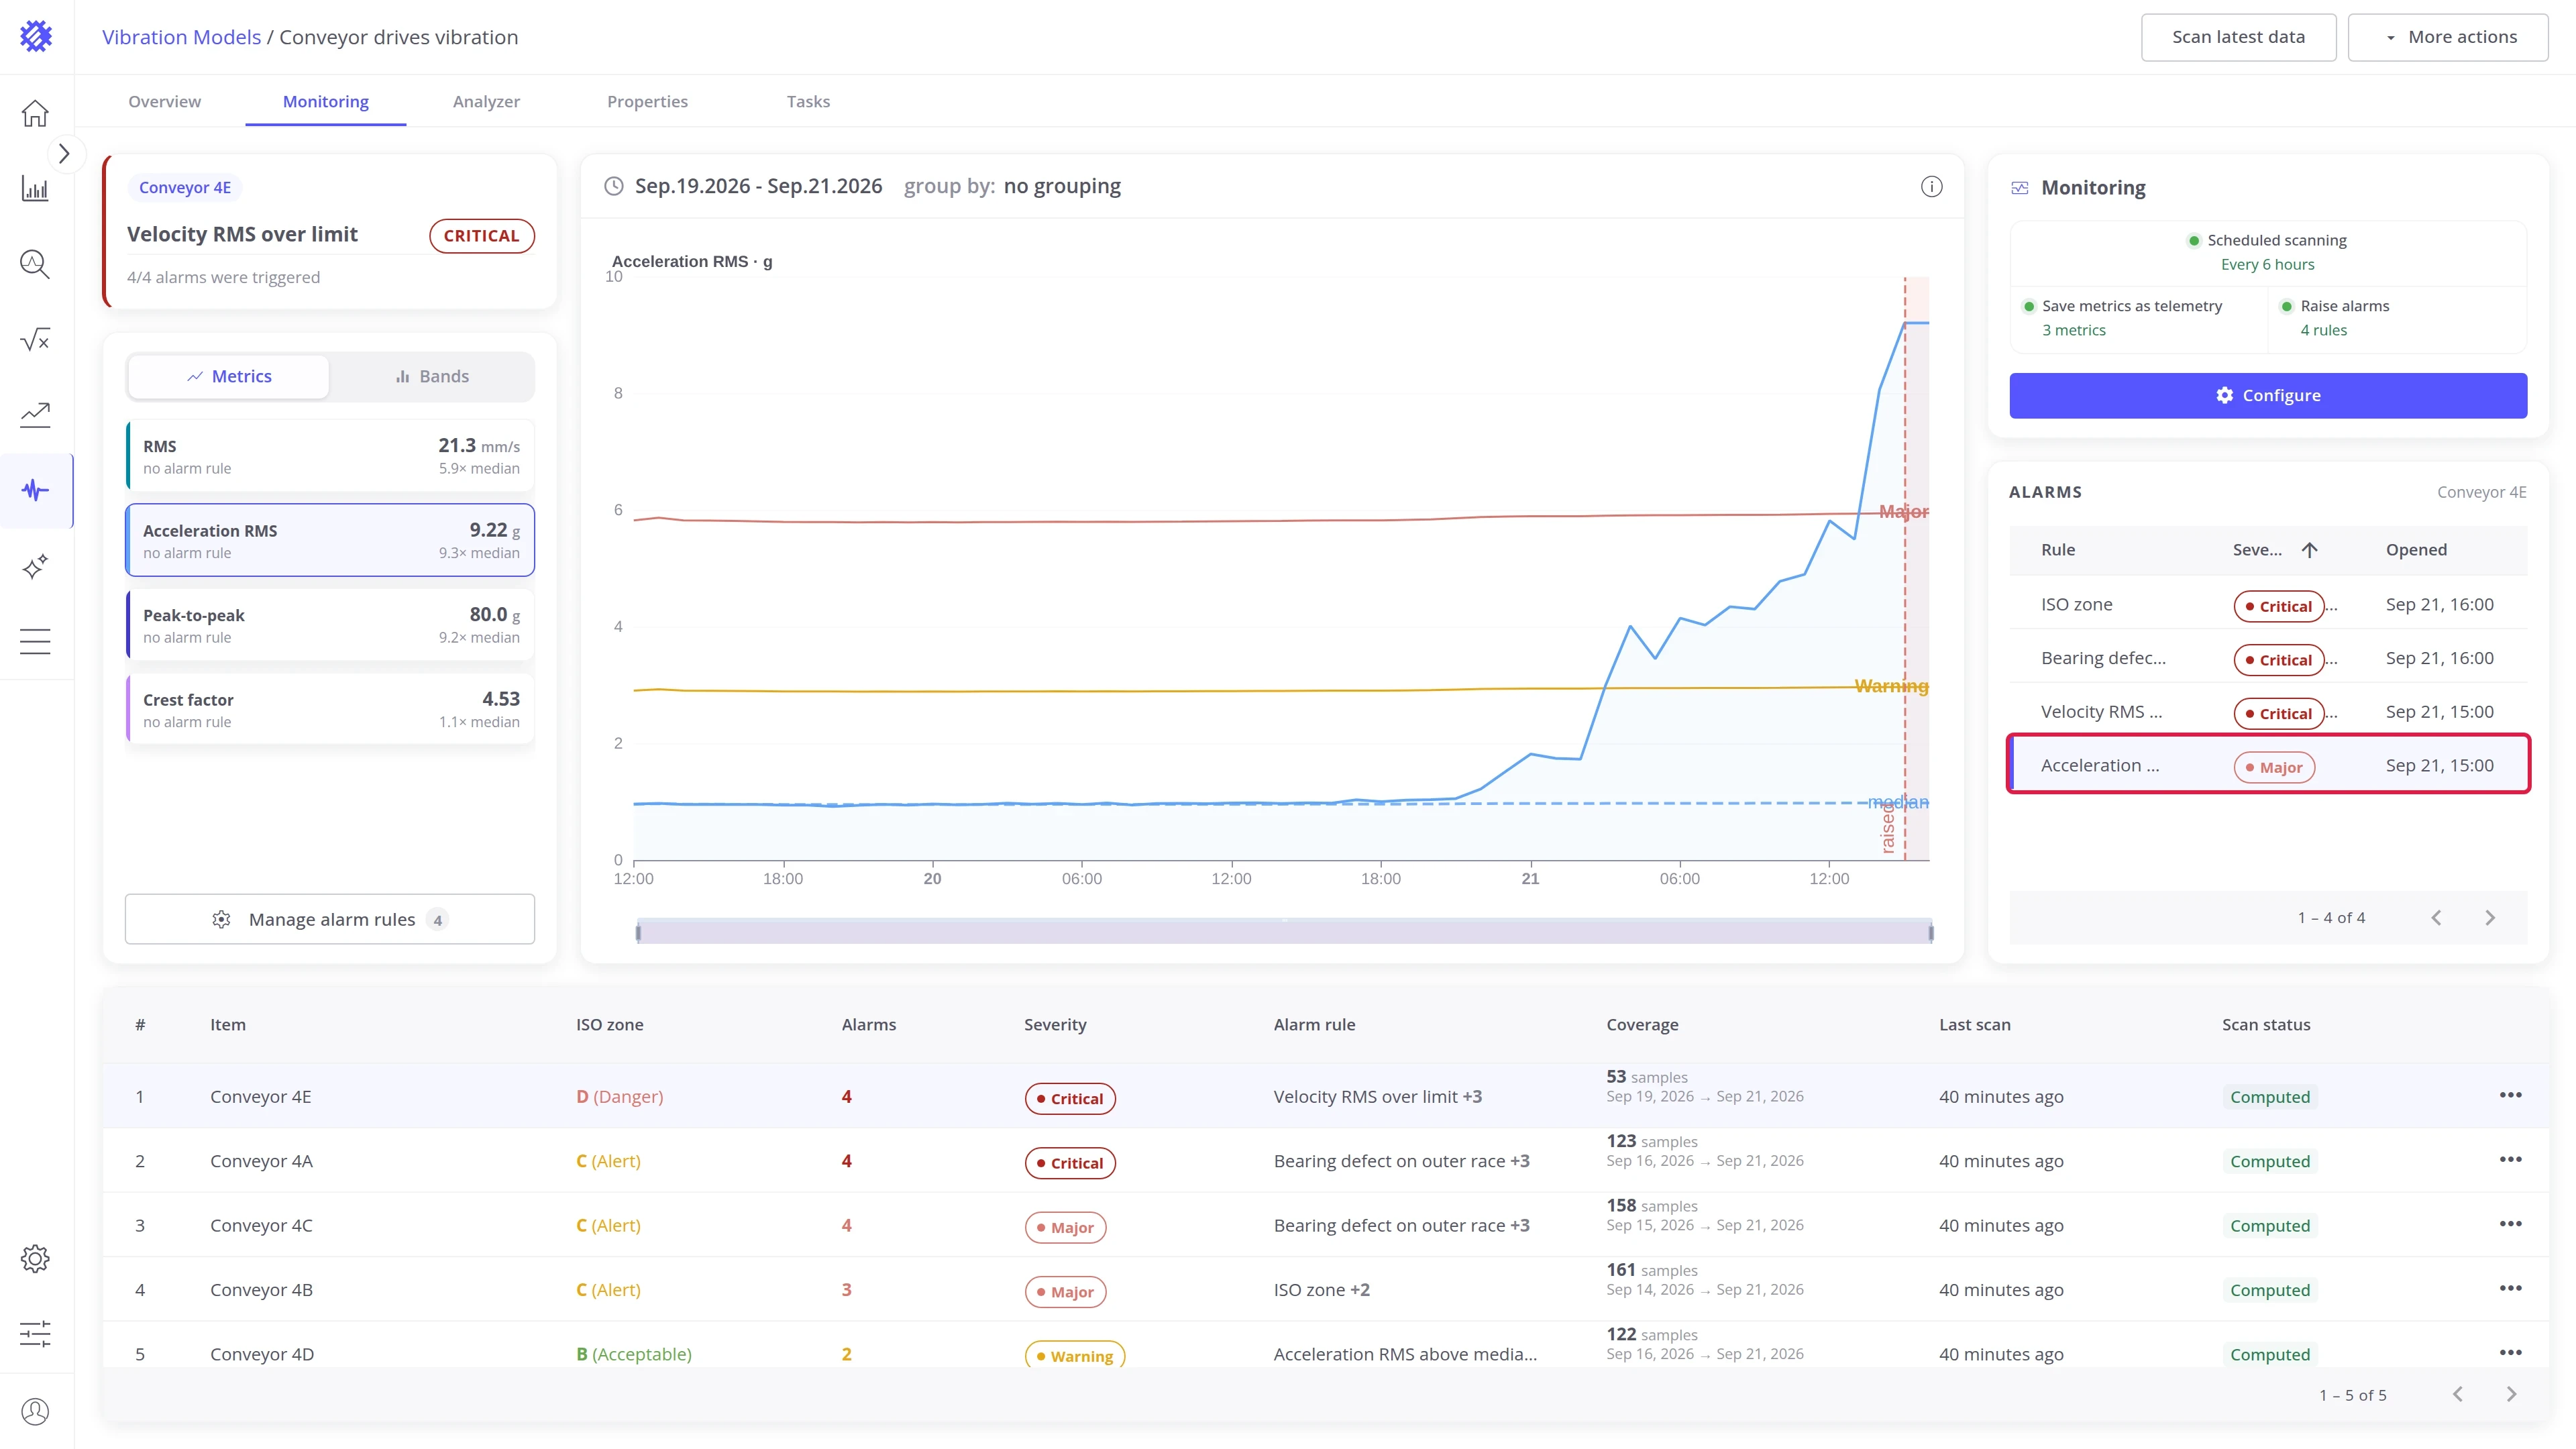
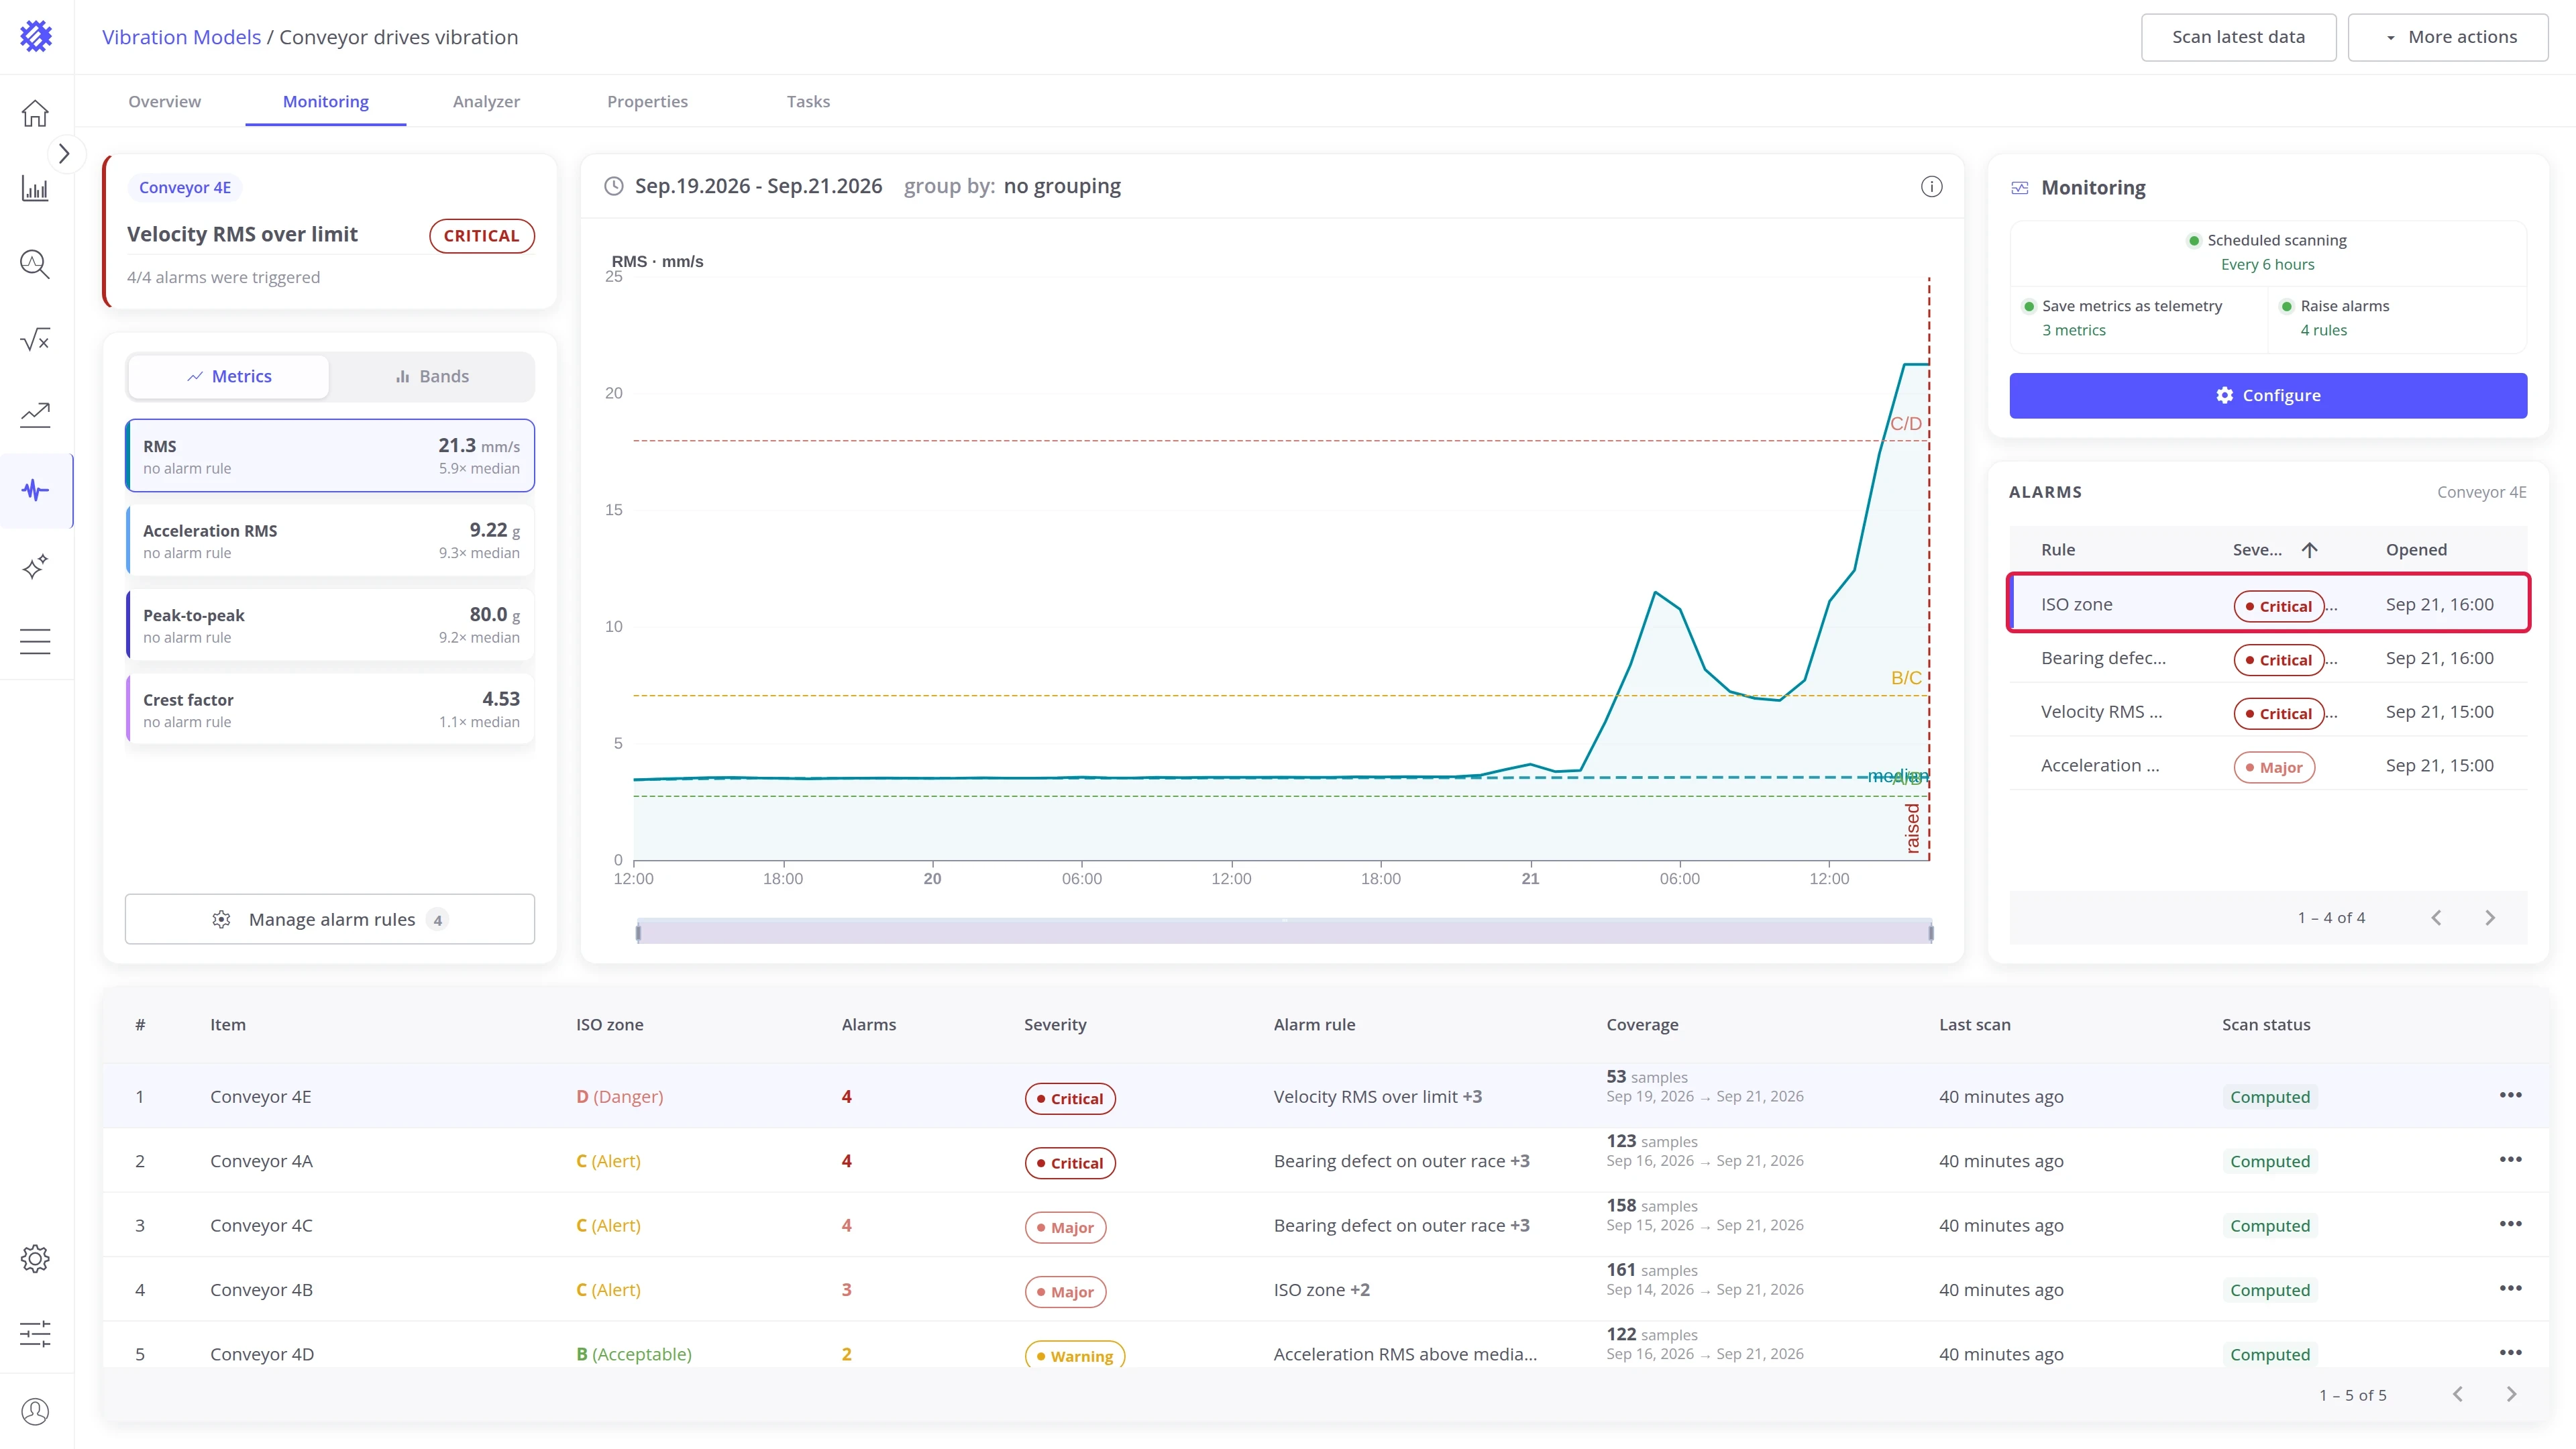
Click an alarm to see it on the chart. The chart shades the time the alarm has been open, in its severity color, and switches to what the rule watches:
| Rule | The chart shows |
|---|---|
| Reading over a limit on a metric or a band | That metric or band, with a line for each severity level it crossed |
| Reading over a limit on Any metric or Any band | Every series of the category, each with its own levels |
| ISO zone | Velocity RMS, the reading the ISO zones are graded on, with the zone borders |
Shaft fault and bearing defect alarms are not drawn on the chart; open the sample in the Analyzer tab to see the fault frequencies. Click the alarm again to clear the chart.
Items table
Section titled “Items table”Every machine of the model. Click a row to switch the cards above to that machine.
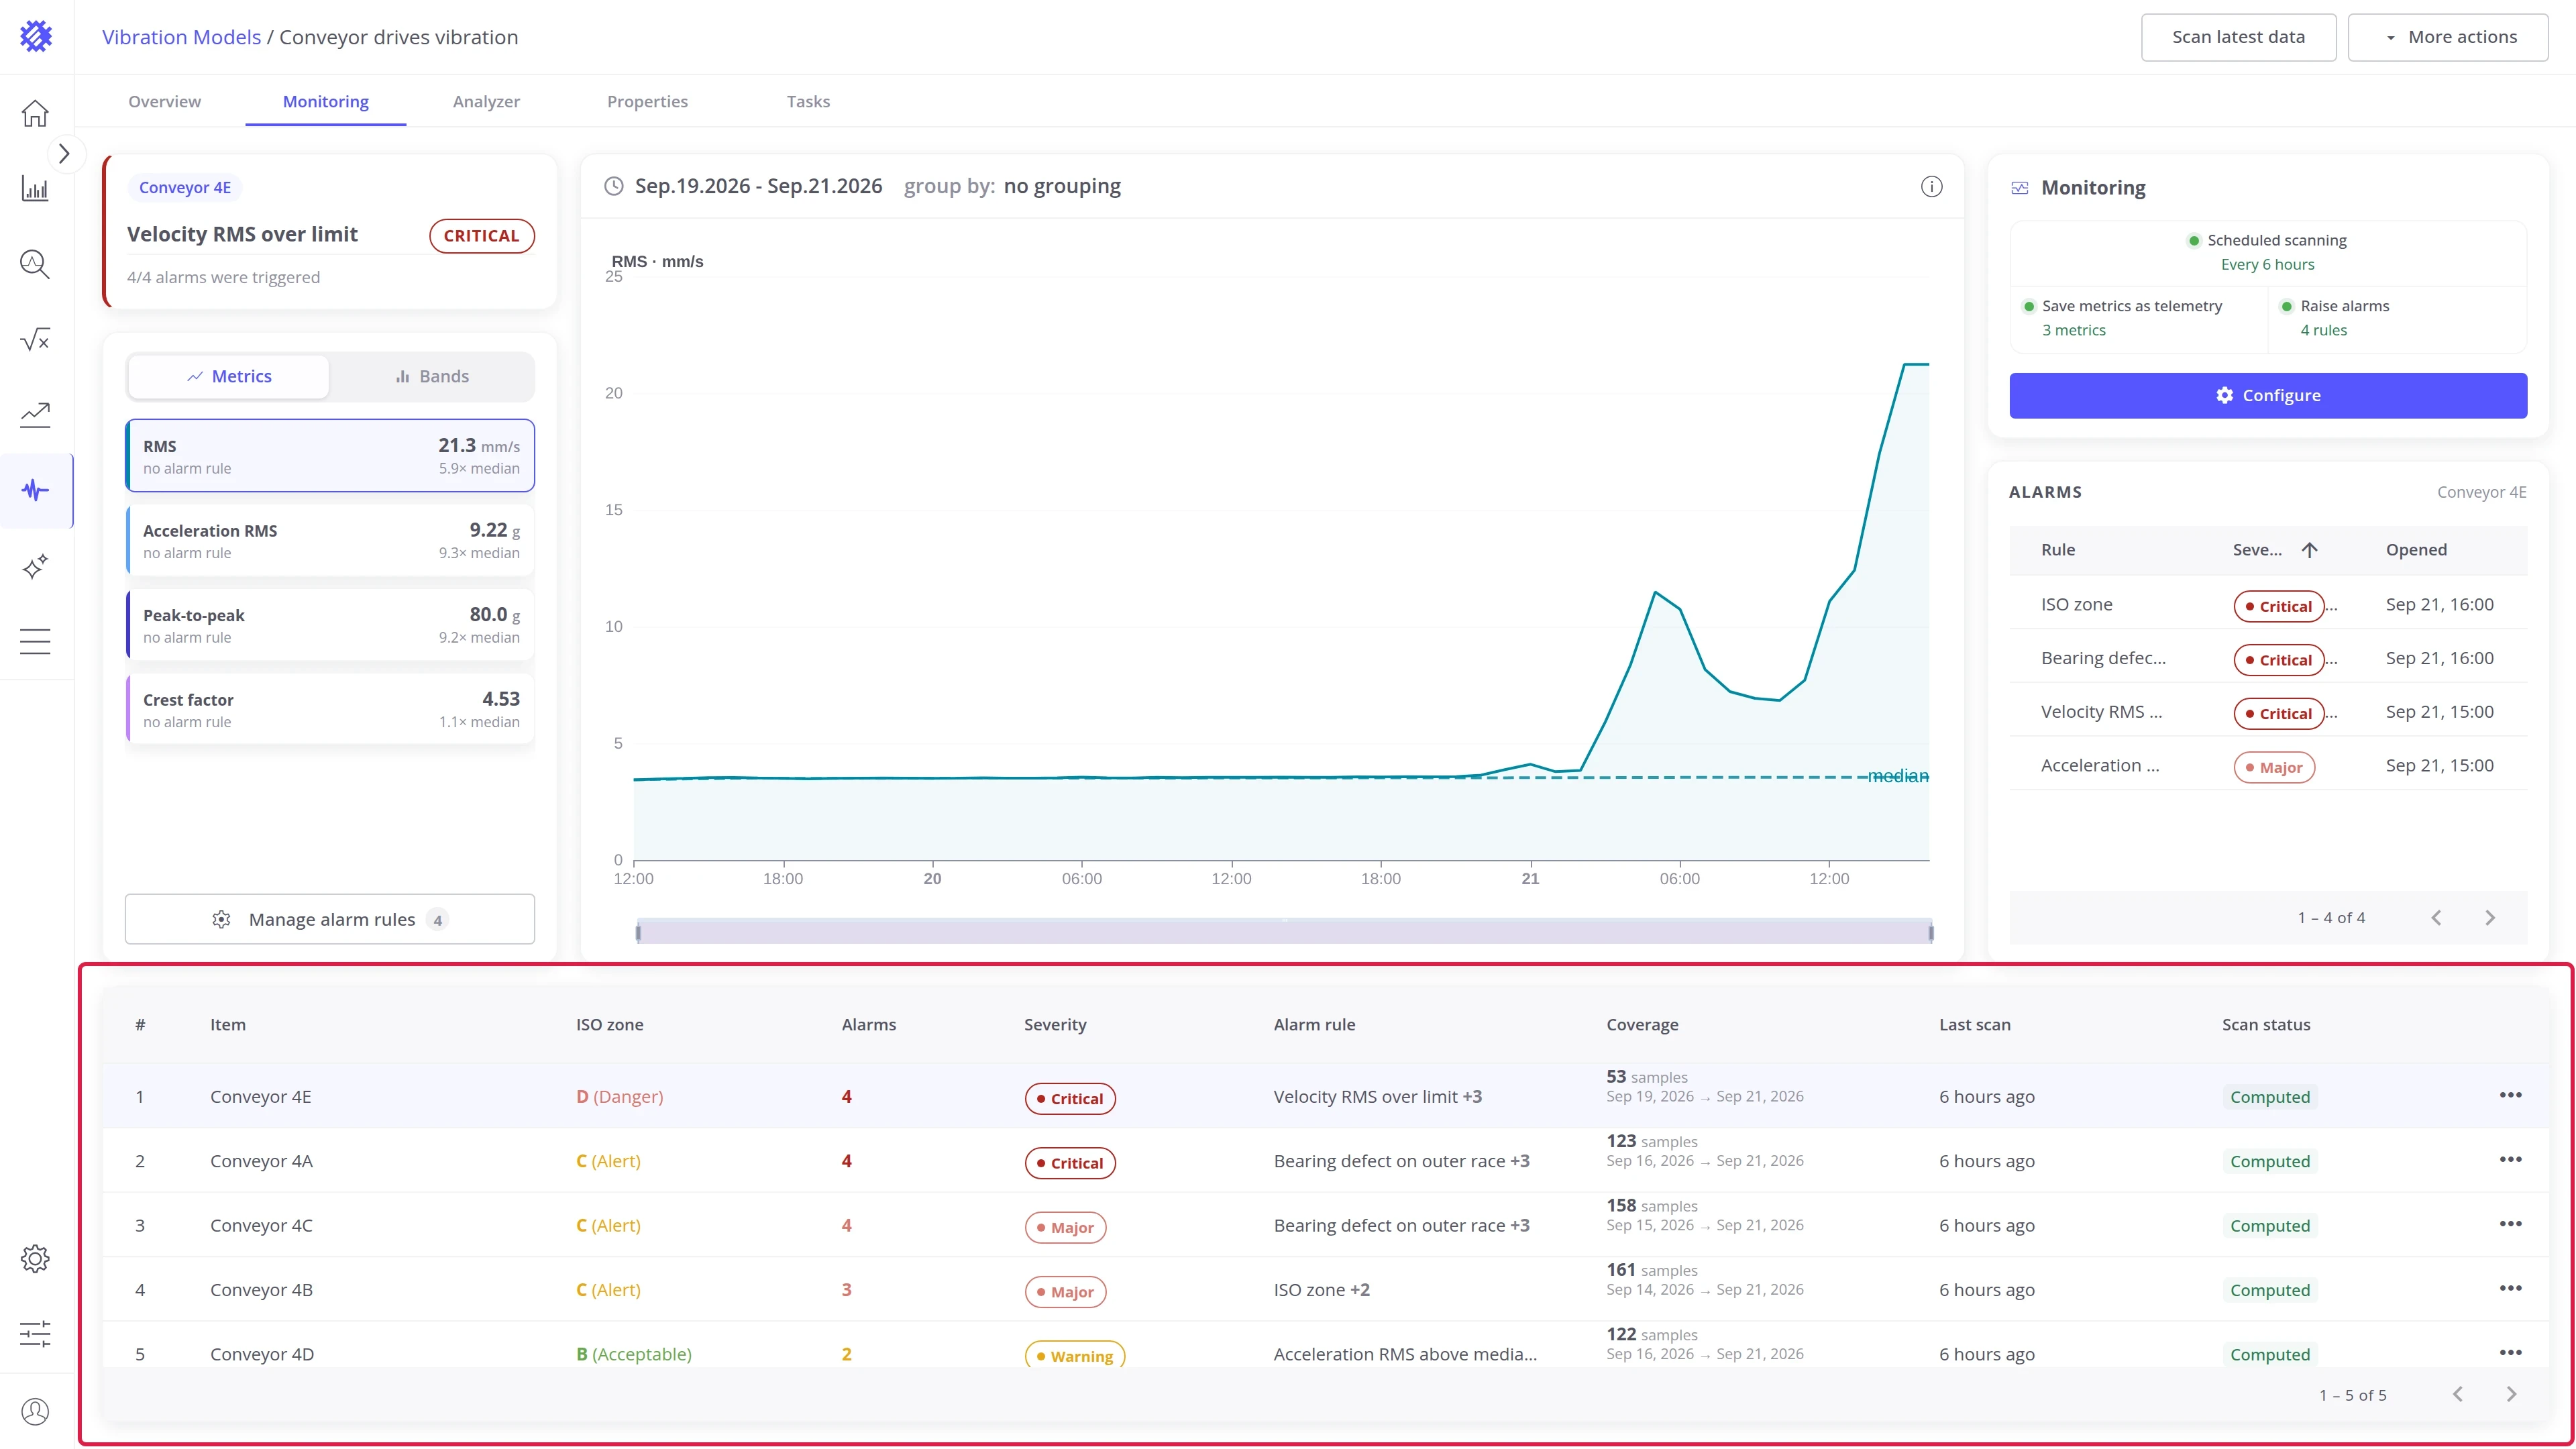
| Column | Description |
|---|---|
| Item | The machine |
| ISO zone | The zone of its latest sample |
| Alarms | How many episodes are open on it |
| Severity | The worst of them |
| Alarm rule | The rule behind that severity, with a count of the others |
| Coverage | Samples stored for this machine, and the span they cover |
| Last scan | When a scan last covered it |
| Scan status | Where it stands in the current or last scan |
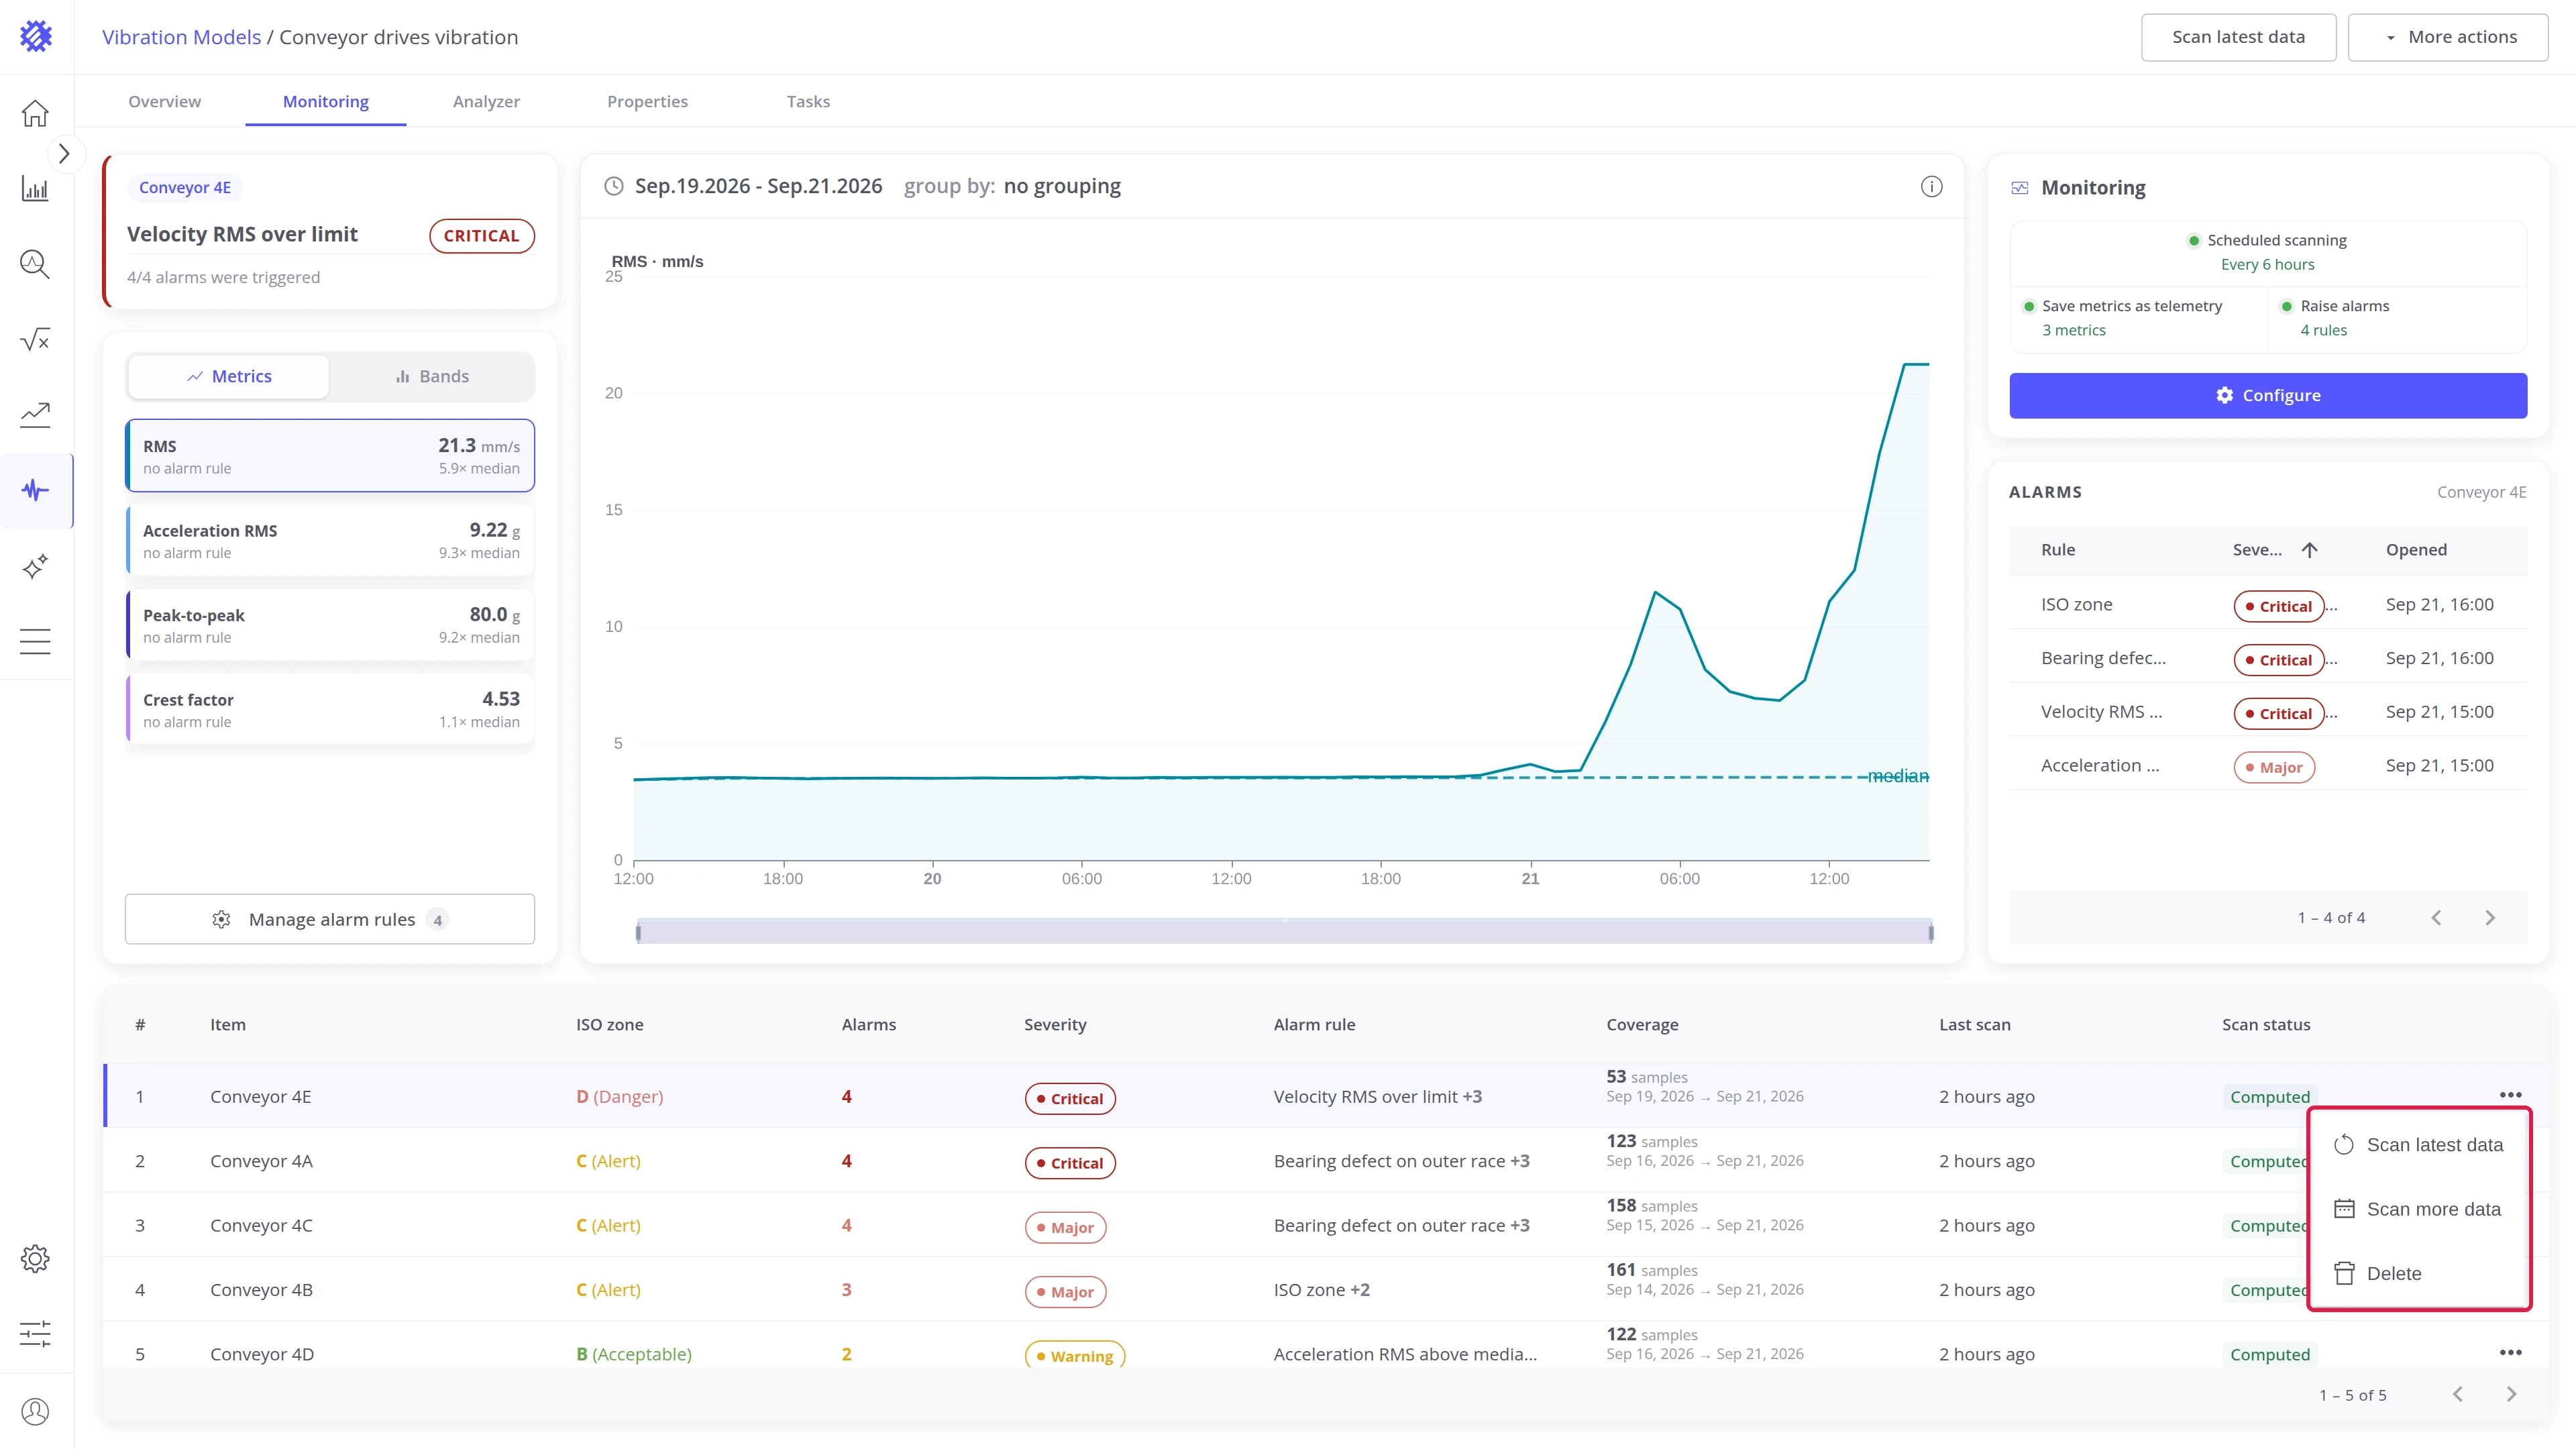
The … menu at the end of a row works on that one machine:
- Scan latest data and Scan more data scan only this machine. How both scans work is described in Actions.
- Delete removes the machine from the model, with its samples, spectra, and alarms. You can add it back on the Properties tab.
Explore other tabs
Section titled “Explore other tabs”Was this helpful?