Show Forecasts on ThingsBoard Dashboards
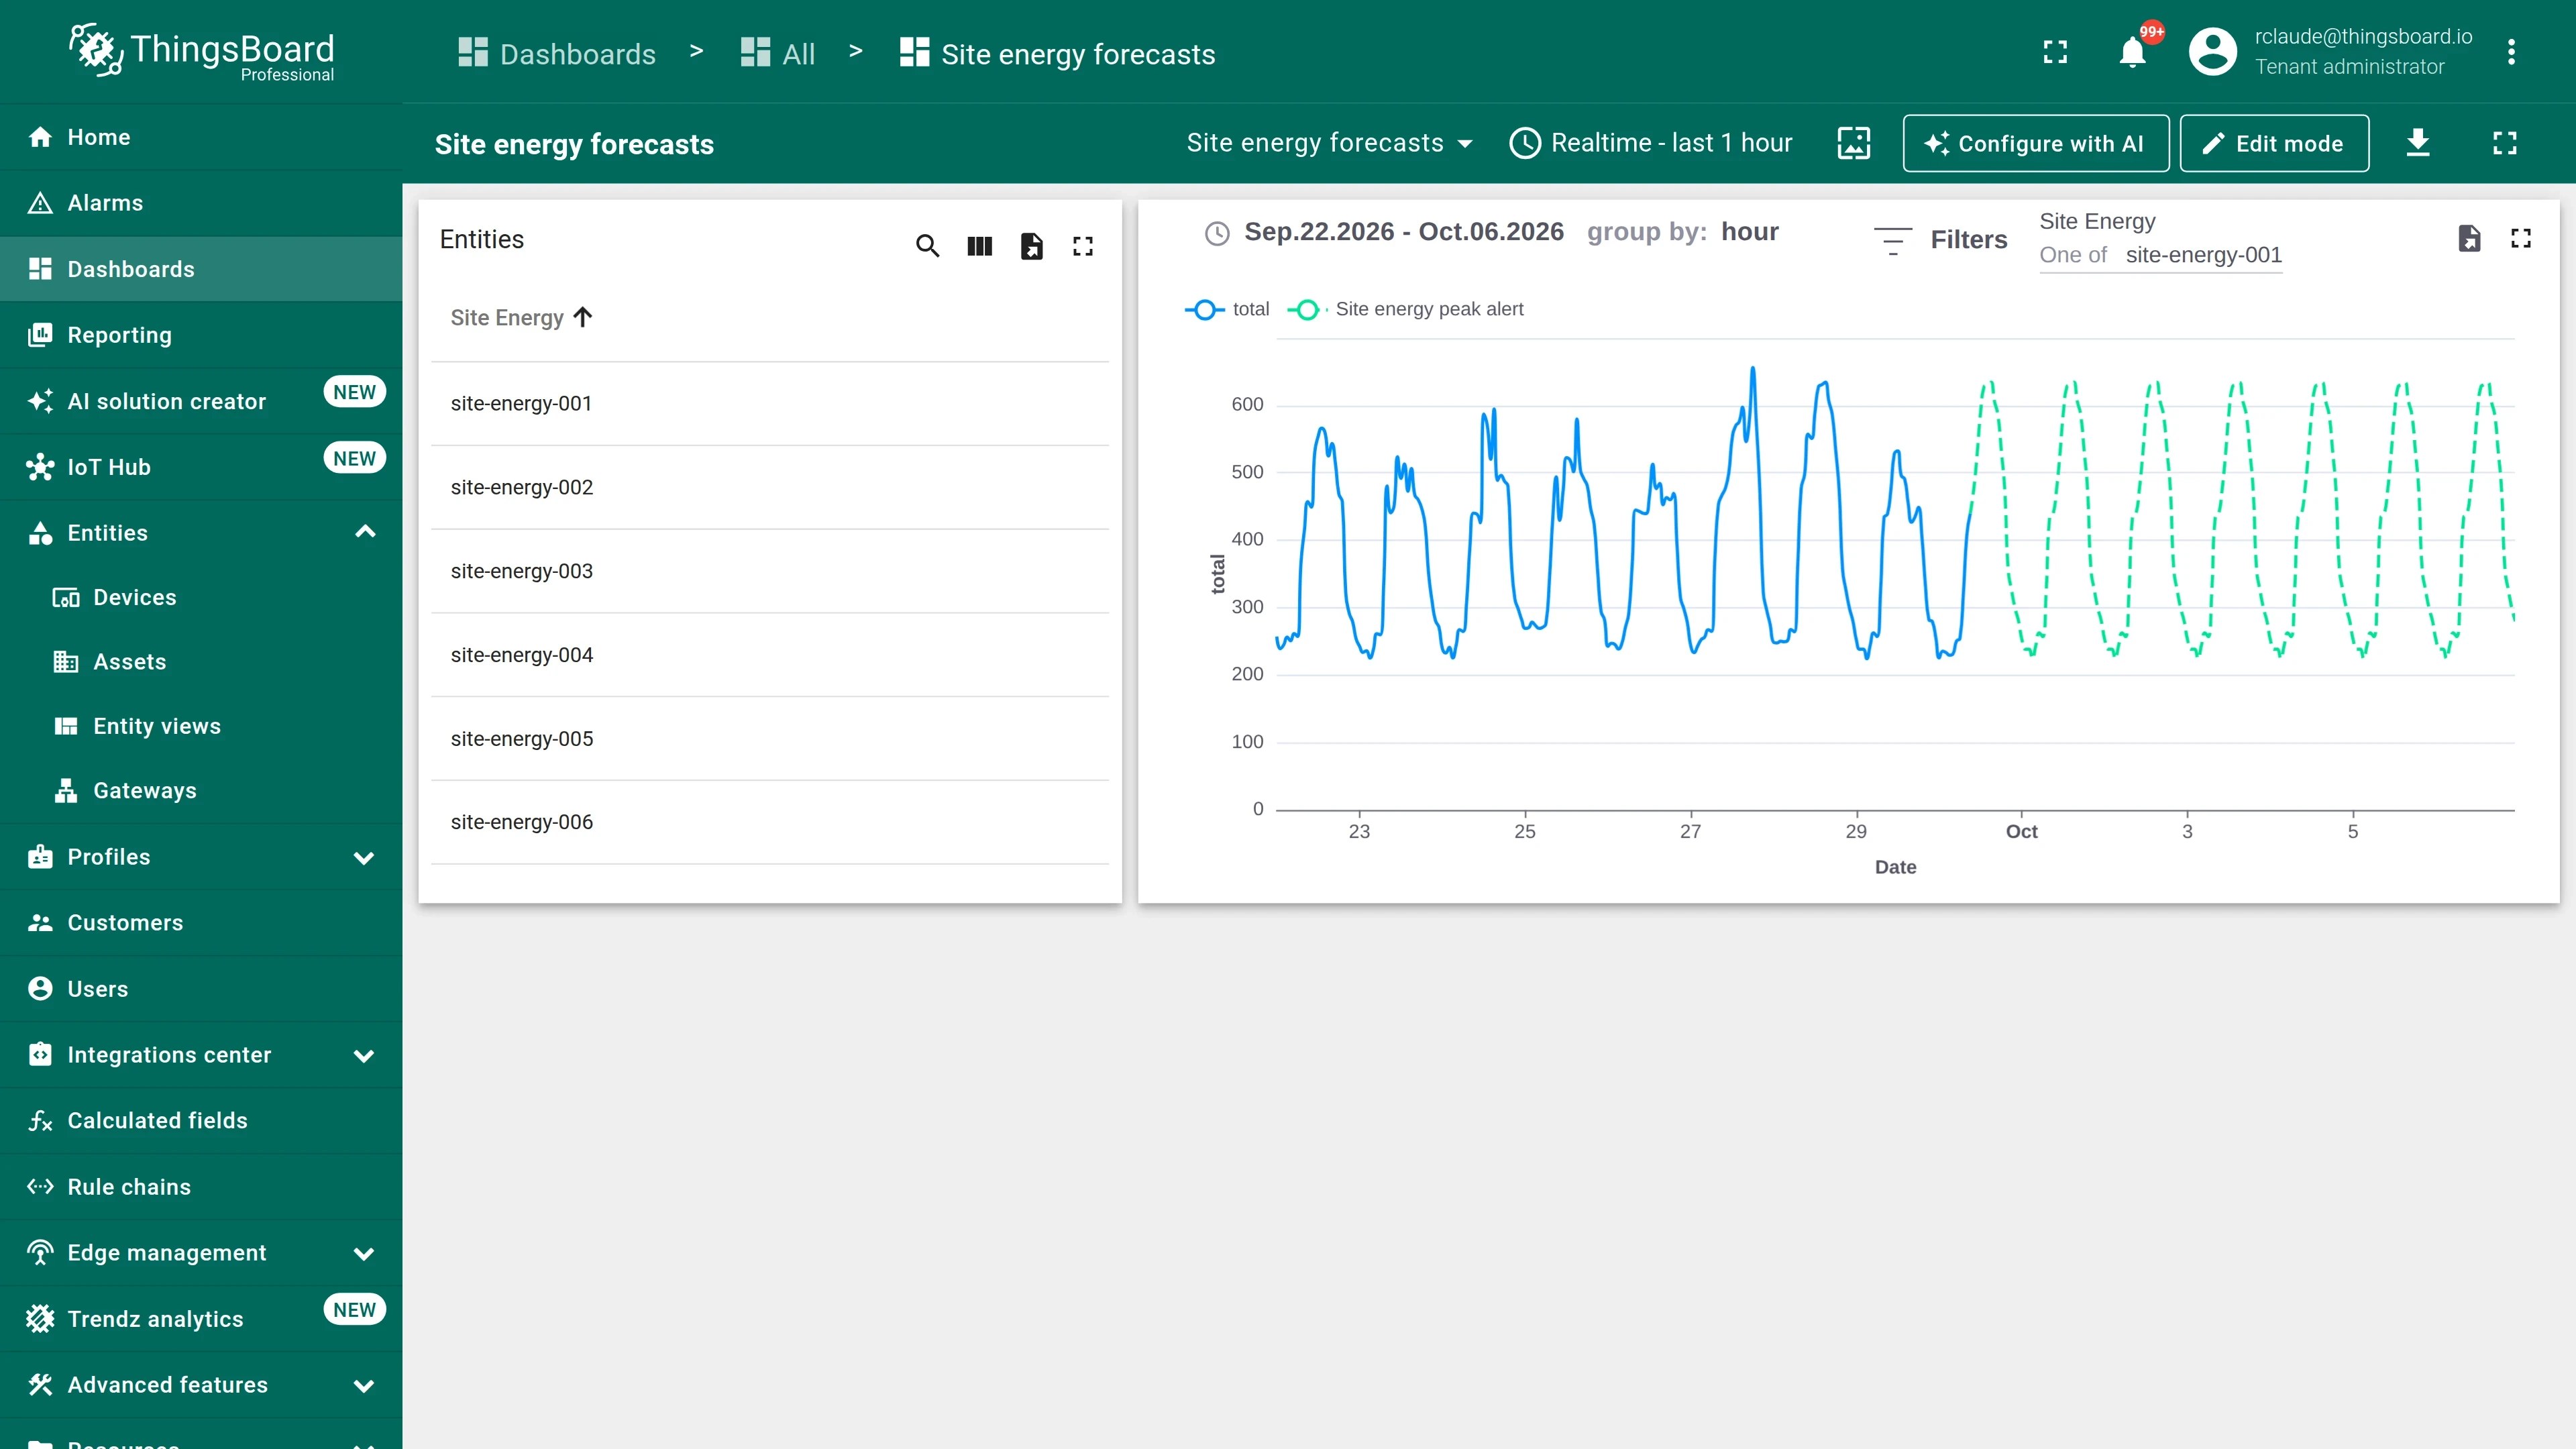
The model page shows the forecast of one item at a time. To see it next to the measured values, in a report or on a ThingsBoard dashboard, build a prediction view: a Trendz line chart with the model field on it.
The model field
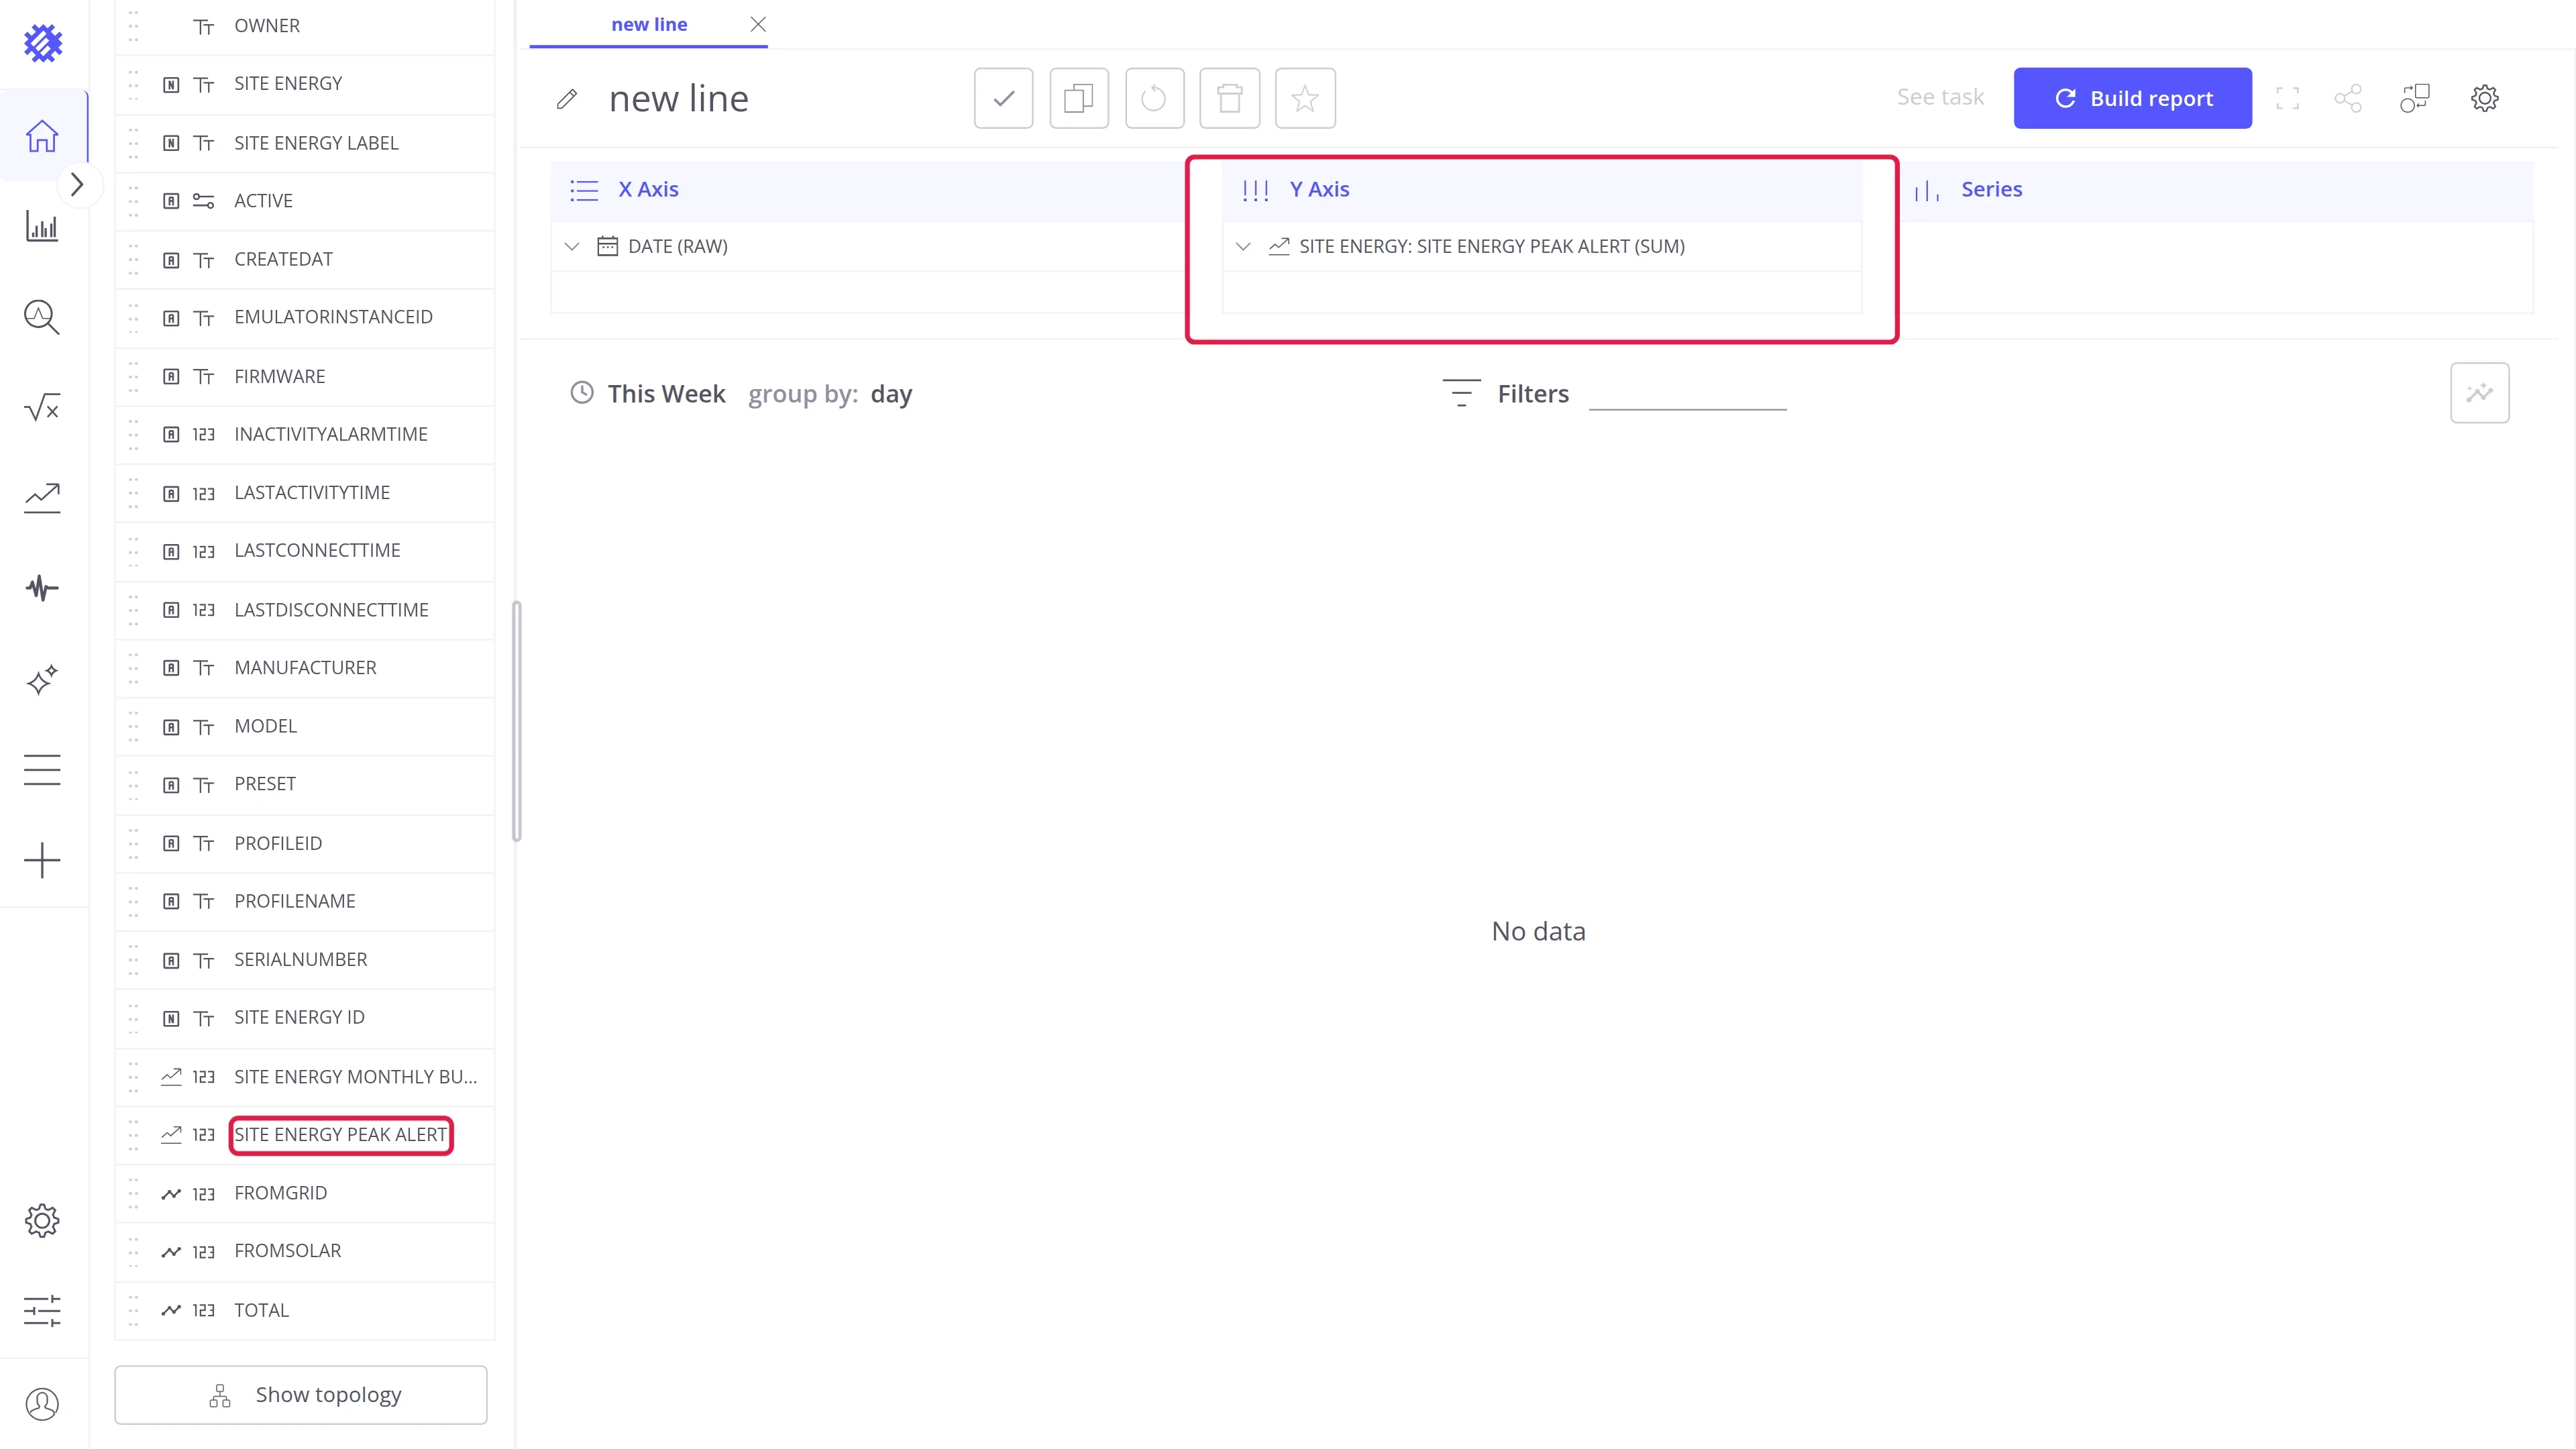
Section titled “The model field”A model field holds the forecast of a prediction model, for every item of the model. You use it in a view like any other field of the business entity.
- When it is created: Trendz adds the field when you turn on Periodic refresh for the model, as described in Monitoring & Alarms. When you turn it off, the field is removed. When you turn it on again, the same field comes back, so saved views keep working.
- Its name: the name of the model, here Site energy peak alert. When you rename the model, the field is renamed too.
- Where to find it: in the field list of the view editor, under the business entity the model learns from, here Site Energy. Model fields are marked with a trend icon.
Build a prediction view
Section titled “Build a prediction view”The steps below build one example: a line chart of the measured energy and its forecast, shared on a dashboard. The model field works in any Trendz view, like any other field, so you can also put it in a table, a card, or a bar chart, and combine it with other fields.
Step 1. Create a line view
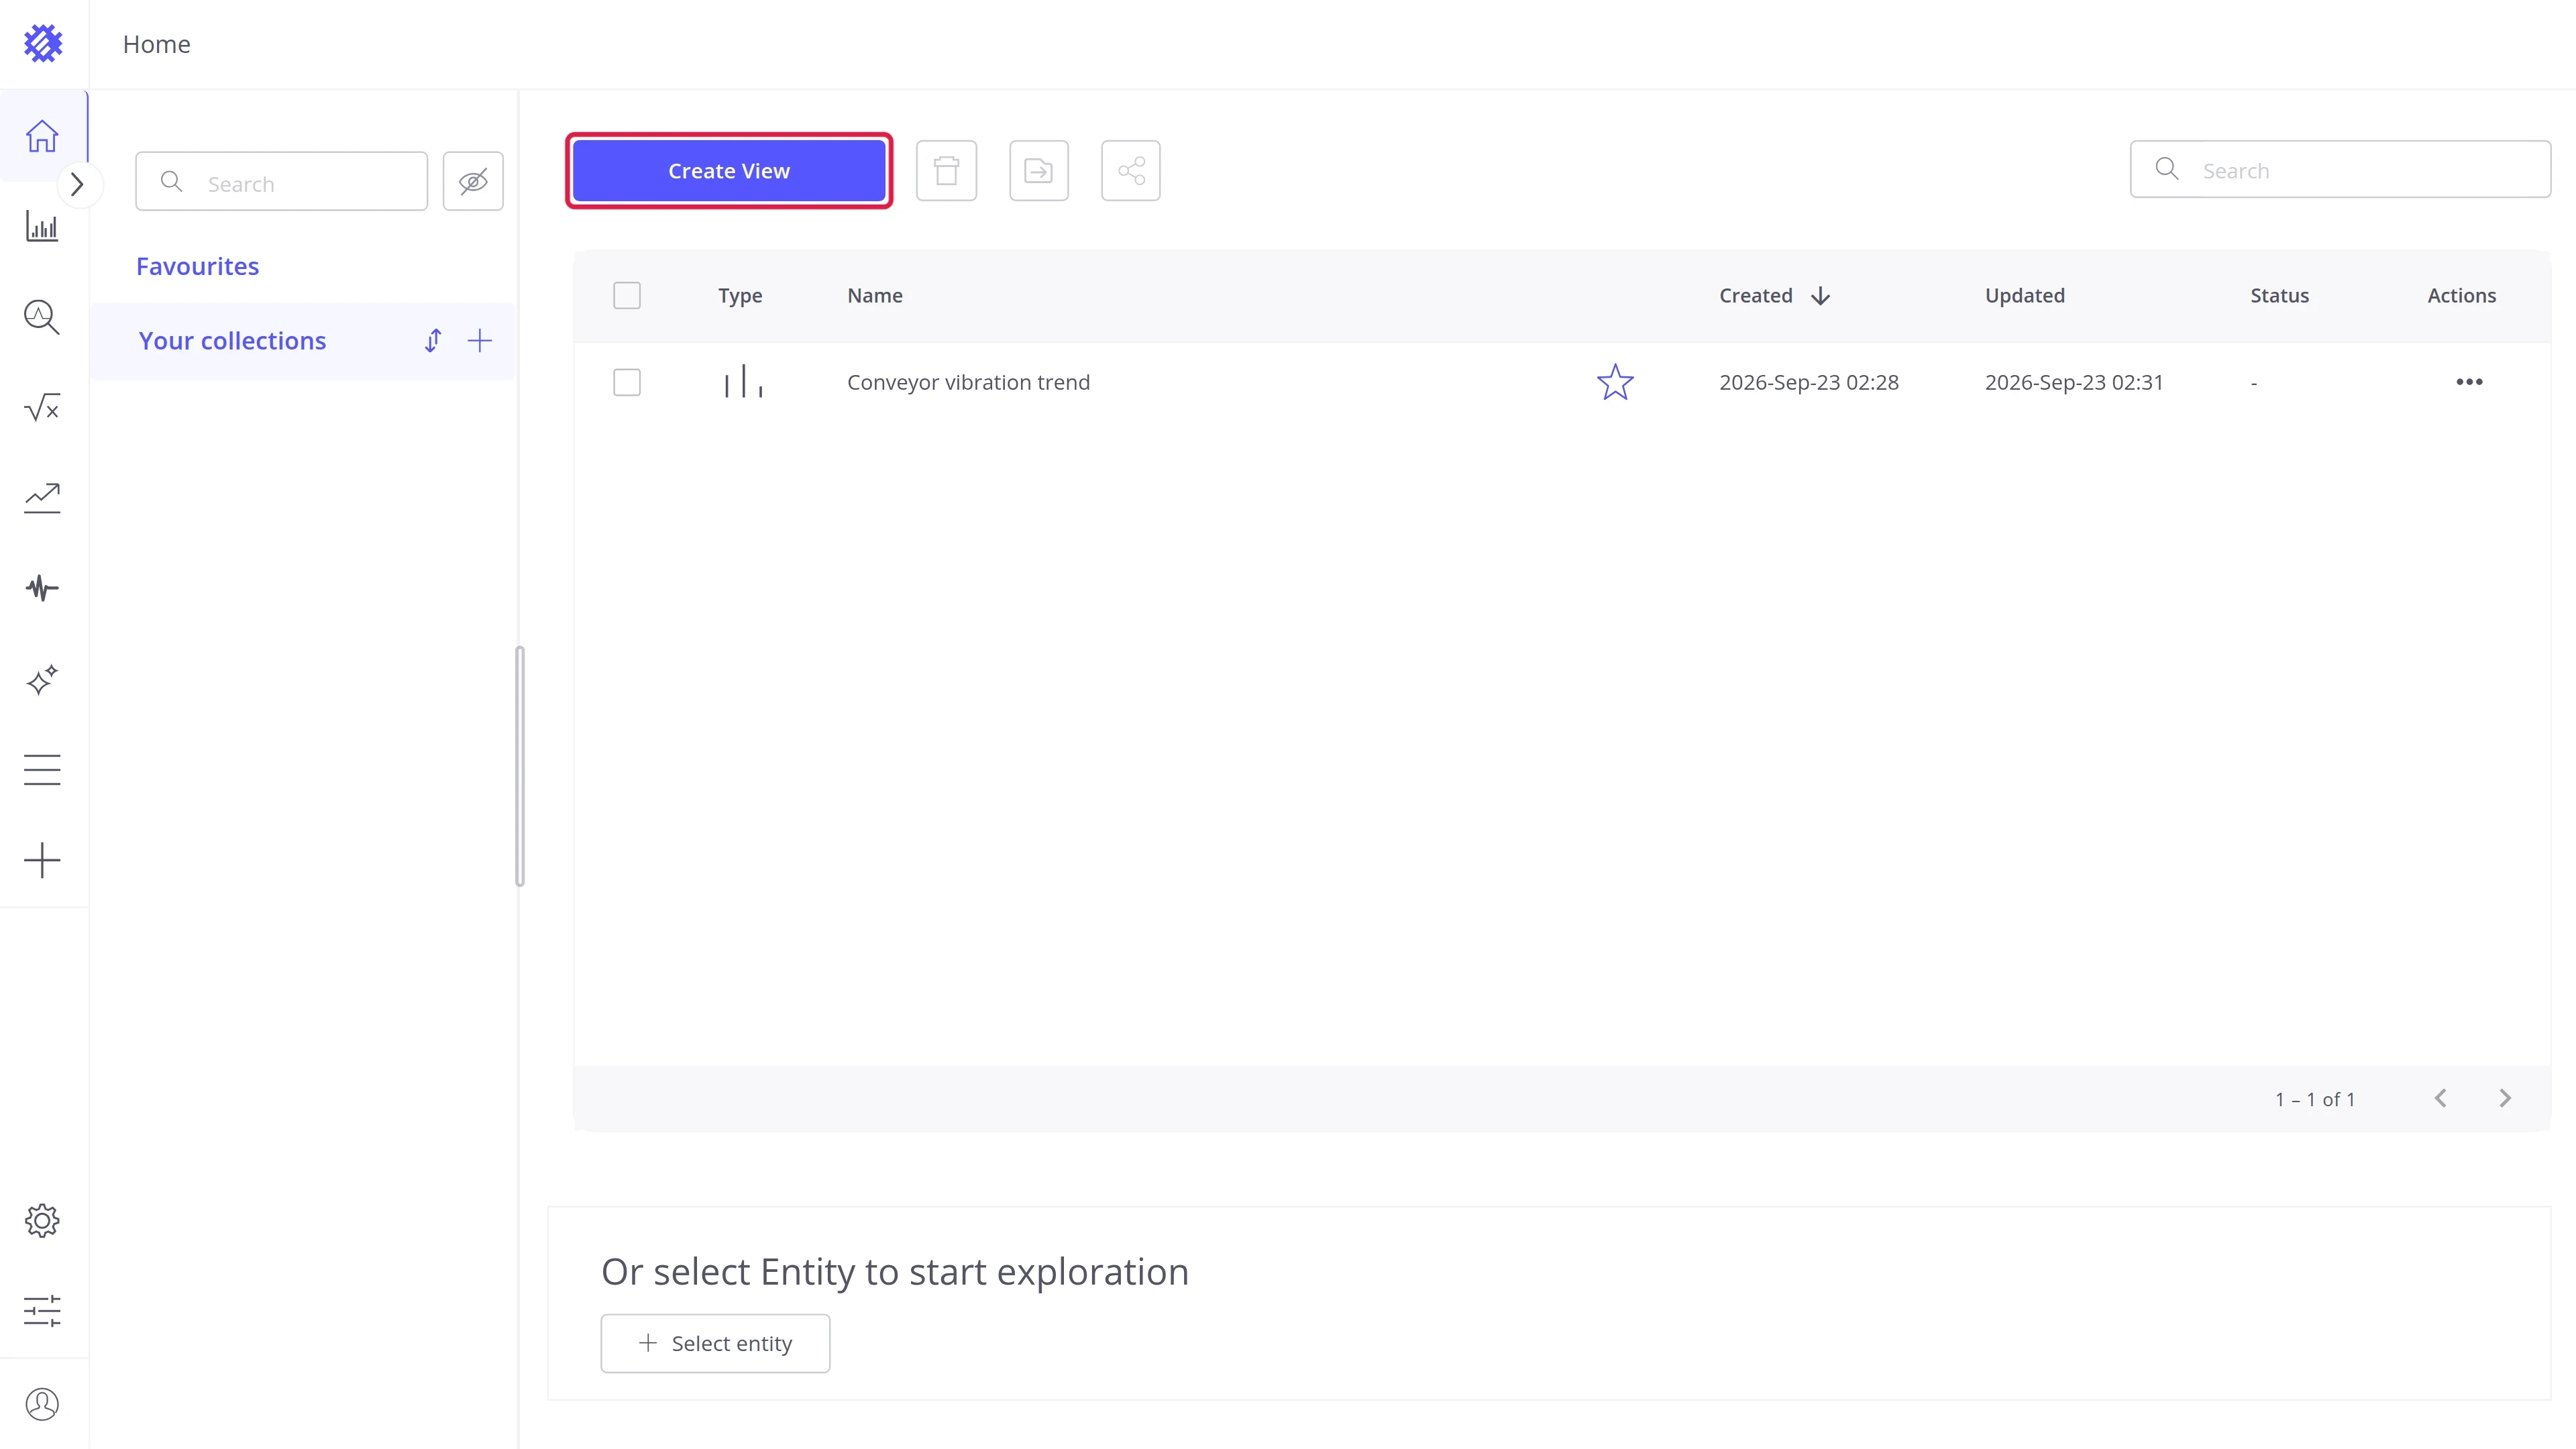
Section titled “Step 1. Create a line view”- On the Trendz home page, click Create View.
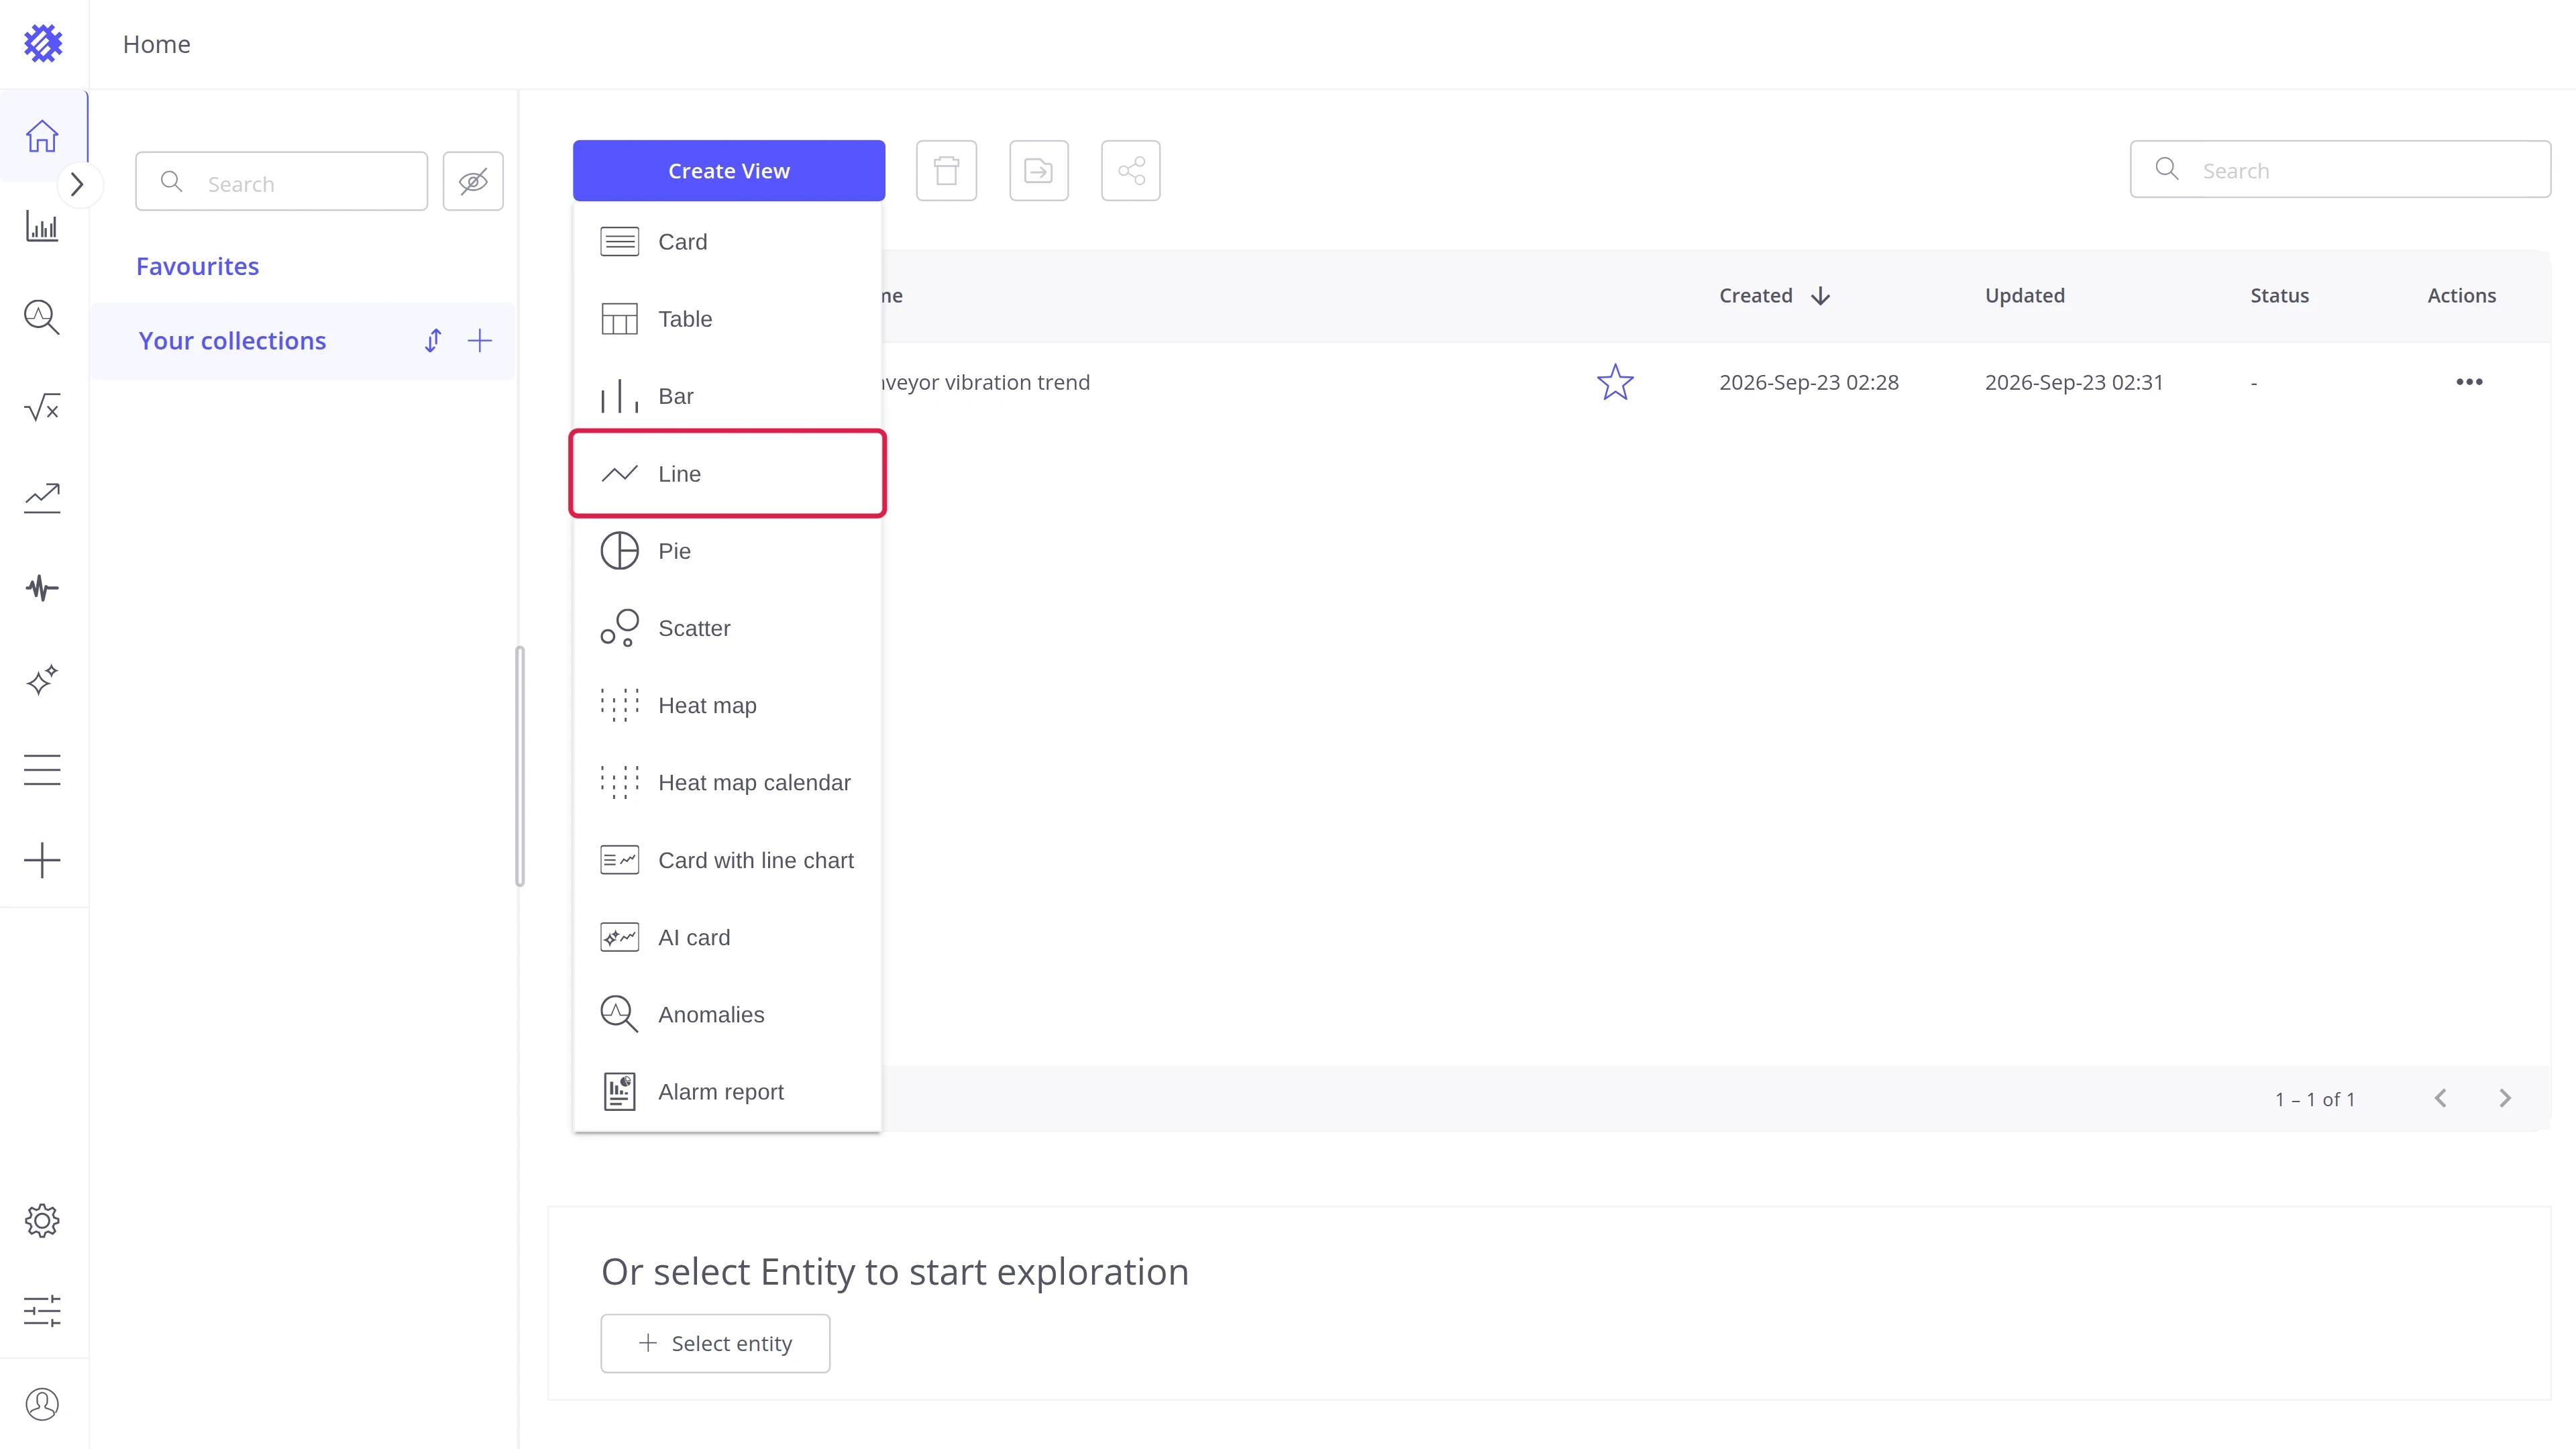
- Choose Line. The view editor opens.
Step 2. Add the fields
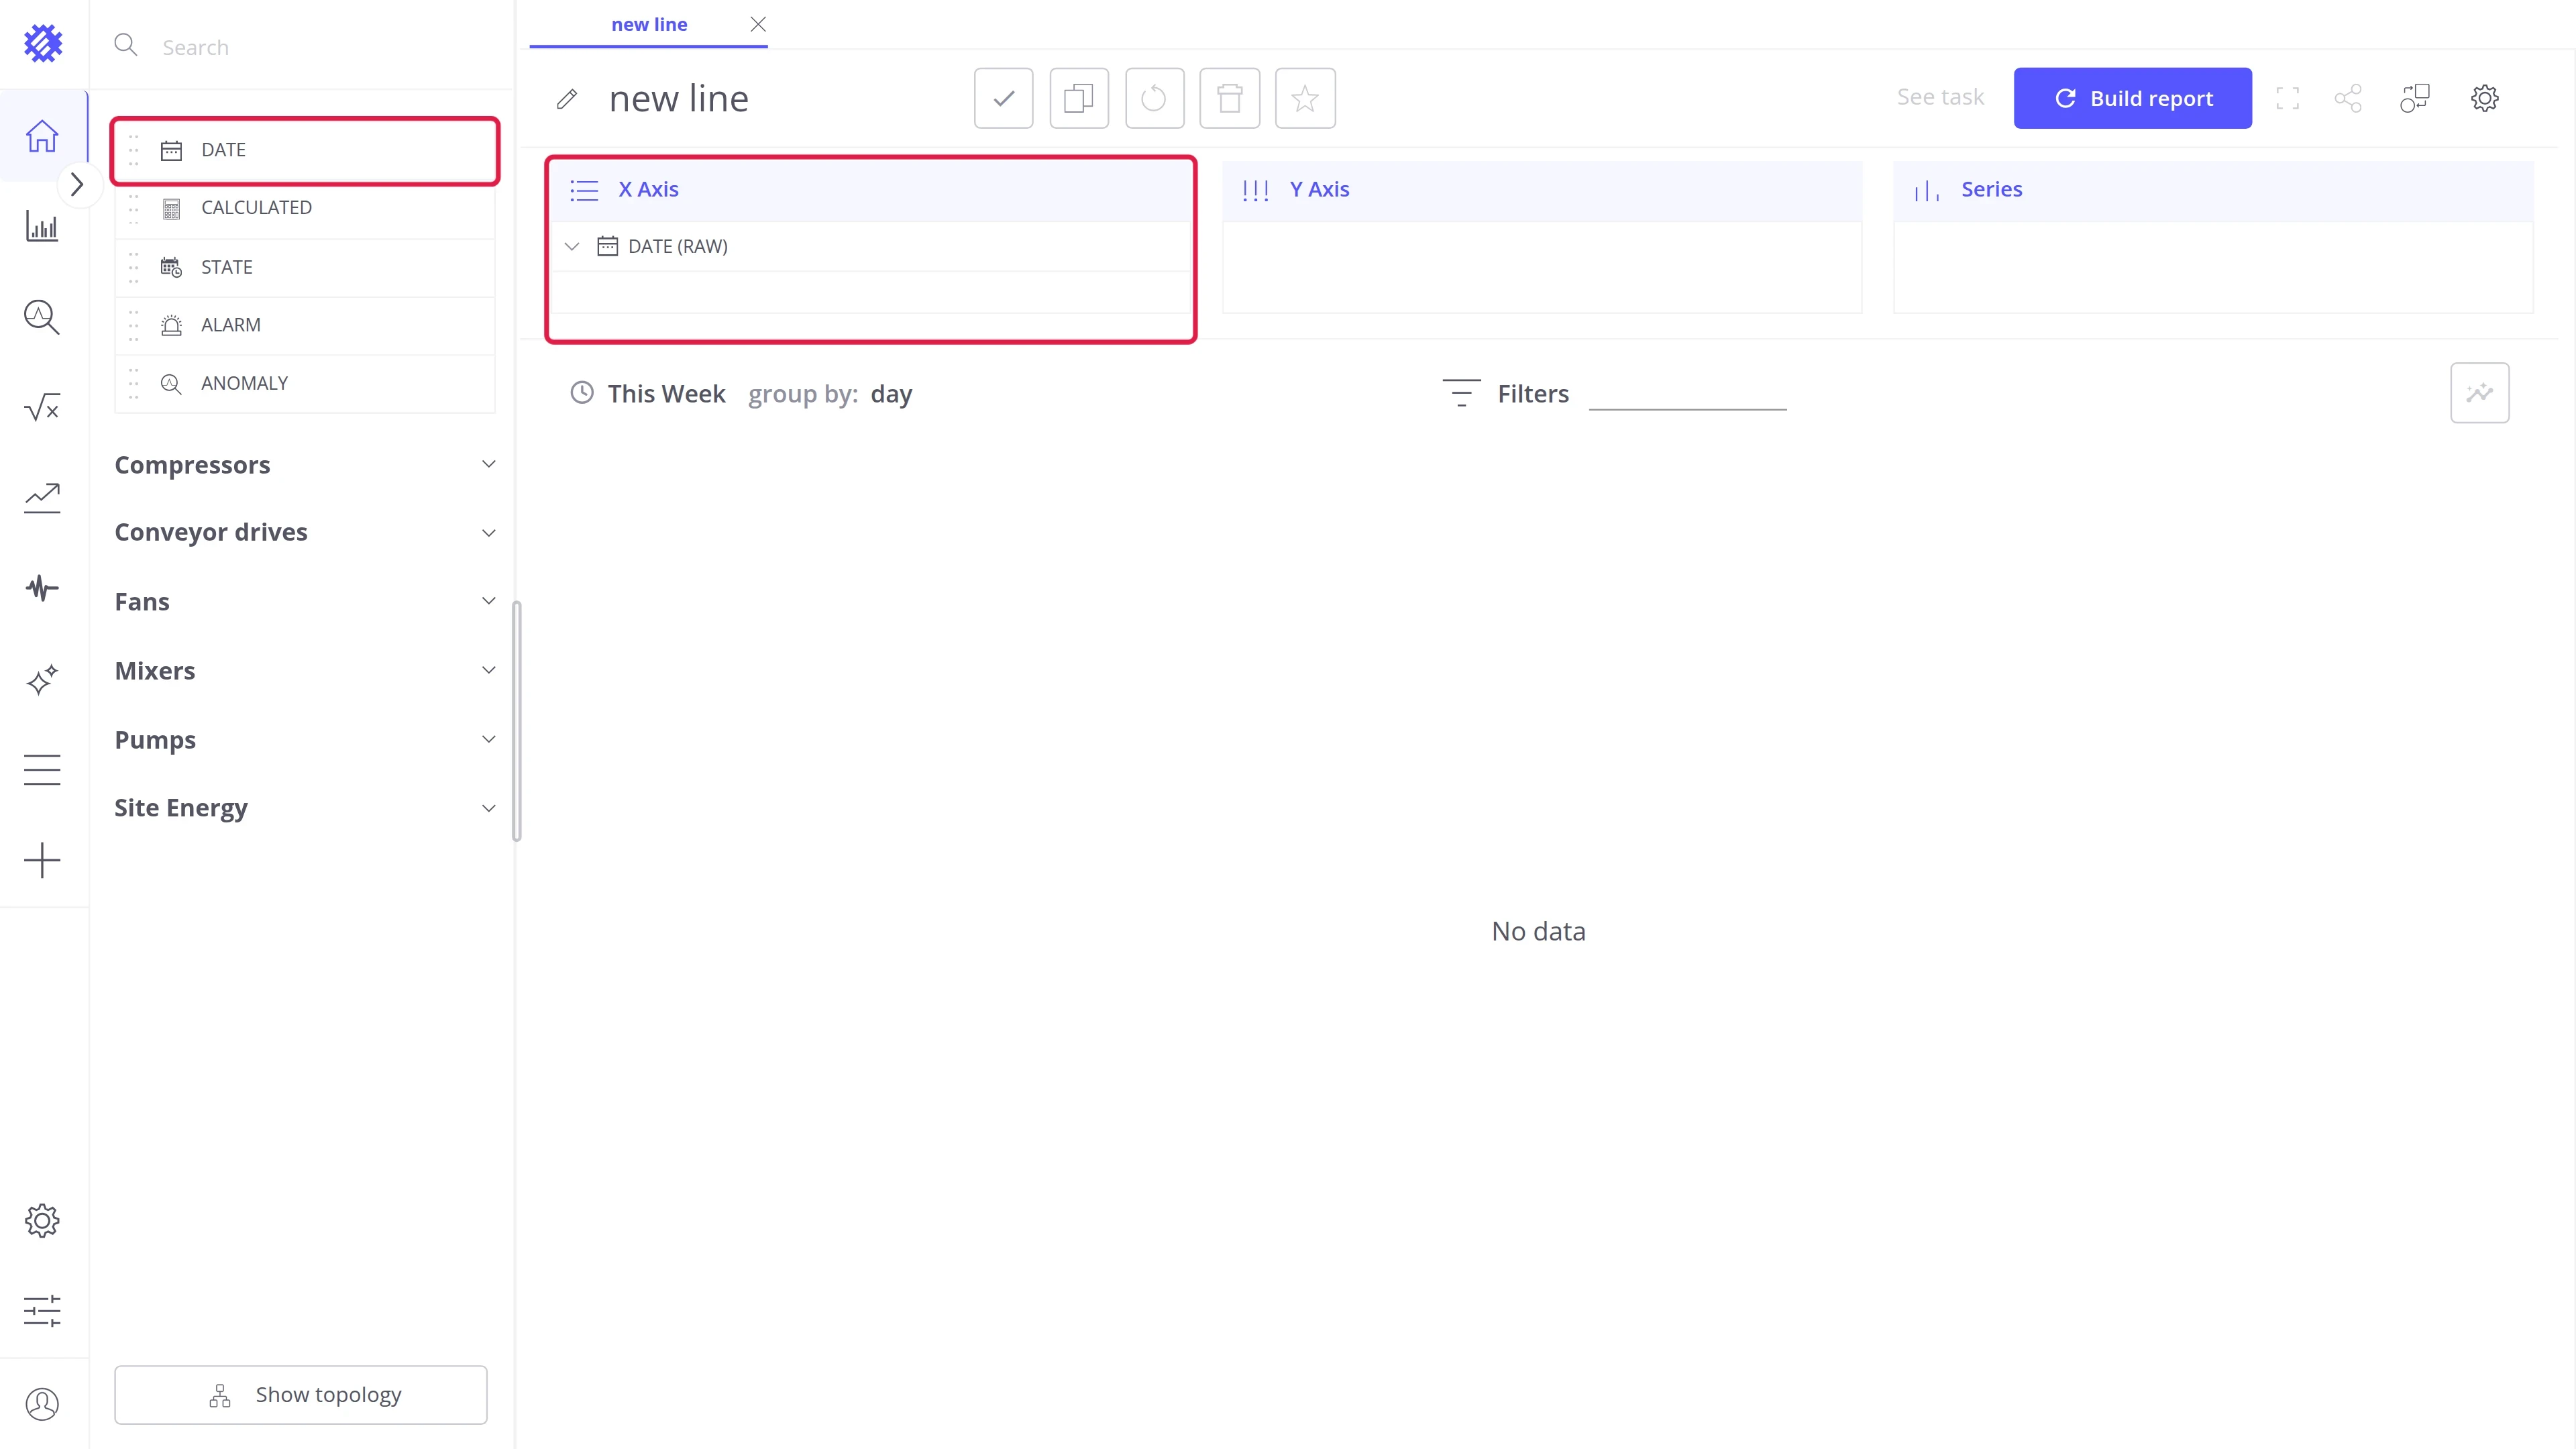
Section titled “Step 2. Add the fields”- Drag Date from the field list to X Axis.
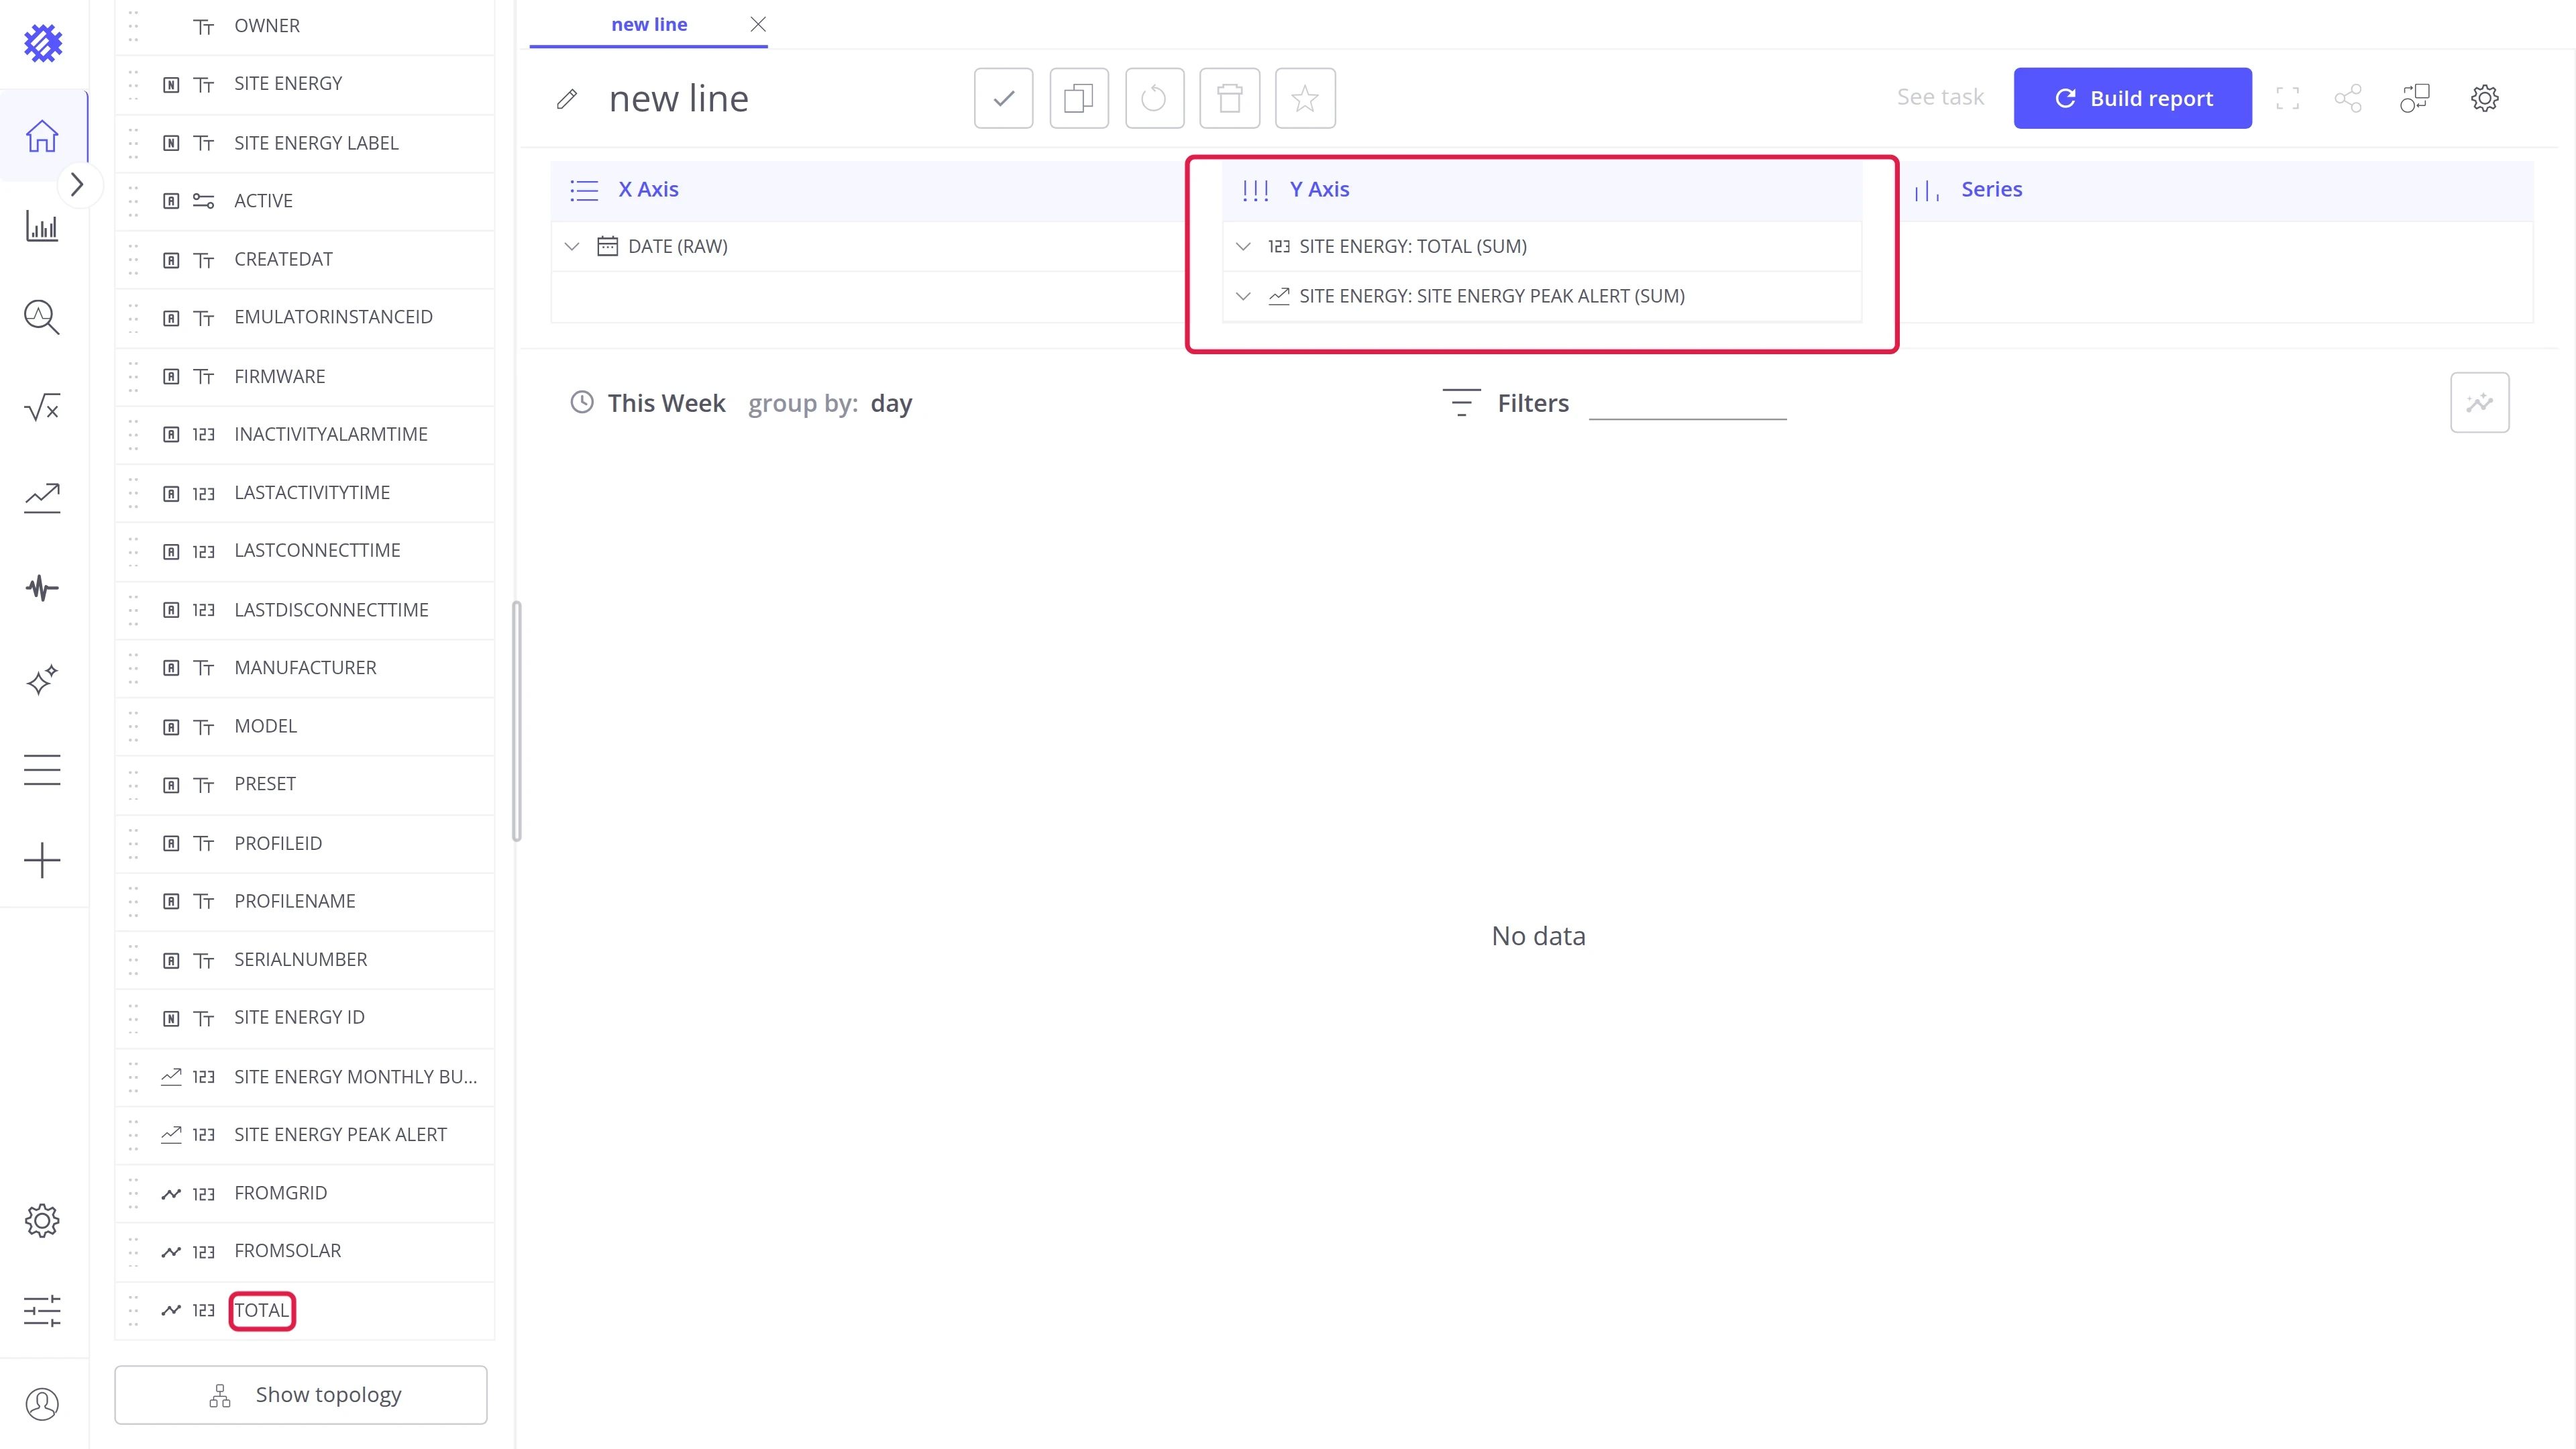
- Open Site Energy and drag the model field, Site energy peak alert, to Y Axis.
- Drag the telemetry the model predicts, total, to Y Axis as well.
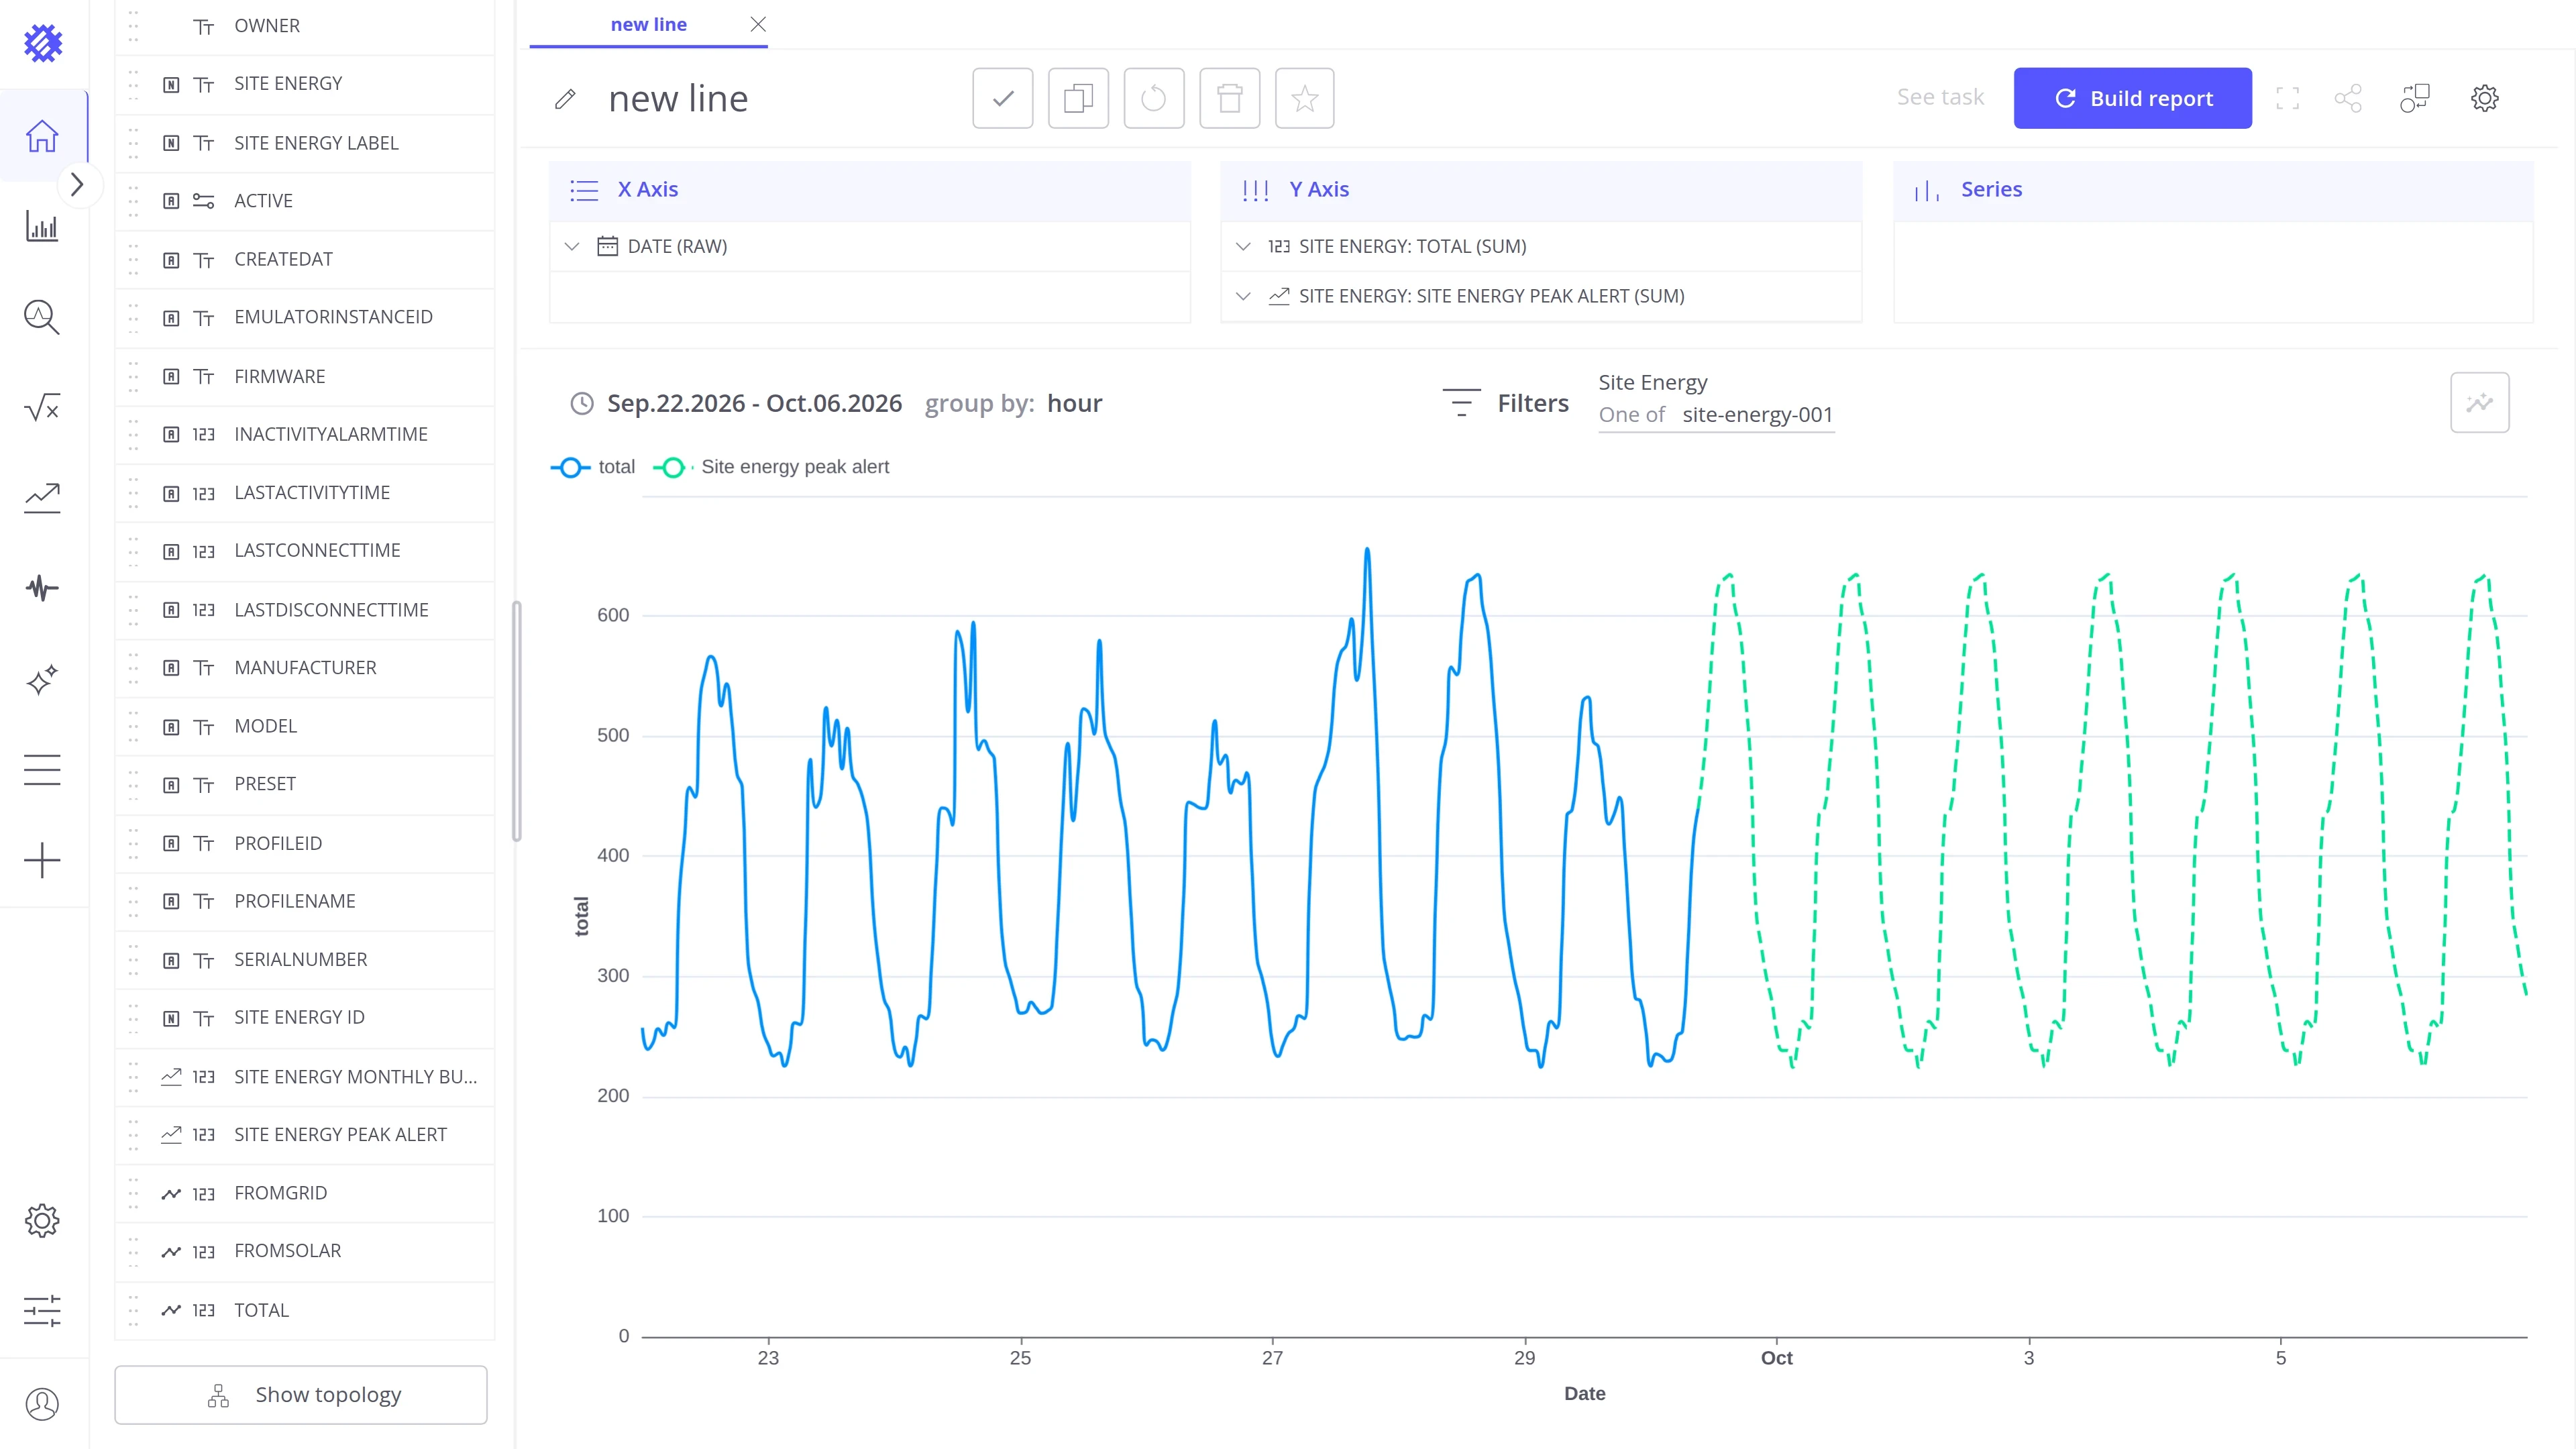
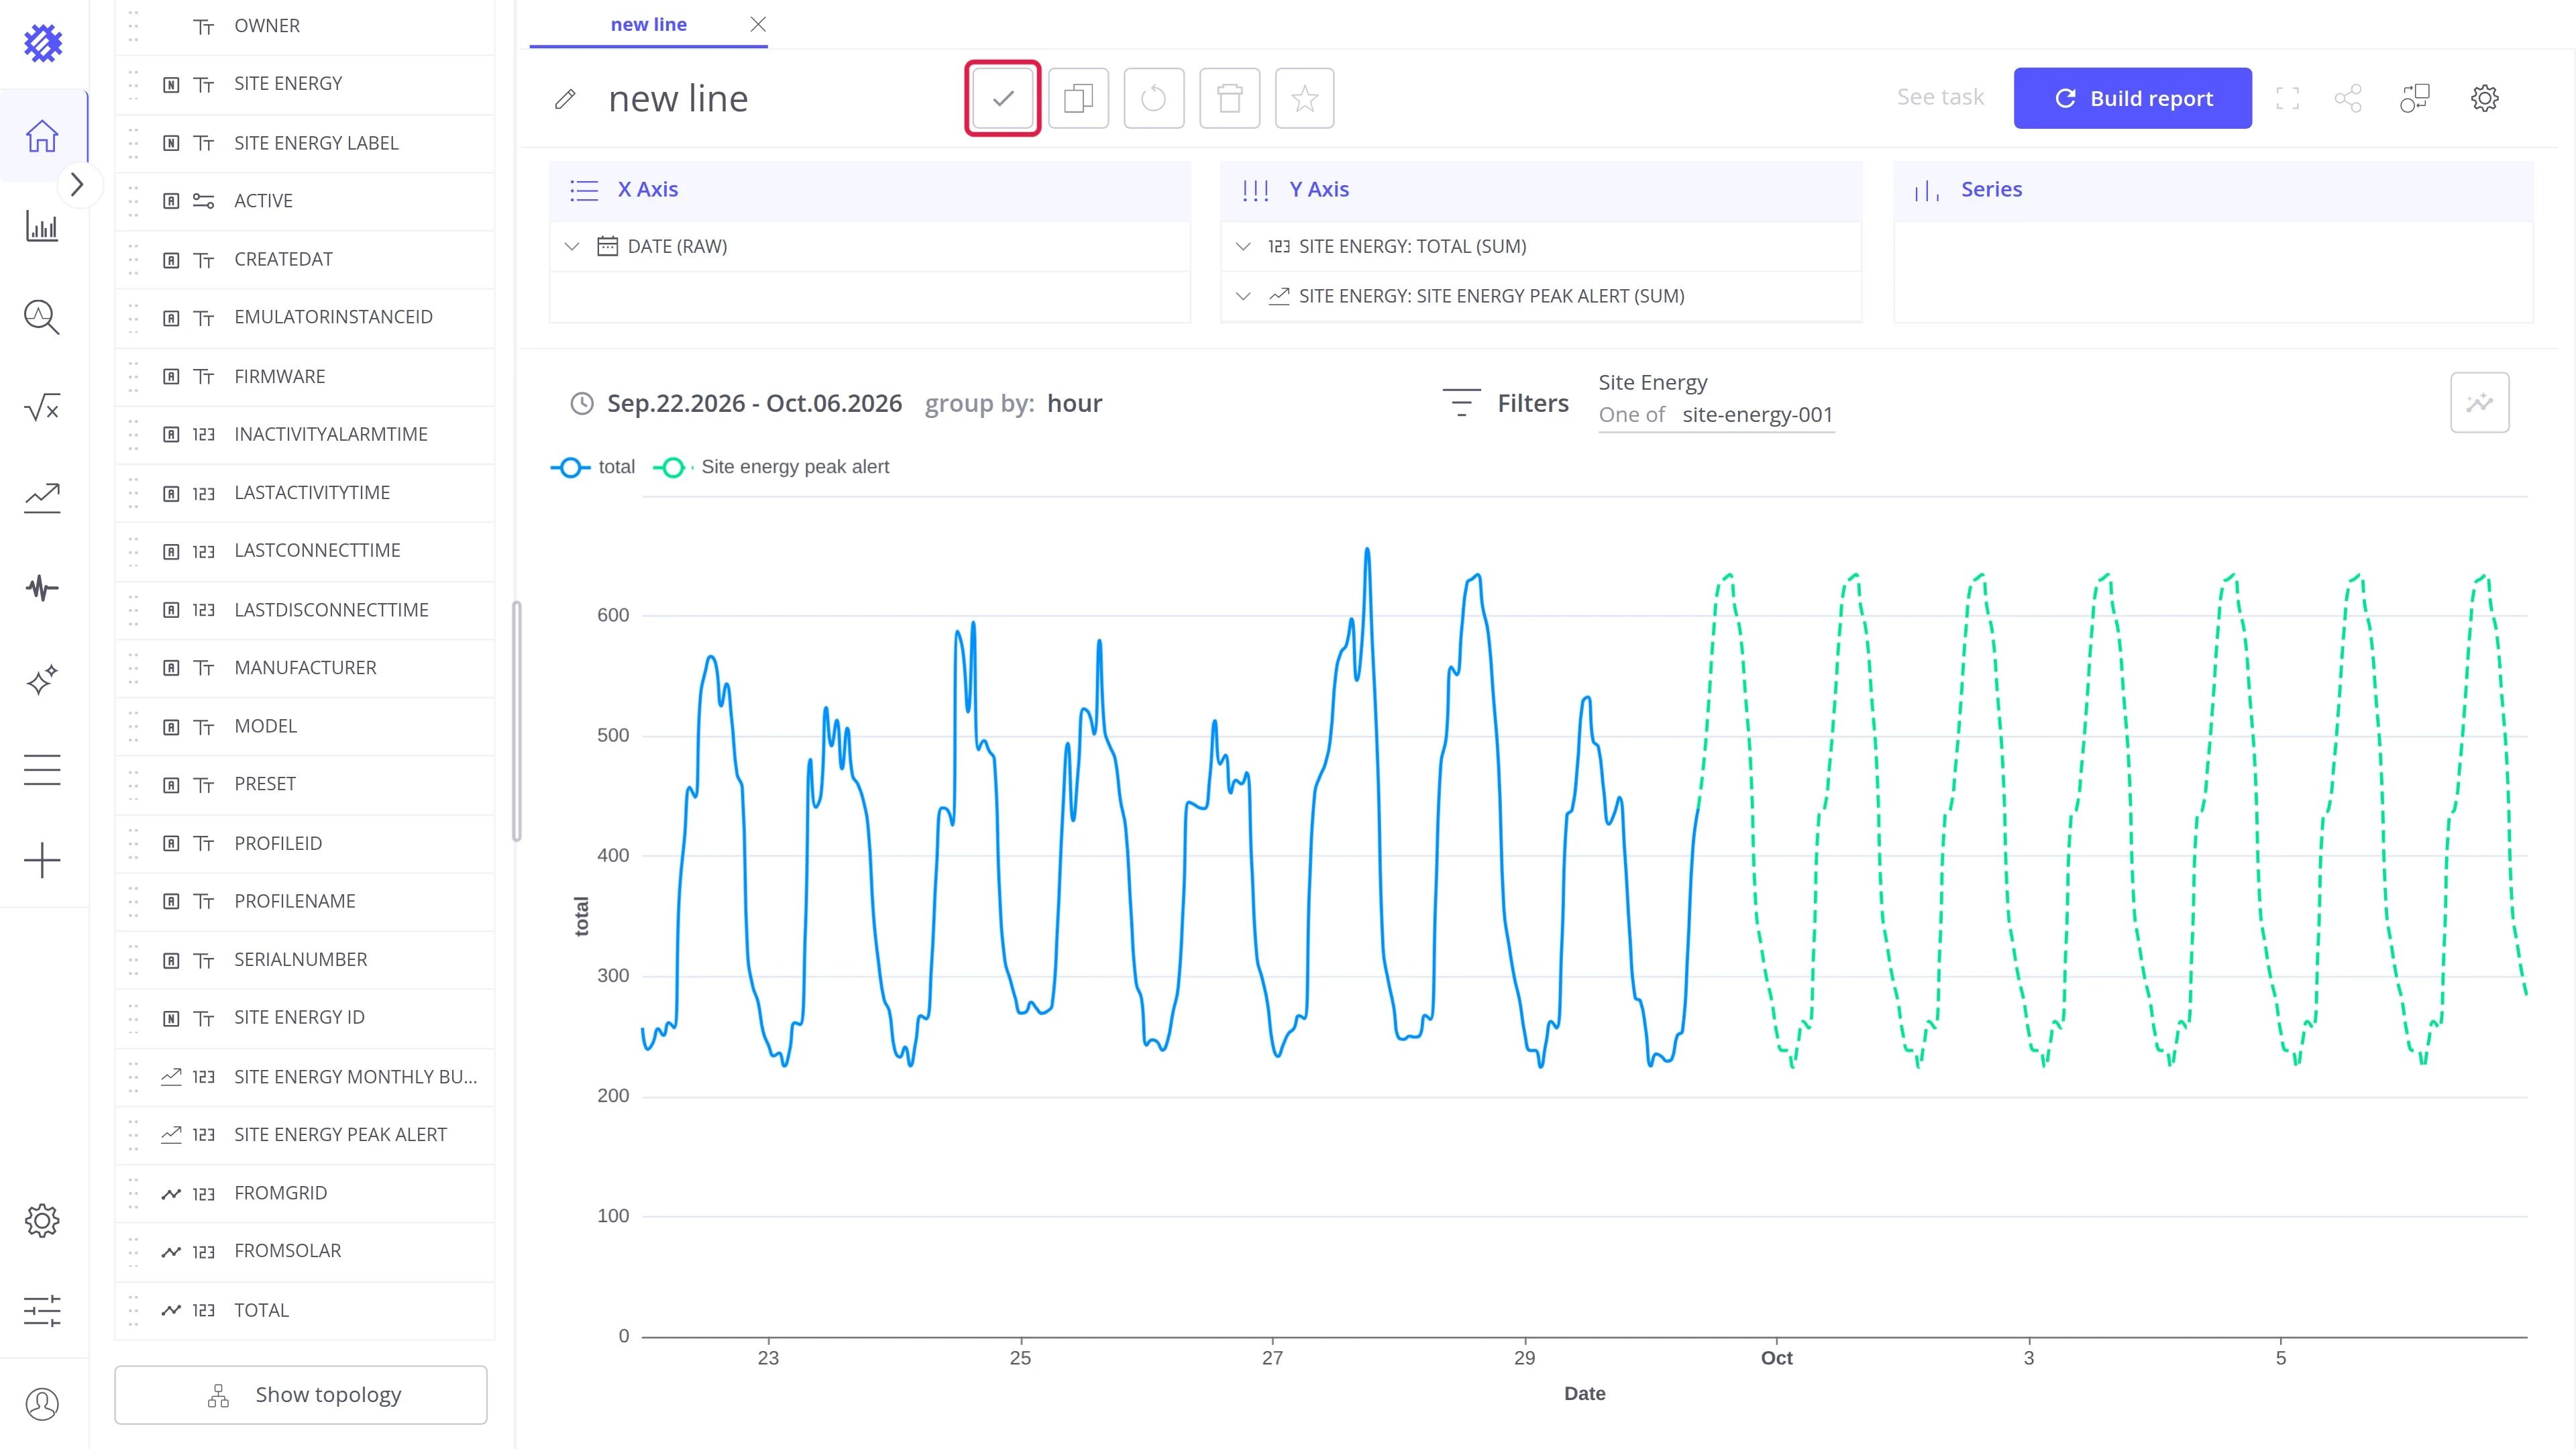
On Y Axis, the measured telemetry must be above the model field, as in the third image. A field you drop lands at the top of the list, so drag the model field first and the telemetry second. Both use the same aggregation, SUM here, so the forecast continues the measured line.
Step 3. Set the filter and period
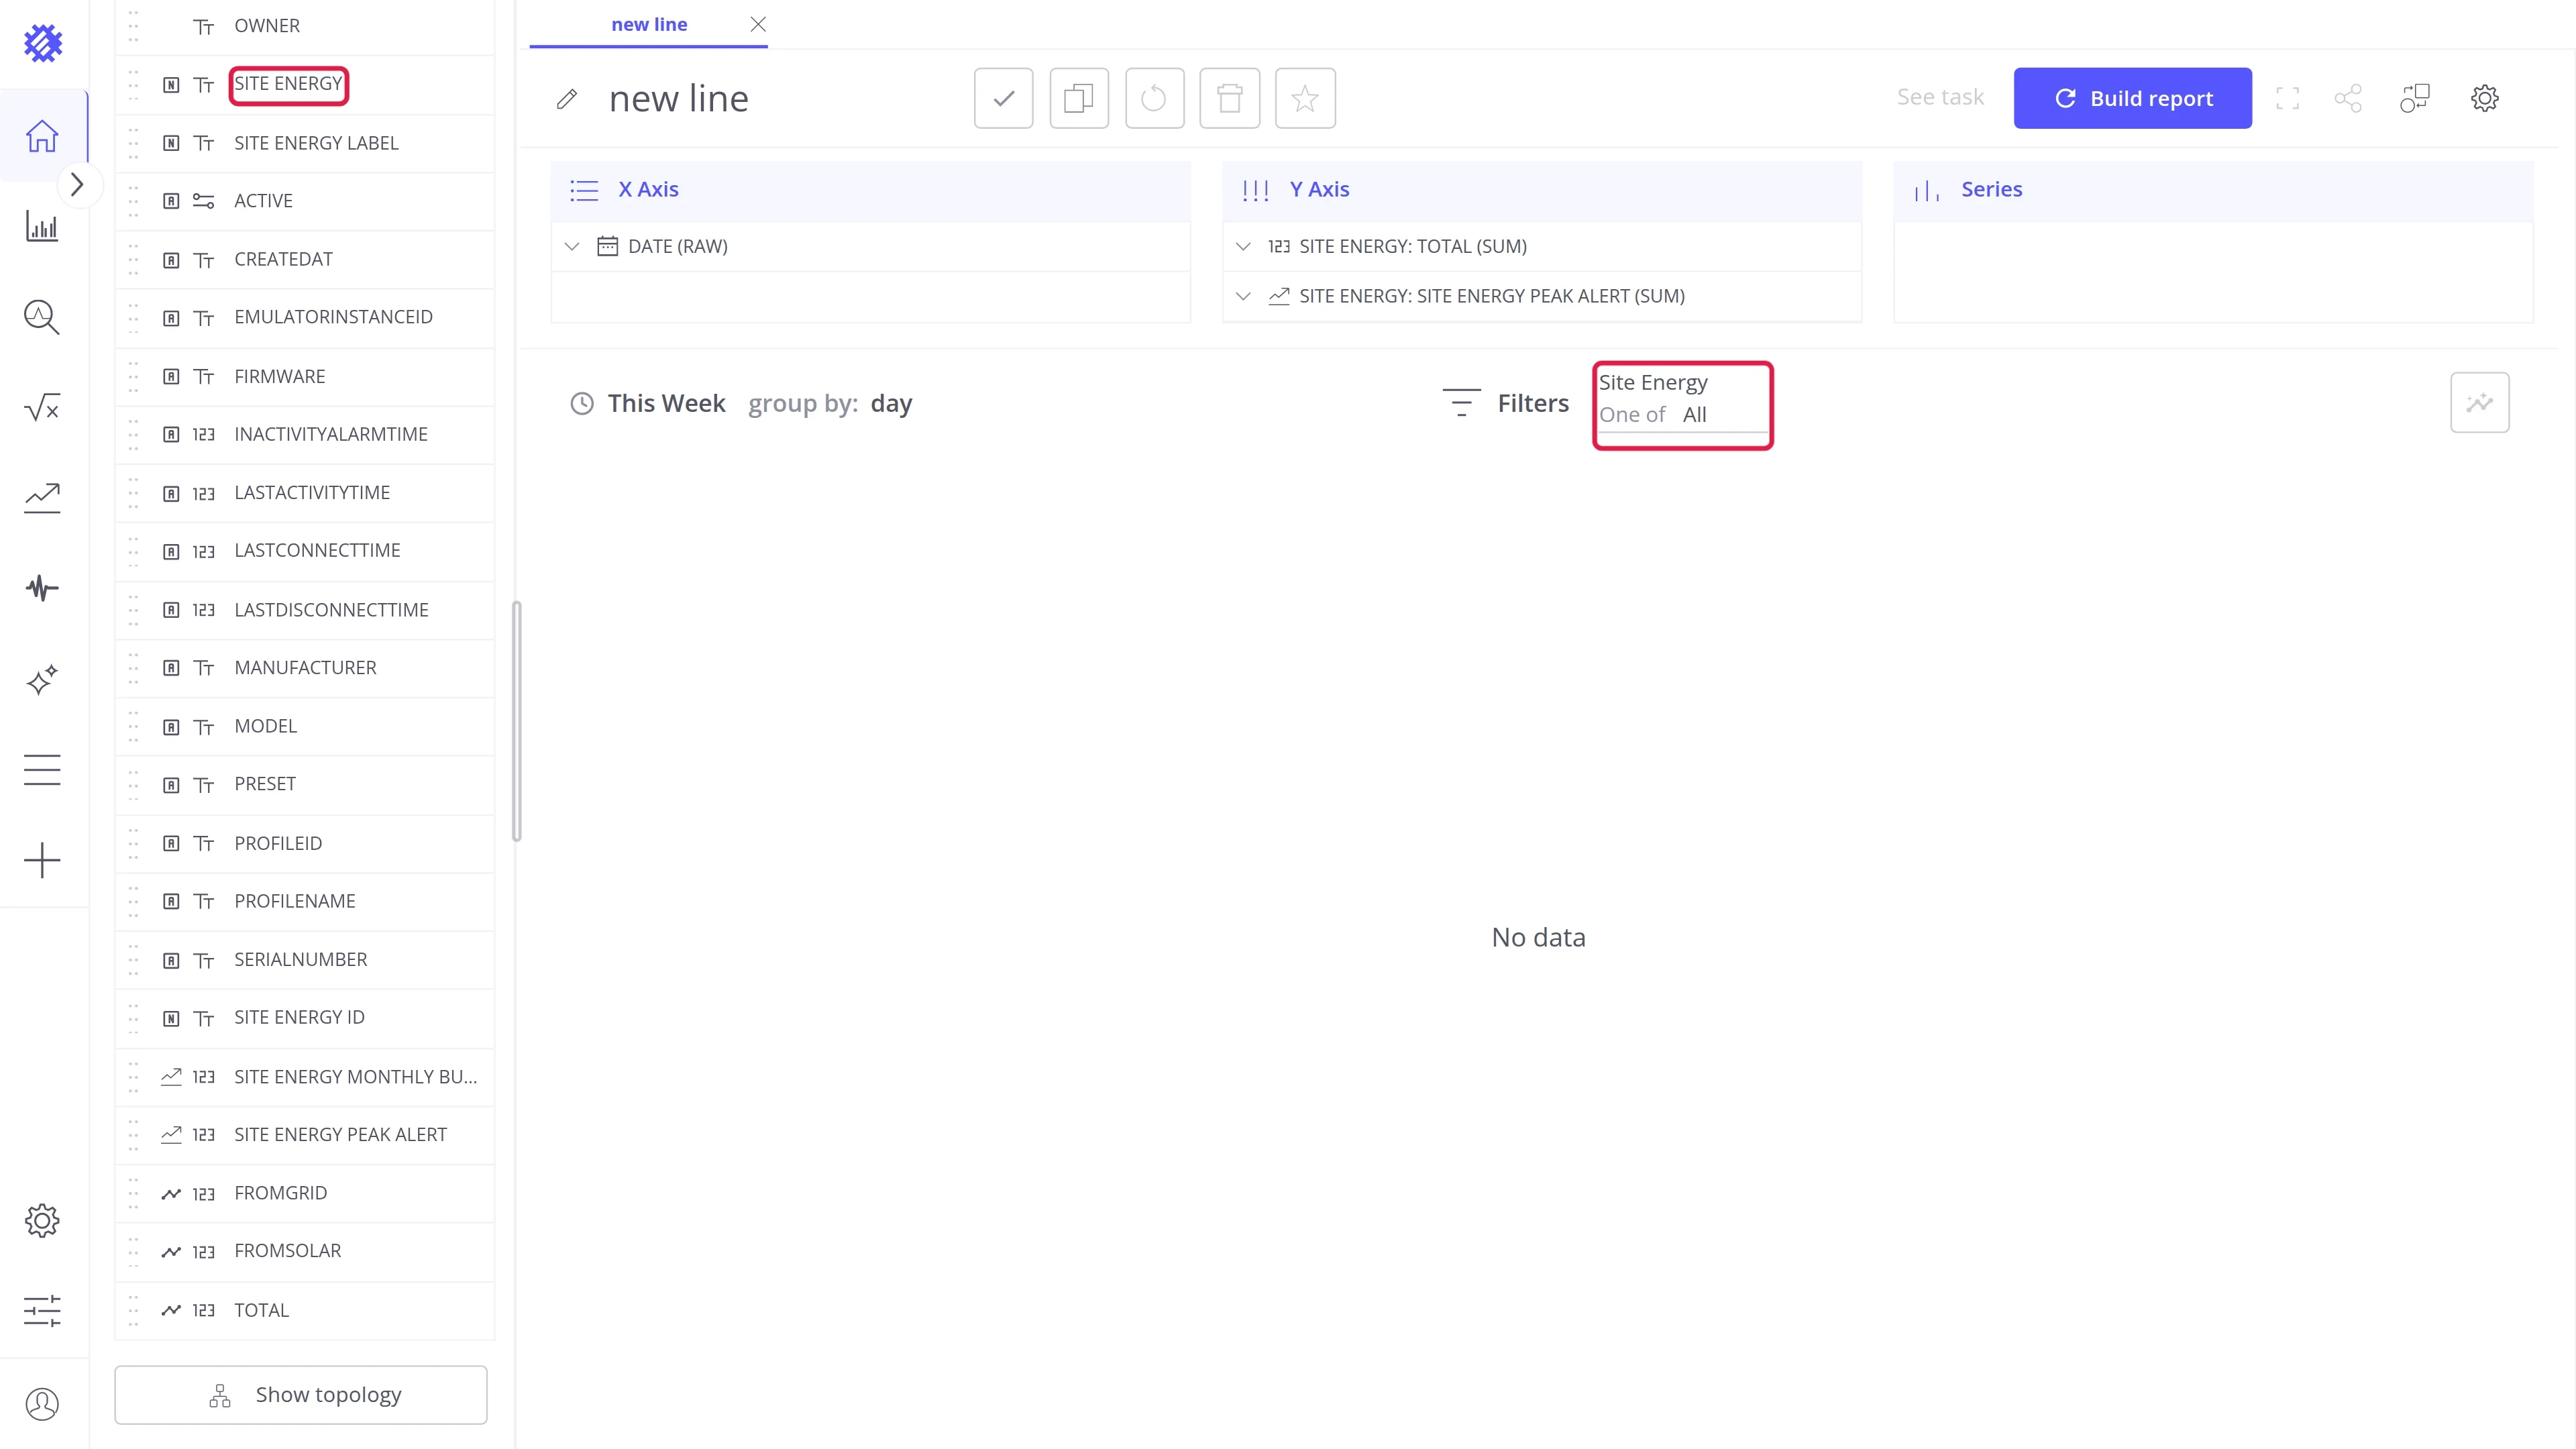
Section titled “Step 3. Set the filter and period”- Drag the entity itself, Site Energy, to Filters.
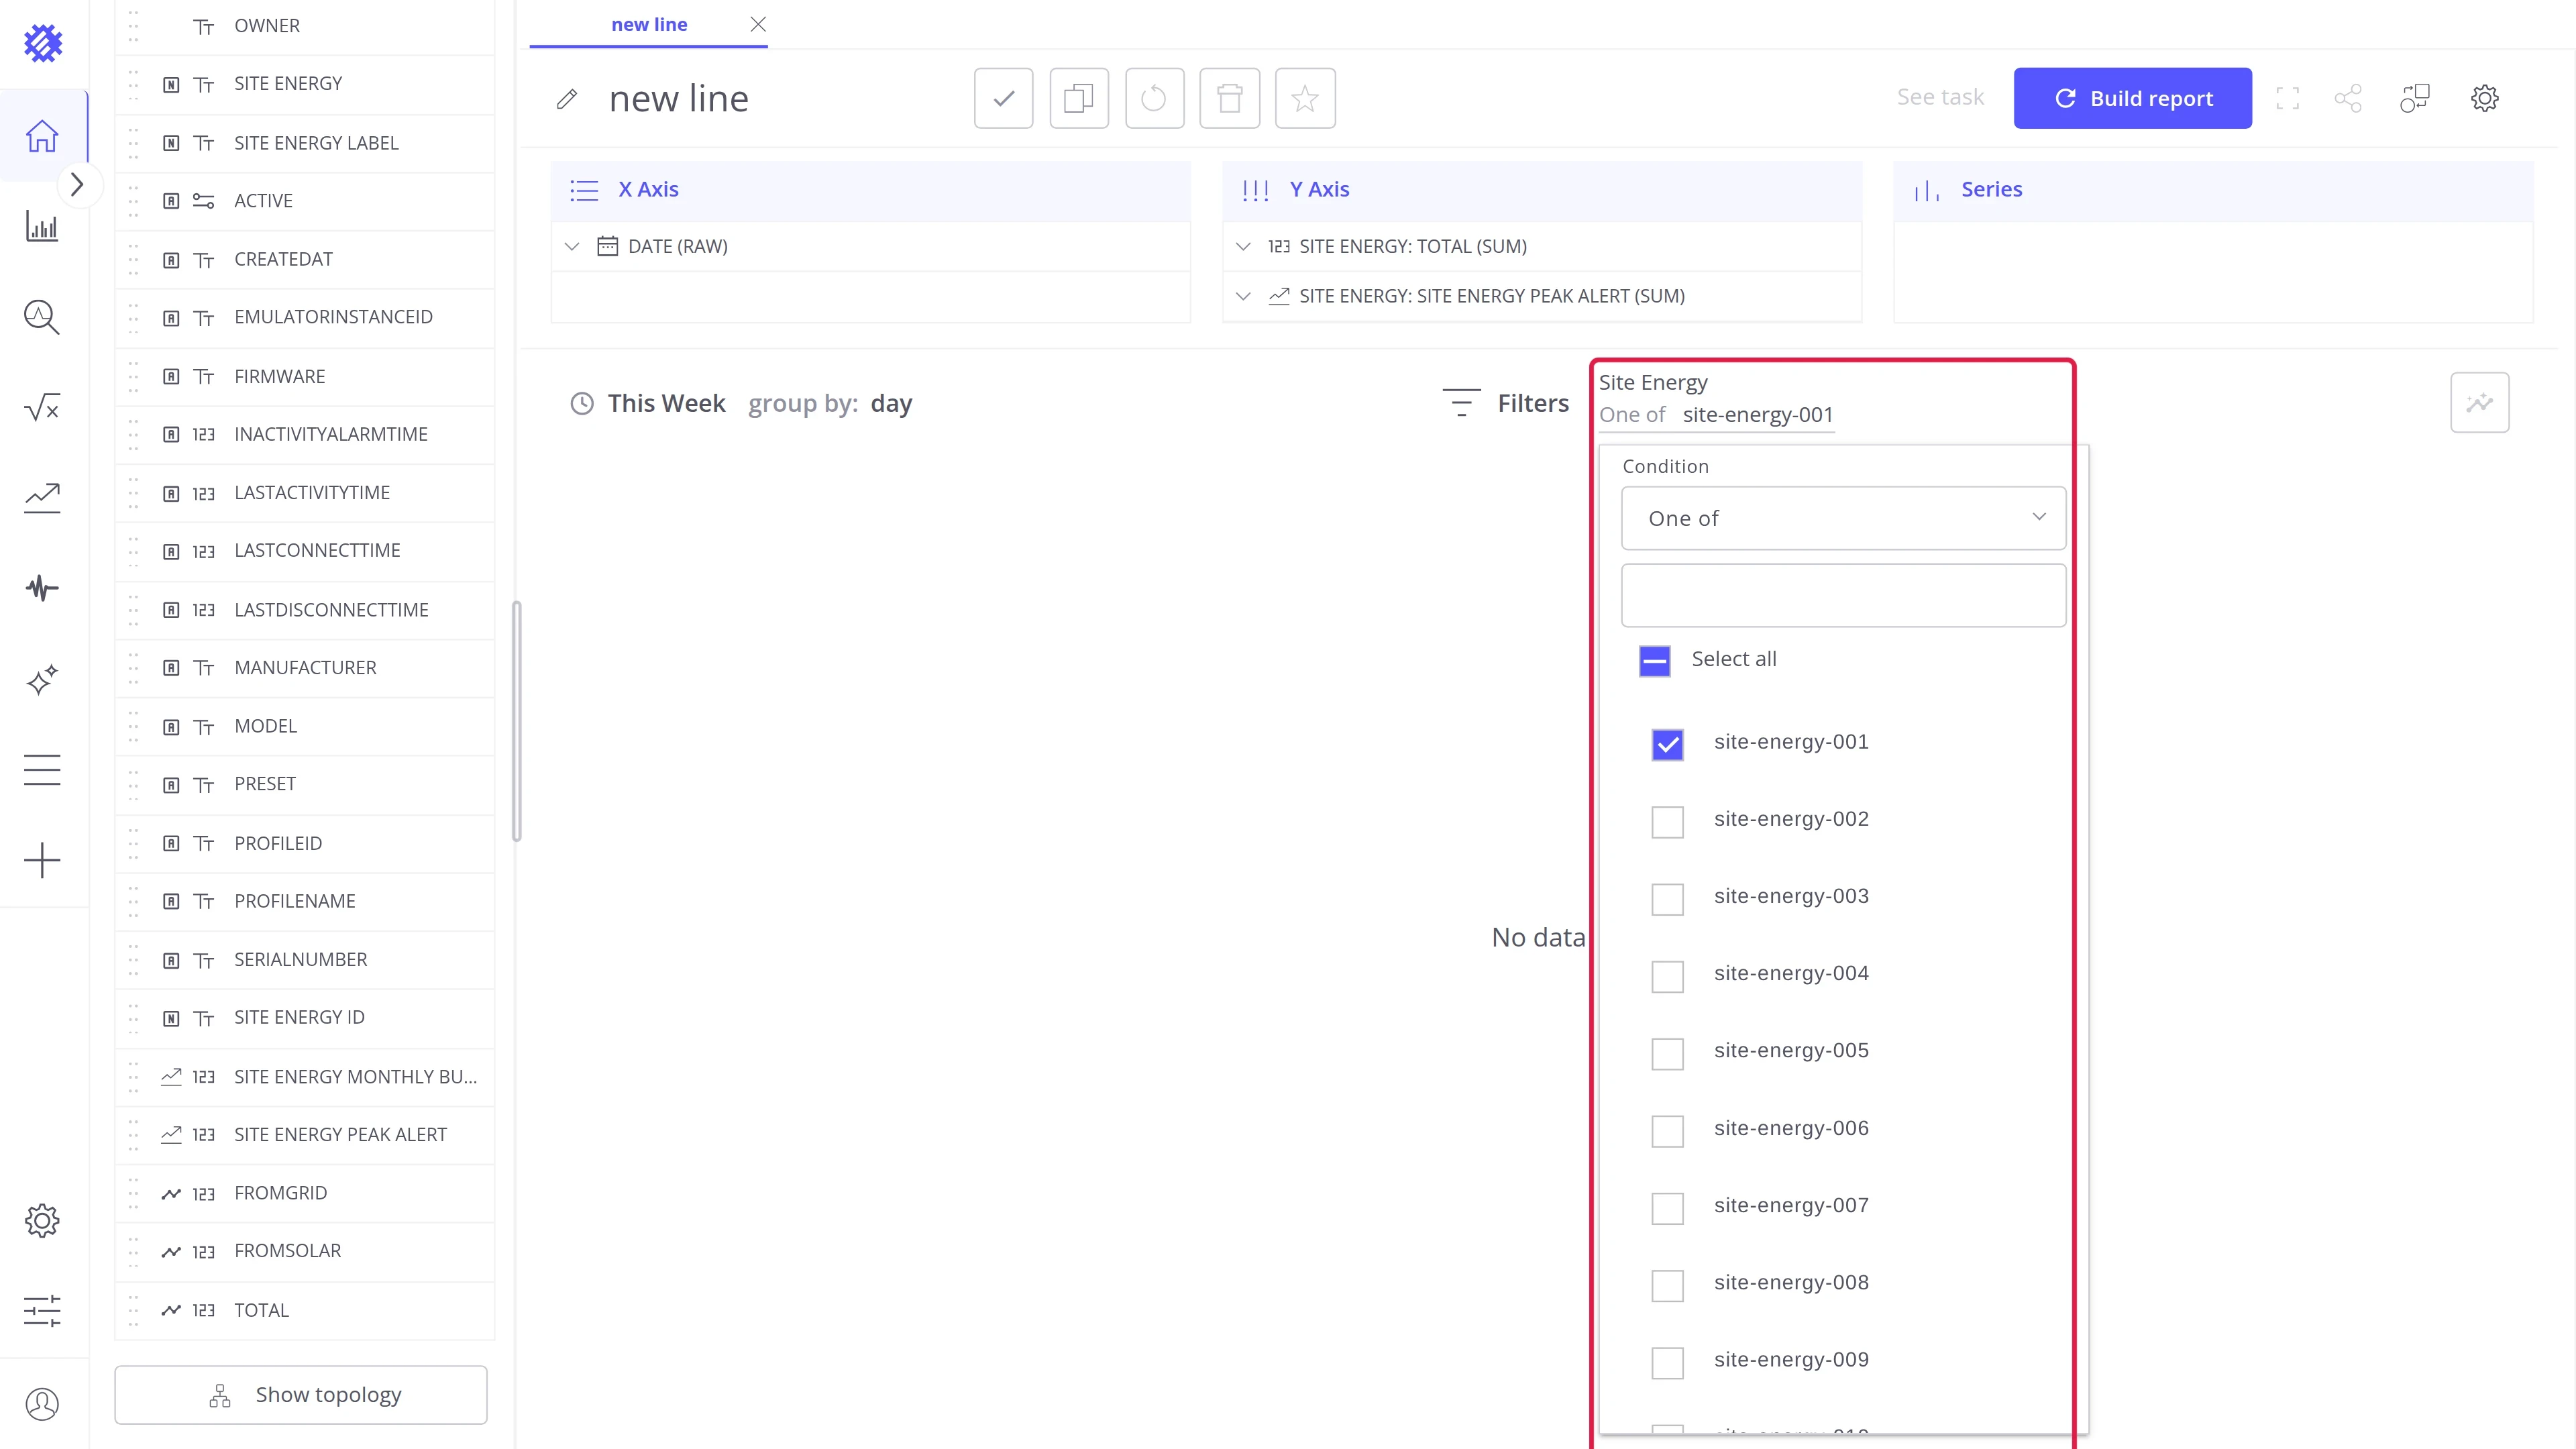
- Click the filter and pick one item, site-energy-001 here.
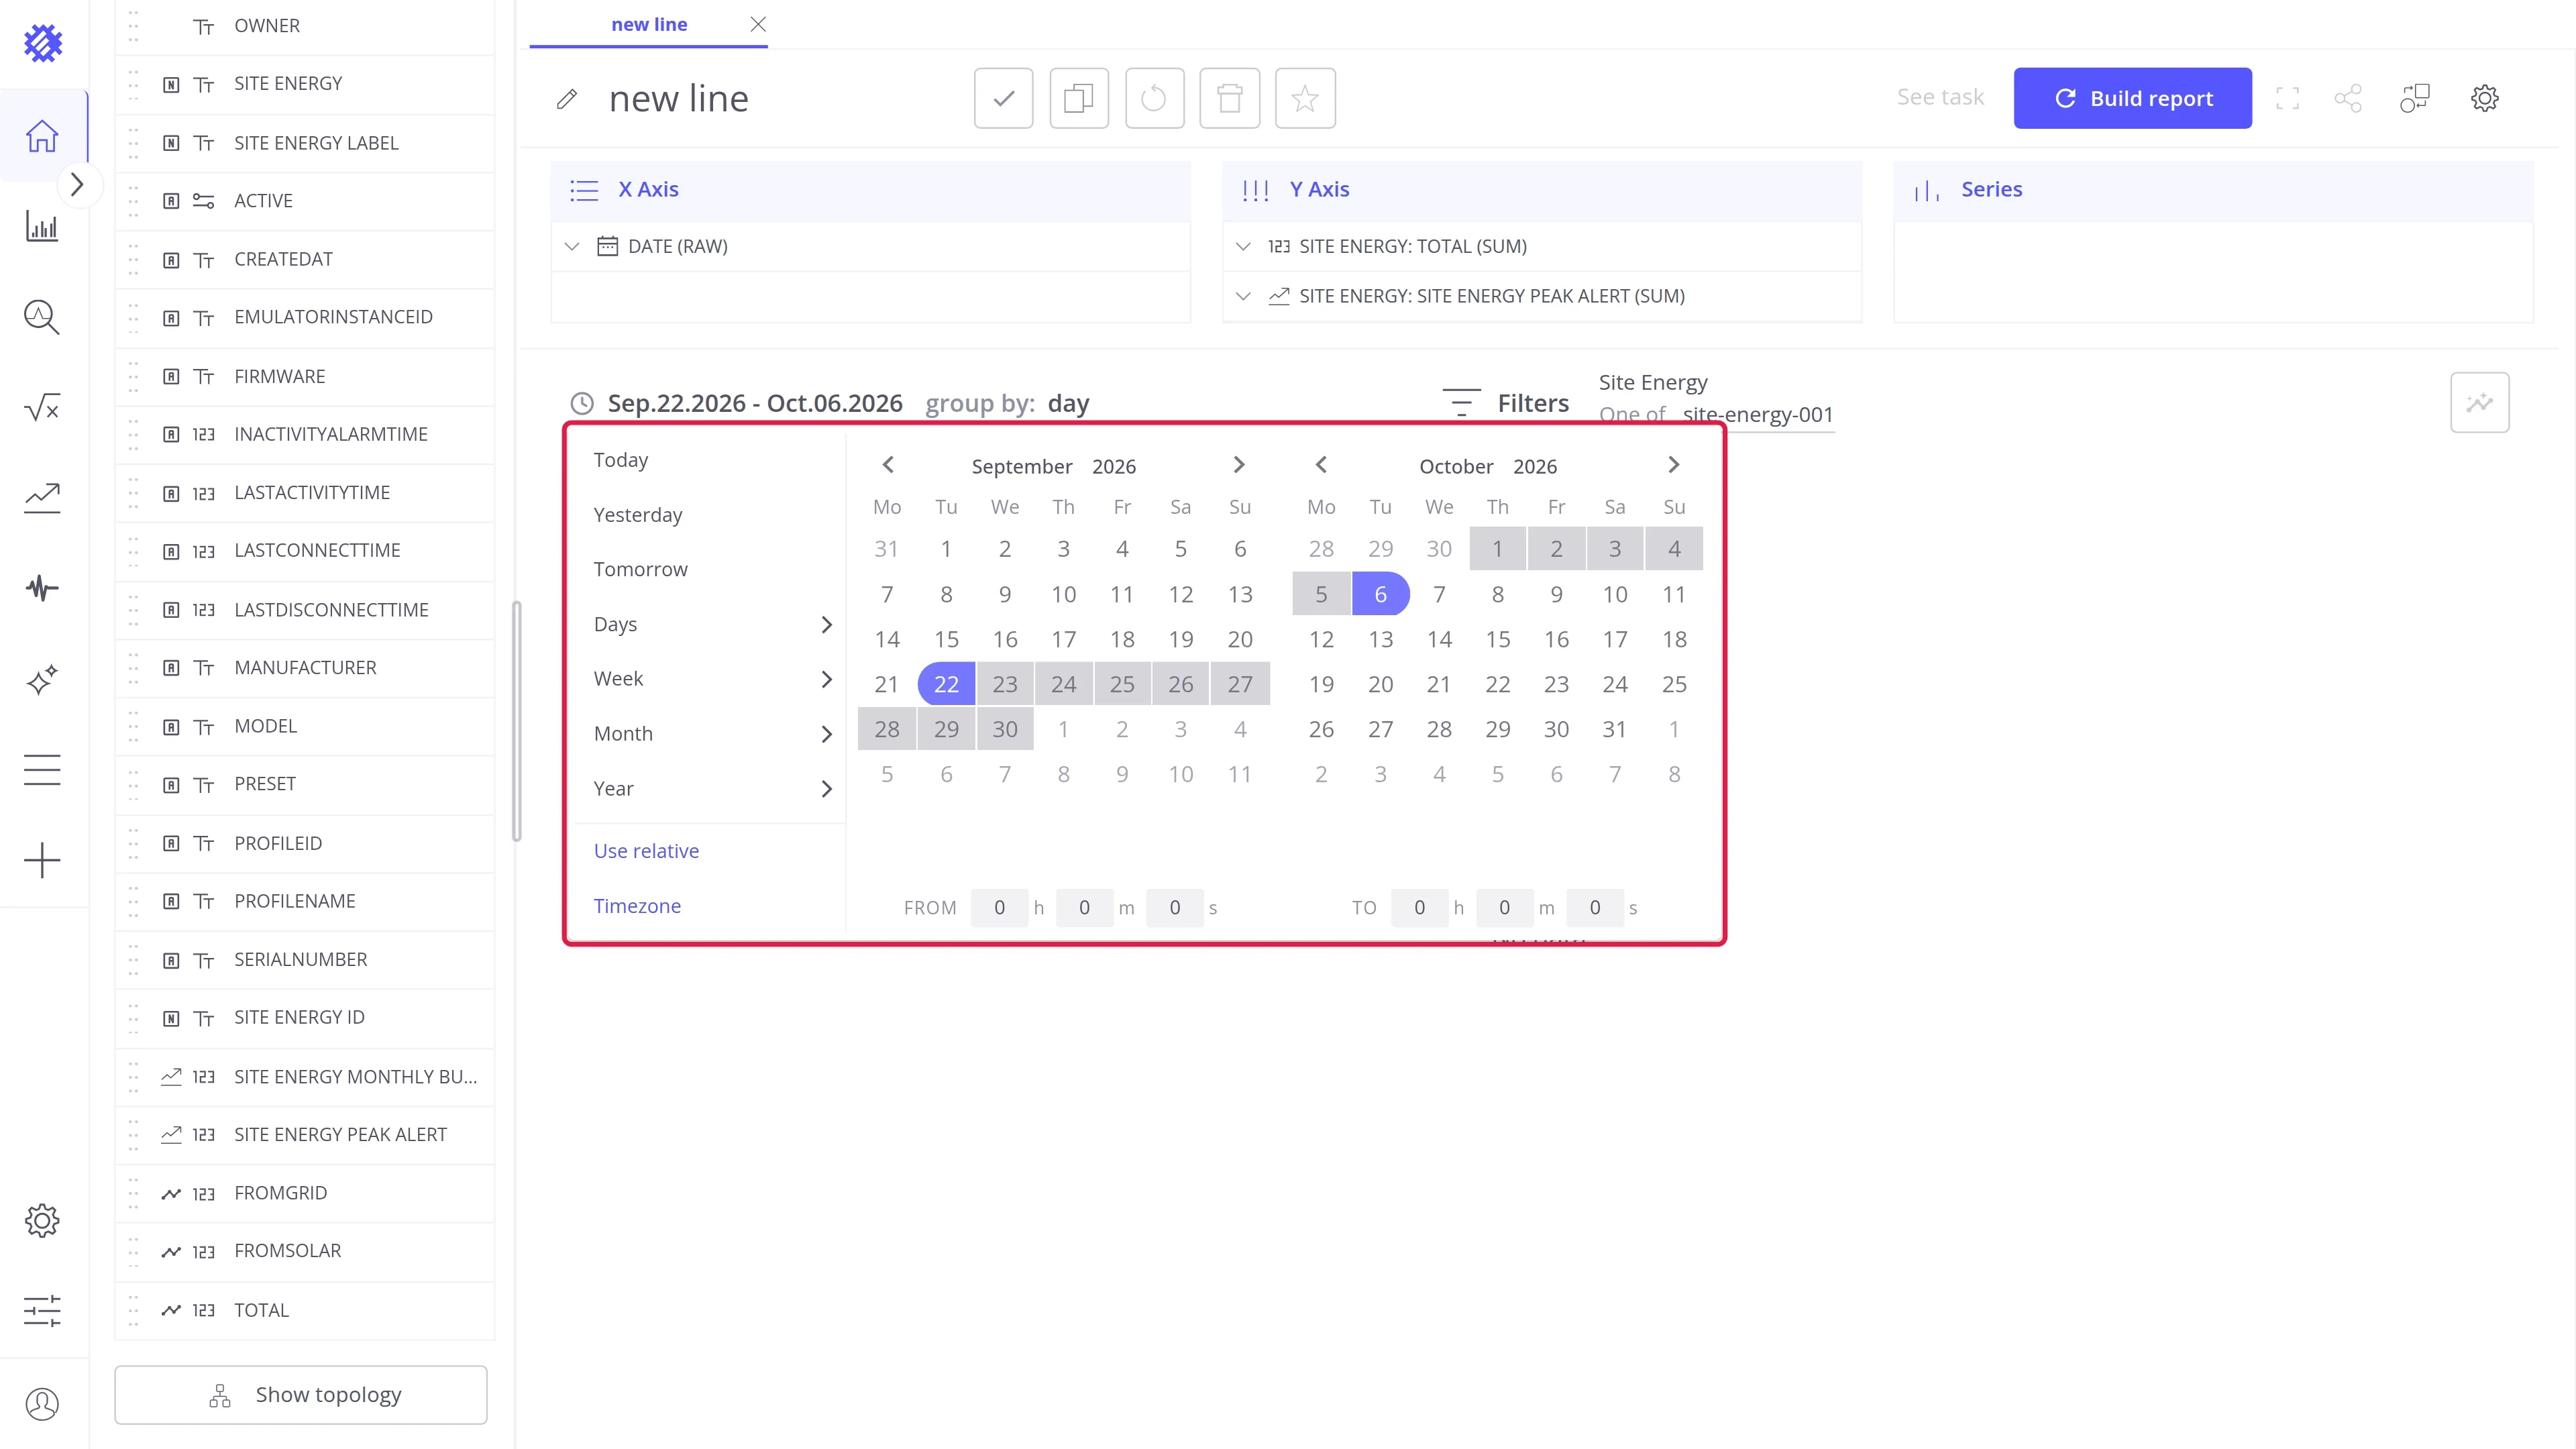
- Click the period and choose one that reaches into the future, as far as the forecast goes.
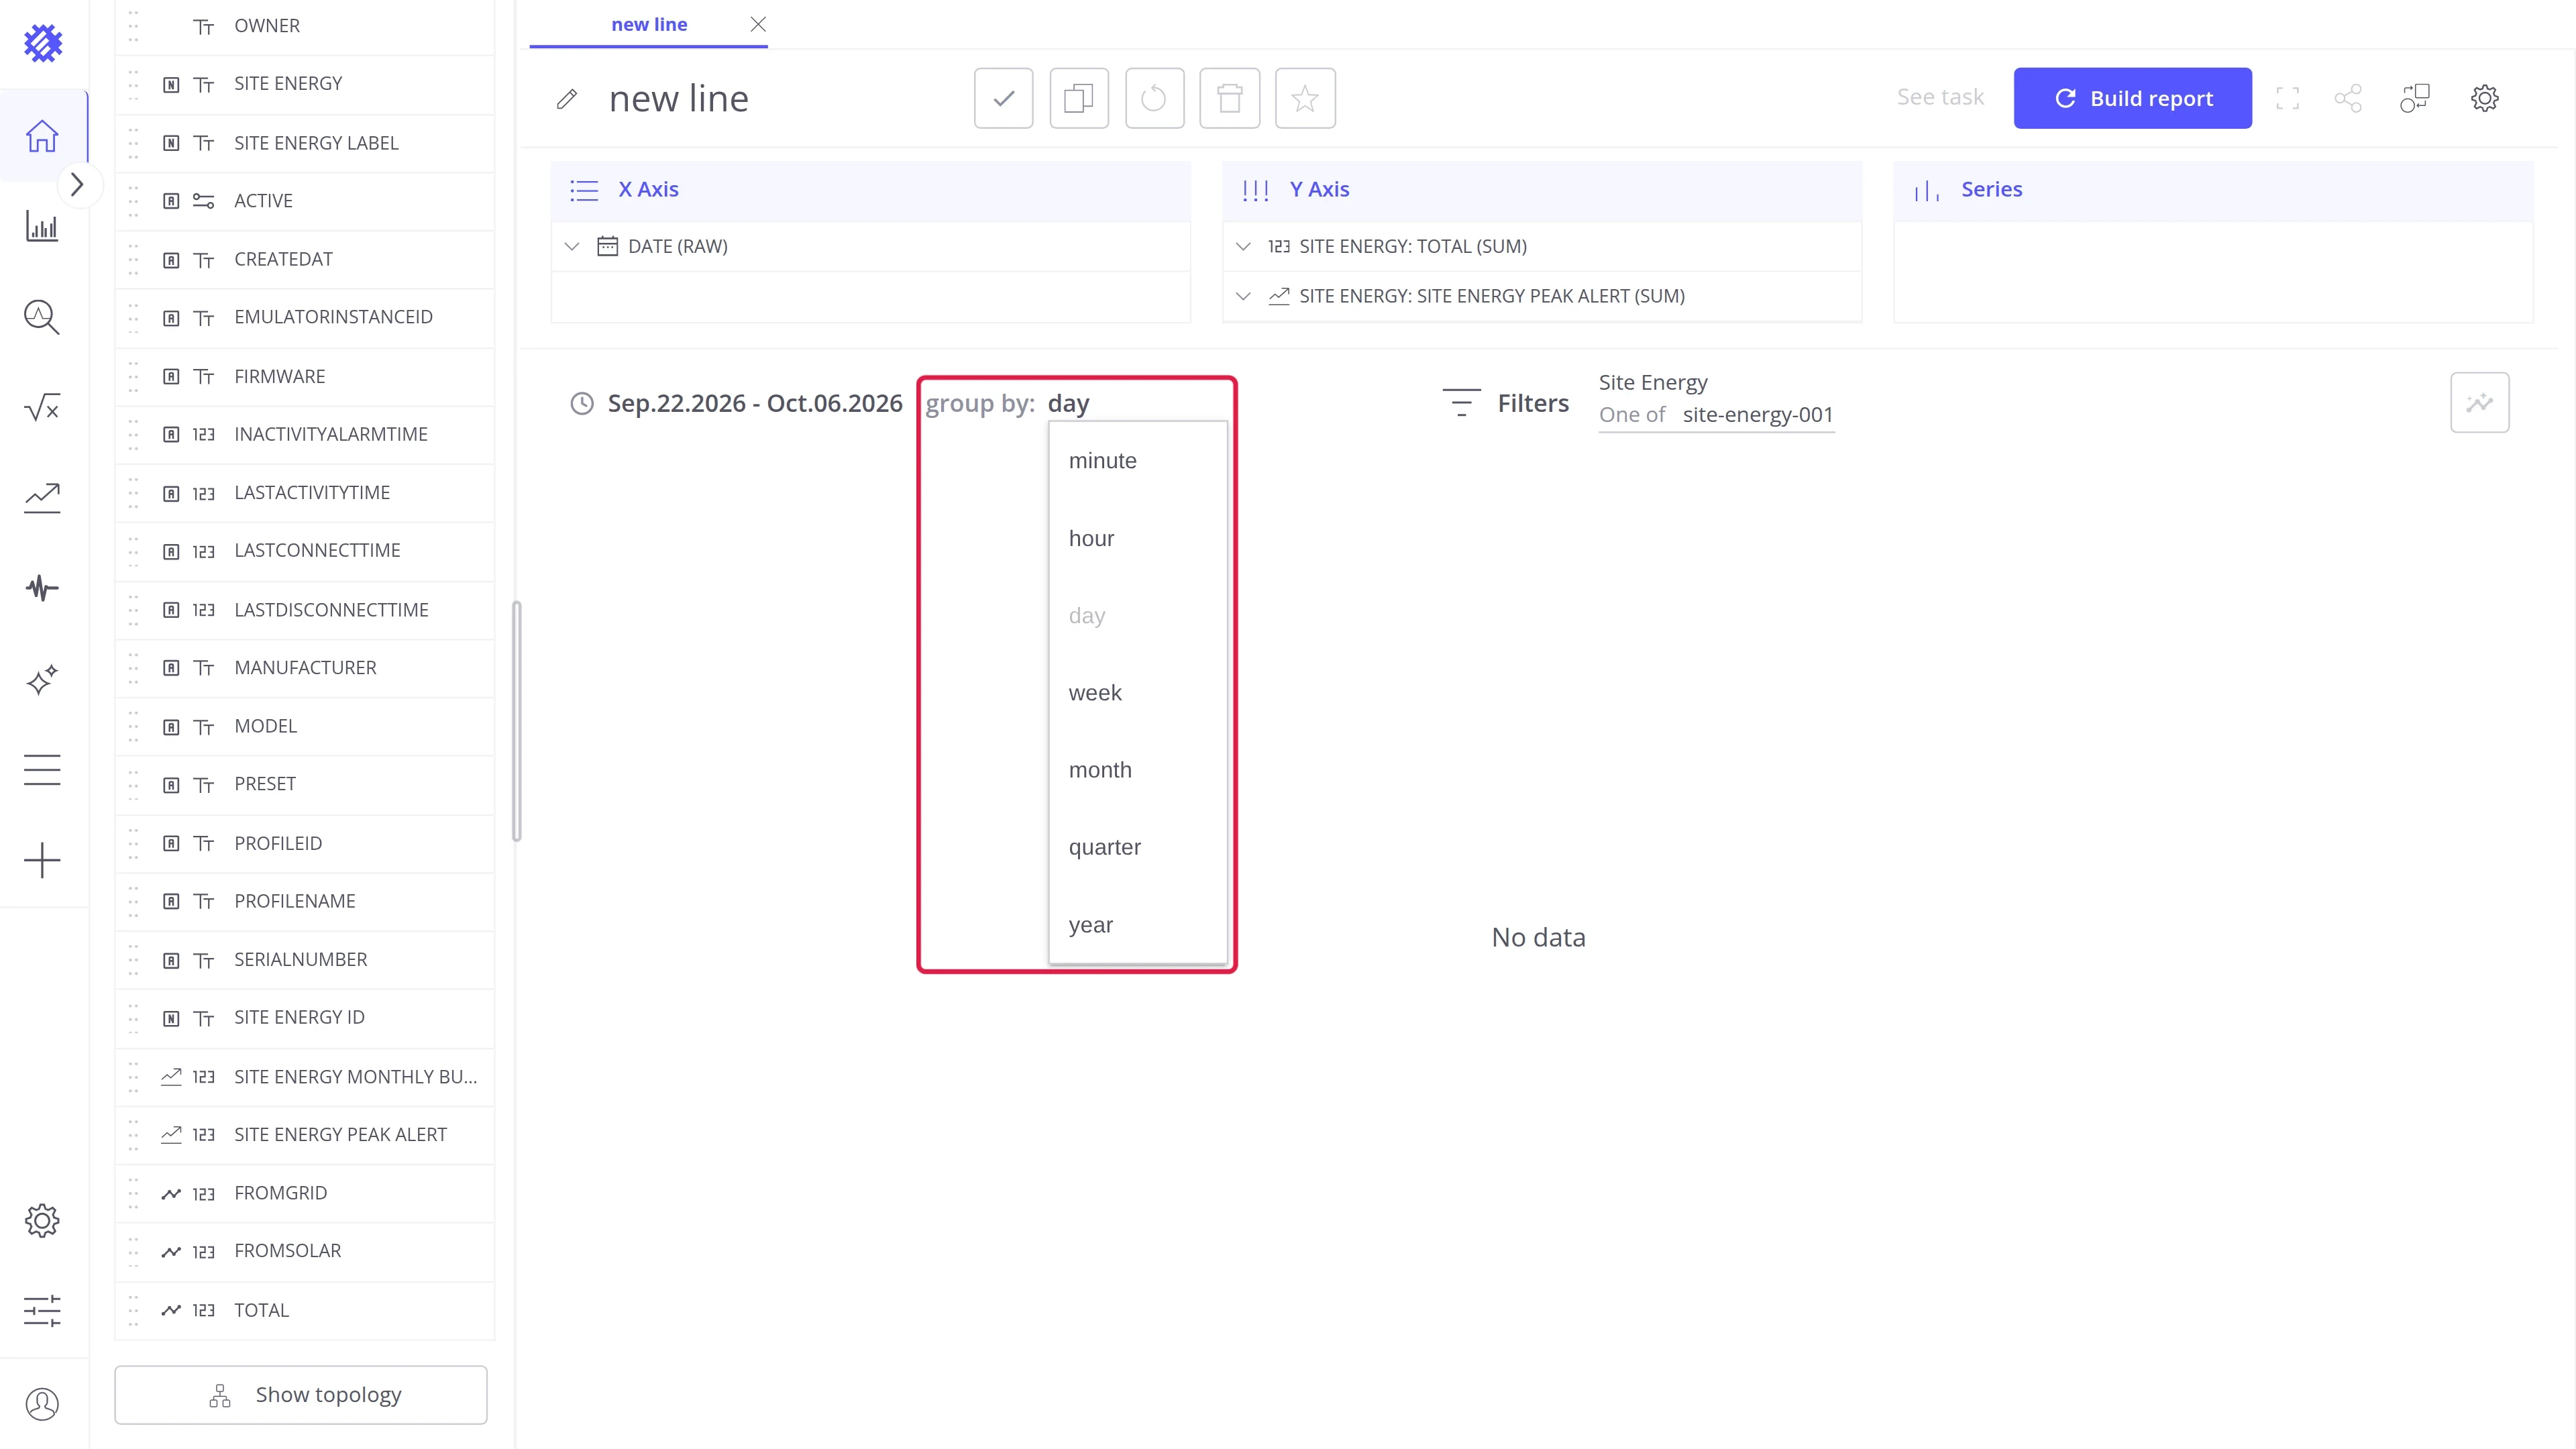
- Click group by and choose the same step as the model, hour here.
Step 4. Build the view
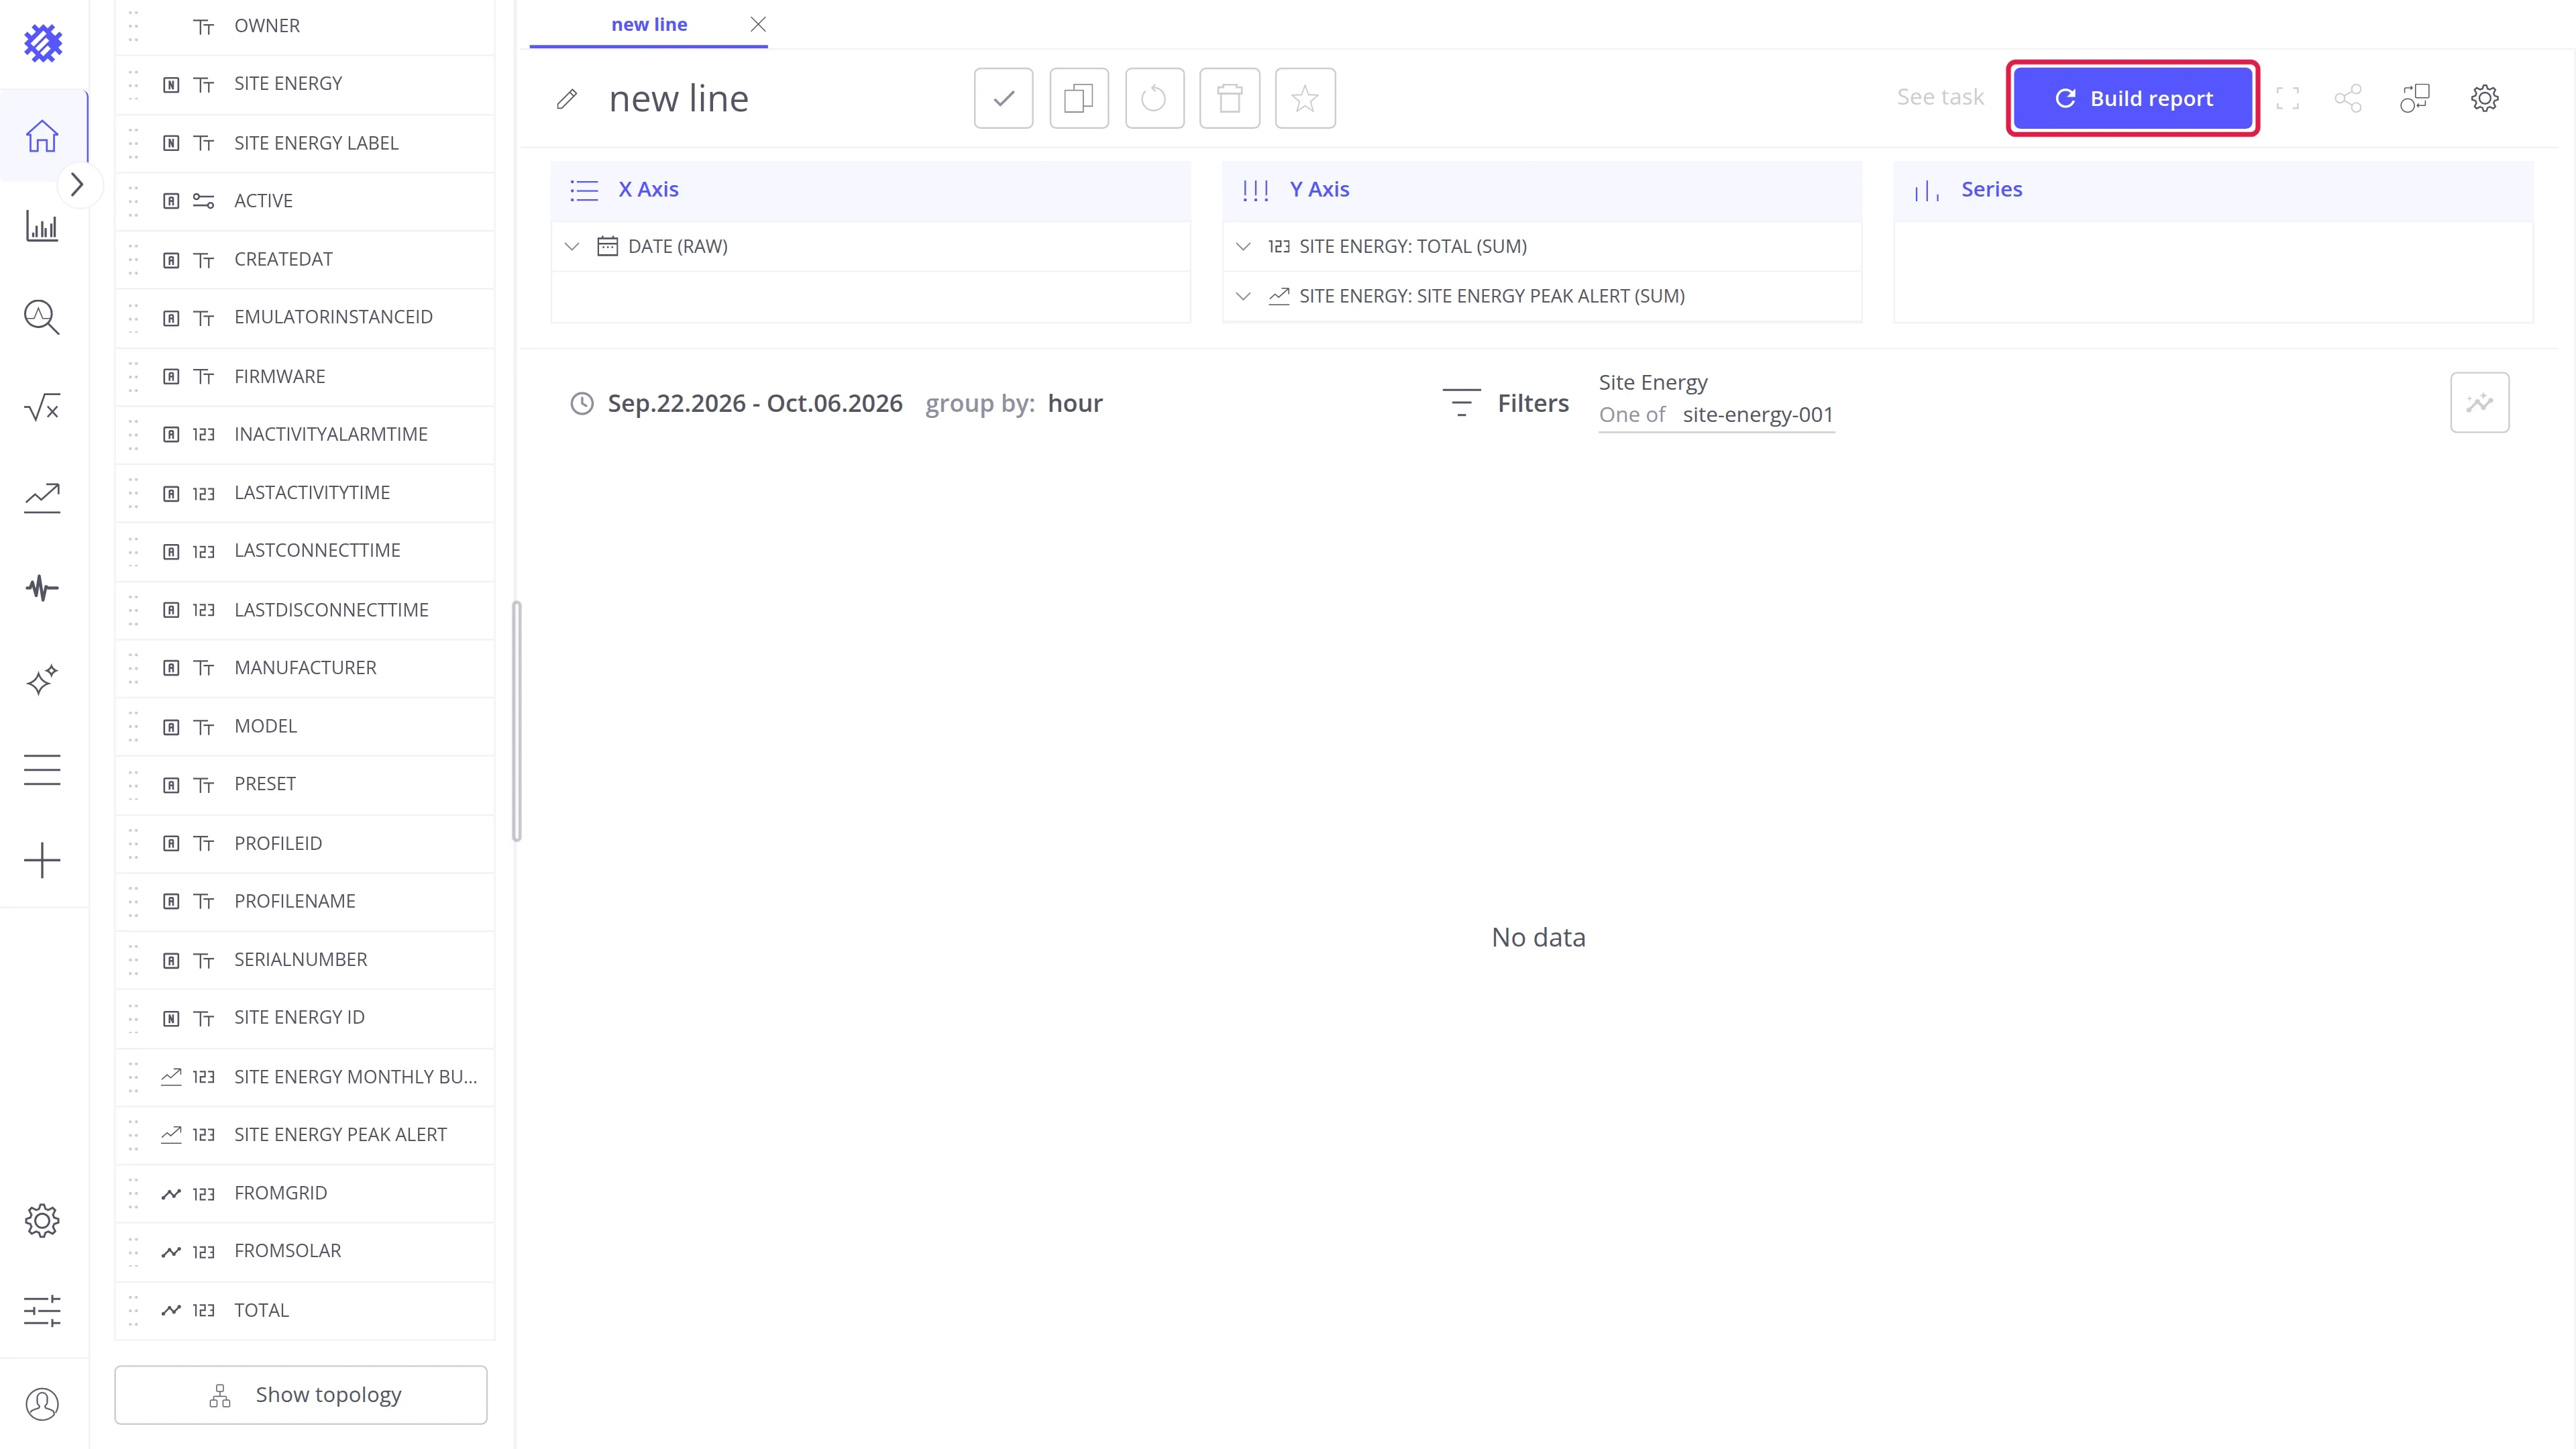
Section titled “Step 4. Build the view”Click Build report. The chart shows the measured values up to the latest reading, and the forecast after it as a dashed line.
Step 5. Share on a dashboard
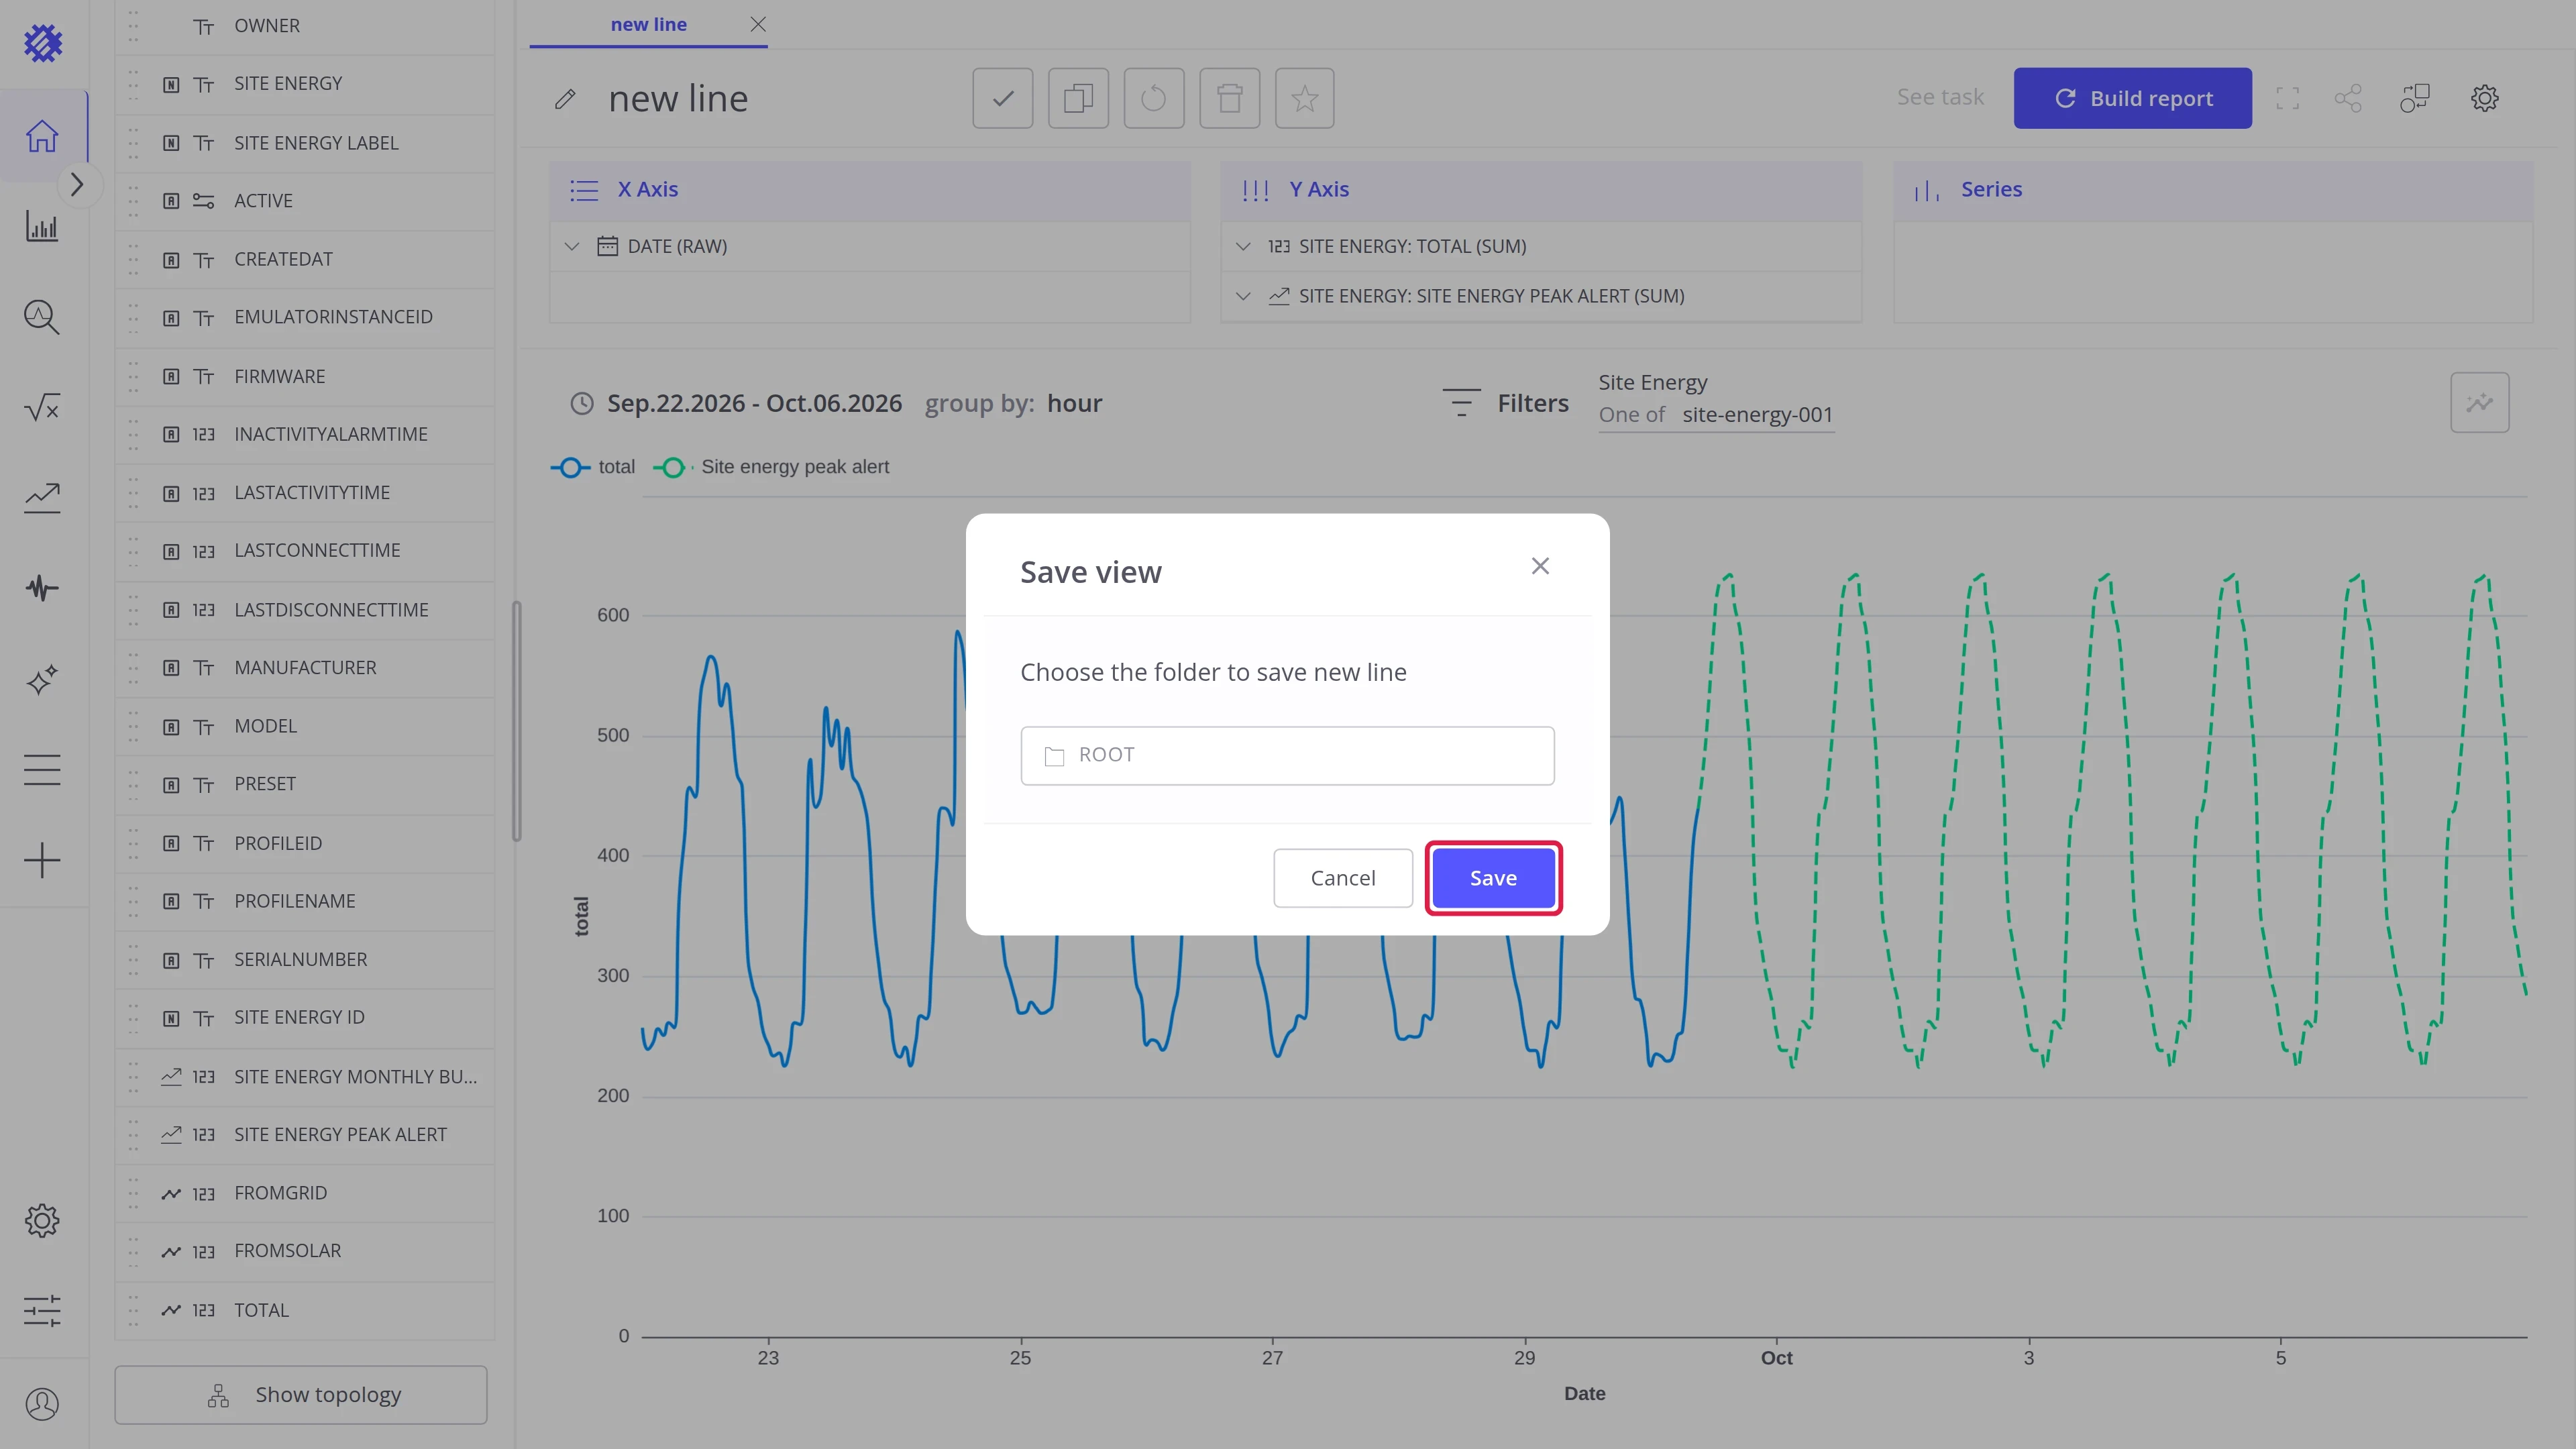
Section titled “Step 5. Share on a dashboard”Click the check mark, choose the collection to save the view in, and click Save. A view has to be saved before it can be shared.
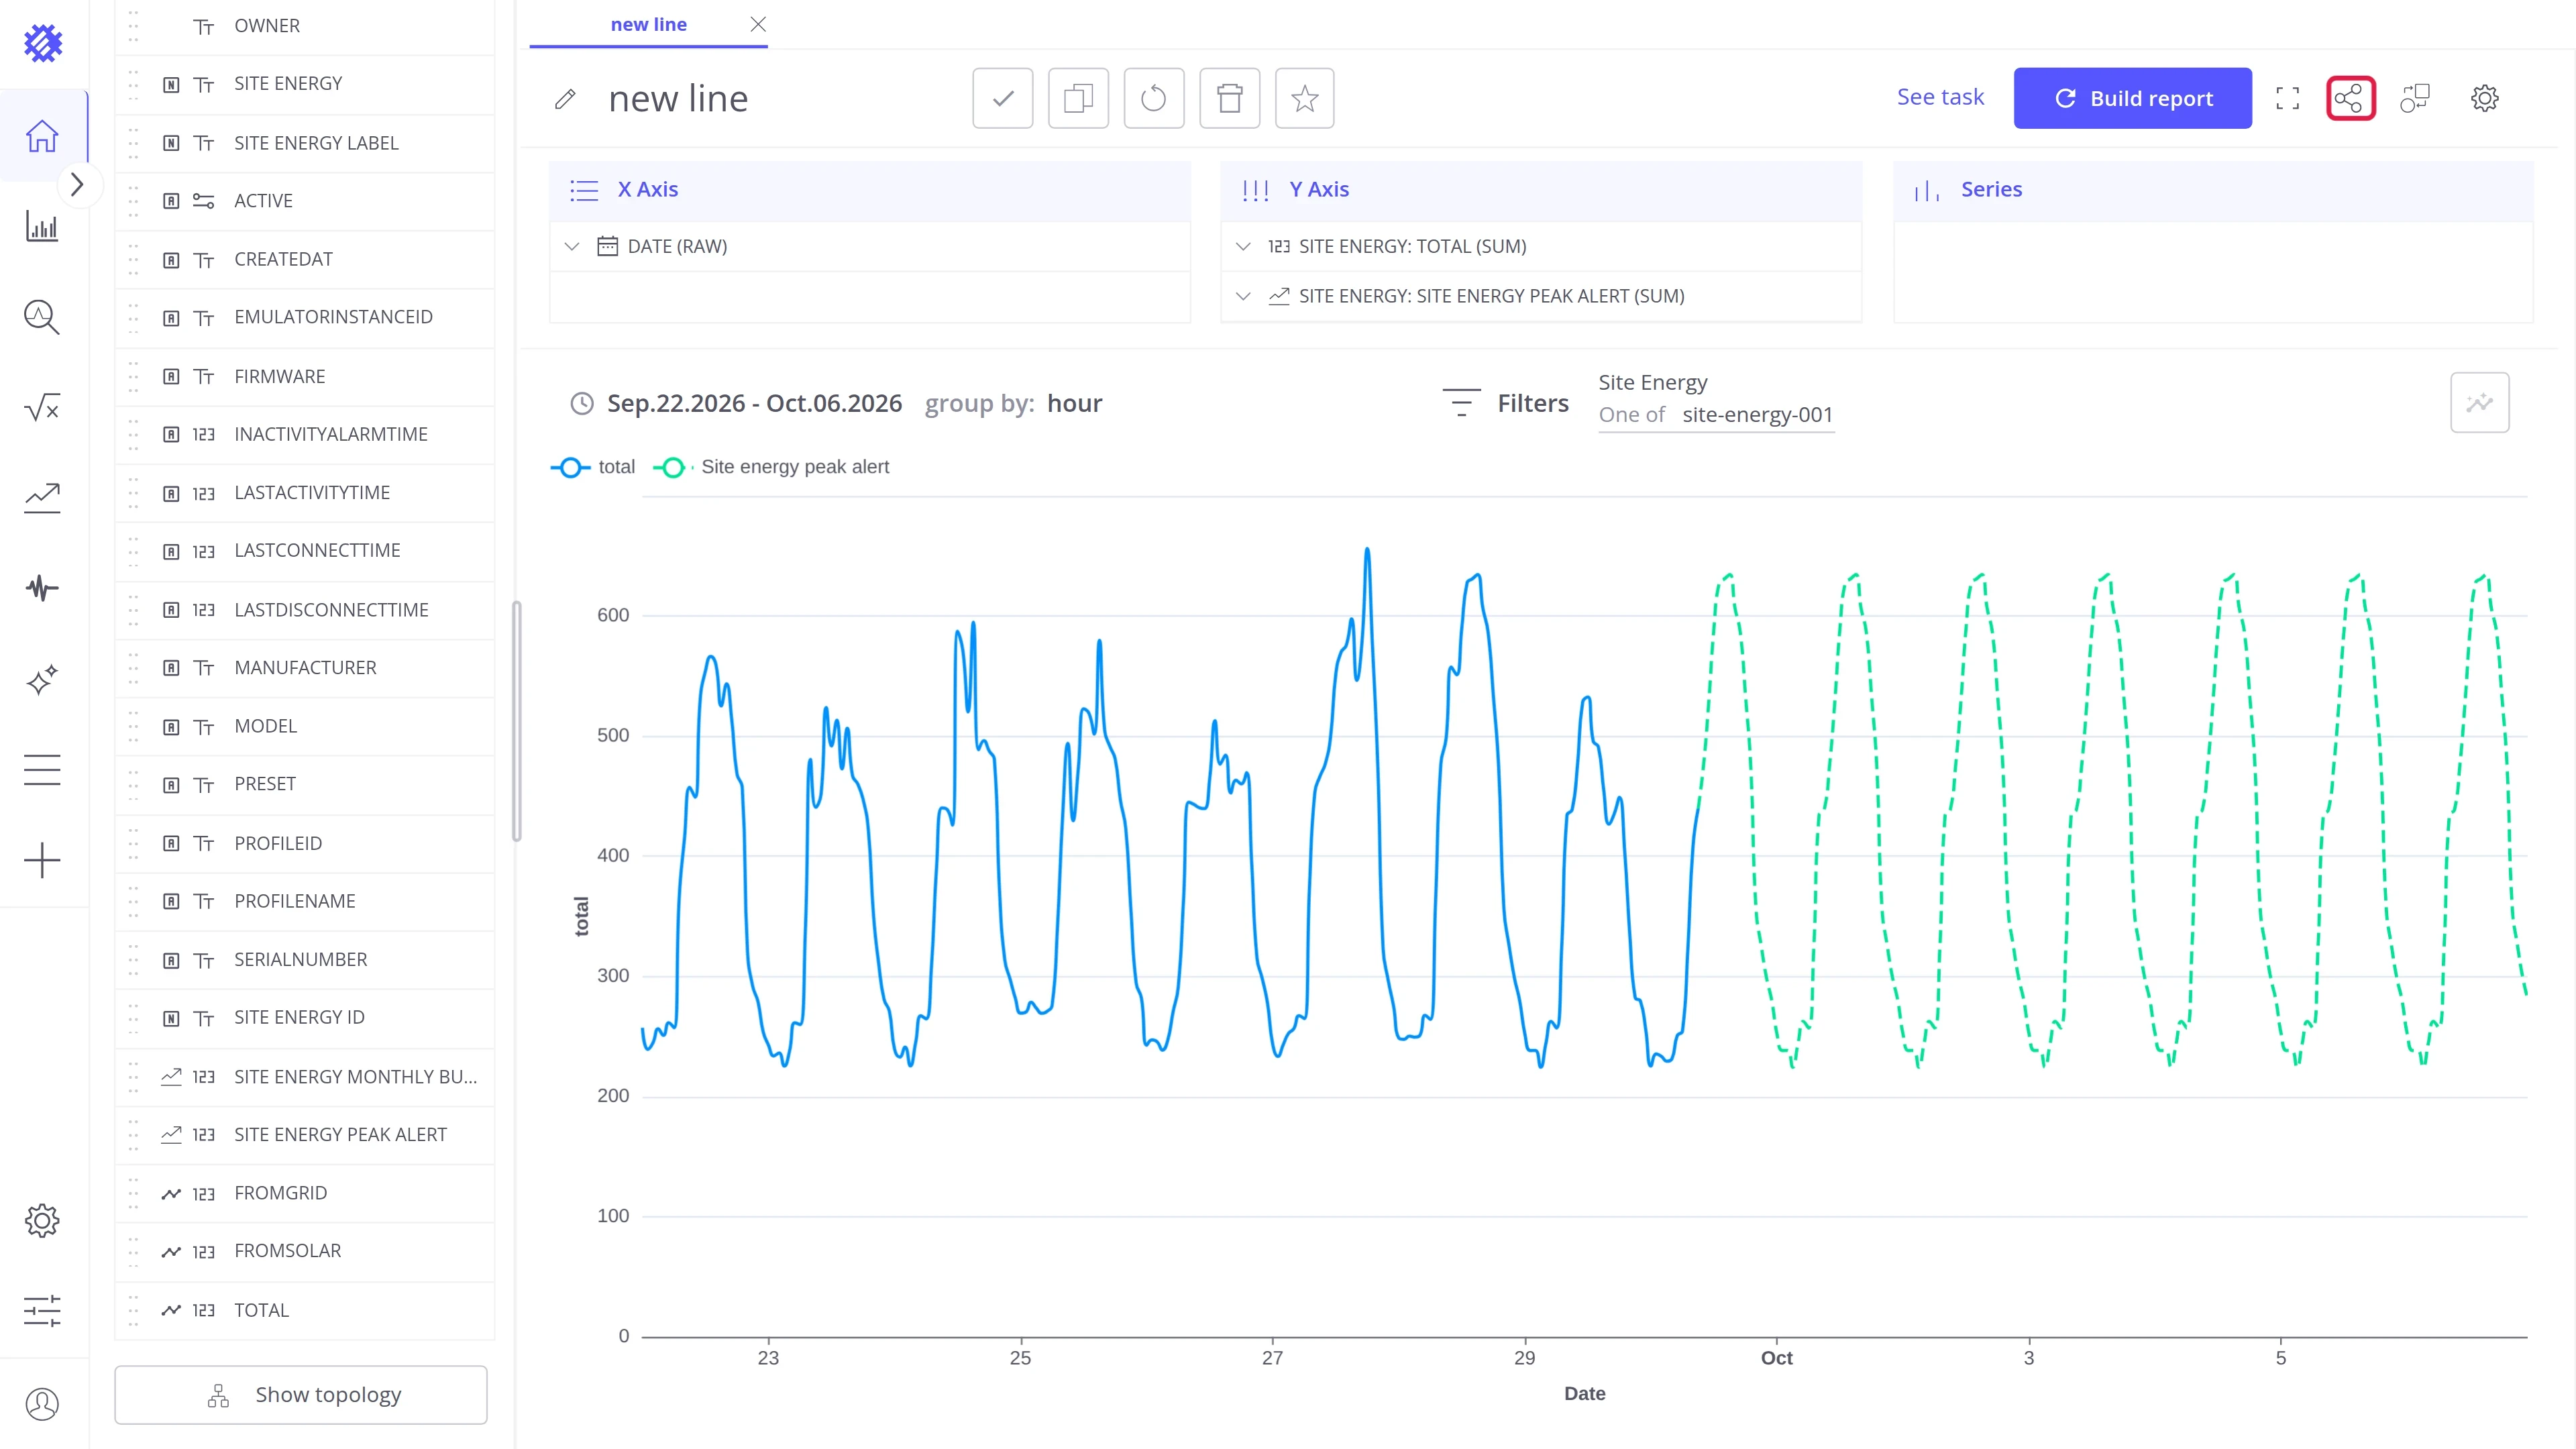
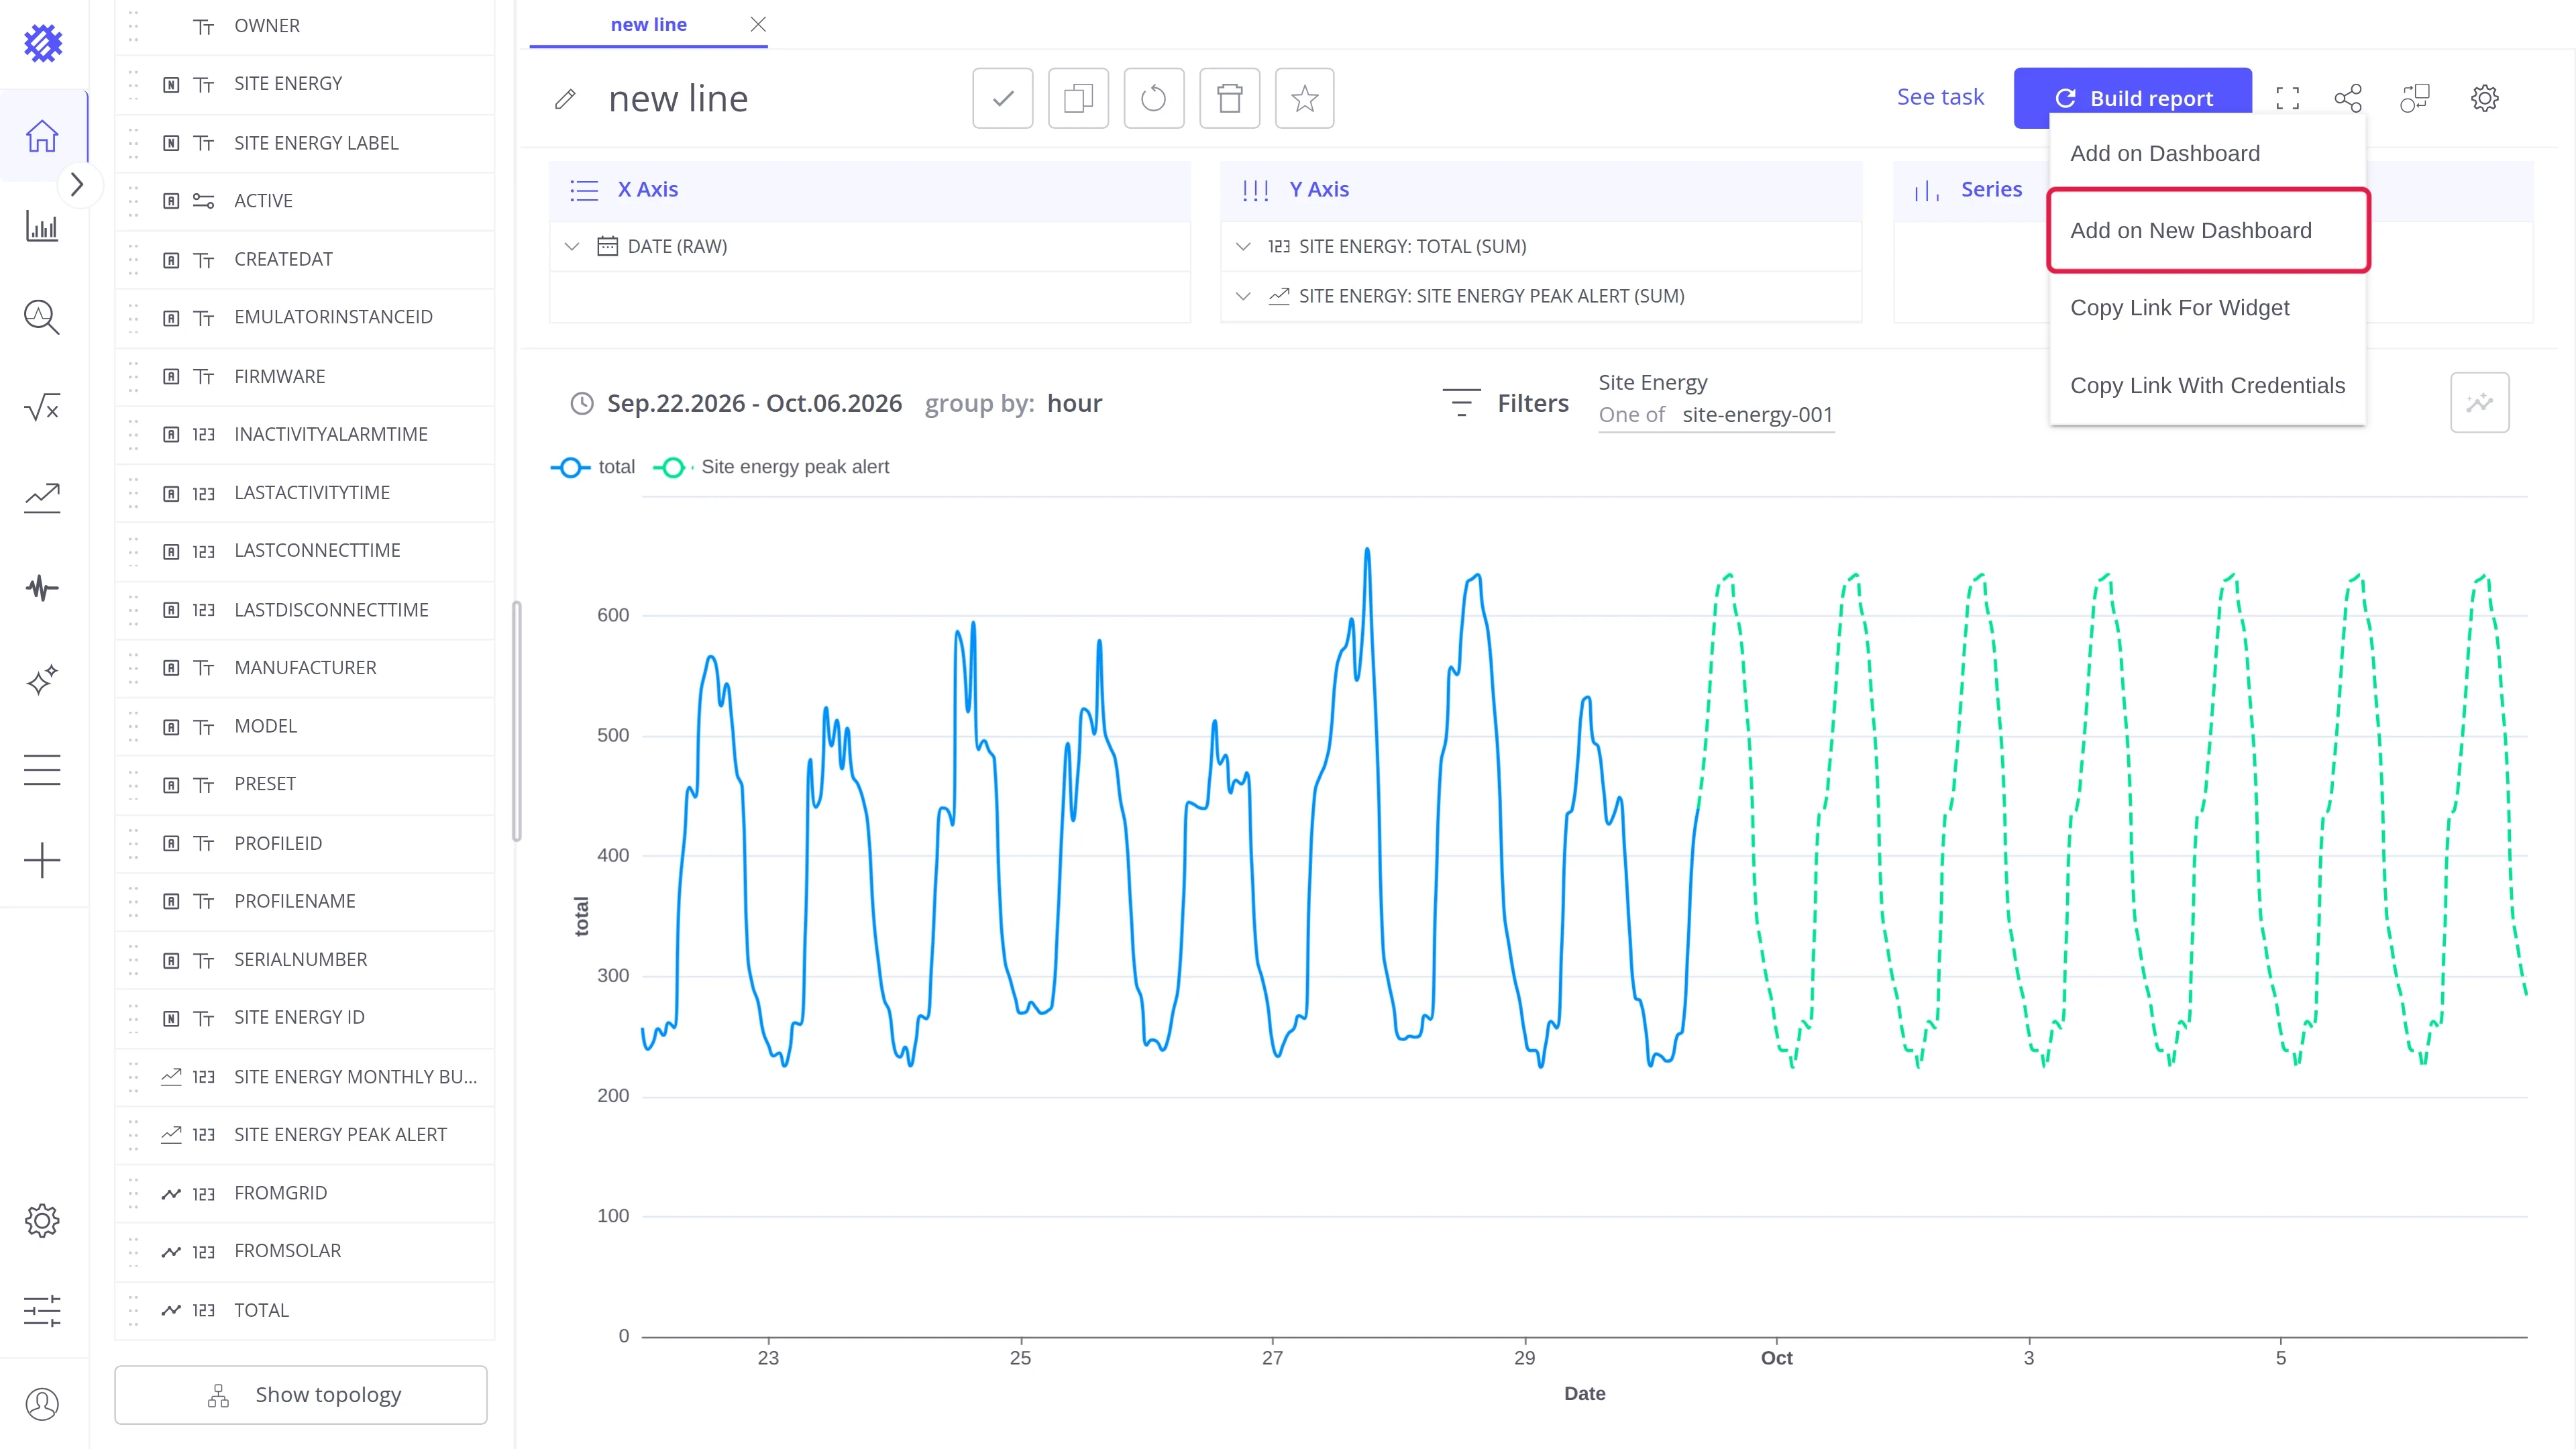
Click the share button and choose Add on New Dashboard, or Add on Dashboard for an existing one.
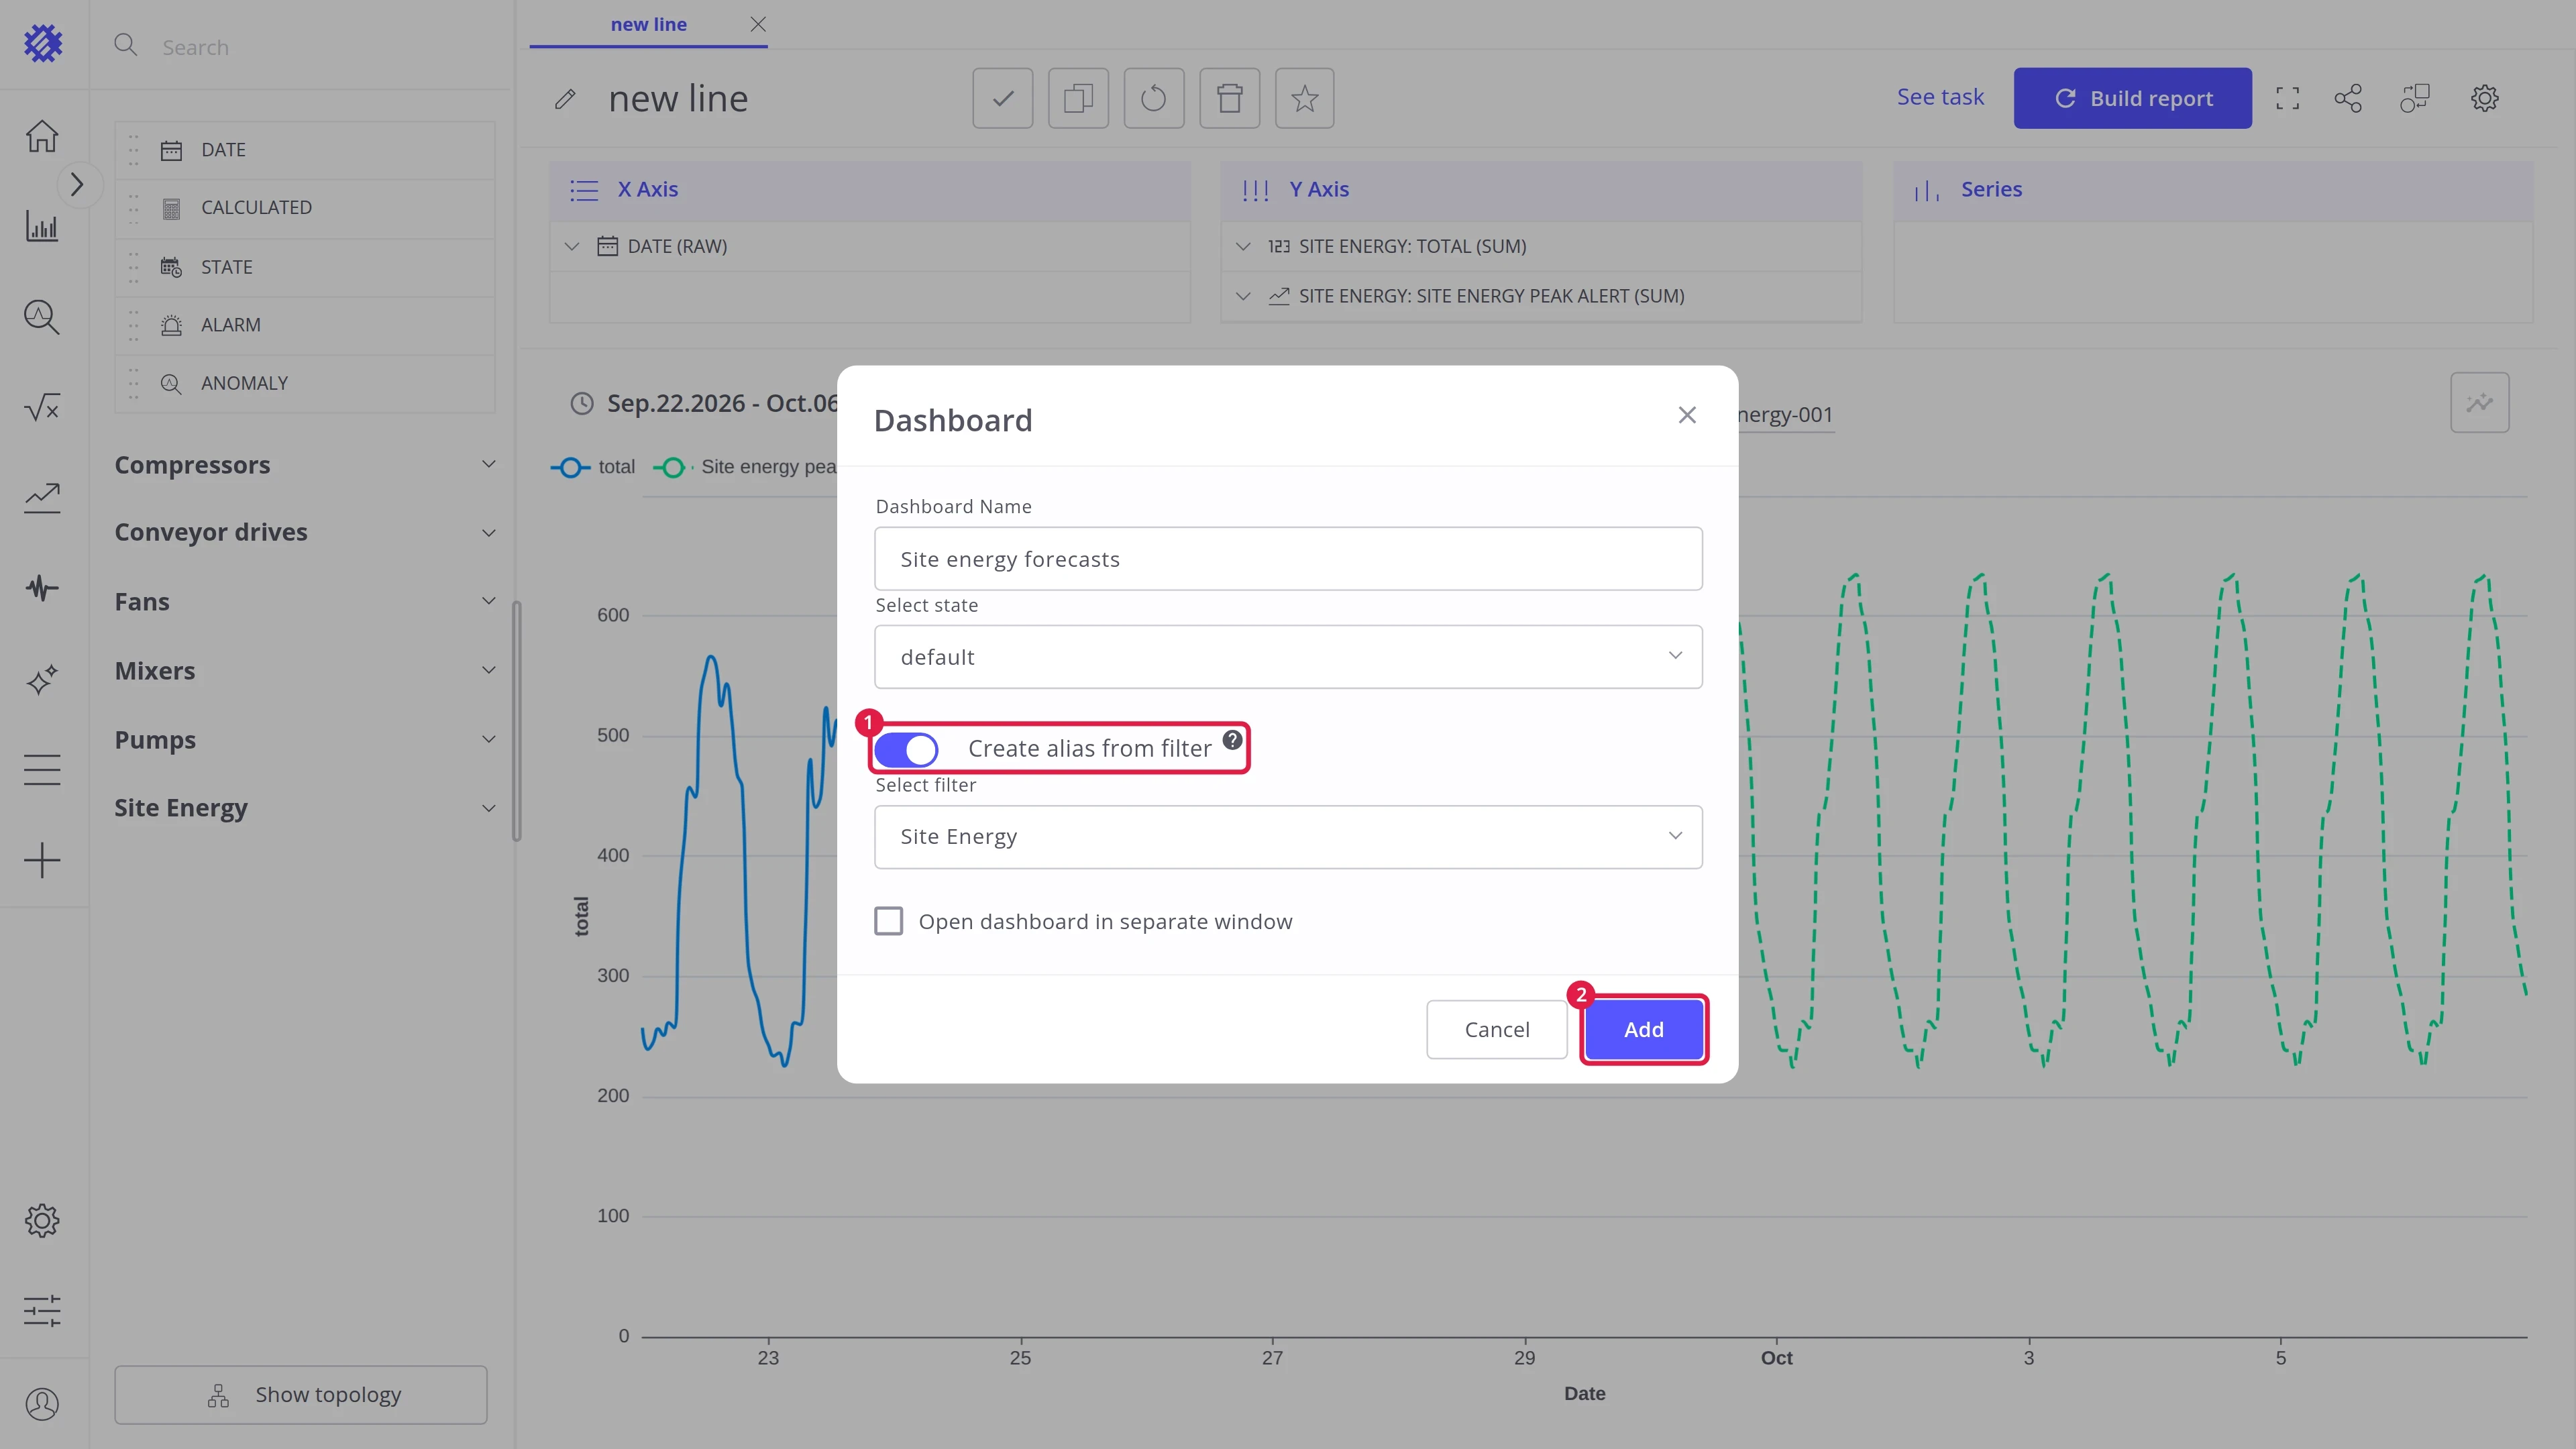
Enter the dashboard name, turn on Create alias from filter (1), and click Add (2). With the alias, the dashboard gets a list of the items, and the view shows the item picked in it. Open dashboard in separate window opens the dashboard right after it is added.
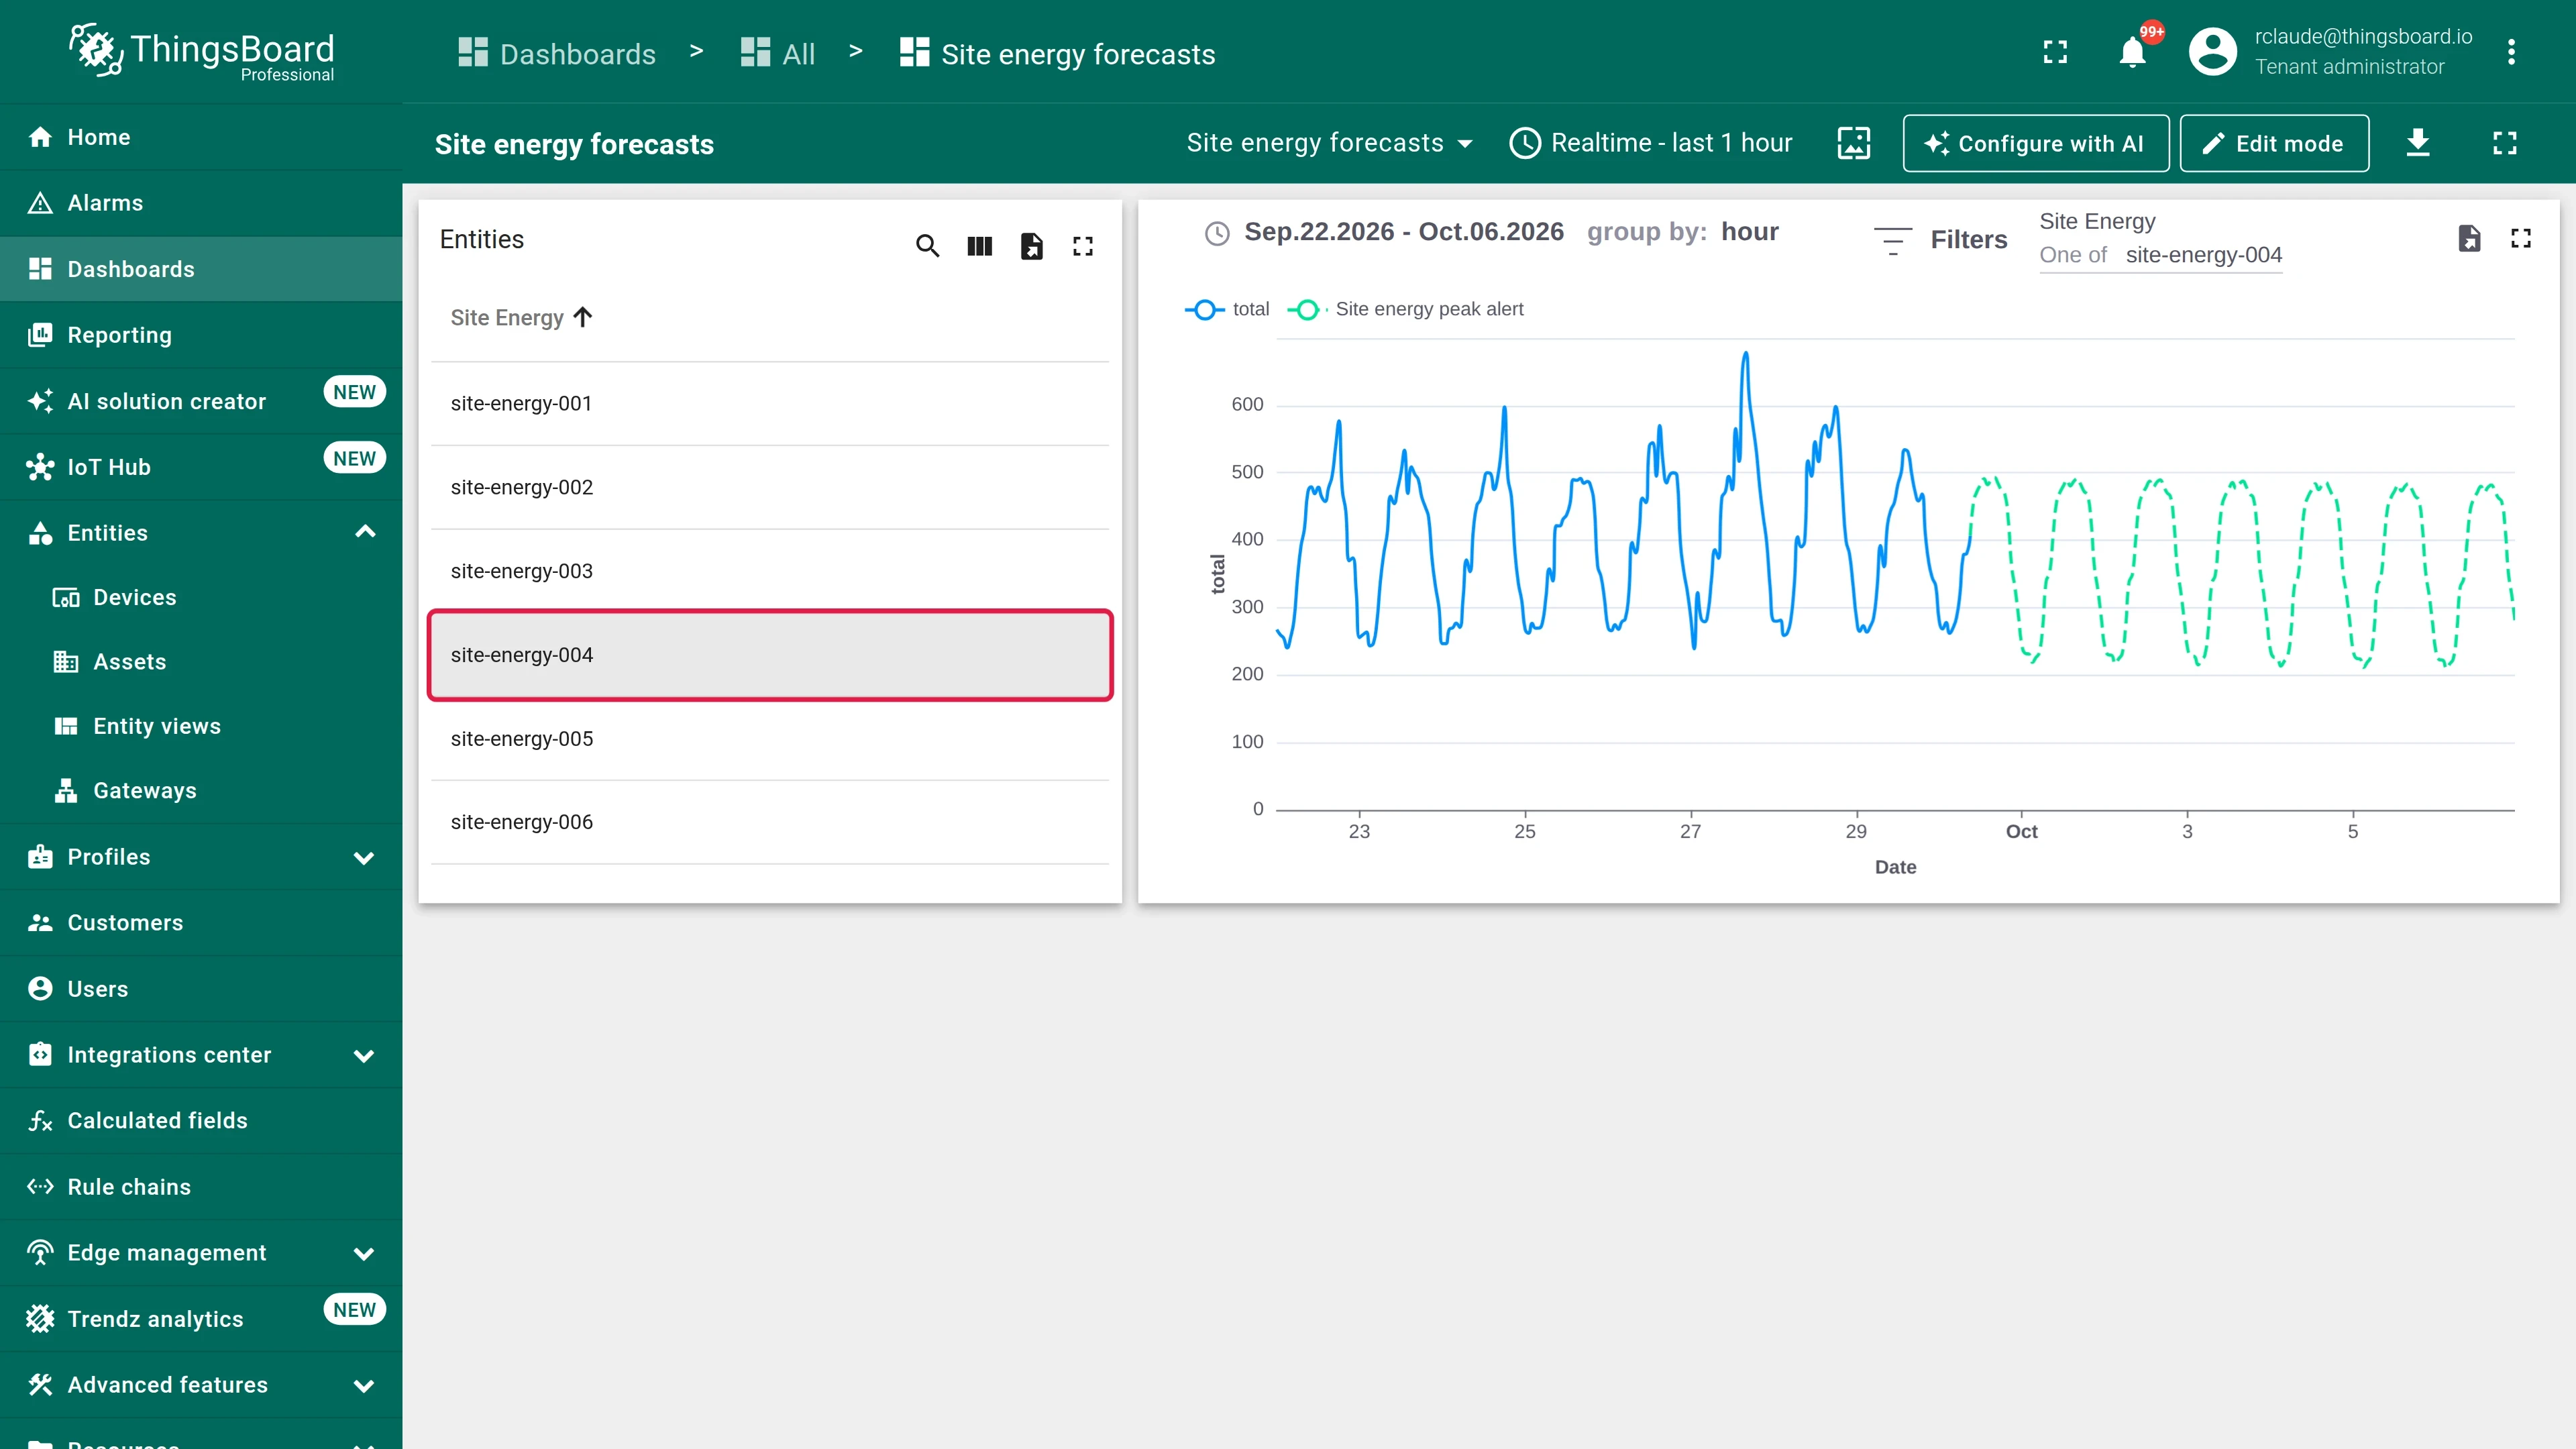
On the dashboard, click any item in the list to see its prediction. The view switches to that item: its measured values, and its forecast after them.
More options for dashboards are described in Embed visuals.
Prediction field settings
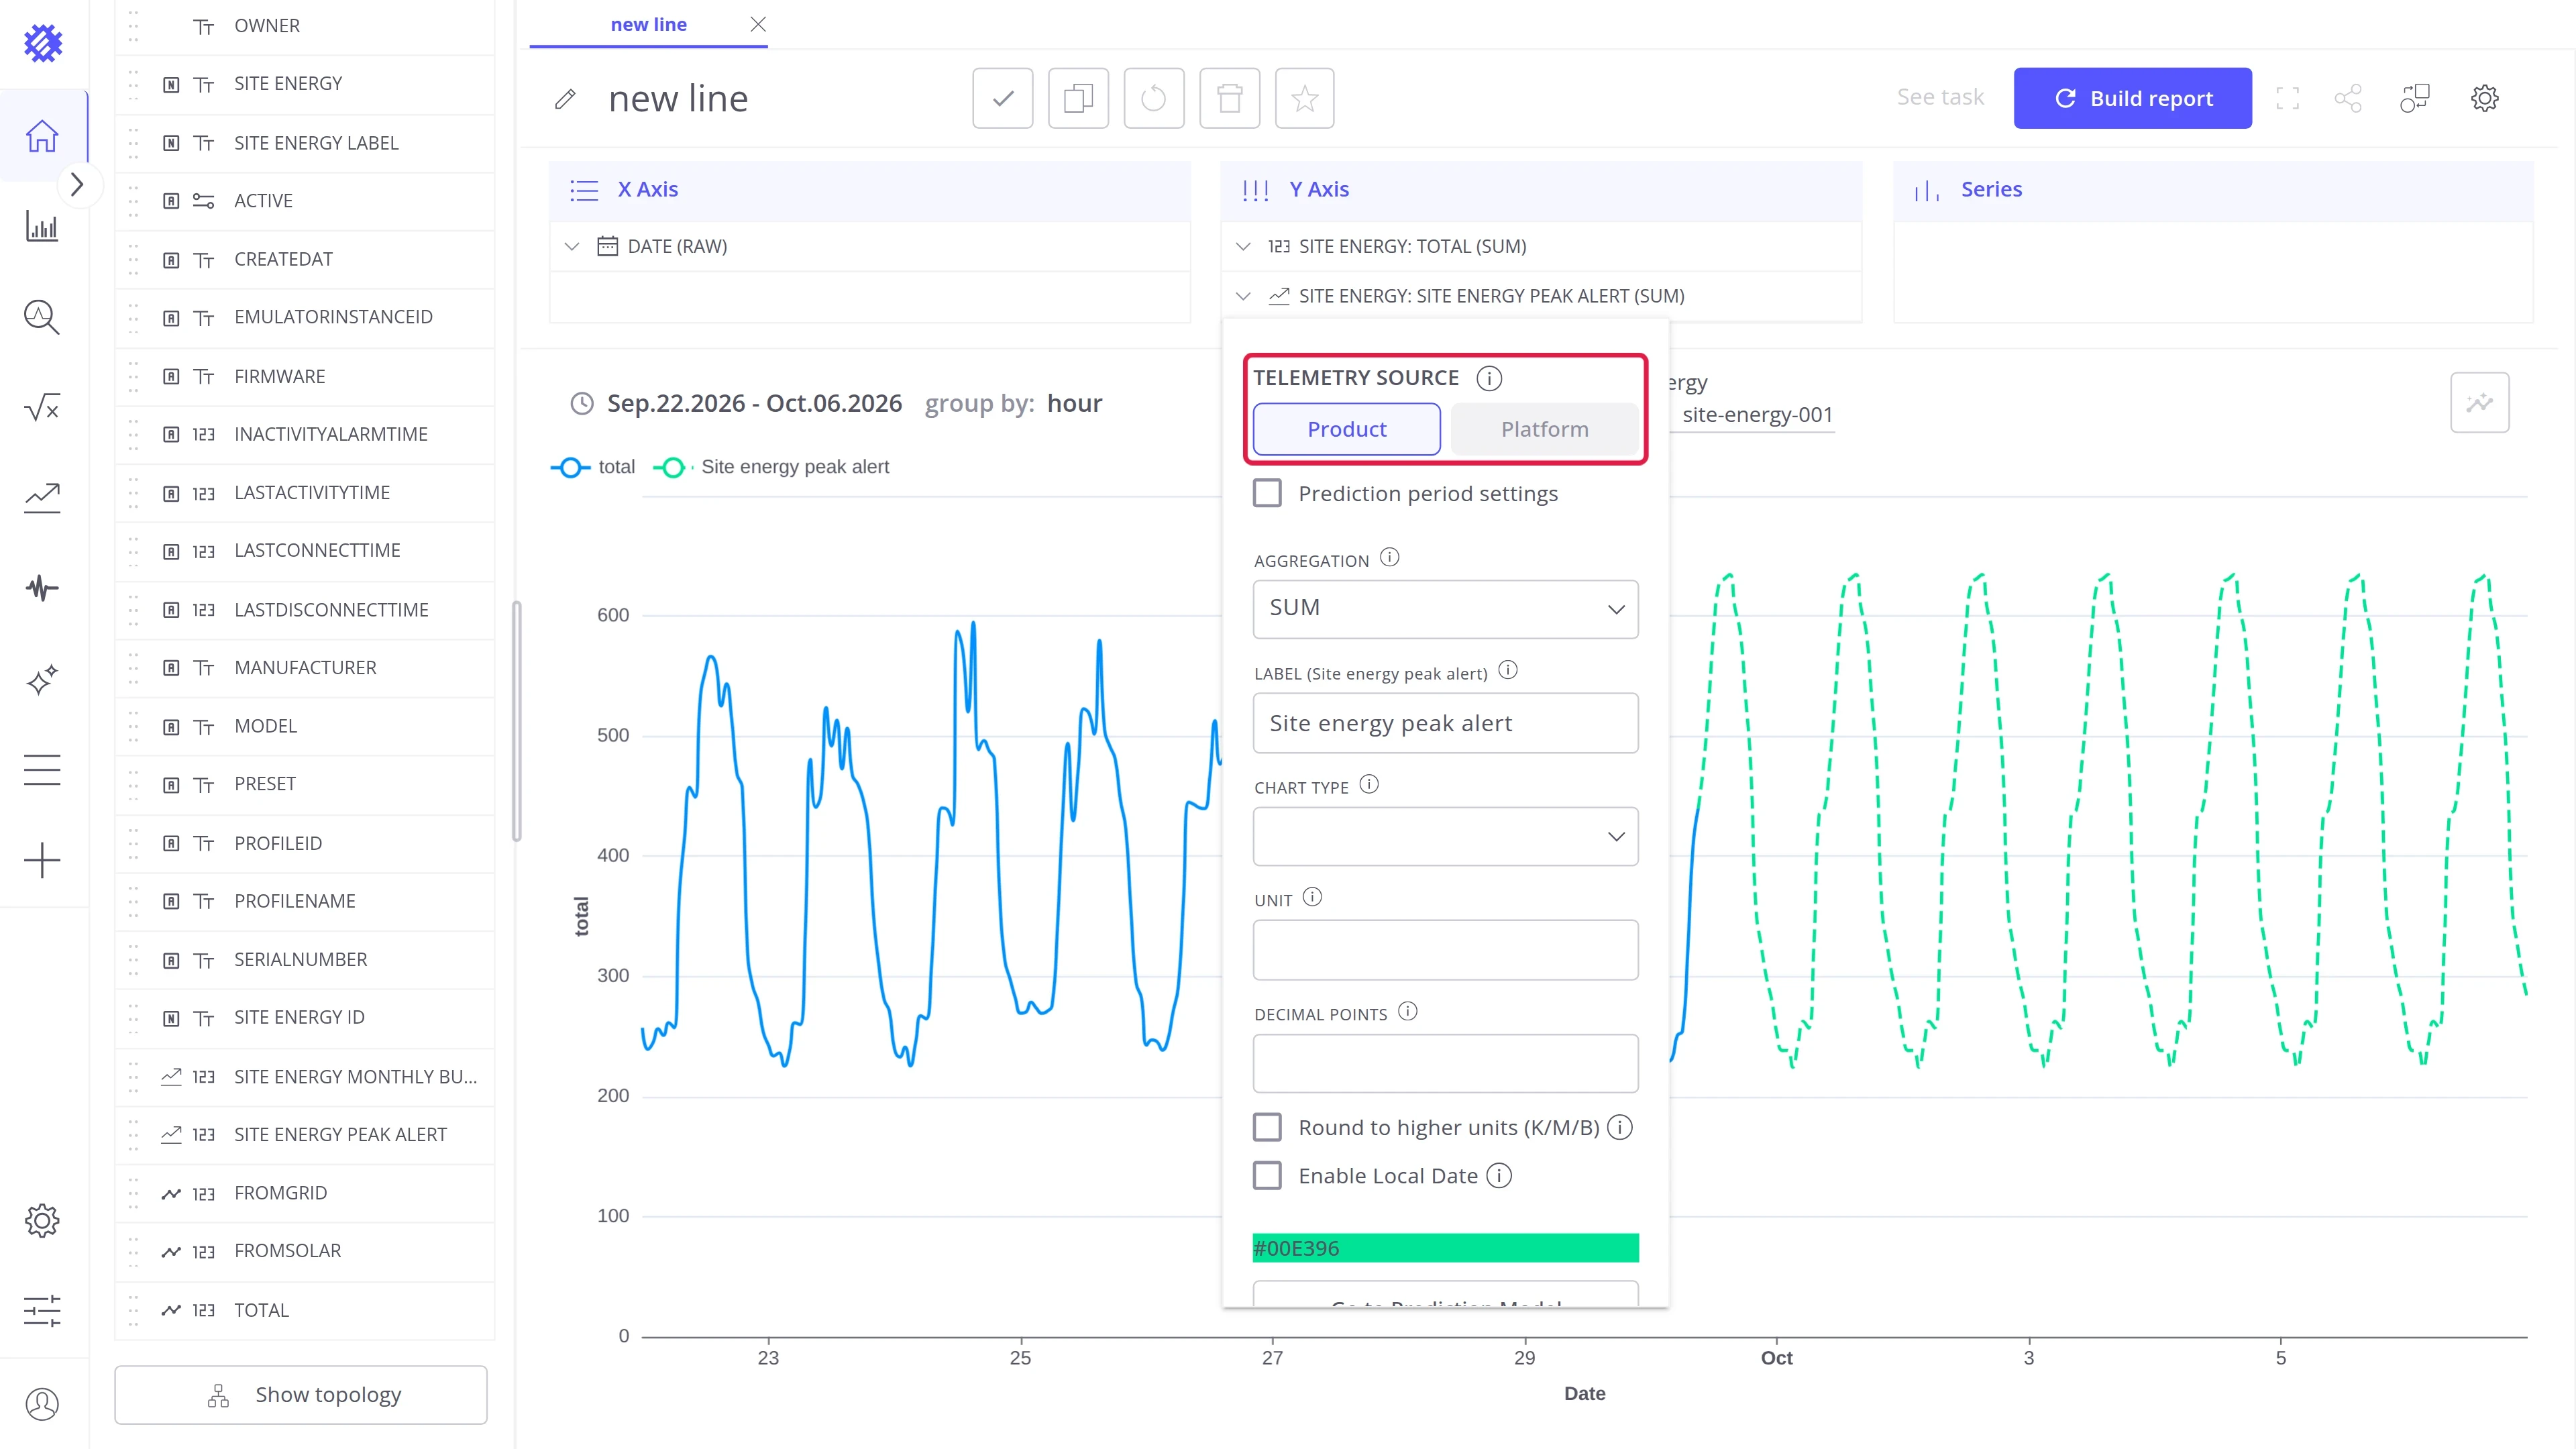
Section titled “Prediction field settings”Click the model field on Y Axis to open its settings. Telemetry source chooses where the forecast is read from:
- Product: the forecast stored in Trendz.
- Platform: the forecast saved to ThingsBoard. It needs Save telemetry on the model.
Where to go next
Section titled “Where to go next”Explore intents
Section titled “Explore intents”-
Forecast
Predict the next values of a metric, like the energy of the next 7 days.
-
Time to Threshold
Predict when a metric crosses a limit, and raise an alarm before it happens.
-
Period Total
Predict the total, peak, or average of a period, such as the energy of this month.
-
Hit Target
Predict whether a goal is reached by the end of a period, and how far off it is.
Explore more
Section titled “Explore more”Was this helpful?