Time Series Data Aggregation
Time series data aggregation computes aggregated metrics over historical telemetry of the
current entity at fixed time intervals (hourly, daily, weekly, monthly, etc.) and stores the
results as new telemetry keys. For example, an energy meter can automatically generate
energyHourlySum, powerHourlyAvg, and powerHourlyMax at the end of each hour.
Unlike Related entities aggregation (which aggregates across multiple entities at the latest point), this type operates on historical windows of a single entity’s data — ideal for analytics, reporting, and long-term KPIs.
Use Time series data aggregation when you need to:
- Generate hourly/daily/weekly aggregates (e.g., hourly average temperature)
- Build KPIs from historical data (daily runtime, peak load, total consumption)
- Pre-aggregate metrics to reduce dashboard and API load
- Track near-real-time aggregates using intermediate results (e.g., “current hour average so far”)
- Handle delayed telemetry — the system recalculates affected intervals when late data arrives
Configuration
Section titled “Configuration”- Open the Data processing ⇾ Calculated fields page.
- Click the + Add calculated field ⇾ Create new calculated field in the top-right corner.
- In General, enter a title, specify the entity the field applies to, and select the Time series data aggregation type.
- Configure Arguments, Metrics, Aggregation interval, and Output.
- Click Add to save.
Arguments
Section titled “Arguments”This type reads historical telemetry from the current entity only — Latest telemetry is the only available argument type.
Click Add argument and fill in:
| Field | Description |
|---|---|
| Time series key | The telemetry key whose data will be aggregated (e.g., temperature, power) |
| Argument name | Variable name referenced by metrics |
Metrics
Section titled “Metrics”Each metric produces one output telemetry key per interval.
Click Add metric and configure:
| Field | Description |
|---|---|
| Metric name | Output key name (e.g., tempAvg, energyHourlySum) |
| Aggregation | Average, Min, Max, Sum, or Count |
| Argument name | The argument whose values are aggregated |
| Default value | Used when the interval contains no data |
You can create multiple metrics from the same argument (e.g., tempAvg, tempMin, tempMax).
Aggregation Interval
Section titled “Aggregation Interval”Defines how often aggregation runs and how time boundaries align.
| Setting | Options |
|---|---|
| Aggregate interval type | Hour, Day, Week (Mon–Sun), Week (Sun–Sat), Month, Quarter, Year, Custom |
| Time zone | Aligns boundaries for daily/weekly reports and region-specific KPIs |
Aggregation results are stored with the timestamp corresponding to the start of the aggregation interval (e.g., an hourly aggregate for 01:00–02:00 is stored with the 01:00 timestamp).
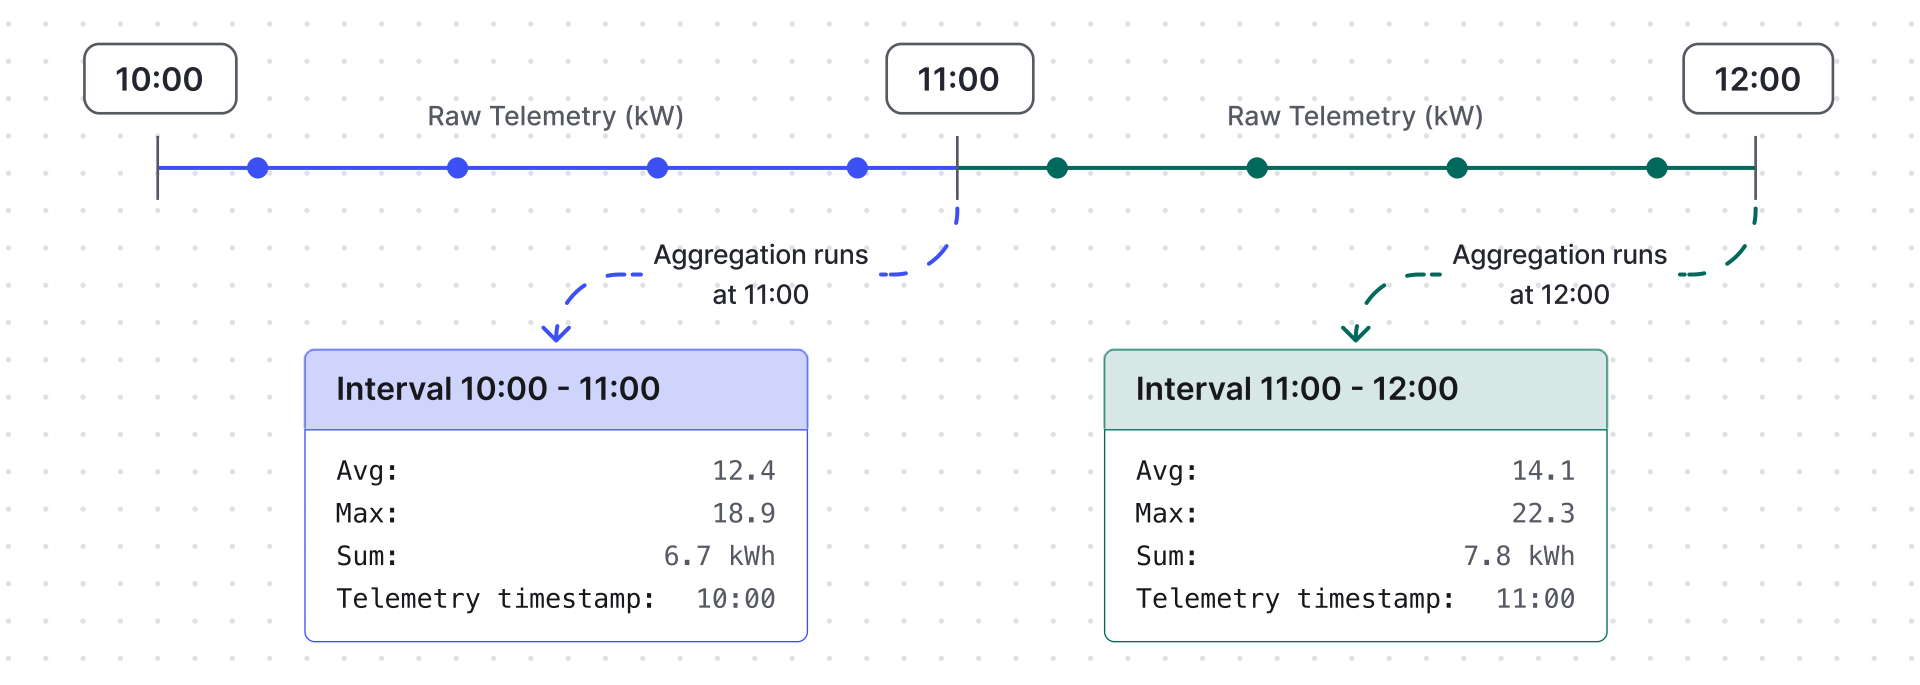
Advanced interval options:
| Option | Description |
|---|---|
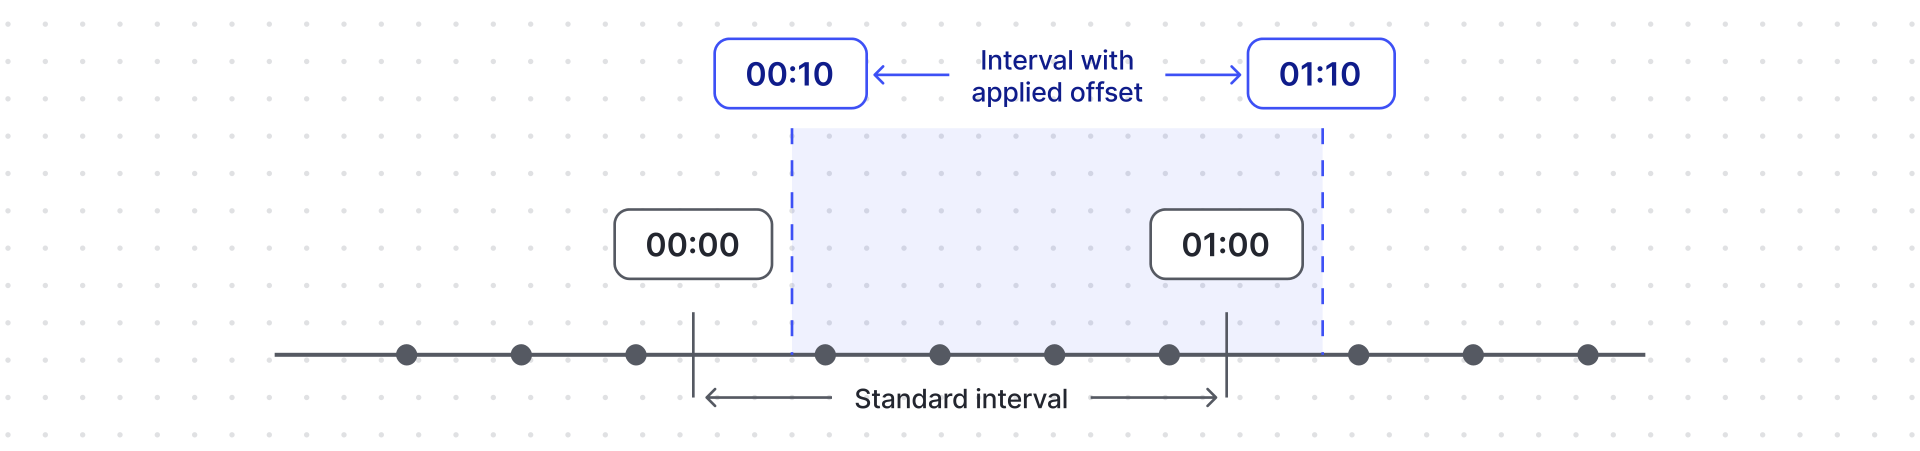
| Apply offset | Shifts interval start by a fixed offset (like +10 min → 00:10, 01:10, etc.). Useful when telemetry arrives slightly after boundaries. |
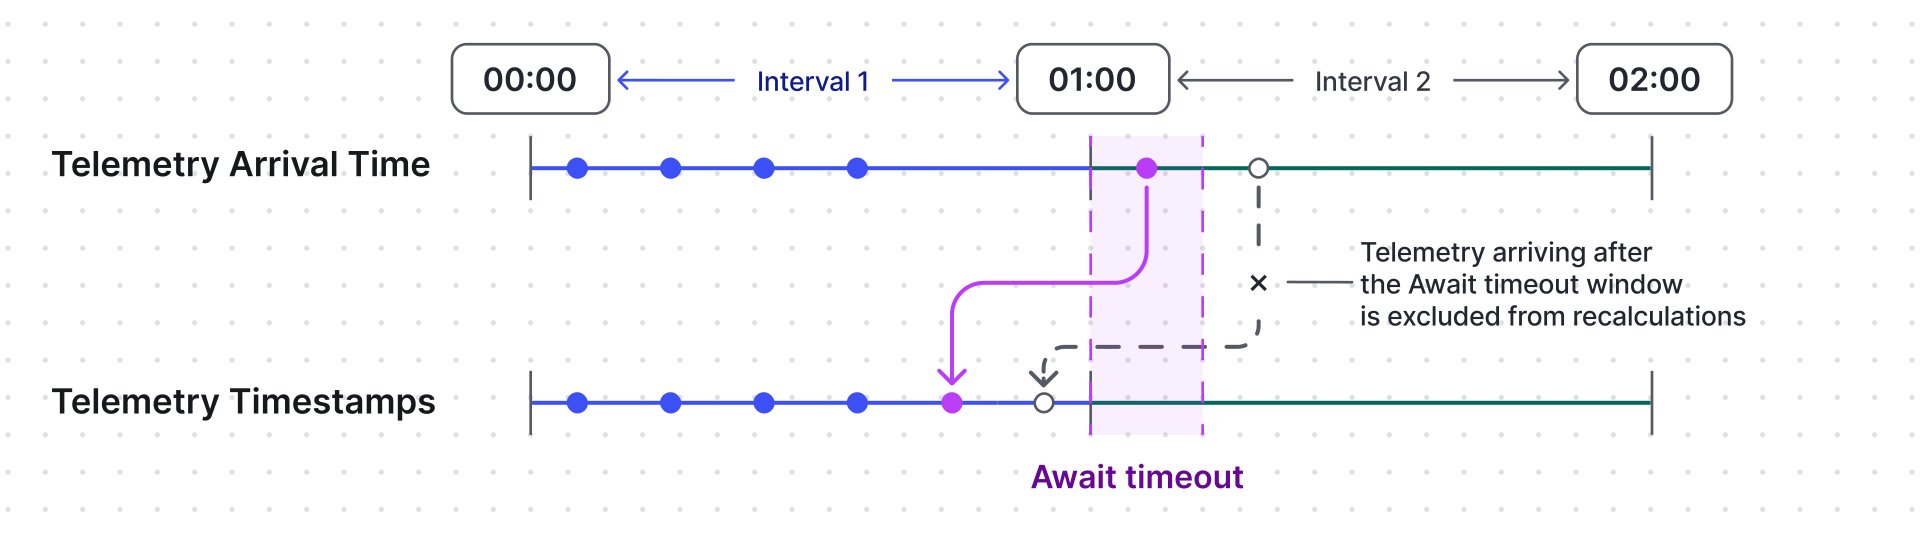
| Apply await timeout | How long the system waits for late telemetry after an interval ends. Late telemetry received within the await timeout triggers recalculation for accuracy. |
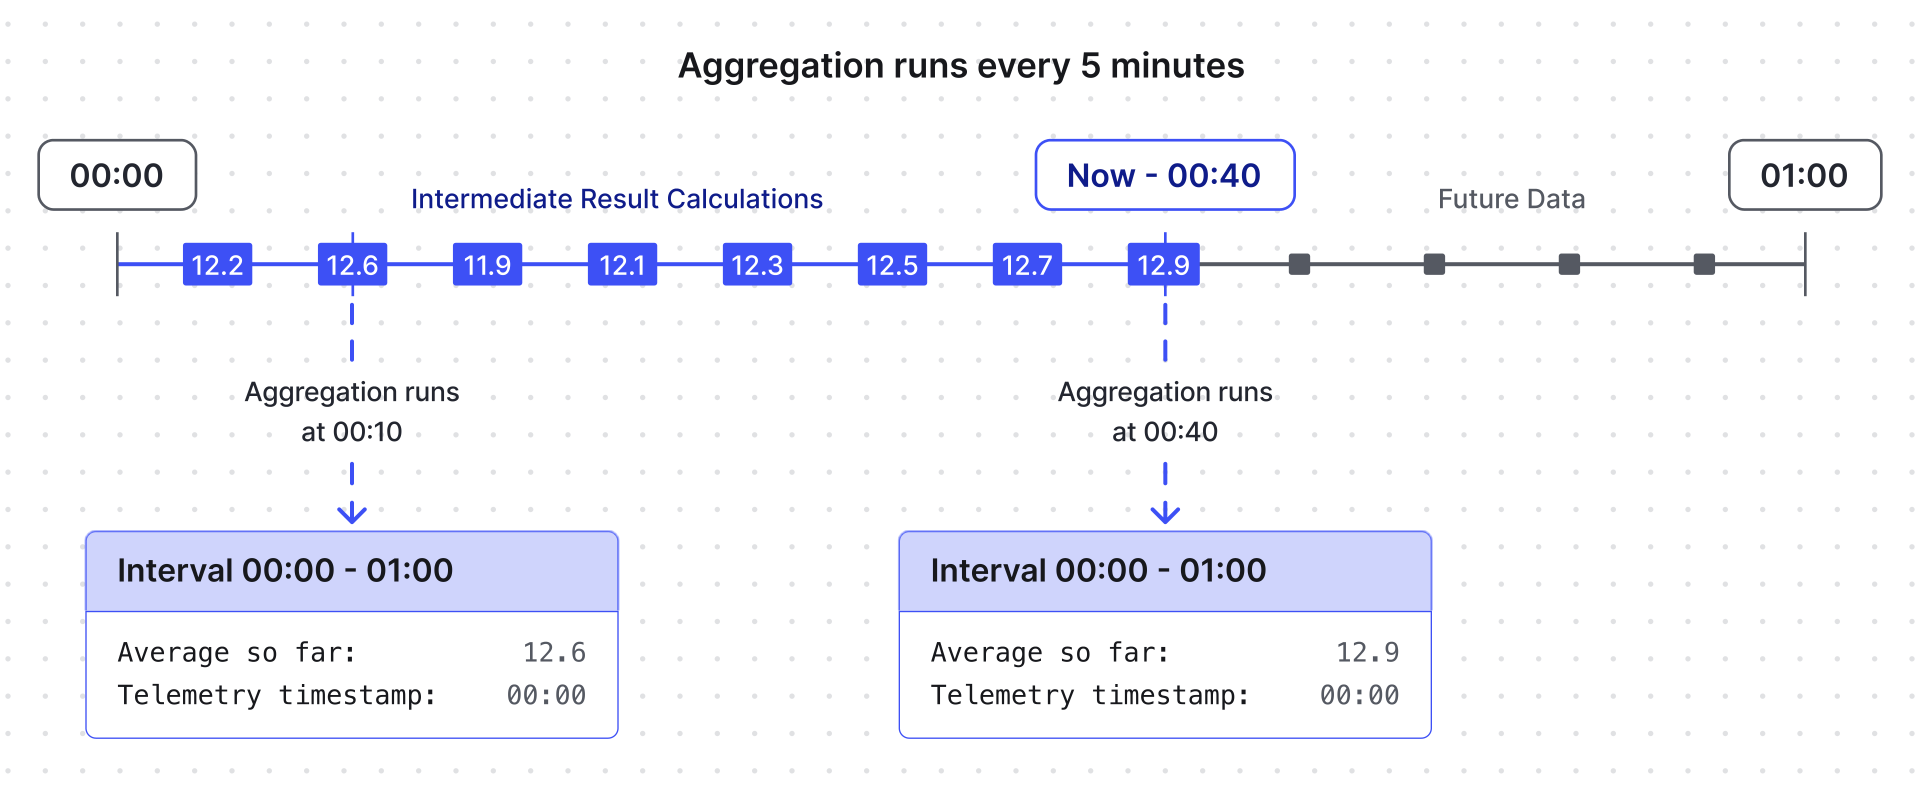
| Produce intermediate result | Calculates and stores aggregates for the current (unfinished) interval, updated at most every 5 minutes. Useful for dashboards showing “current hour so far”. |
Apply offset
Apply await timeout
Produce intermediate result
Output
Section titled “Output”Results are stored only as time series under the configured metric names.
For output strategy options, see Calculated Fields — Output Strategy.
Example: Hourly Energy KPIs
Section titled “Example: Hourly Energy KPIs”An Energy Meter 1 device publishes power (kW) and energy (kWh) telemetry continuously.
Goal: compute hourly KPIs and store them as new time series keys:
energyHourlySum— total energy consumption per hourpowerHourlyAvg— average power per hourpowerHourlyMax— maximum power per hour
- Apply the Time Series Data Aggregation calculated field to the Energy Meter 1 device profile.
- Add argument 1:
- Time series key:
energy - Argument name:
energy
- Time series key:
- Add argument 2:
- Time series key:
power - Argument name:
power
- Time series key:
- Add metric 1:
- Metric name:
energyHourlySum - Aggregation: Sum
- Argument name:
energy
- Metric name:
- Add metric 2:
- Metric name:
powerHourlyAvg - Aggregation: Average
- Argument name:
power
- Metric name:
- Add metric 3:
- Metric name:
powerHourlyMax - Aggregation: Max
- Argument name:
power
- Metric name:
- Aggregation interval: Hour. Time zone: your reporting time zone.
- Output type: Time series.
- Click Add.
Result: At the start of each hour, the device stores:
{ "powerHourlyAvg": 12.4, "powerHourlyMax": 18.9, "energyHourlySum": 6.7}These pre-aggregated metrics reduce dashboard load and serve as reporting-ready KPIs.
Was this helpful?