Lesson 1. Maps & Entity Tables
In this lesson, you will model a smart-building scenario — two buildings, two offices, and four IoT devices — then build a Buildings dashboard with an OpenStreet Map widget and an Entities table widget.
Step 1.1 Import Assets
Section titled “Step 1.1 Import Assets”Assets represent real-world objects such as buildings and office spaces.
In this step, create four assets: Building A, Building B, Office A, and Office B.
Each asset should also include attributes such as building coordinates, address, floor information, office phone number, and other relevant details that will be used in the next step.
You can create each asset manually or import multiple assets at once using bulk provisioning feature. After import, all buildings and offices will have the required attribute data.
Import Buildings
Section titled “Import Buildings”- Download building-assets.csv
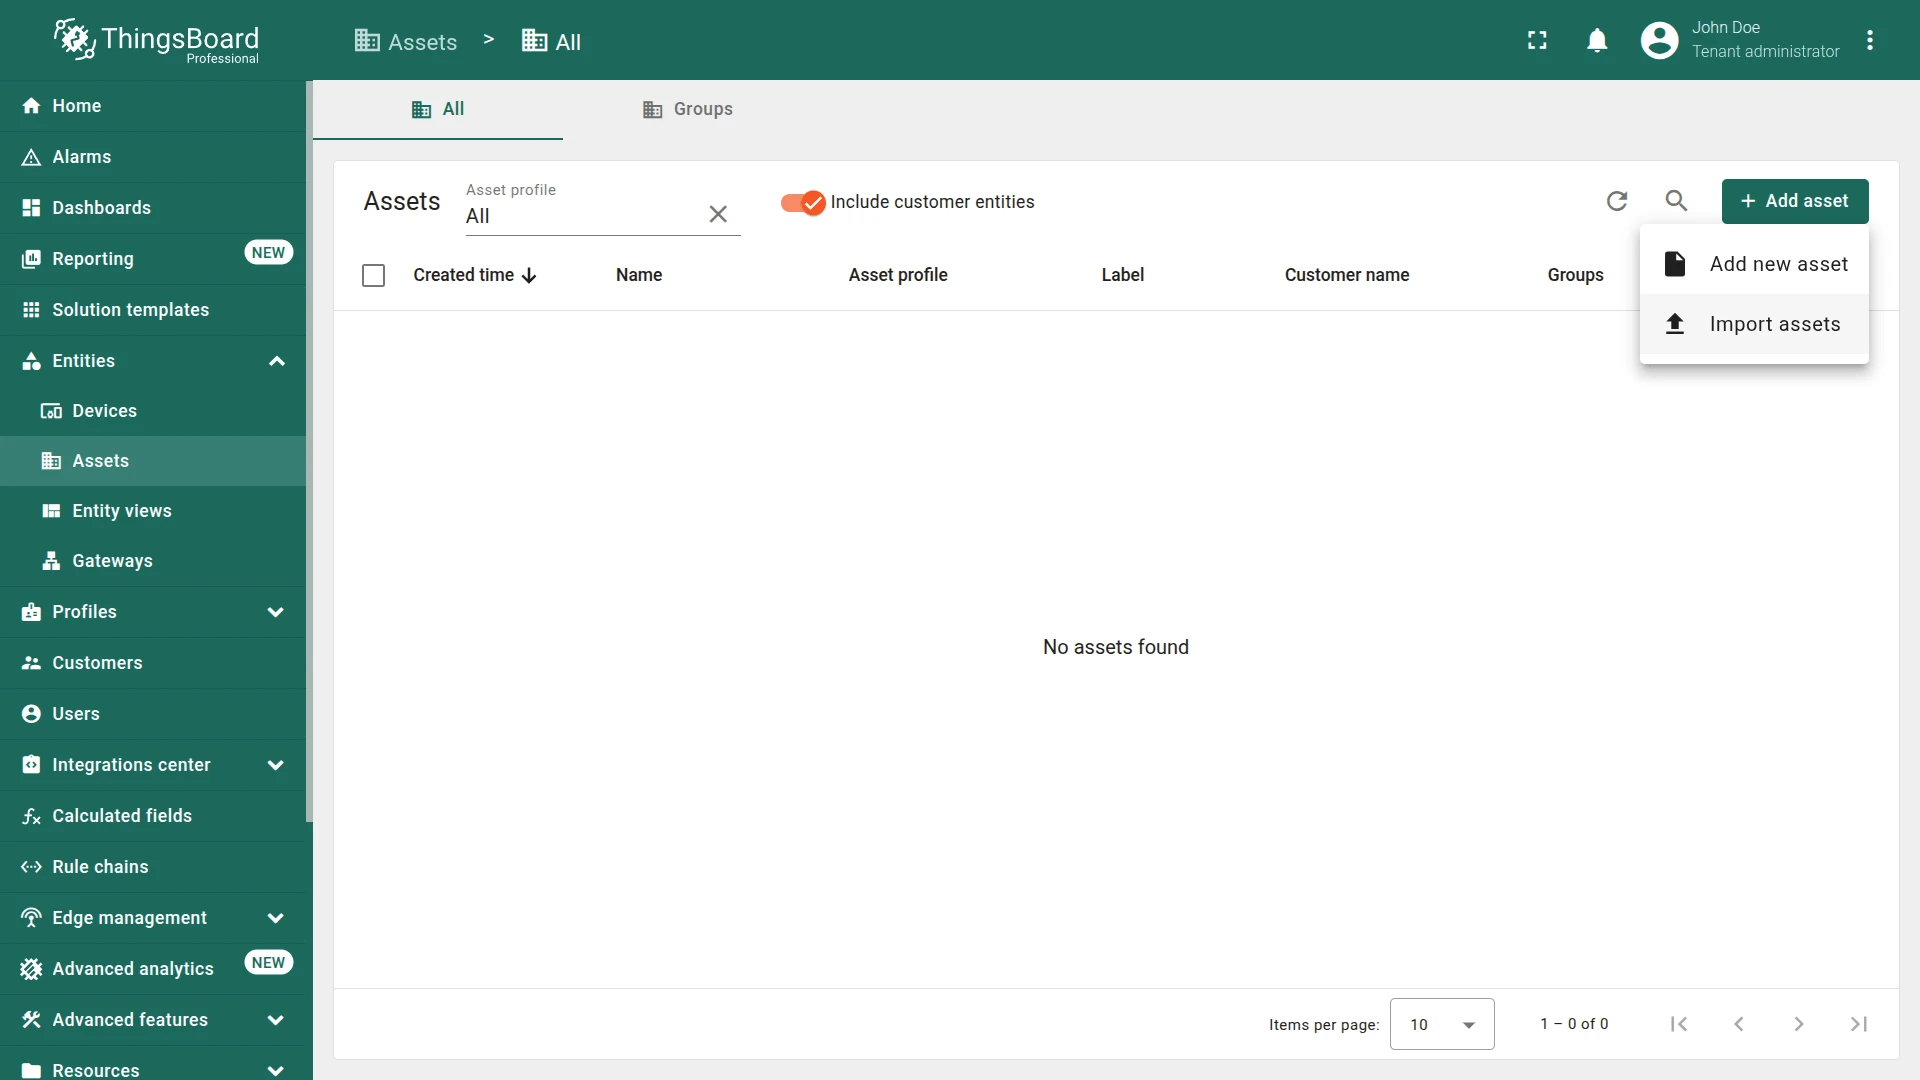
- Go to Entities ⇾ Assets.
- Click + Add asset ⇾ Import asset.
- Drag the
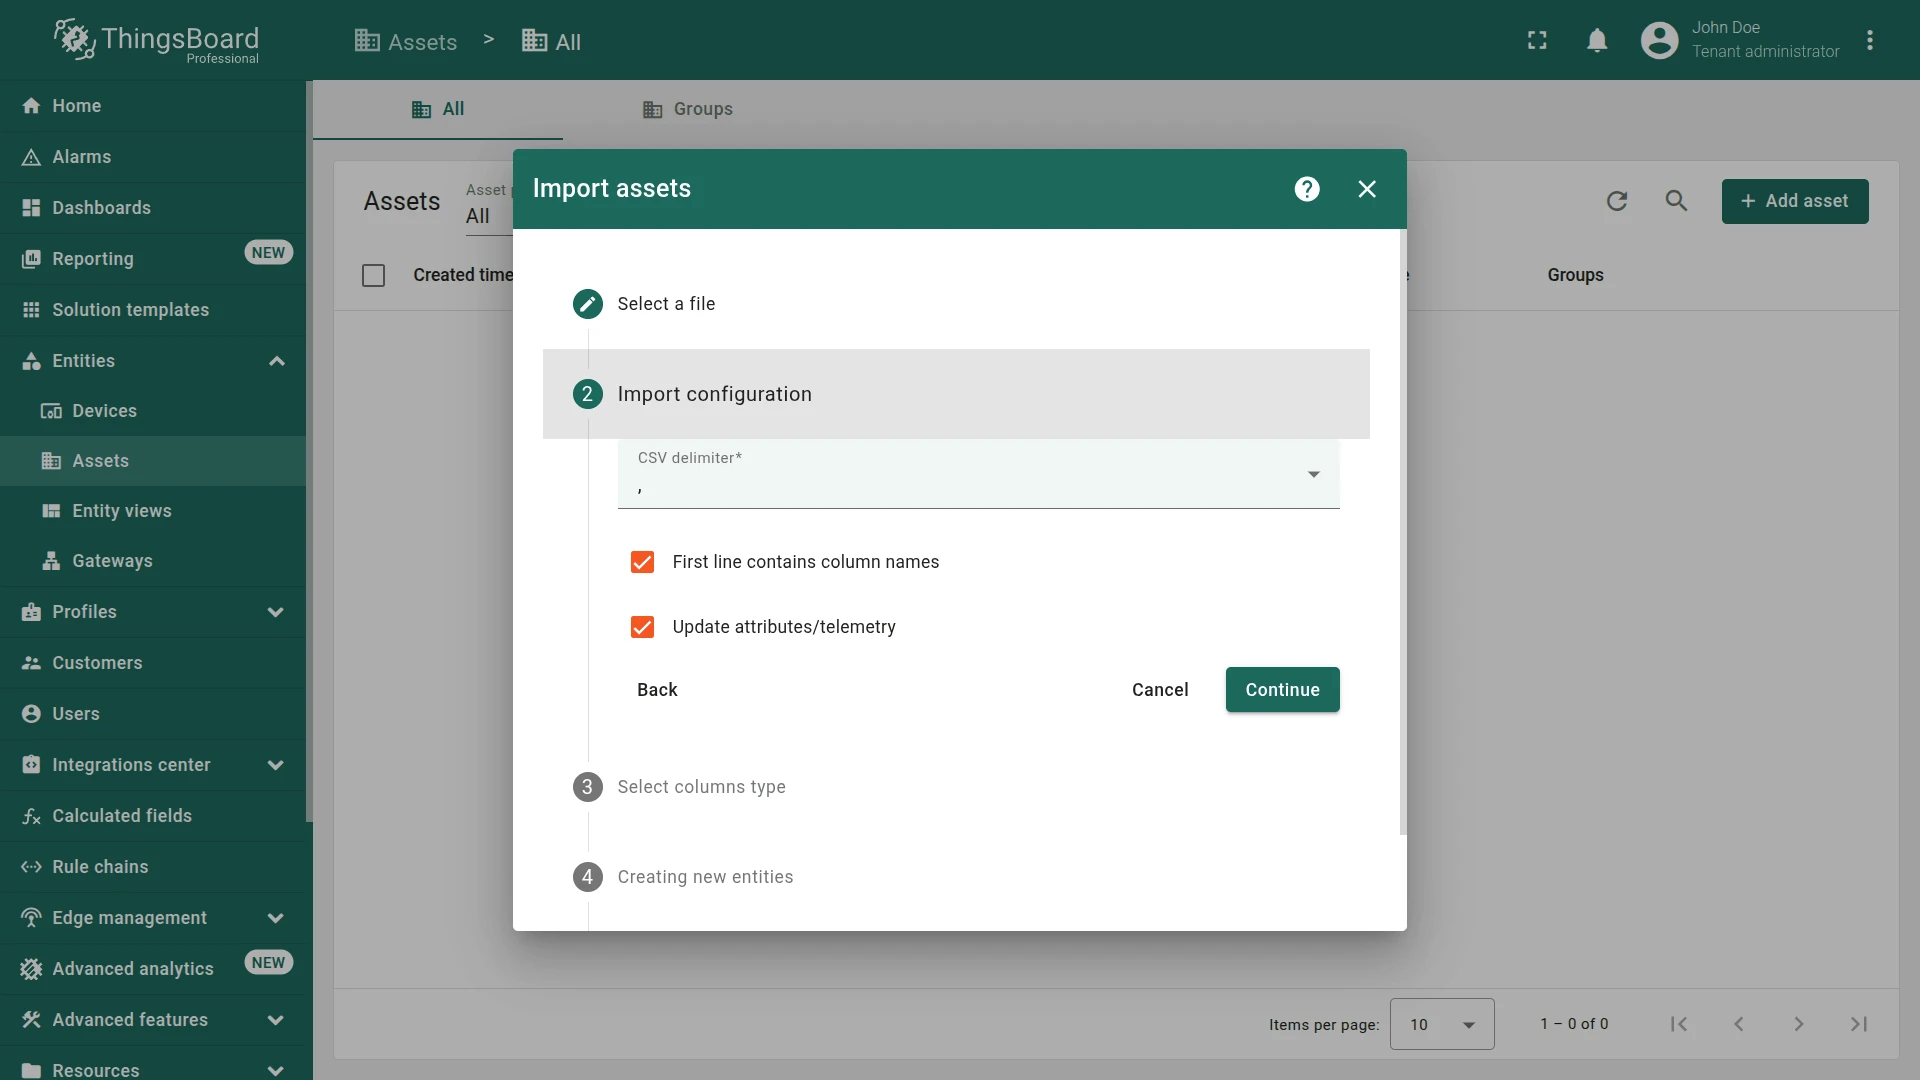
building-assets.csvfile into the import window and click Continue. - Verify the delimiter
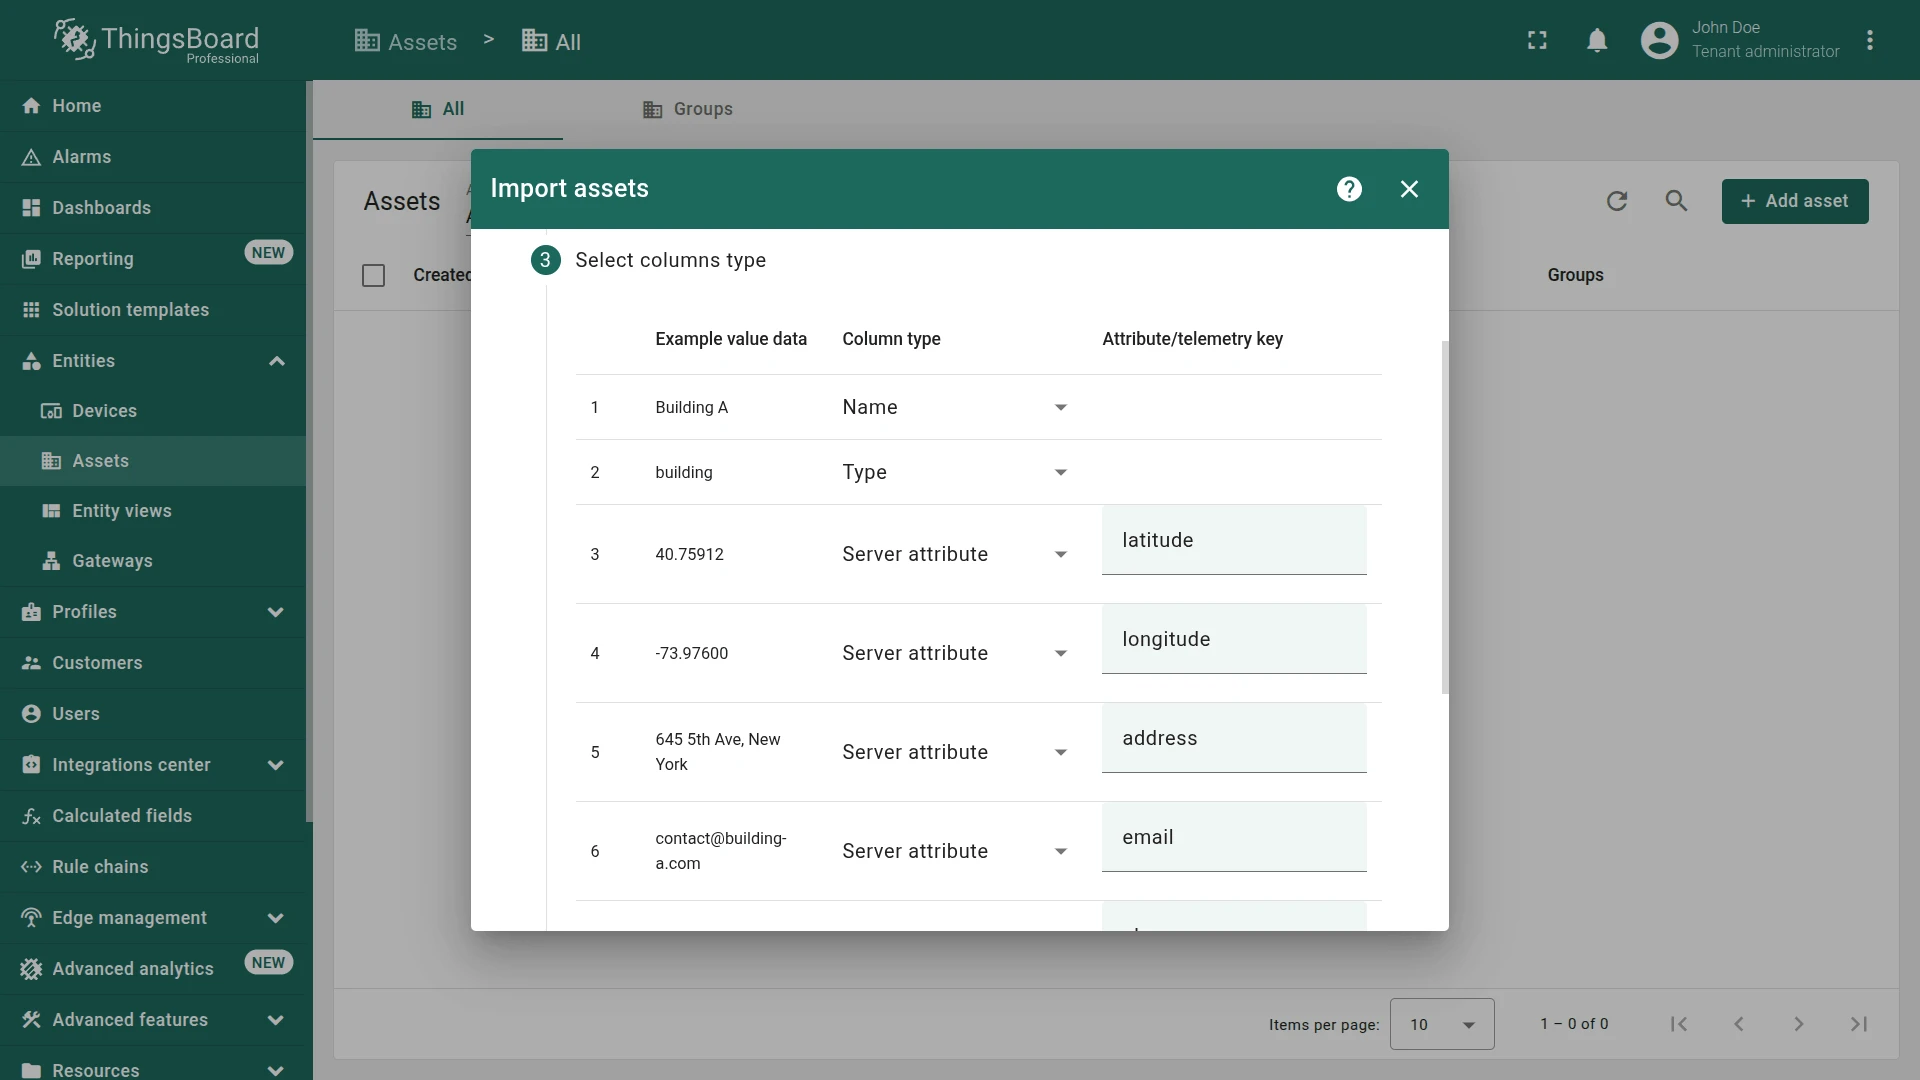
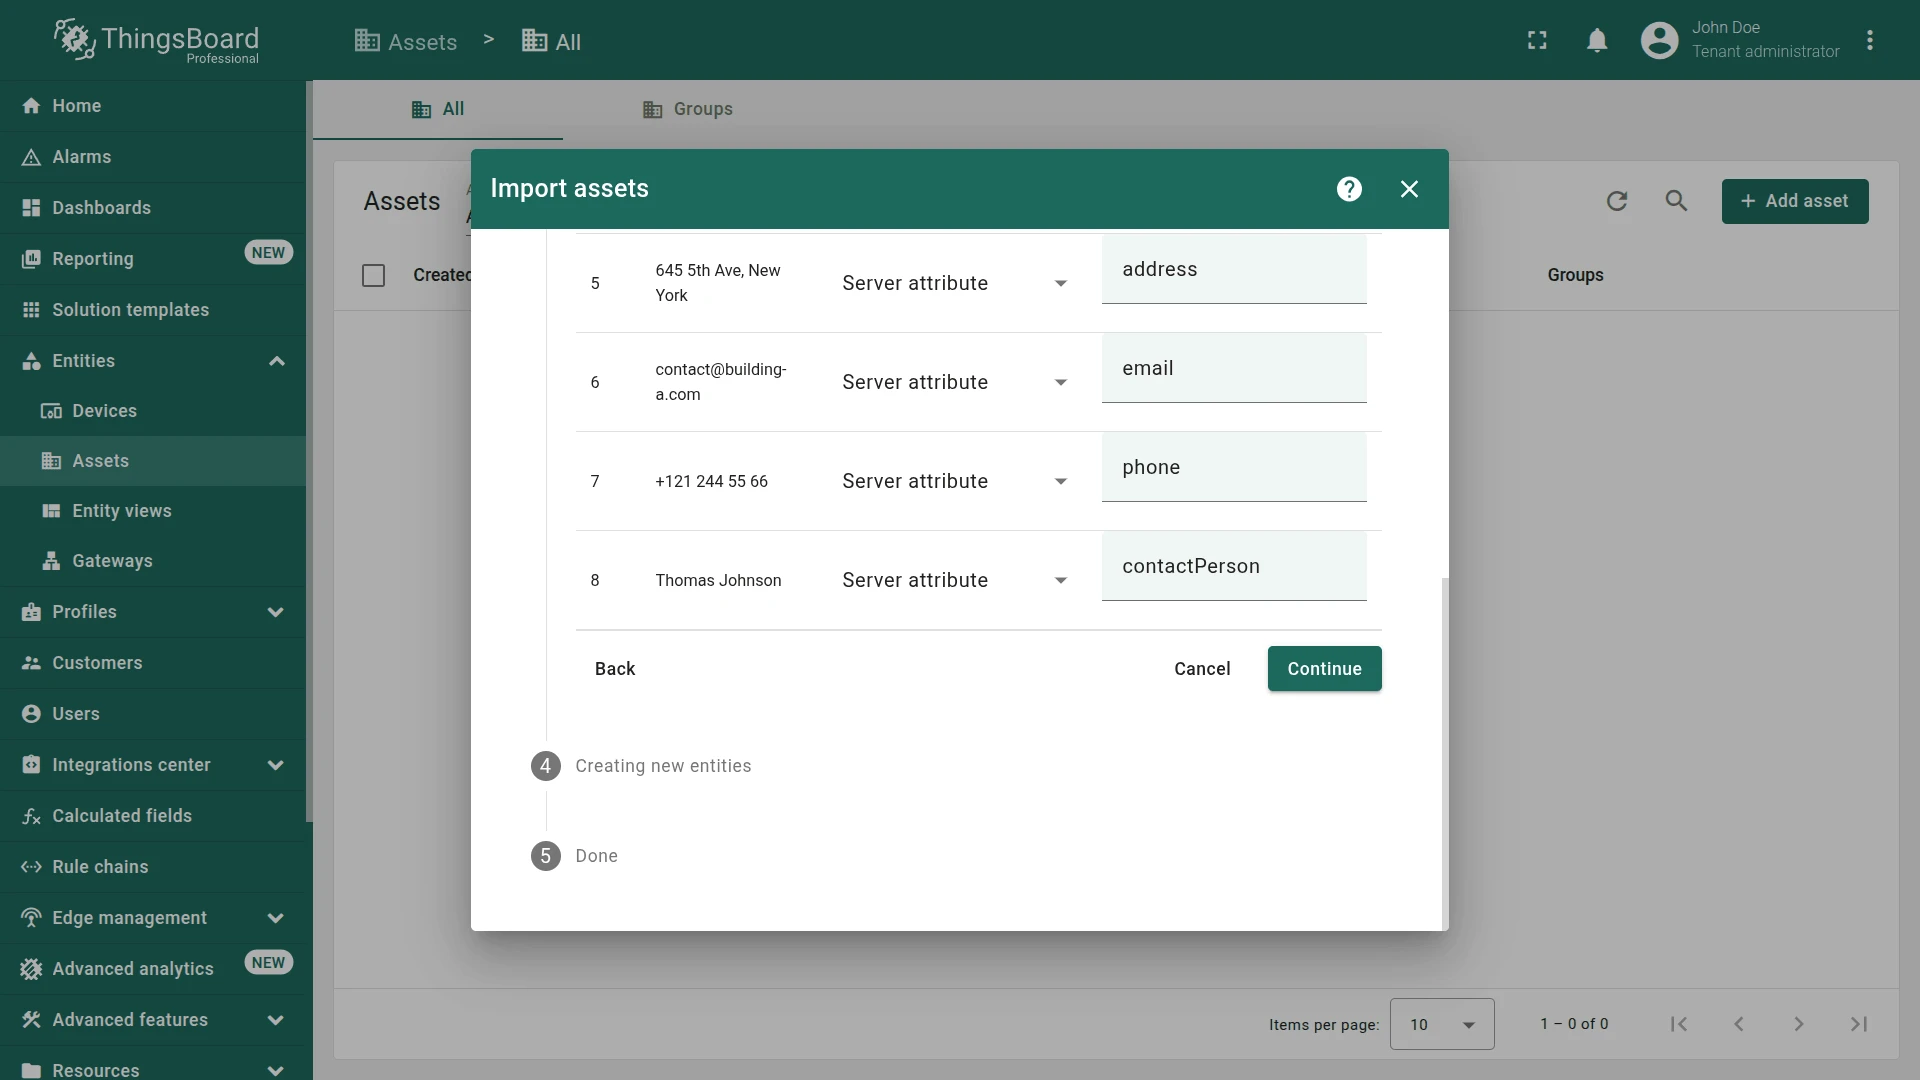
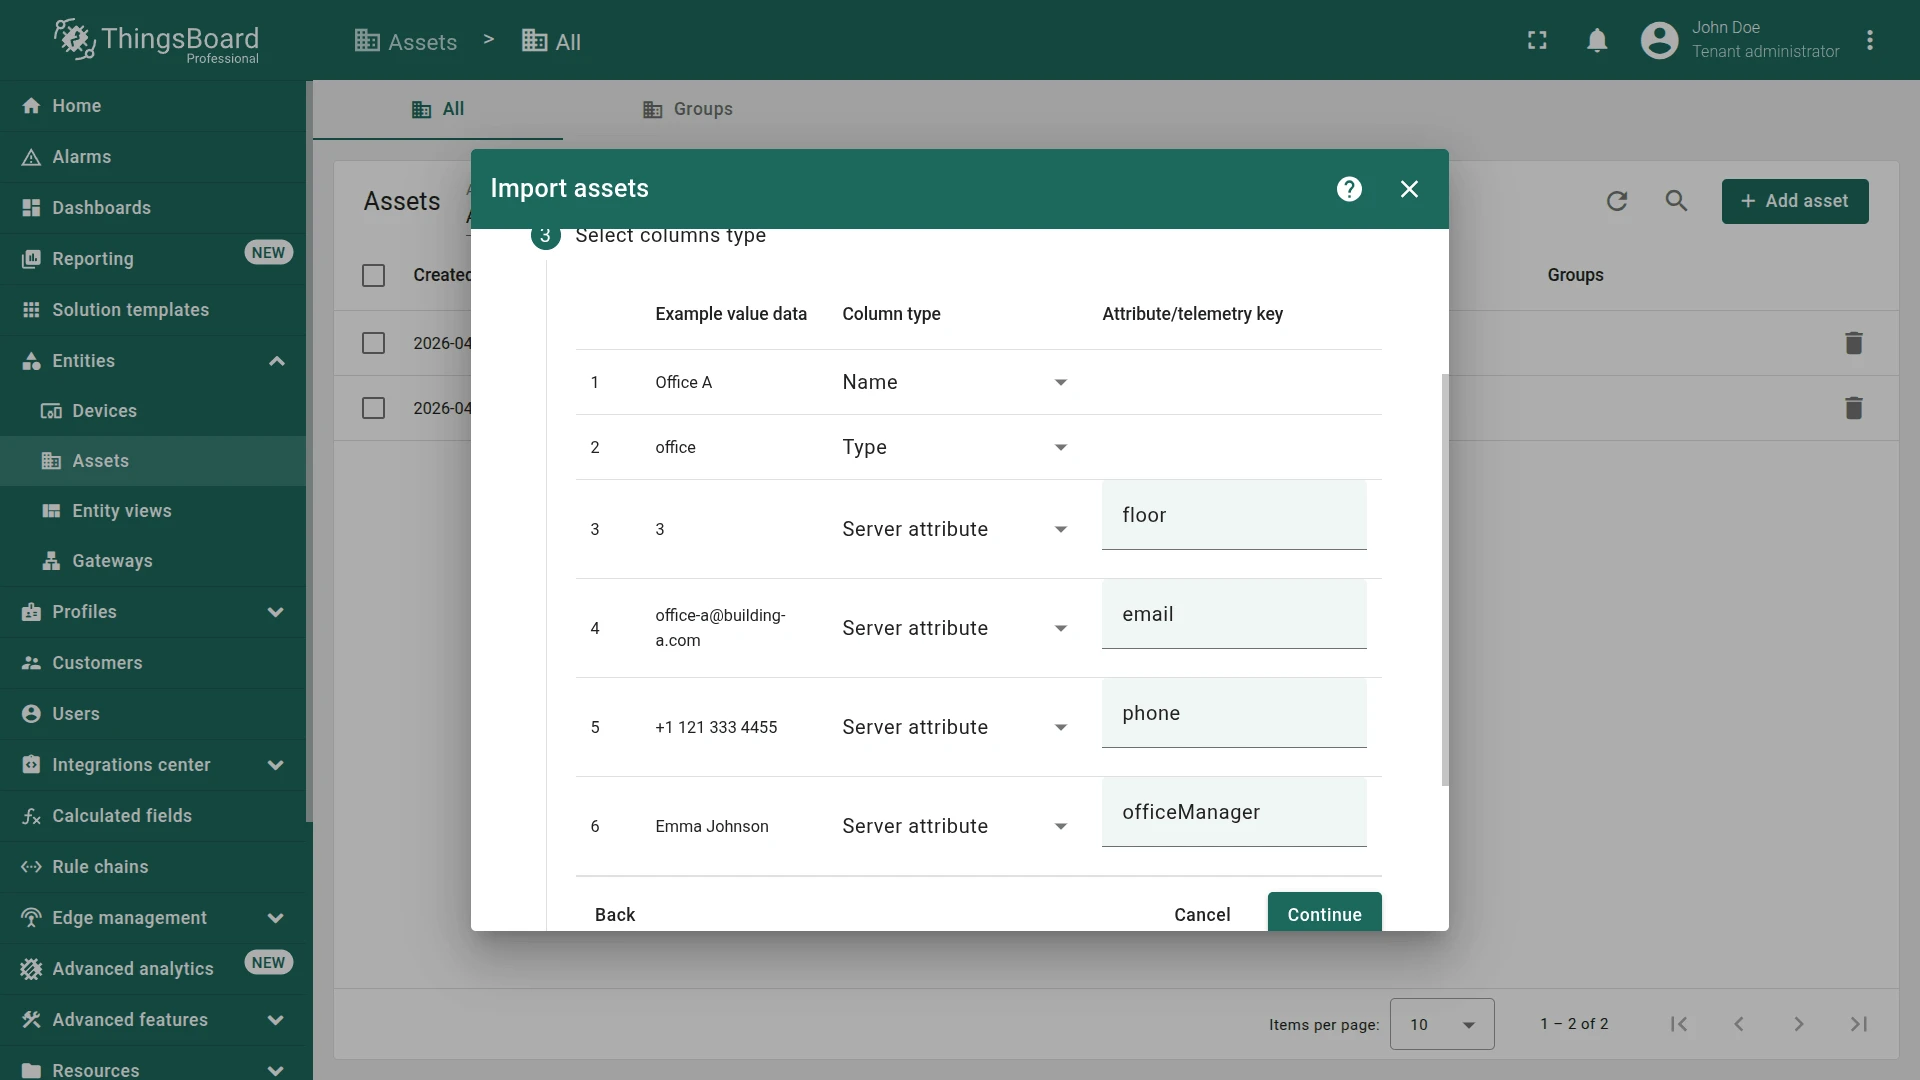
,, then click Continue. - Map the data between the uploaded file columns and the ThingsBoard data types using the table below.
- Click Continue, then OK.
| Key | Column type | Building A | Building B |
|---|---|---|---|
name | Name | Building A | Building B |
type | Type | building | building |
latitude | Server attribute | 40.75912 | 40.75901 |
longitude | Server attribute | -73.97600 | -73.96997 |
address | Server attribute | 645 5th Ave, New York | 641 Lexington Ave, New York |
email | Server attribute | contact@building-a.com | contact@building-b.com |
phone | Server attribute | +121 244 55 66 | +121 555 66 77 |
contactPerson | Server attribute | Thomas Johnson | Jack Williams |


Check the import result.


Import Offices
Section titled “Import Offices”- Download office-assets.csv
- Click + Add asset ⇾ Import asset.
- Drag the
office-assets.csvfile into the import window and click Continue. - Verify the delimiter
,, then click Continue. - Map the data between the uploaded file columns and the ThingsBoard data types using the table below.
- Click Continue, then OK.
| Key | Column type | Office A | Office B |
|---|---|---|---|
name | Name | Office A | Office B |
type | Type | office | office |
floor | Server attribute | 3 | 4 |
email | Server attribute | office-a@building-a.com | office-b@building-a.com |
phone | Server attribute | +1 121 333 4455 | +1 121 666 5522 |
officeManager | Server attribute | Emma Johnson | contact@building-b.com |


Check the import result.


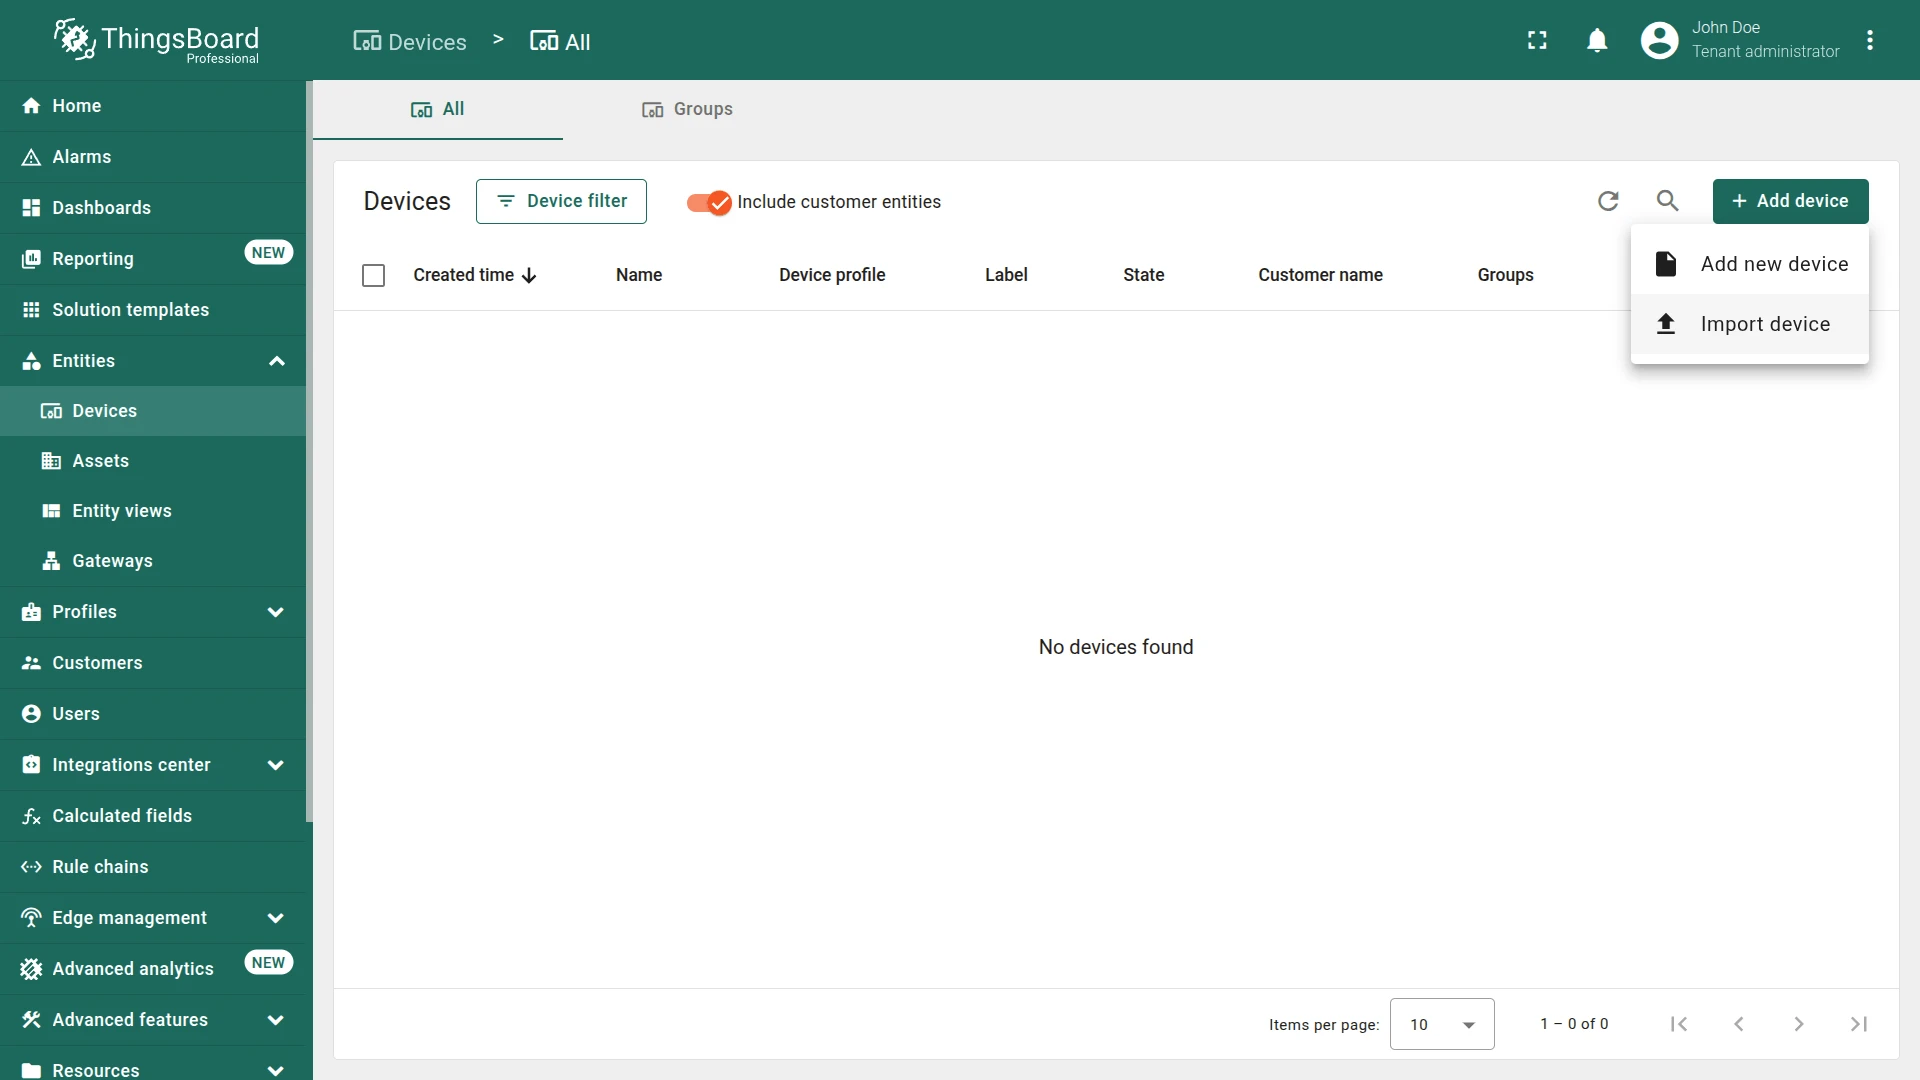
Step 1.2 Import Devices
Section titled “Step 1.2 Import Devices”Devices are IoT entities that collect data from their environment, send it to ThingsBoard, and respond to RPC commands.
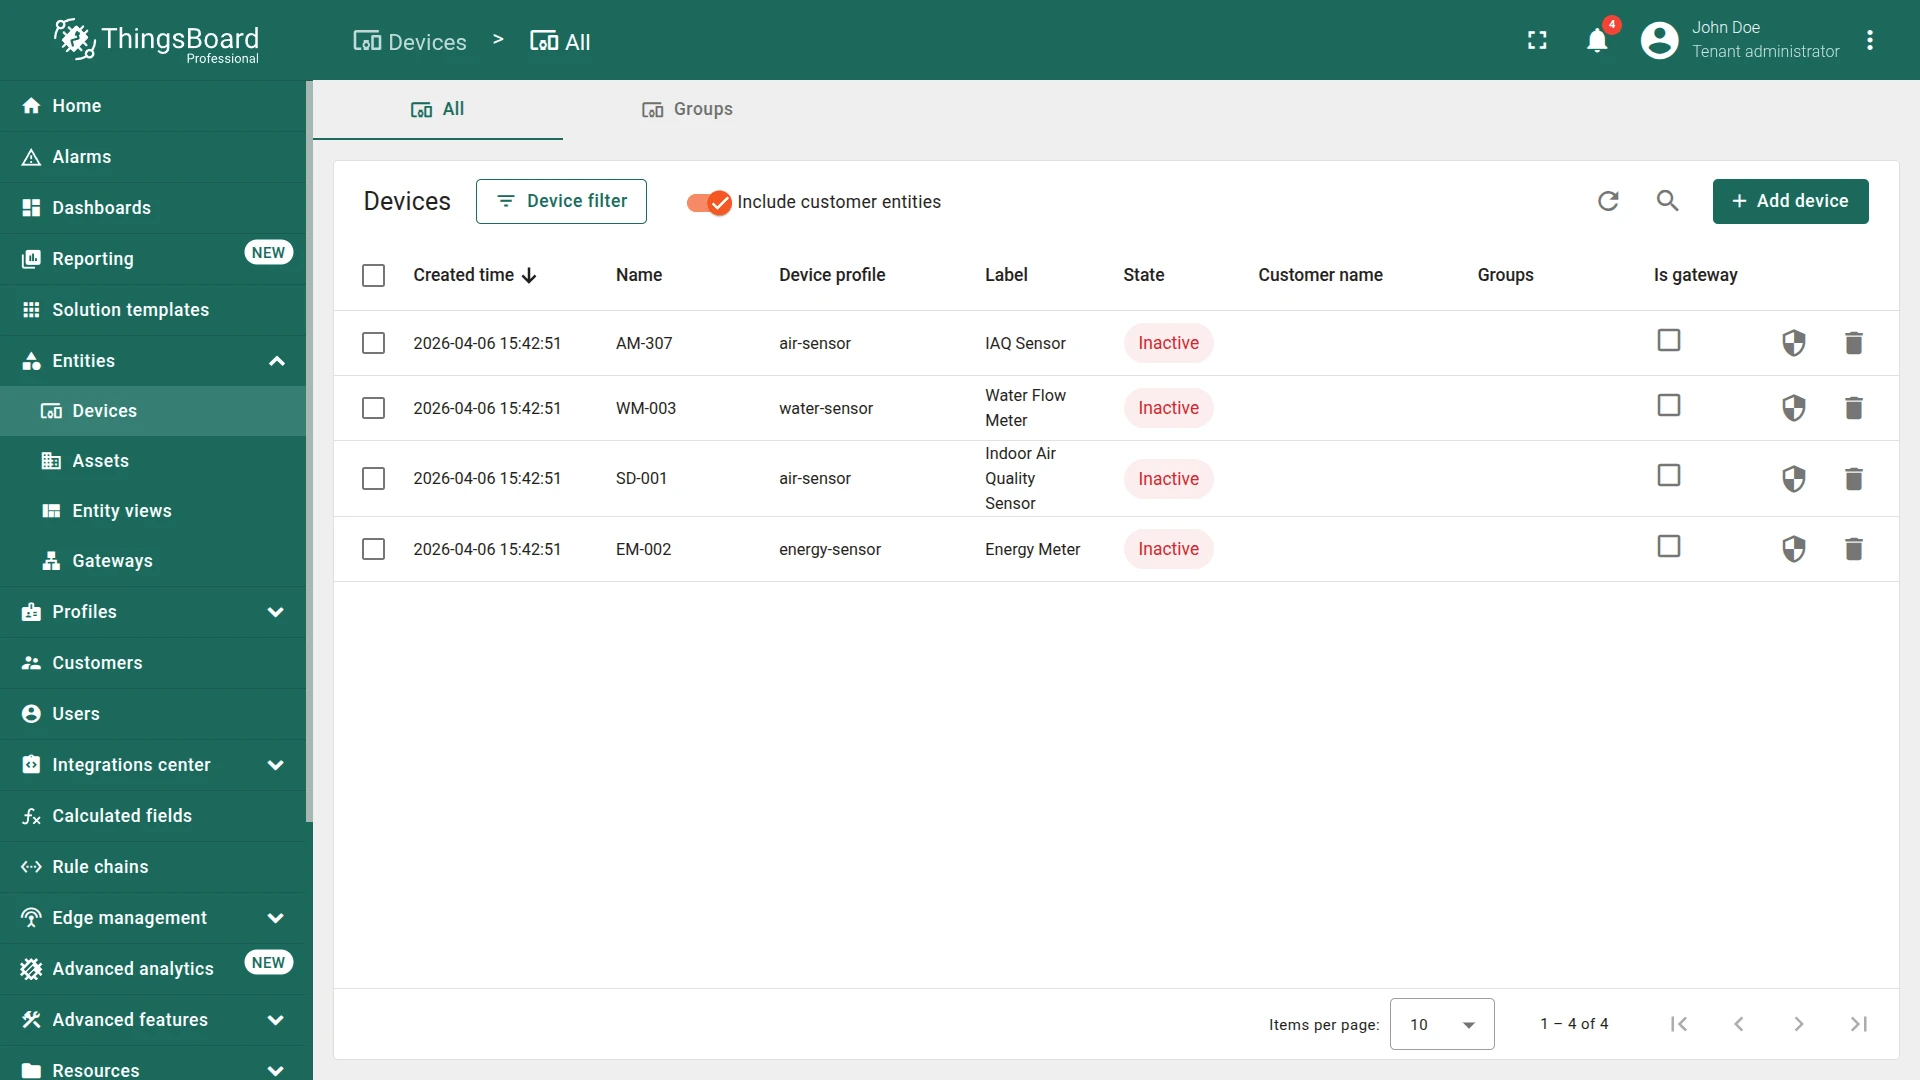
Create four devices—an indoor air quality sensor, an energy meter, a water flow meter, and another indoor air quality sensor—using the bulk provisioning feature as well. Each sensor has its own type and location coordinates, which will be used later to display them on the office map.
Save the following content as devices.csv:
name,type,label,xPos,yPosSD-001,air-sensor,Indoor Air Quality Sensor,0.51,0.68EM-002,energy-sensor,Energy Meter,0.14,0.95WM-003,water-sensor,Water Flow Meter,0.14,0.32AM-307,air-sensor,IAQ Sensor,0.49,0.38- Go to Entities ⇾ Devices.
- Click + Add device ⇾ Import device.
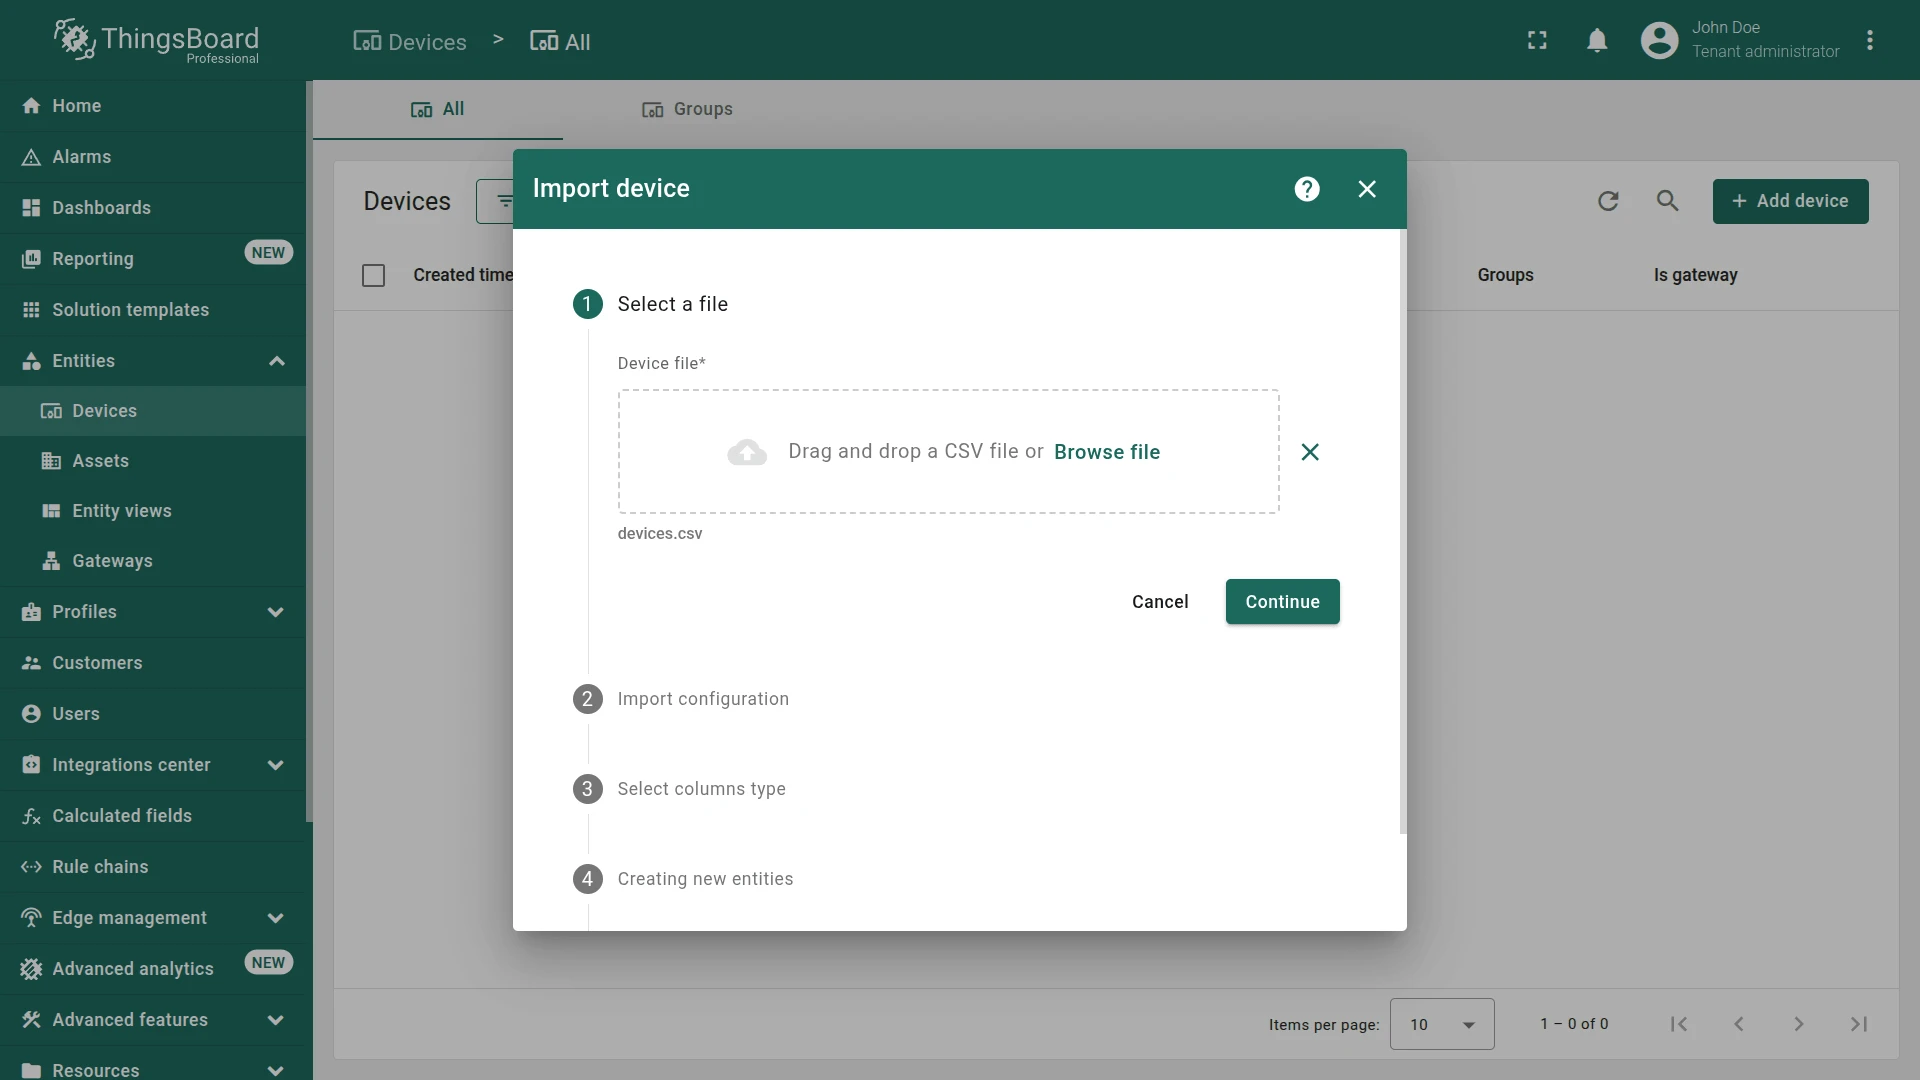
- Drag the
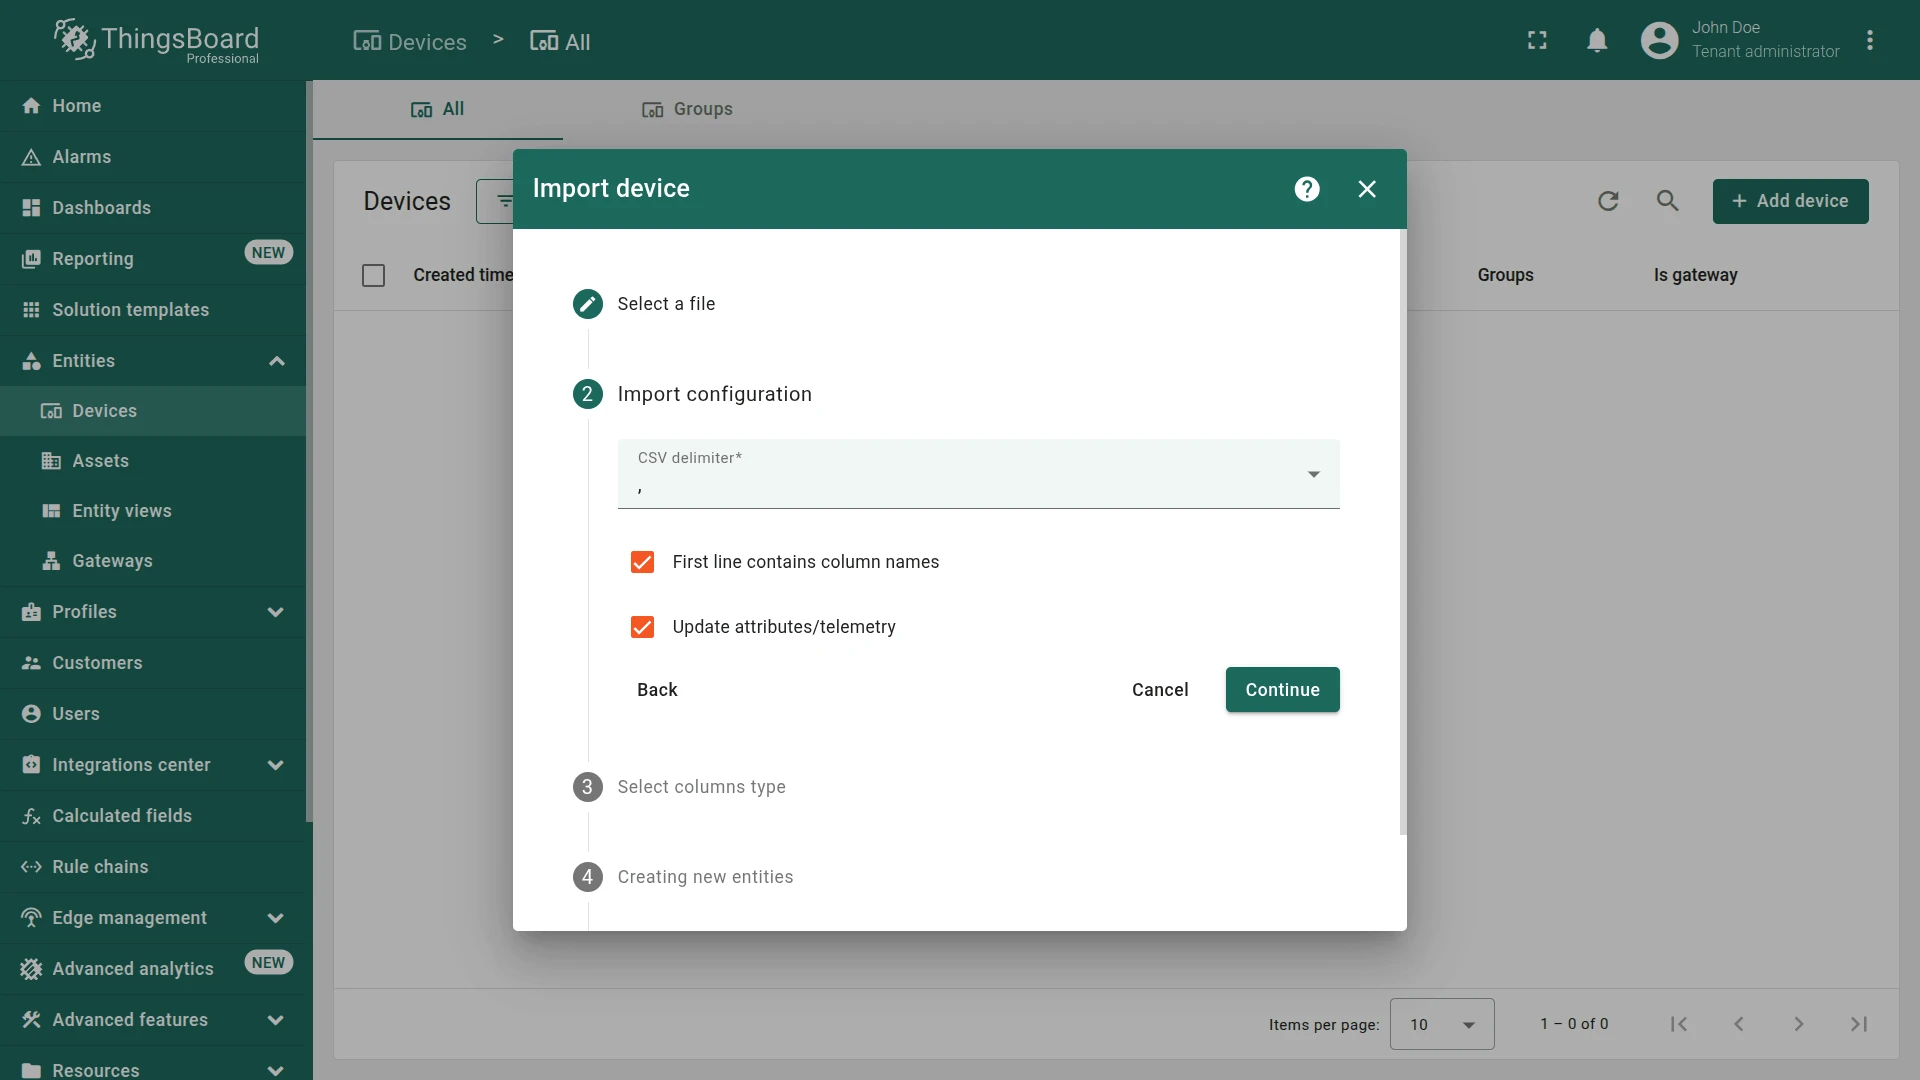
devices.csvfile into the import window and click Continue. - Verify the delimiter, then click Continue.
- Map columns: name ⇾ Name, type ⇾ Device Profile, label ⇾ Label.
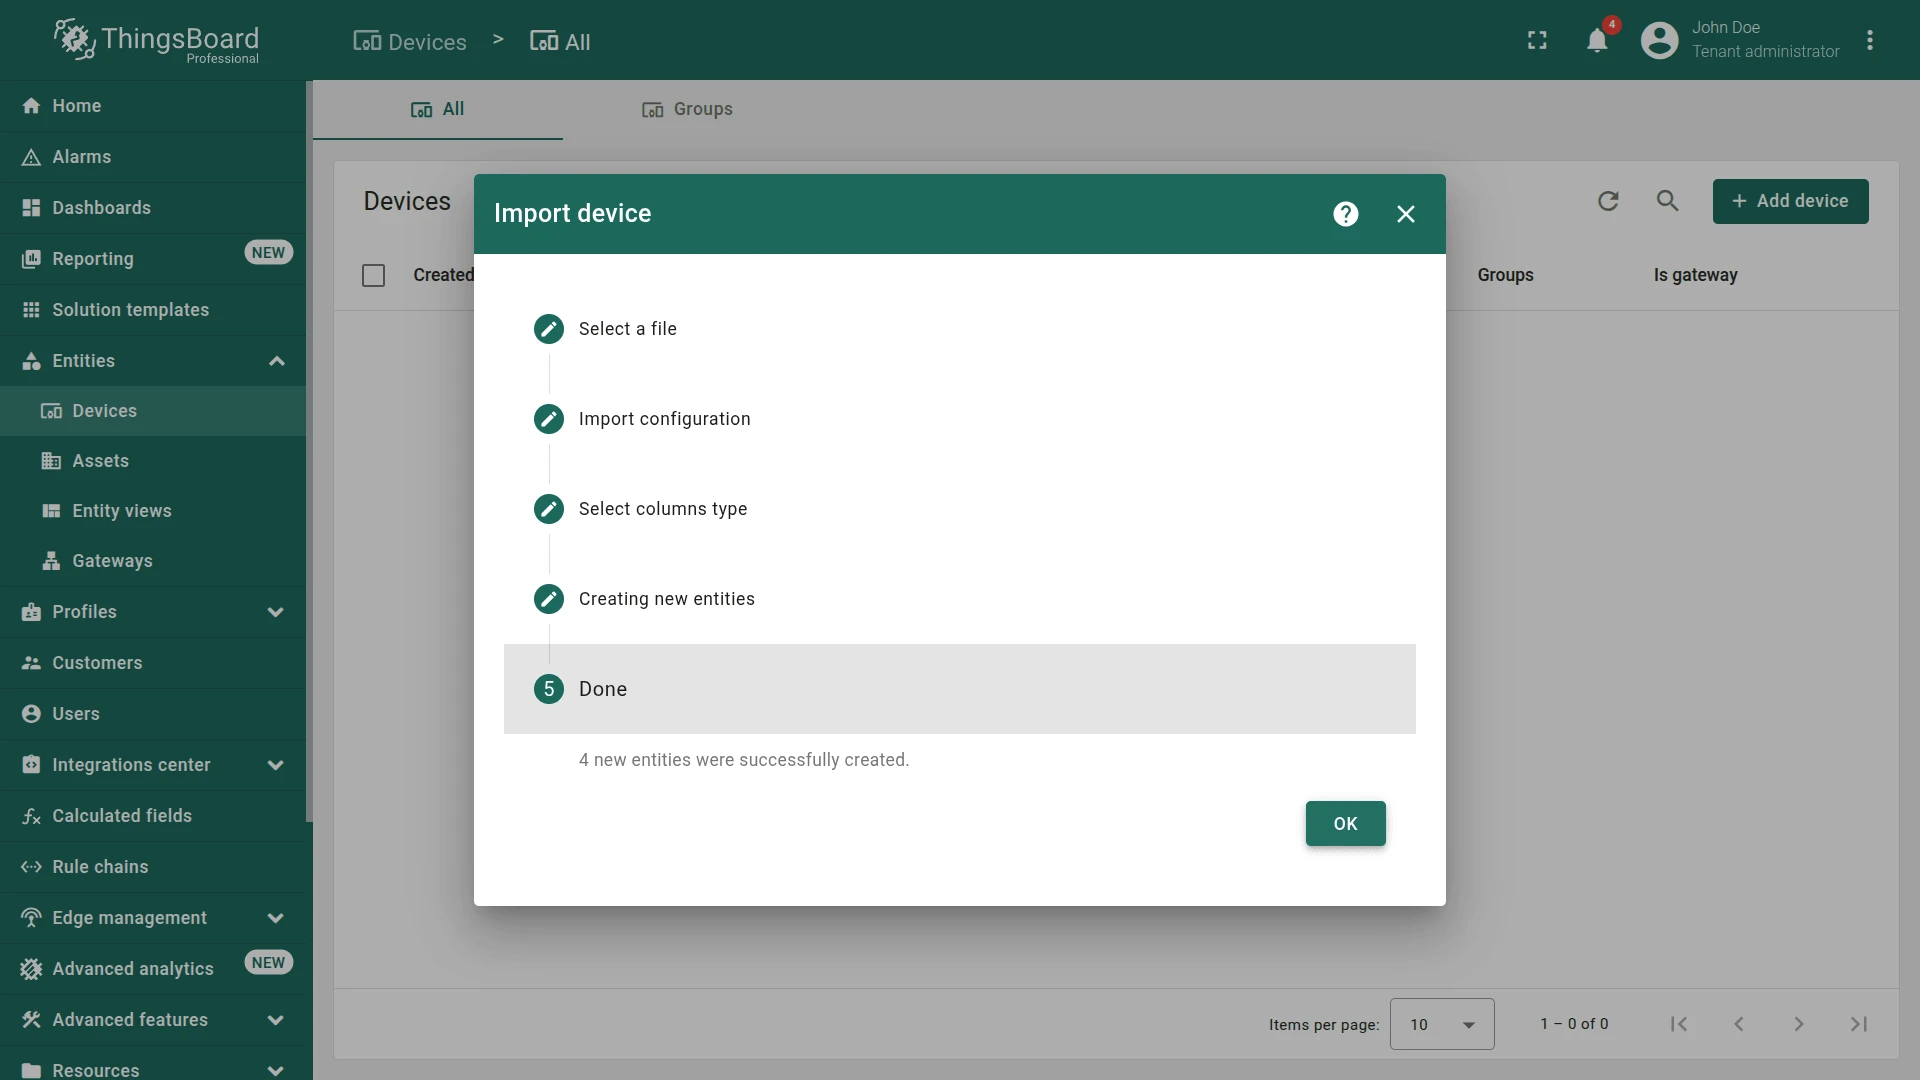
- Click Continue, then OK.
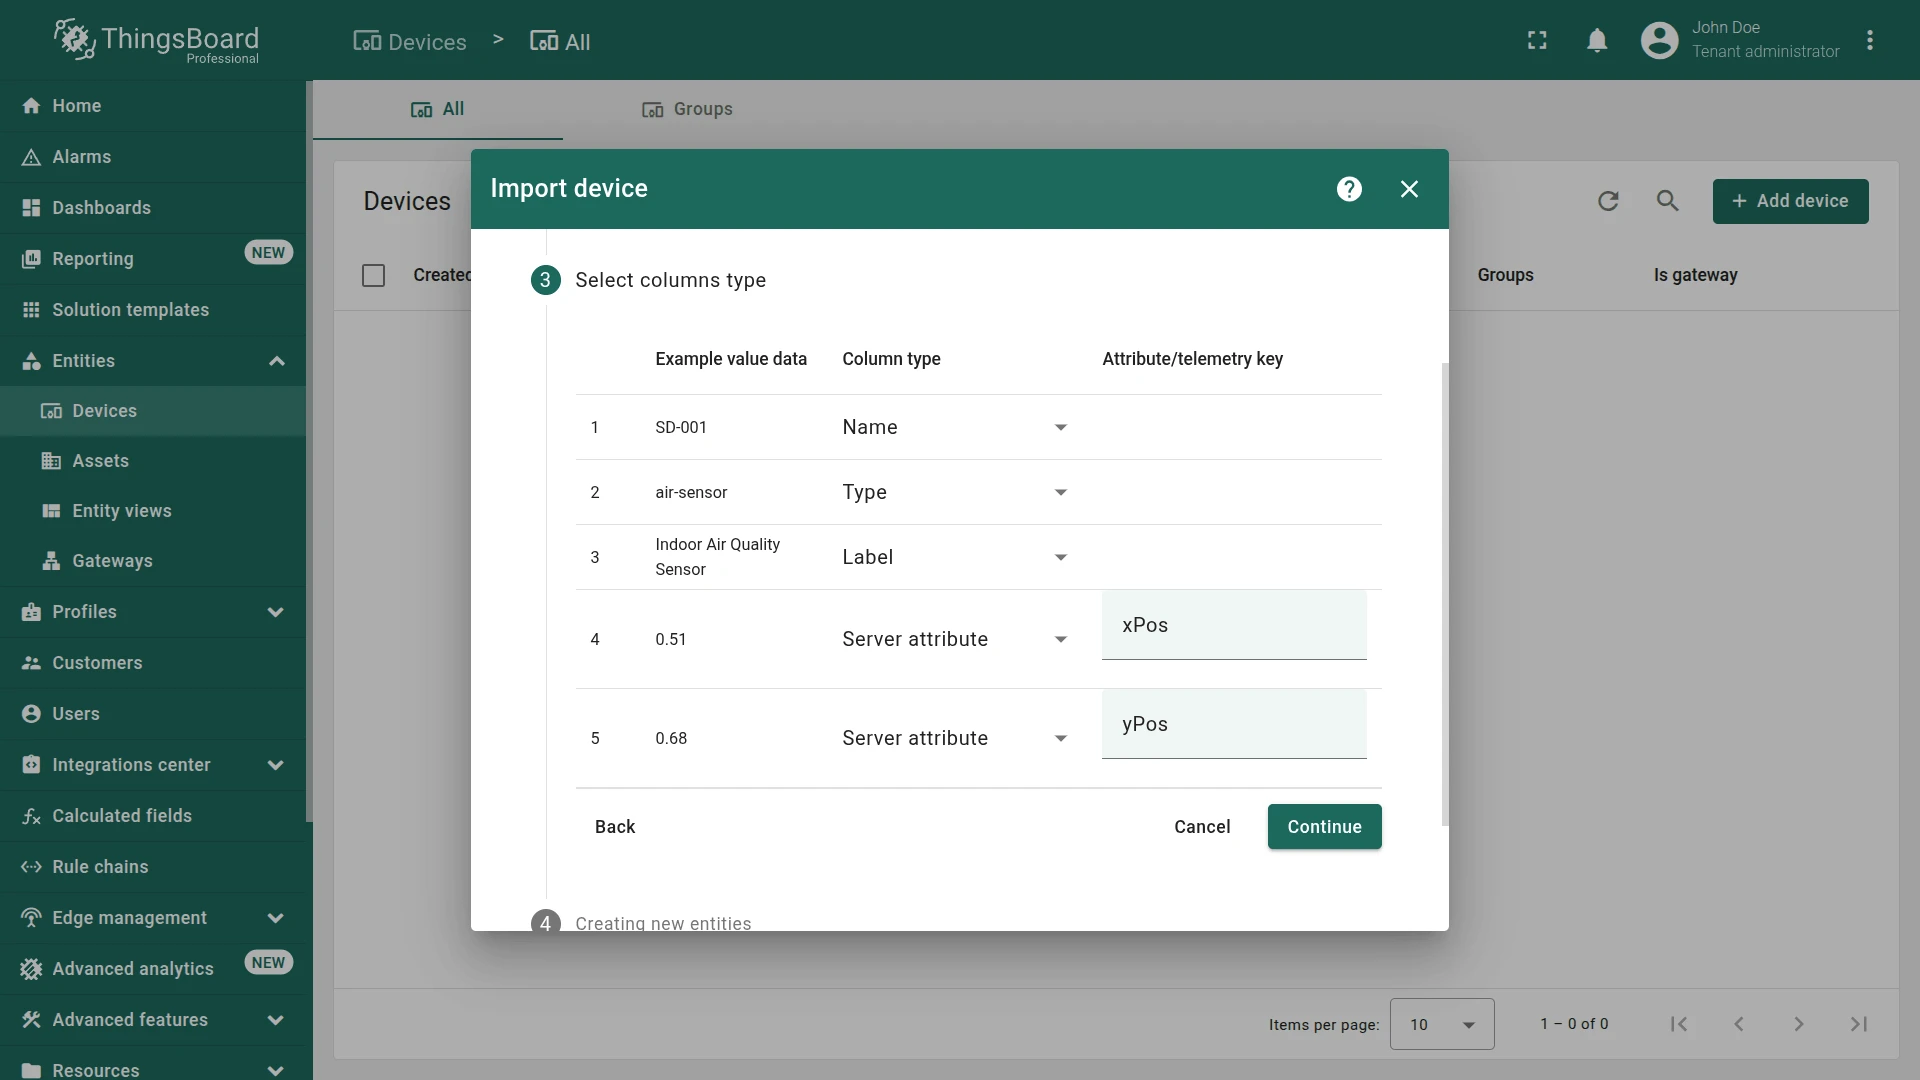
The Attributes tab for each device displays server attributes, including active, xPos, and yPos.


Step 1.3 Add Relations
Section titled “Step 1.3 Add Relations”Feature Relations define directed connections between entities.
Link each building to its offices, and each office to its devices.
Buildings├── Building A│ ├── Office A│ │ ├── SD-001│ │ ├── EM-002│ │ └── WM-003│ └── Office B│ └── AM-307└── Building BLink offices to Building A:
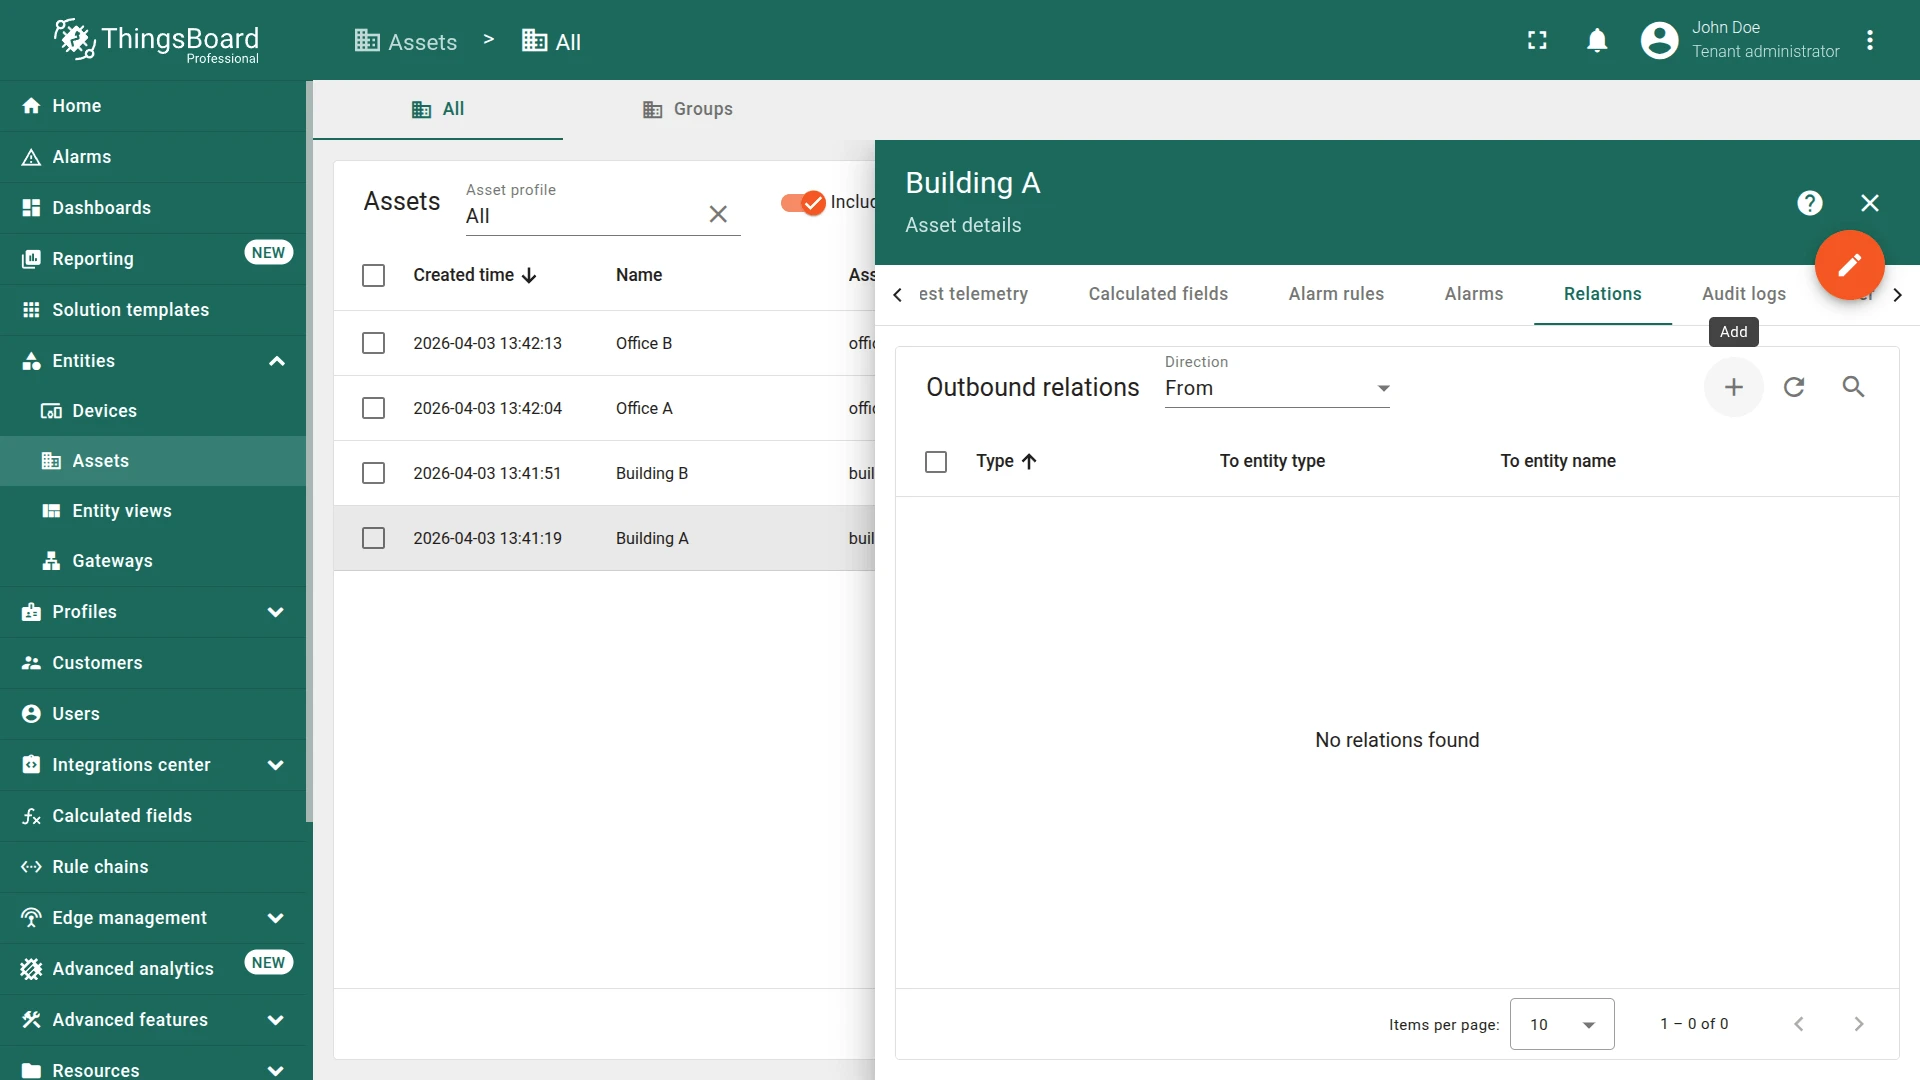
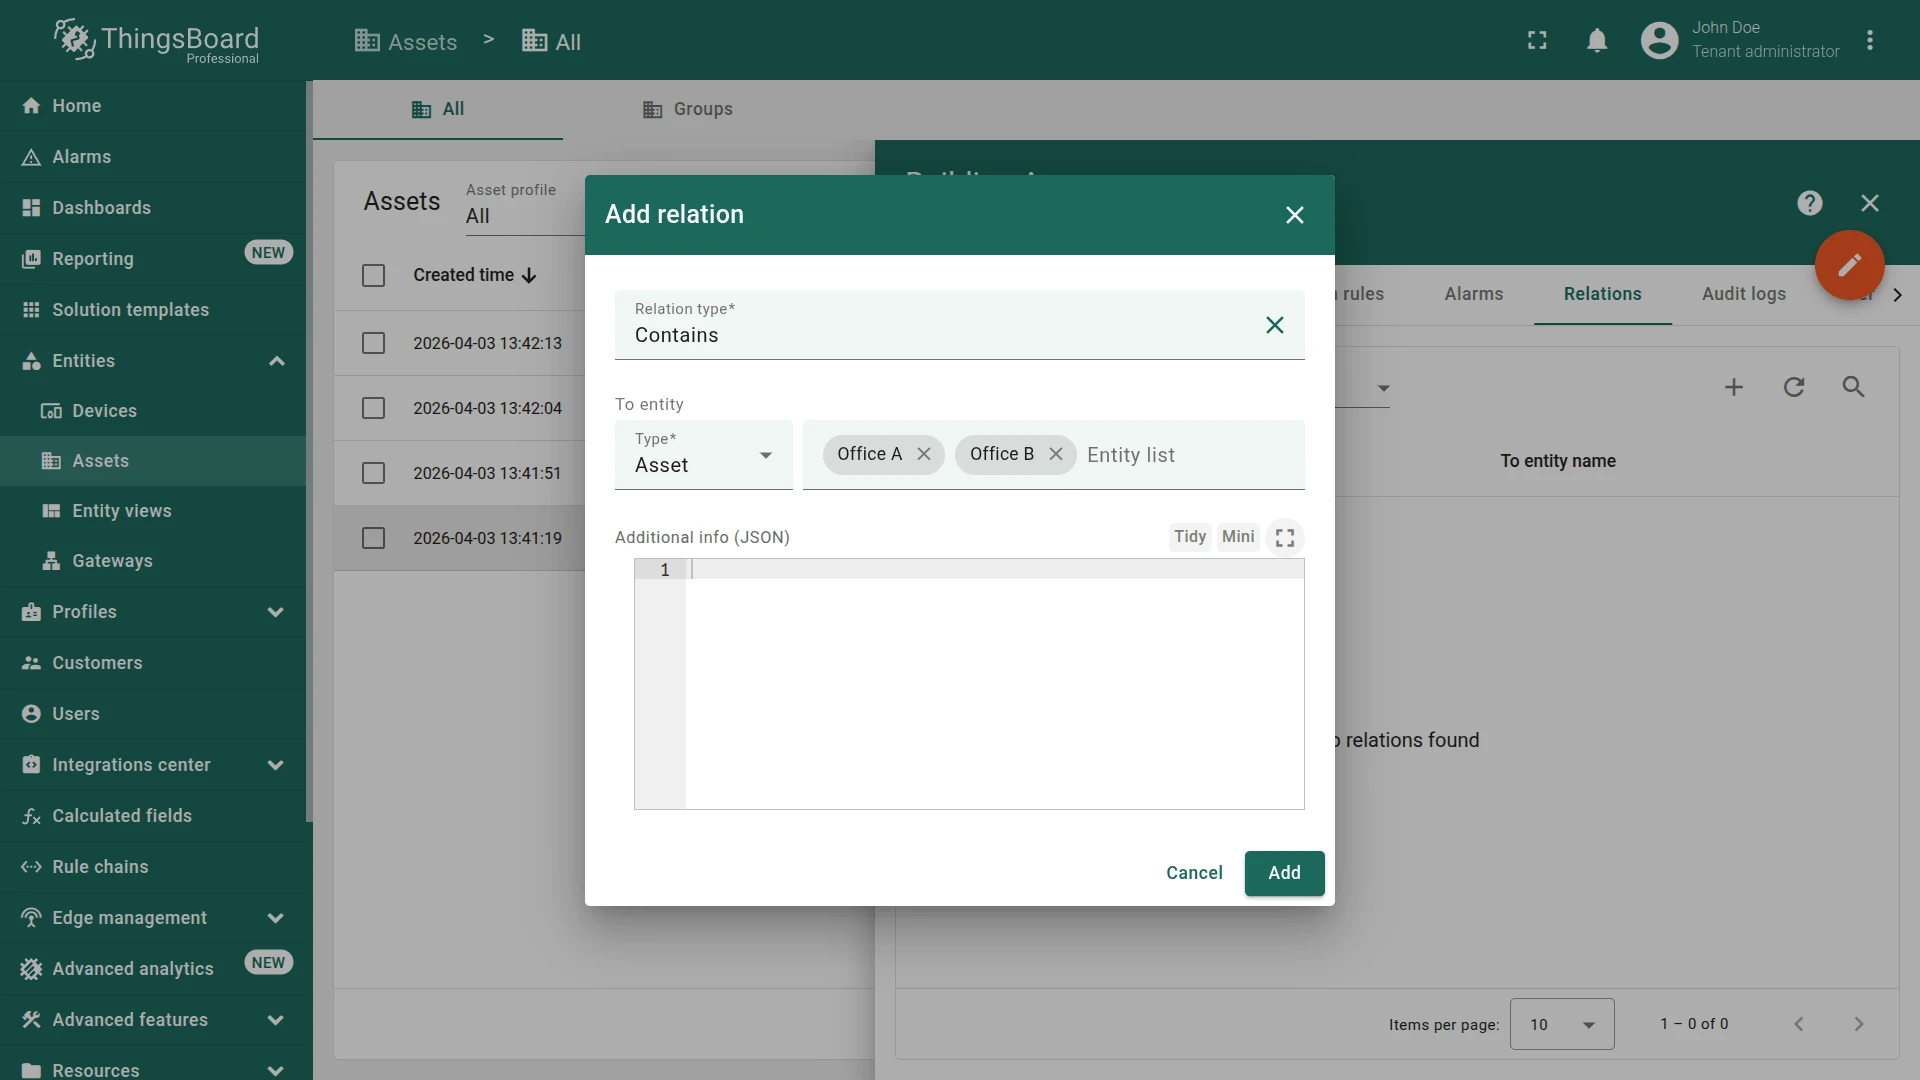
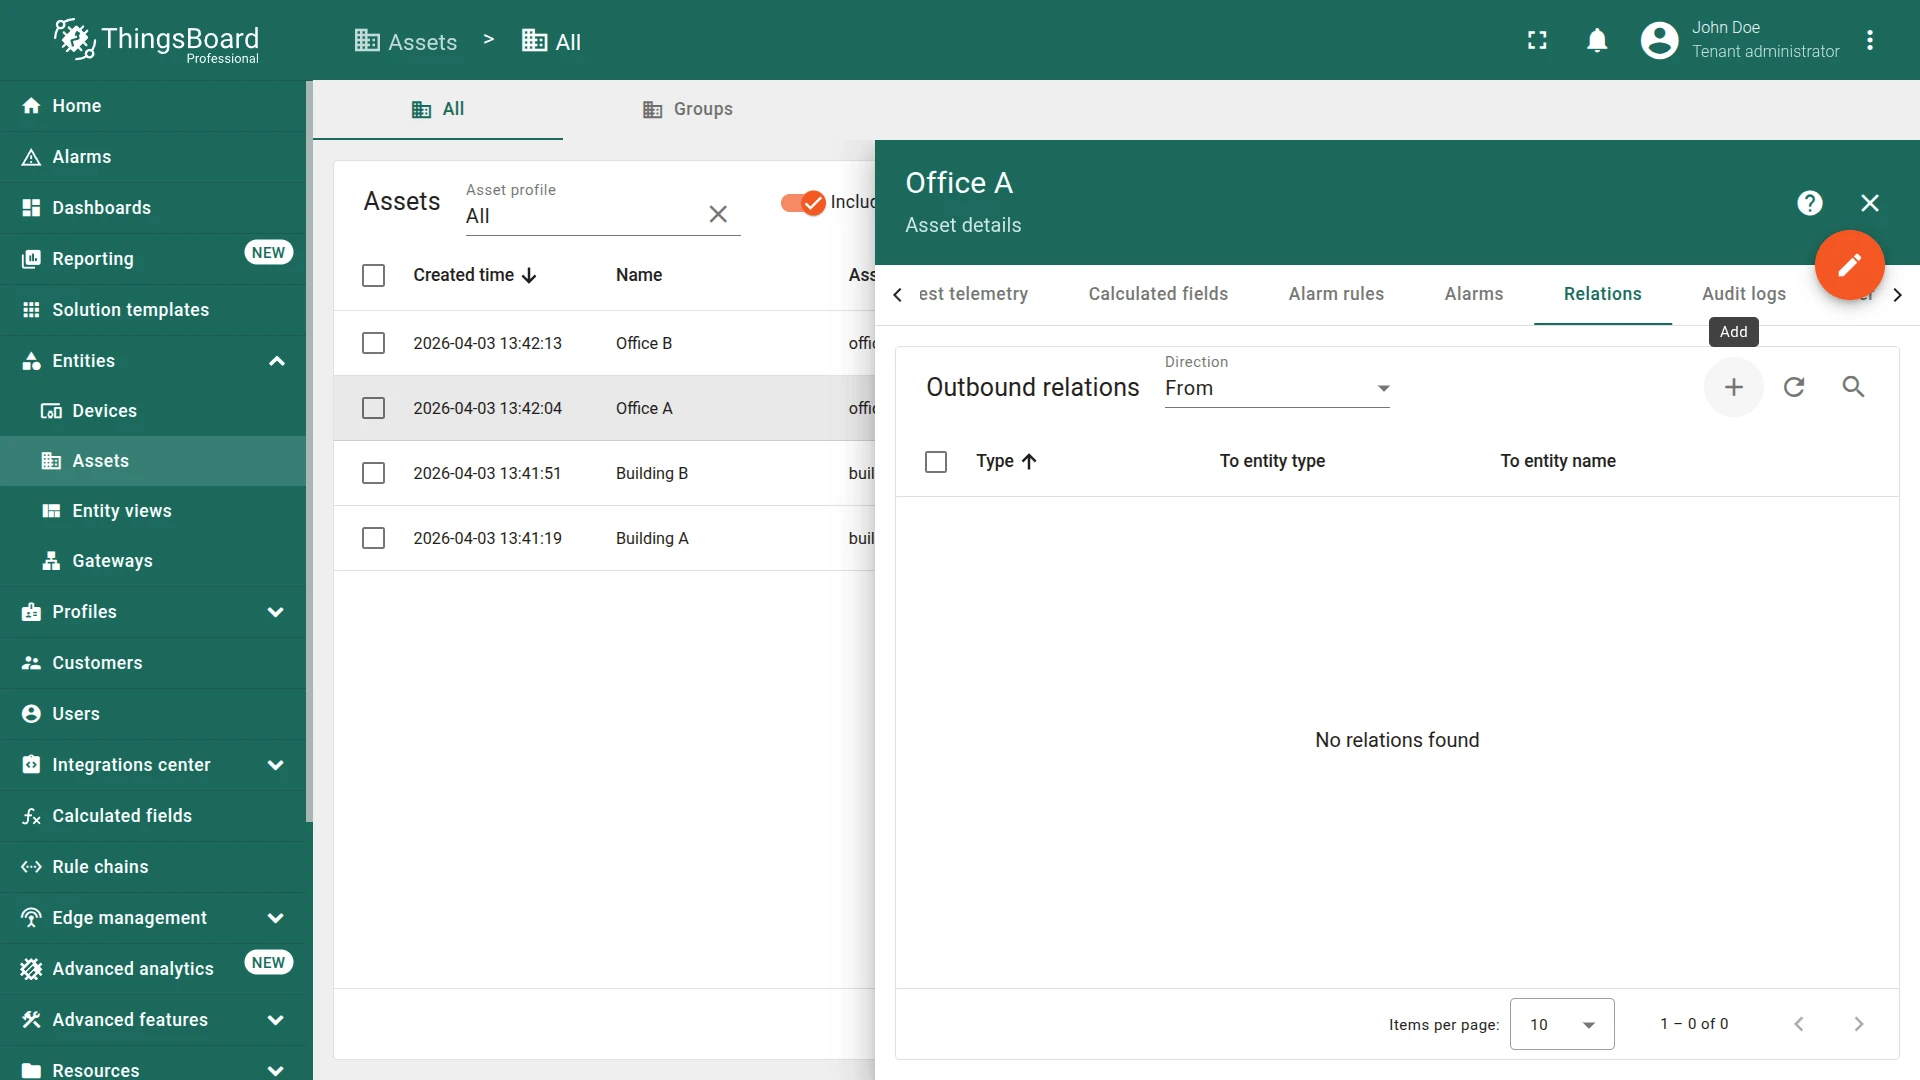
- Open Building A details and go to the Relations tab.
- Set direction to From, then click +.
- Set relation type to Contains and entity type to Asset.
- Select Office A and Office B, then click Add.

Link devices to Office A:
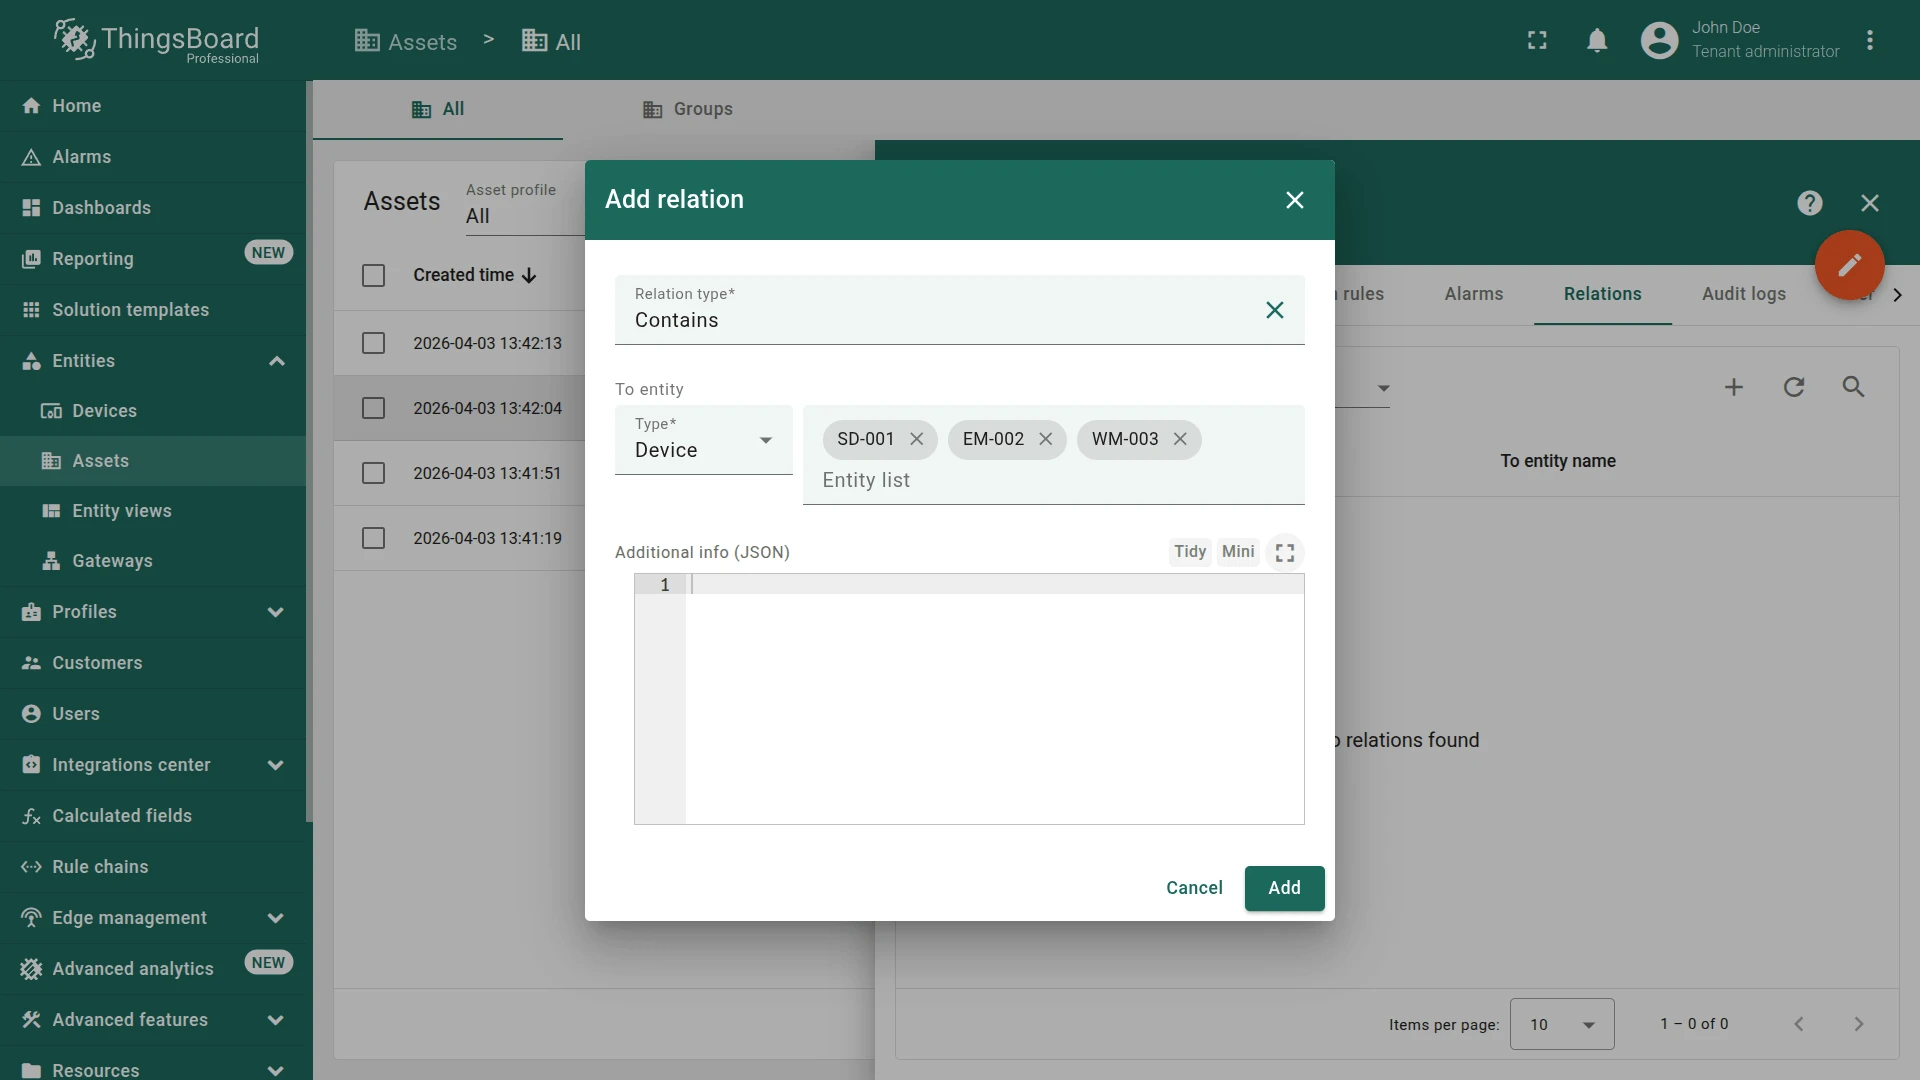
- Open Office A details, go to Relations ⇾ From, and click +.
- Set relation type to Contains and entity type to Device.
- Select SD-001, EM-002, and WM-003, then click Add.
Repeat the same steps for Office B, selecting only AM-307.


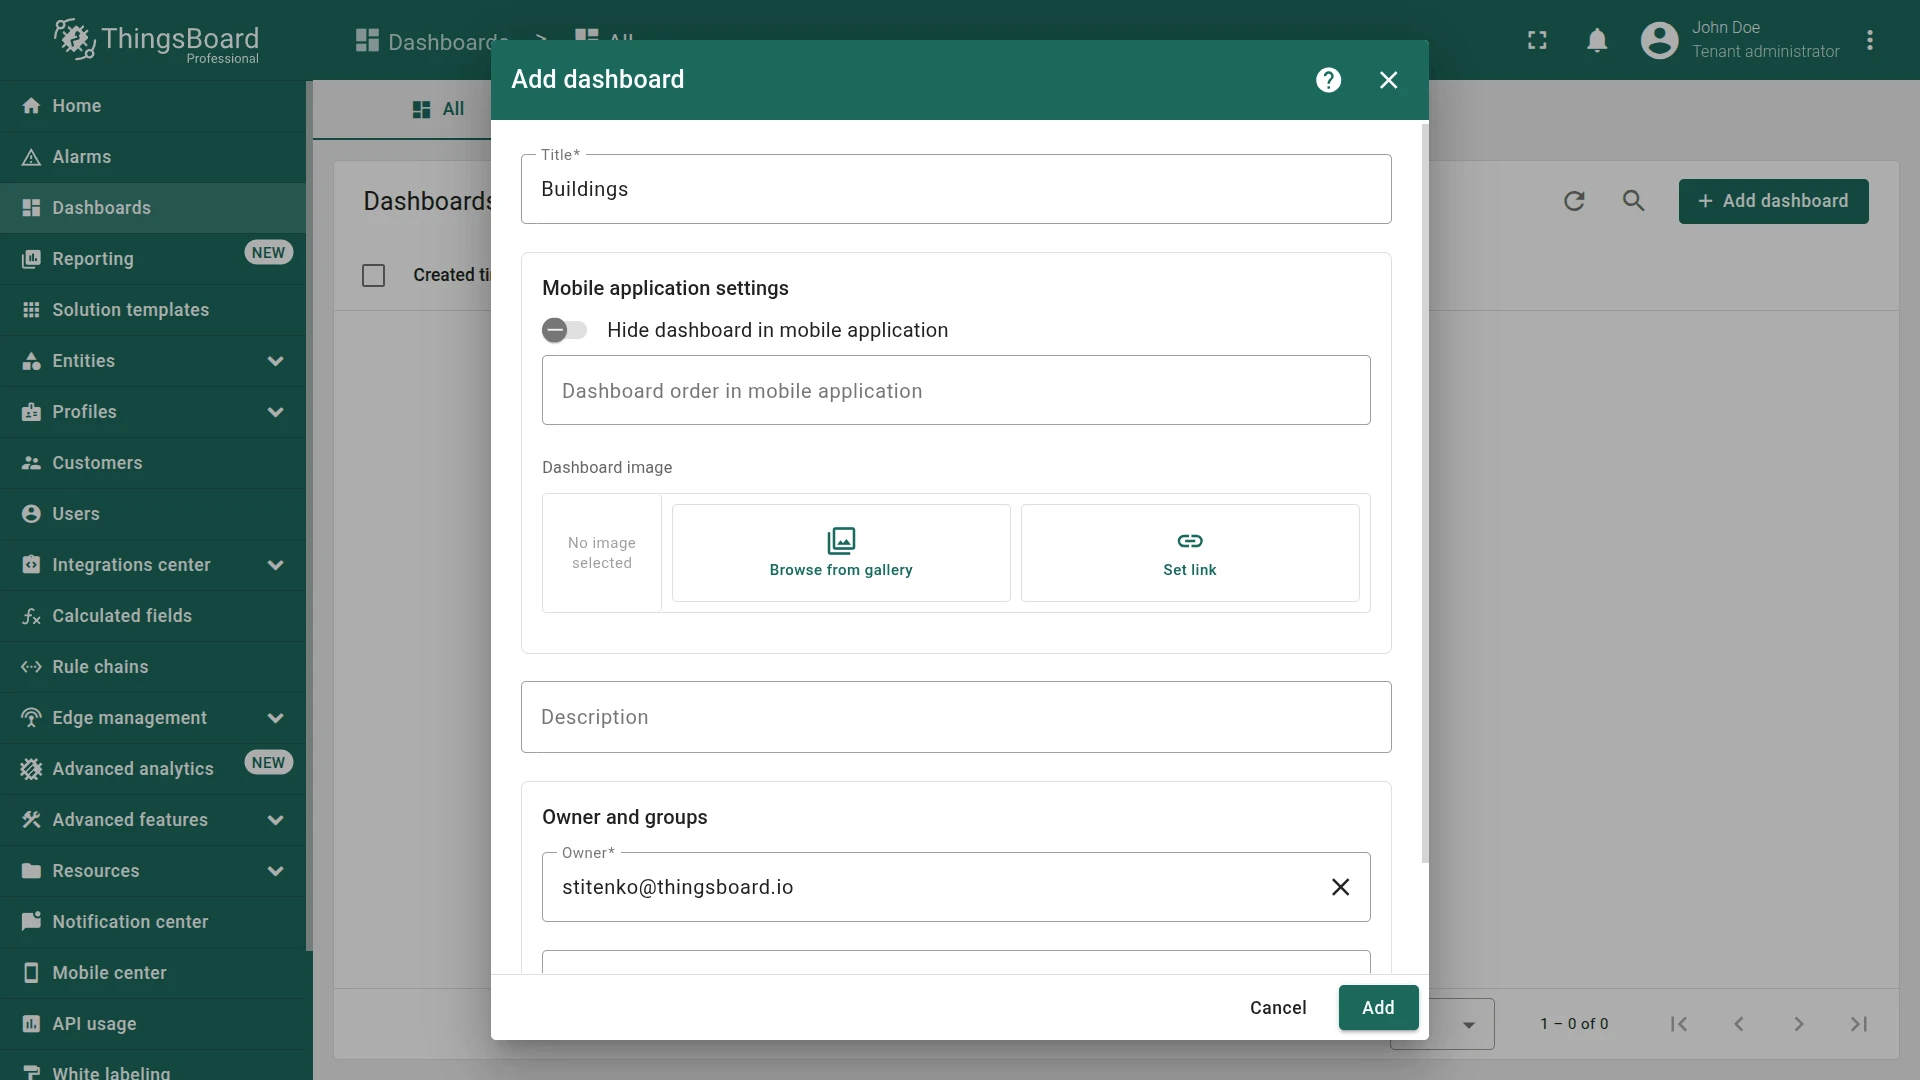
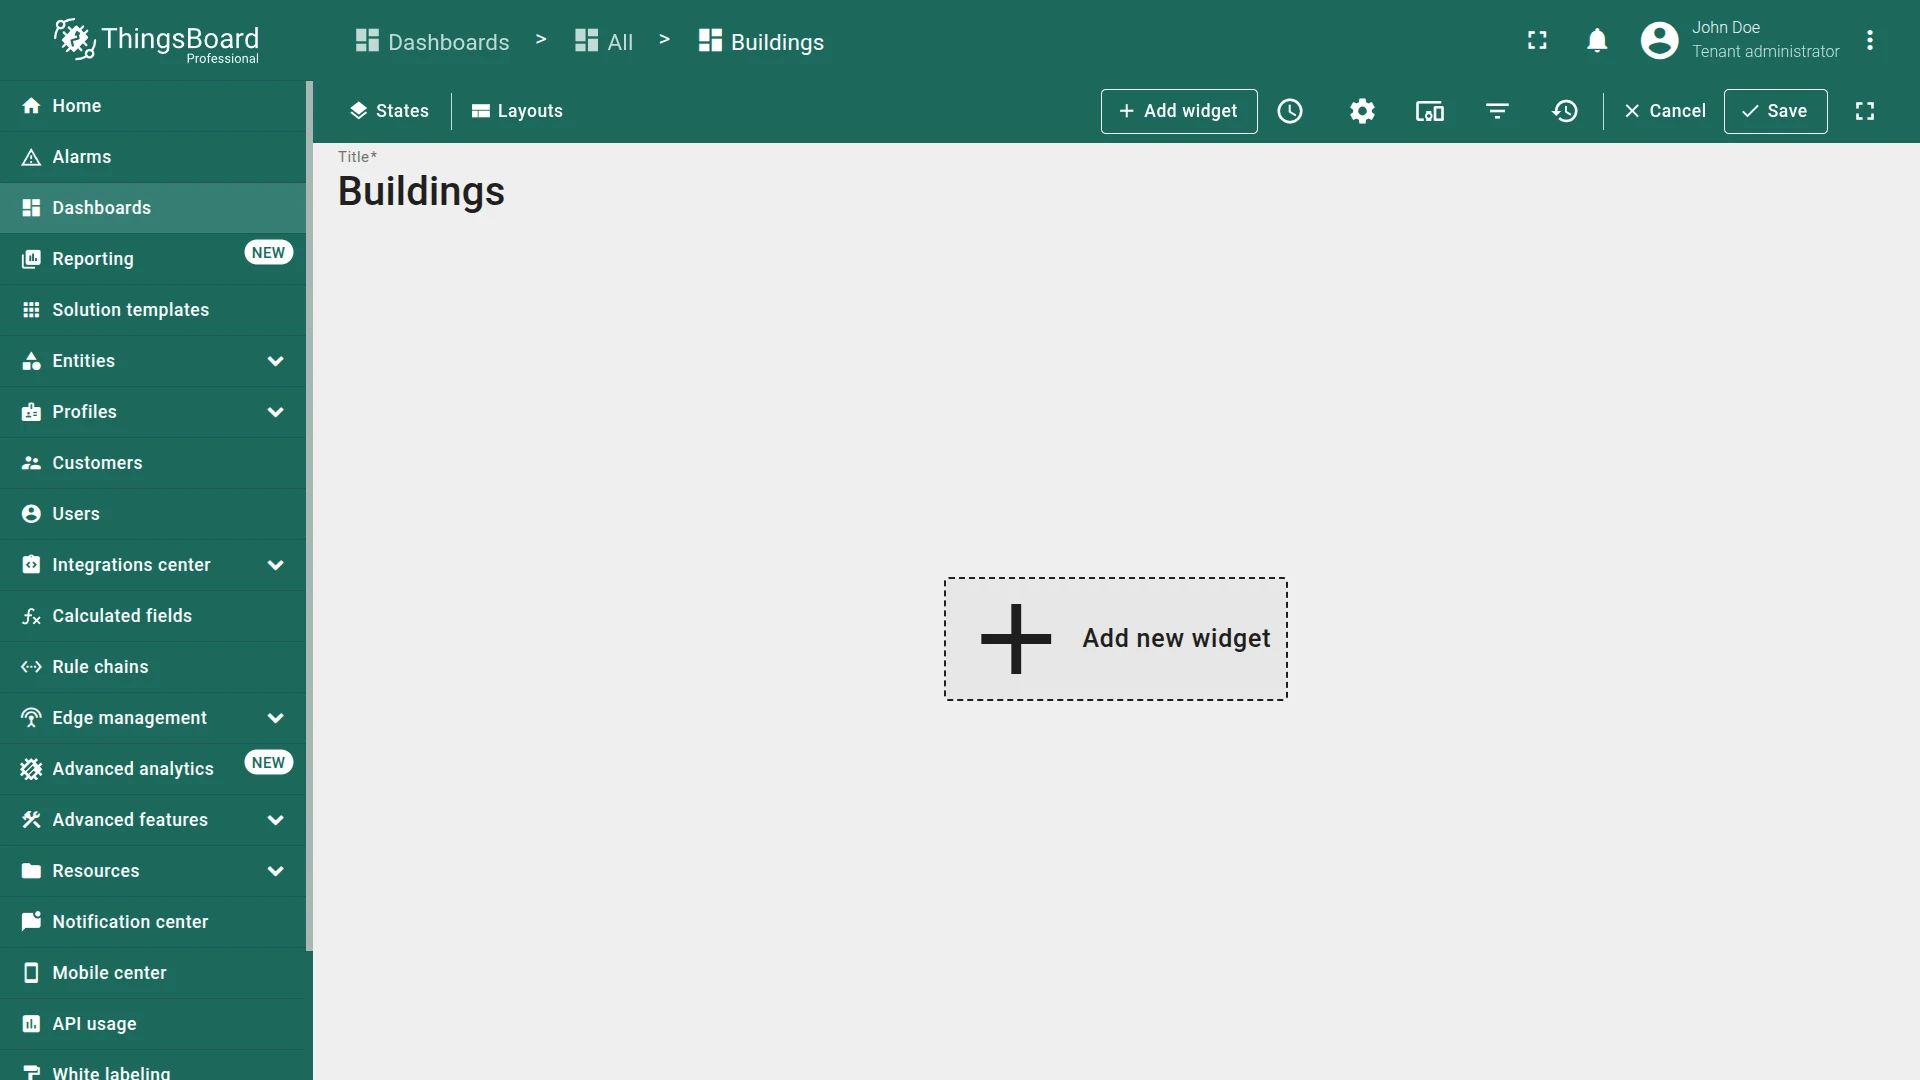
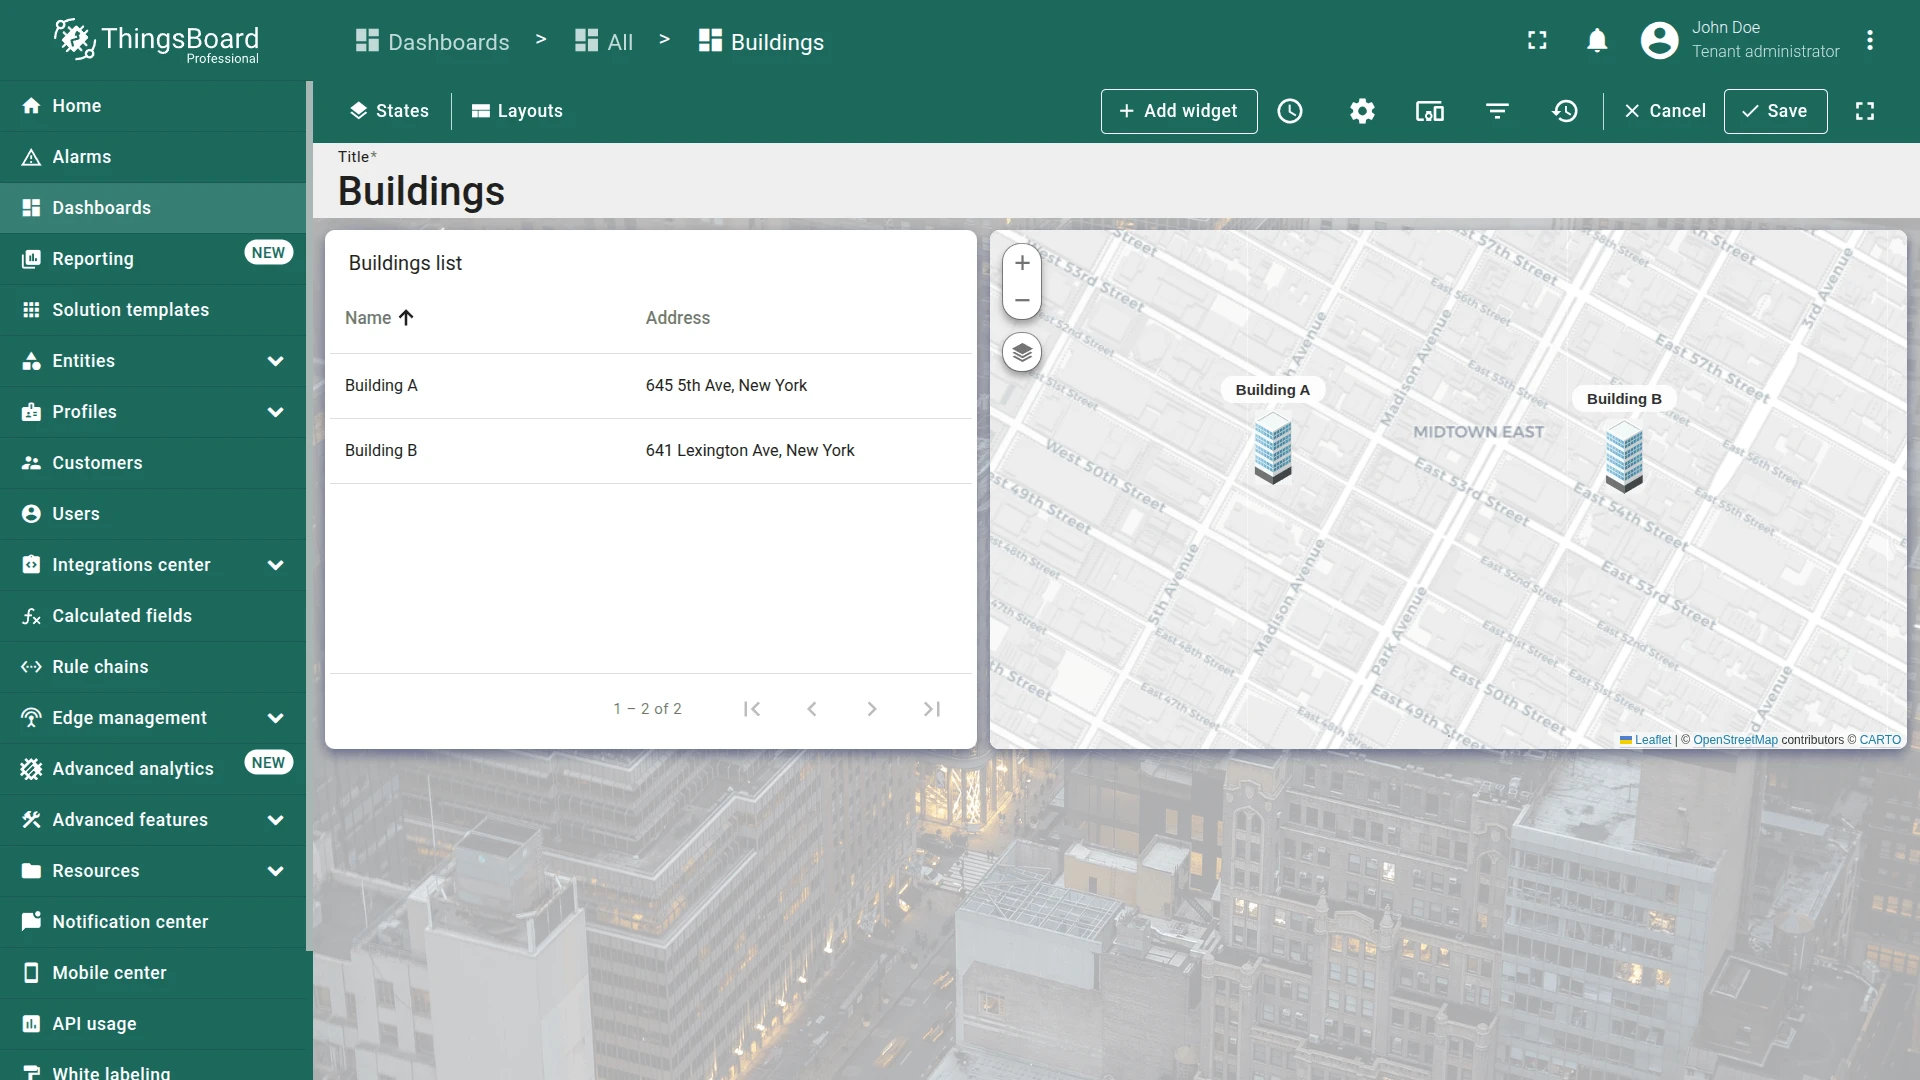
Step 1.4 Create the Dashboard
Section titled “Step 1.4 Create the Dashboard”A Dashboard is where you visualize and interact with your assets and devices.
Create a dashboard in a separate group for the buildings scenario.
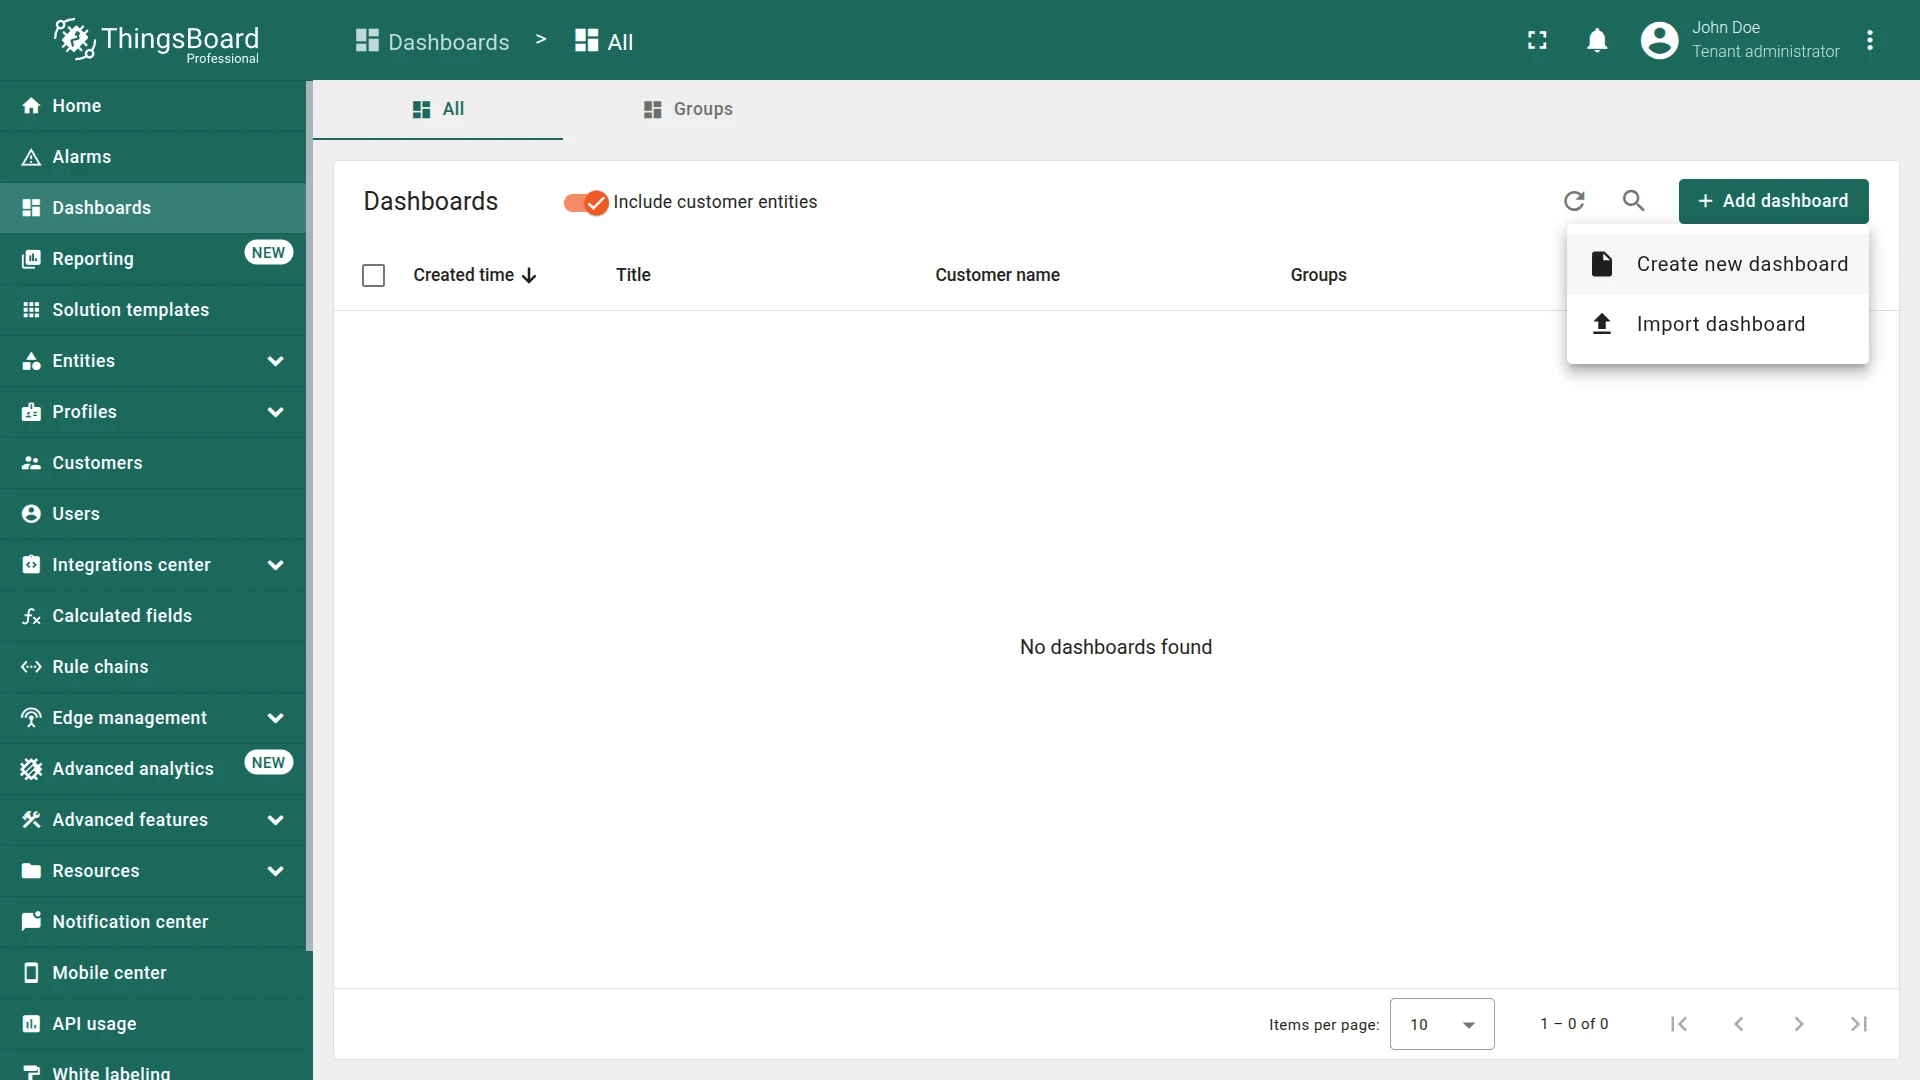
- Go to Dashboards.
- Click + Add dashboard ⇾ Create new dashboard.
- Enter dashboard title (e.g., Buildings).
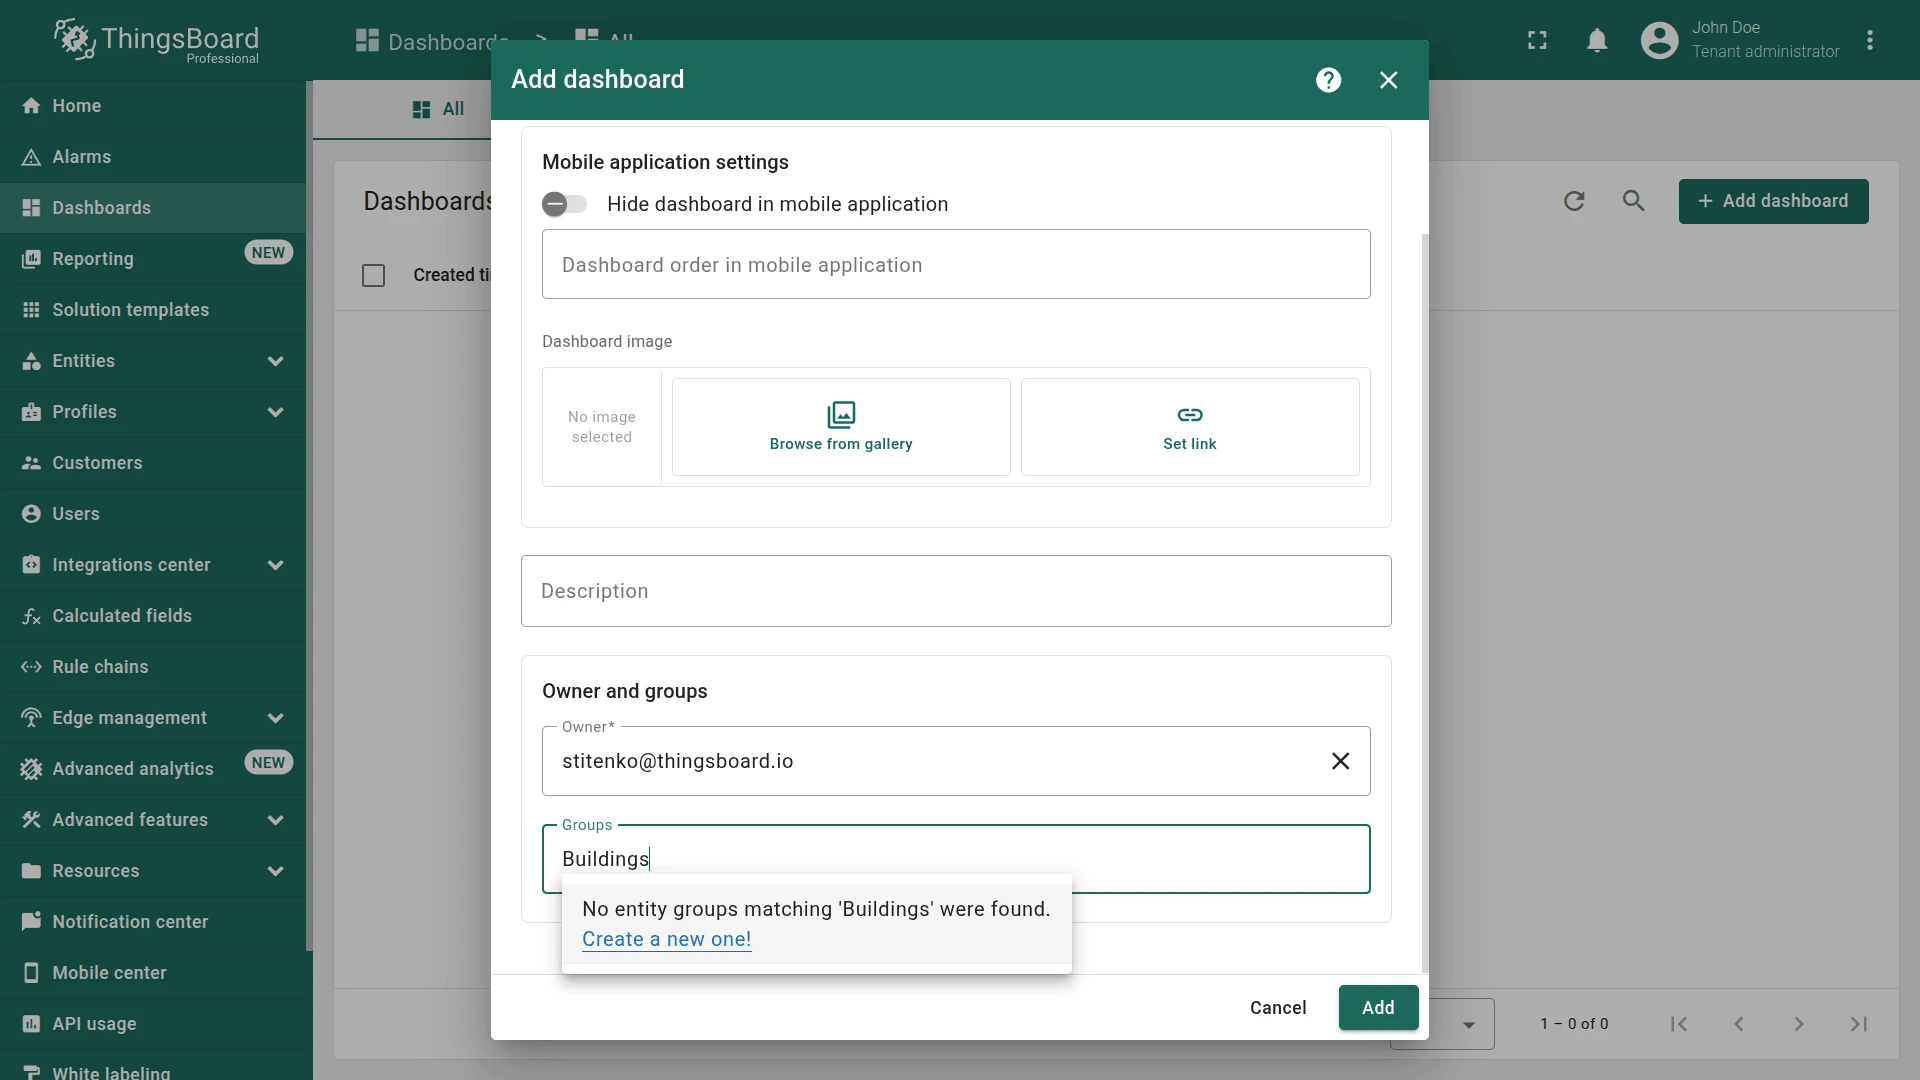
- Add dashboard to the group:
- Enter Buildings in the “Groups” field
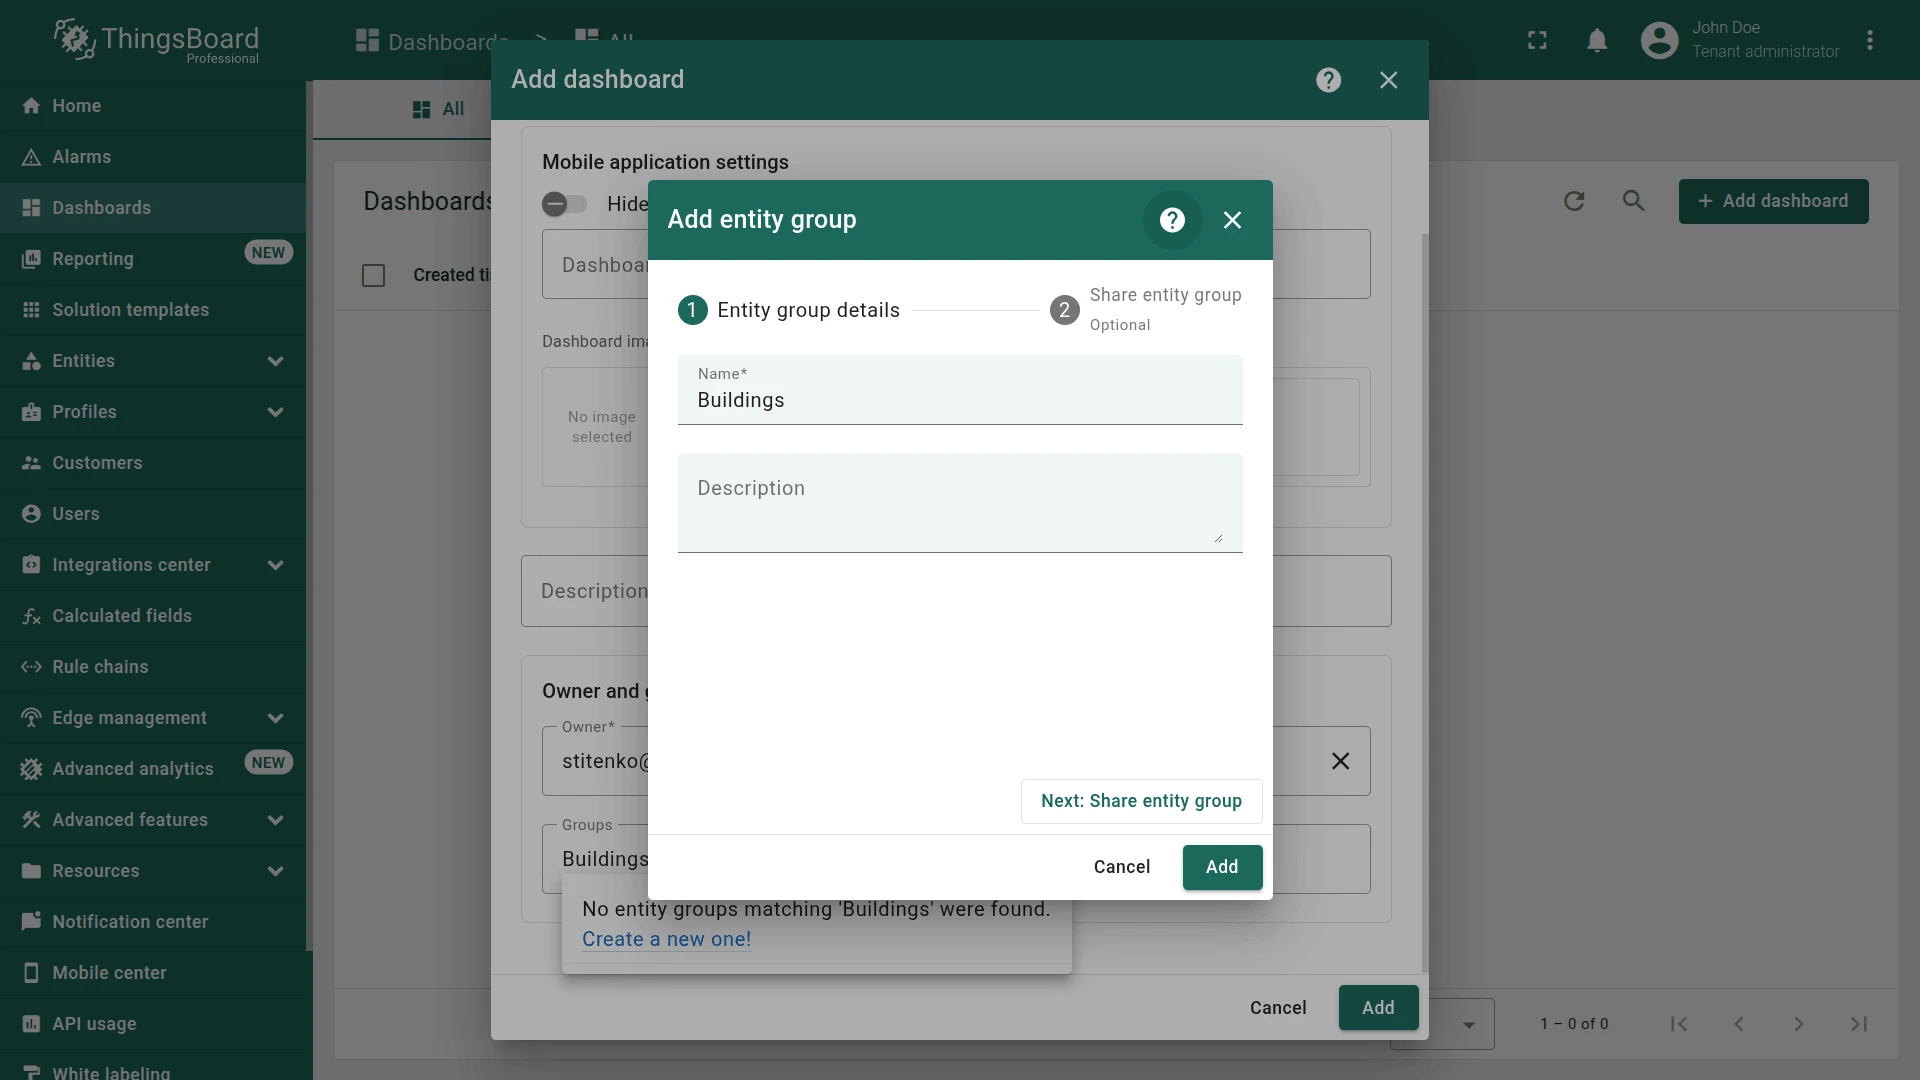
- Click Create a new one!.
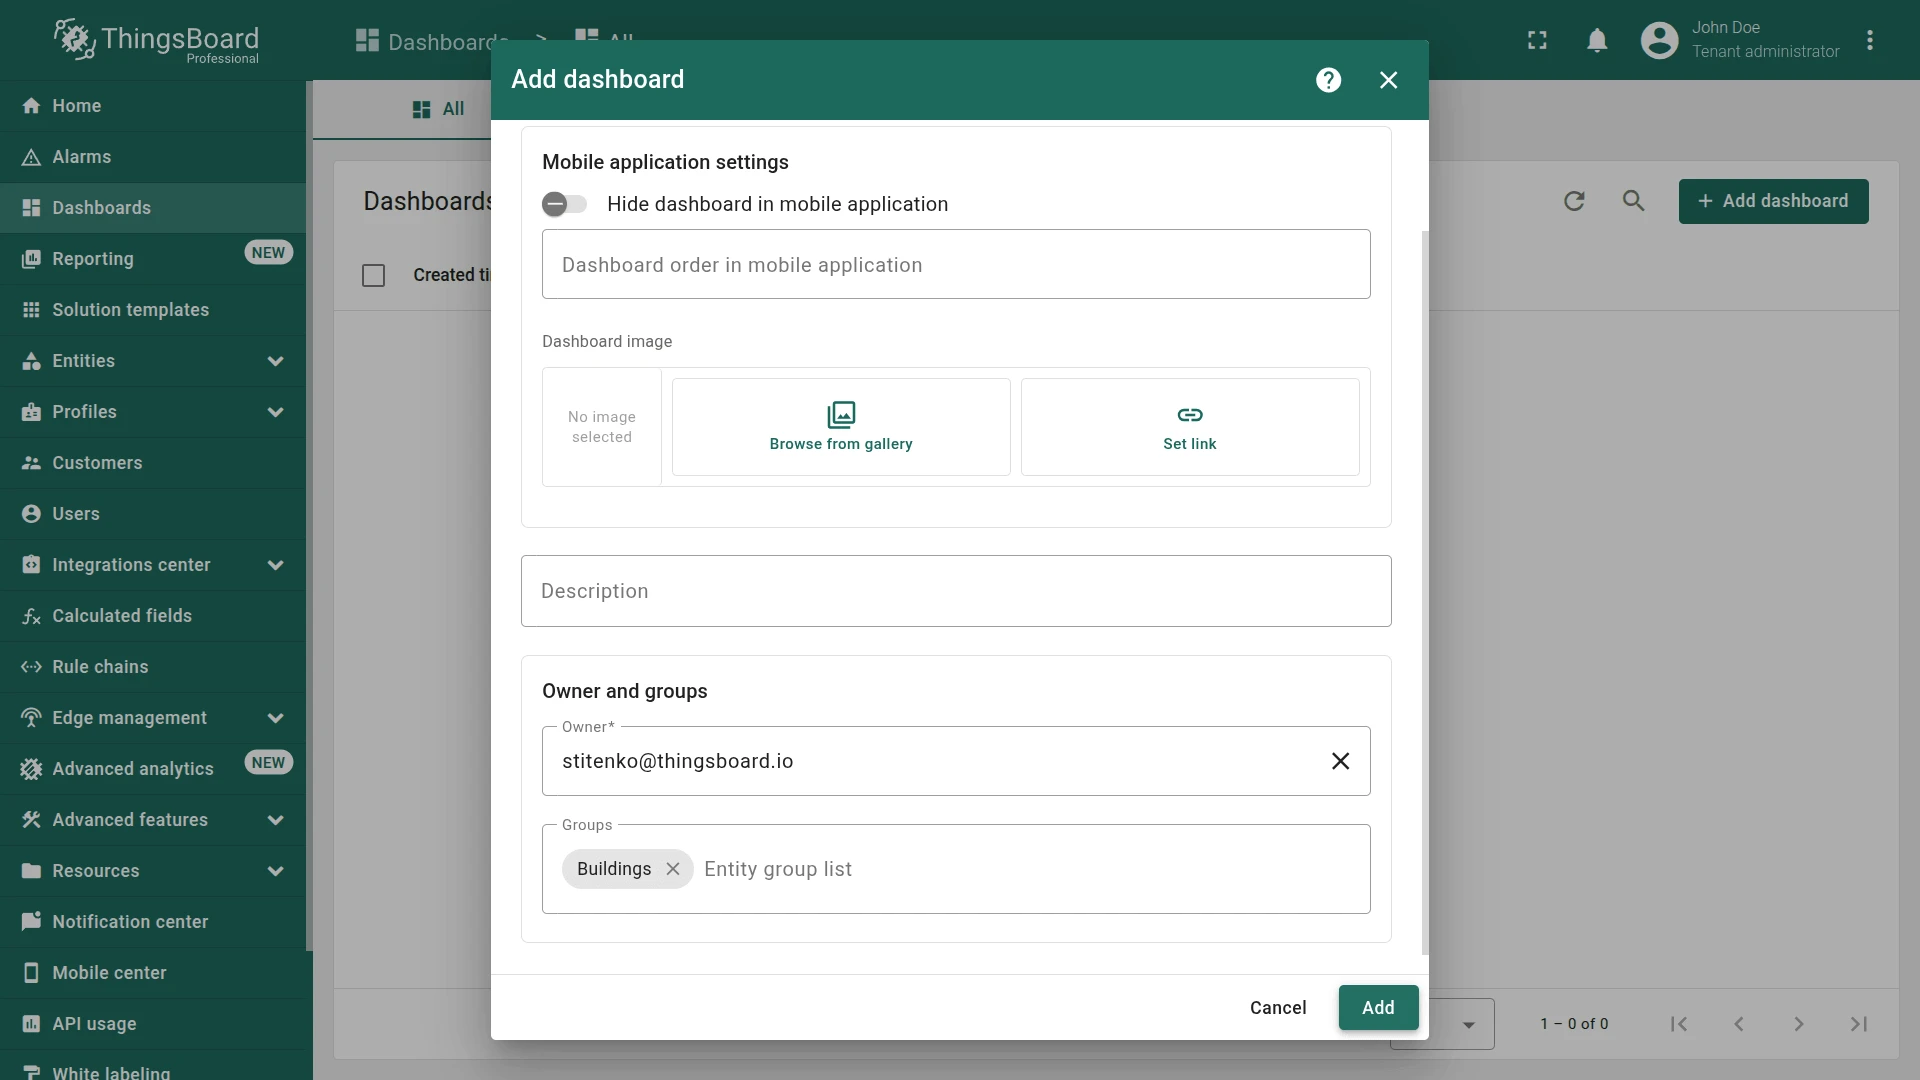
- Confirm creating dashboard group by clicking Add.
- Click Add to confirm creating dashboard.
- Save the dashboard by clicking the Save button in the upper-right corner of the screen.

Step 1.5 Map Widget
Section titled “Step 1.5 Map Widget”Add a Map widget to display Building A and Building B.
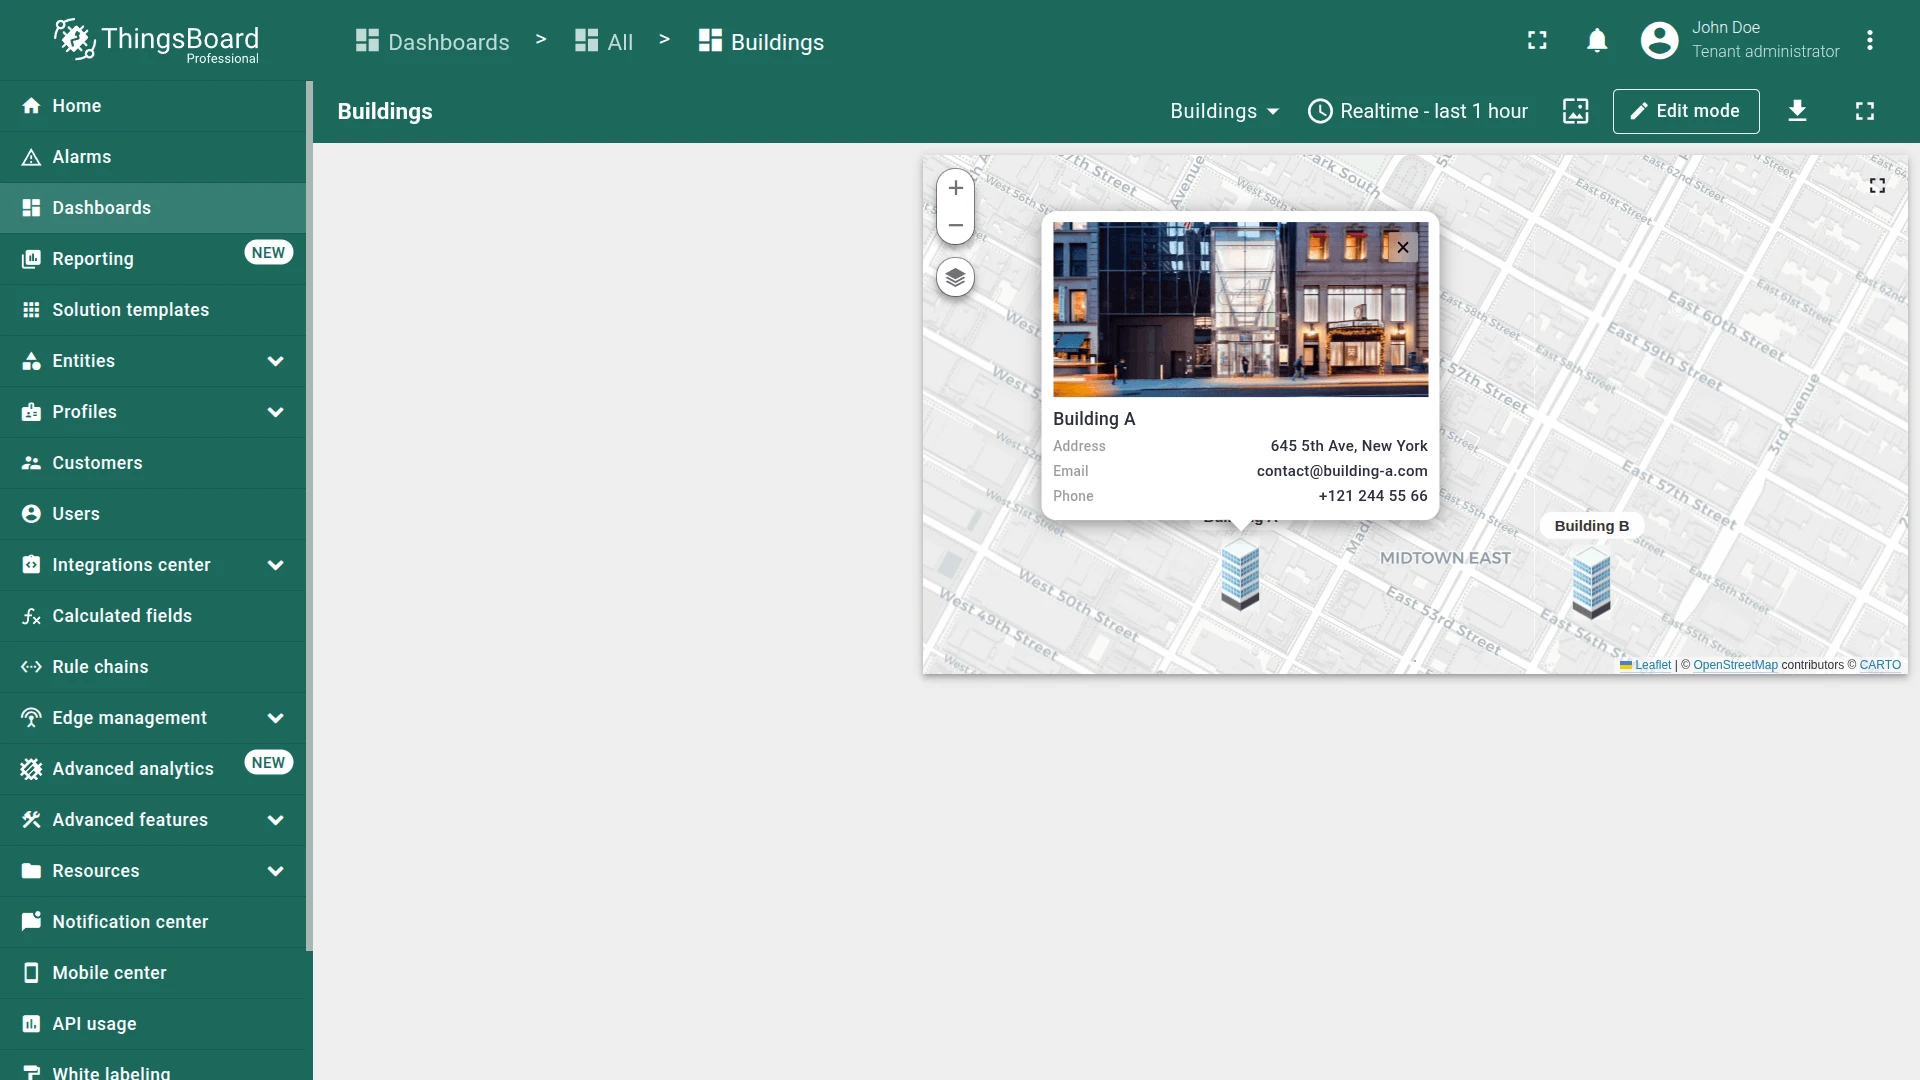
Each building must have latitude and longitude attributes to place markers correctly. Additional info—address, contact details, and image—will be shown in a popup when a marker is clicked.
Start with the preparatory work below.
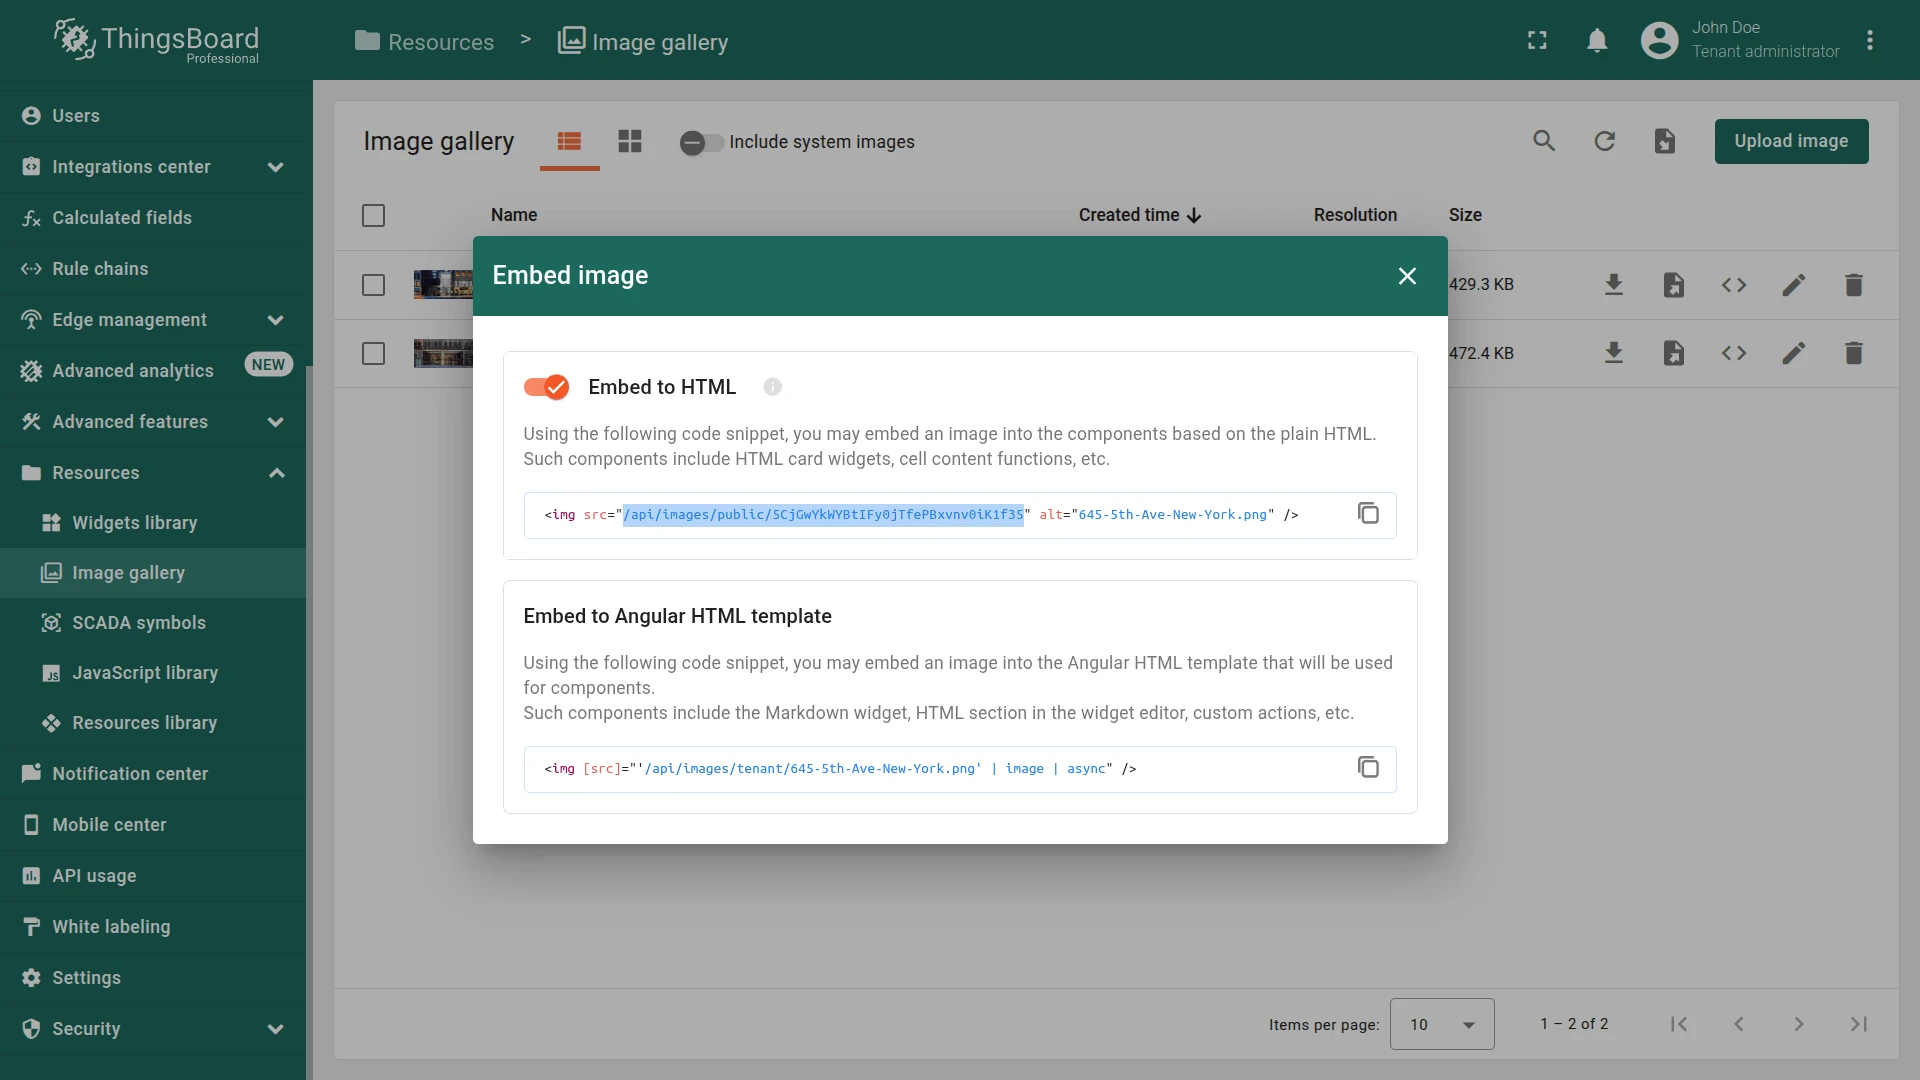
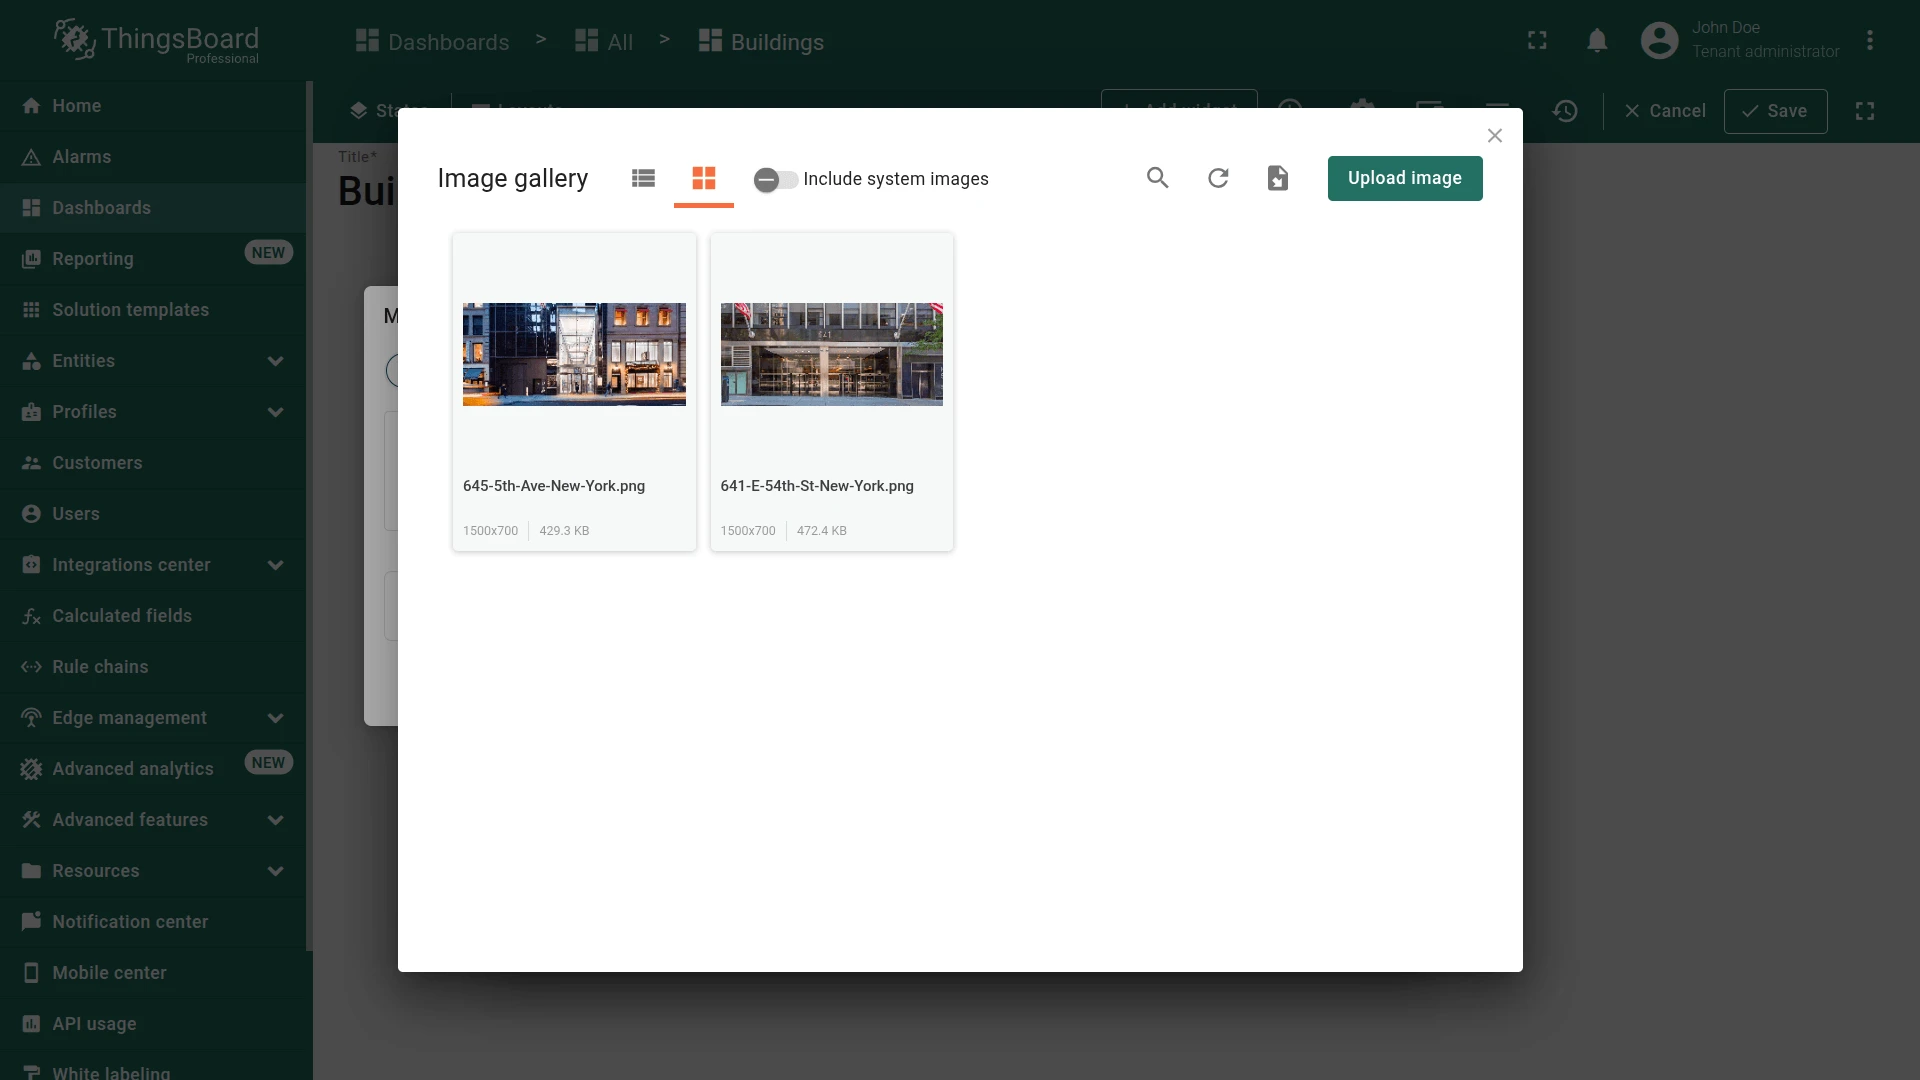
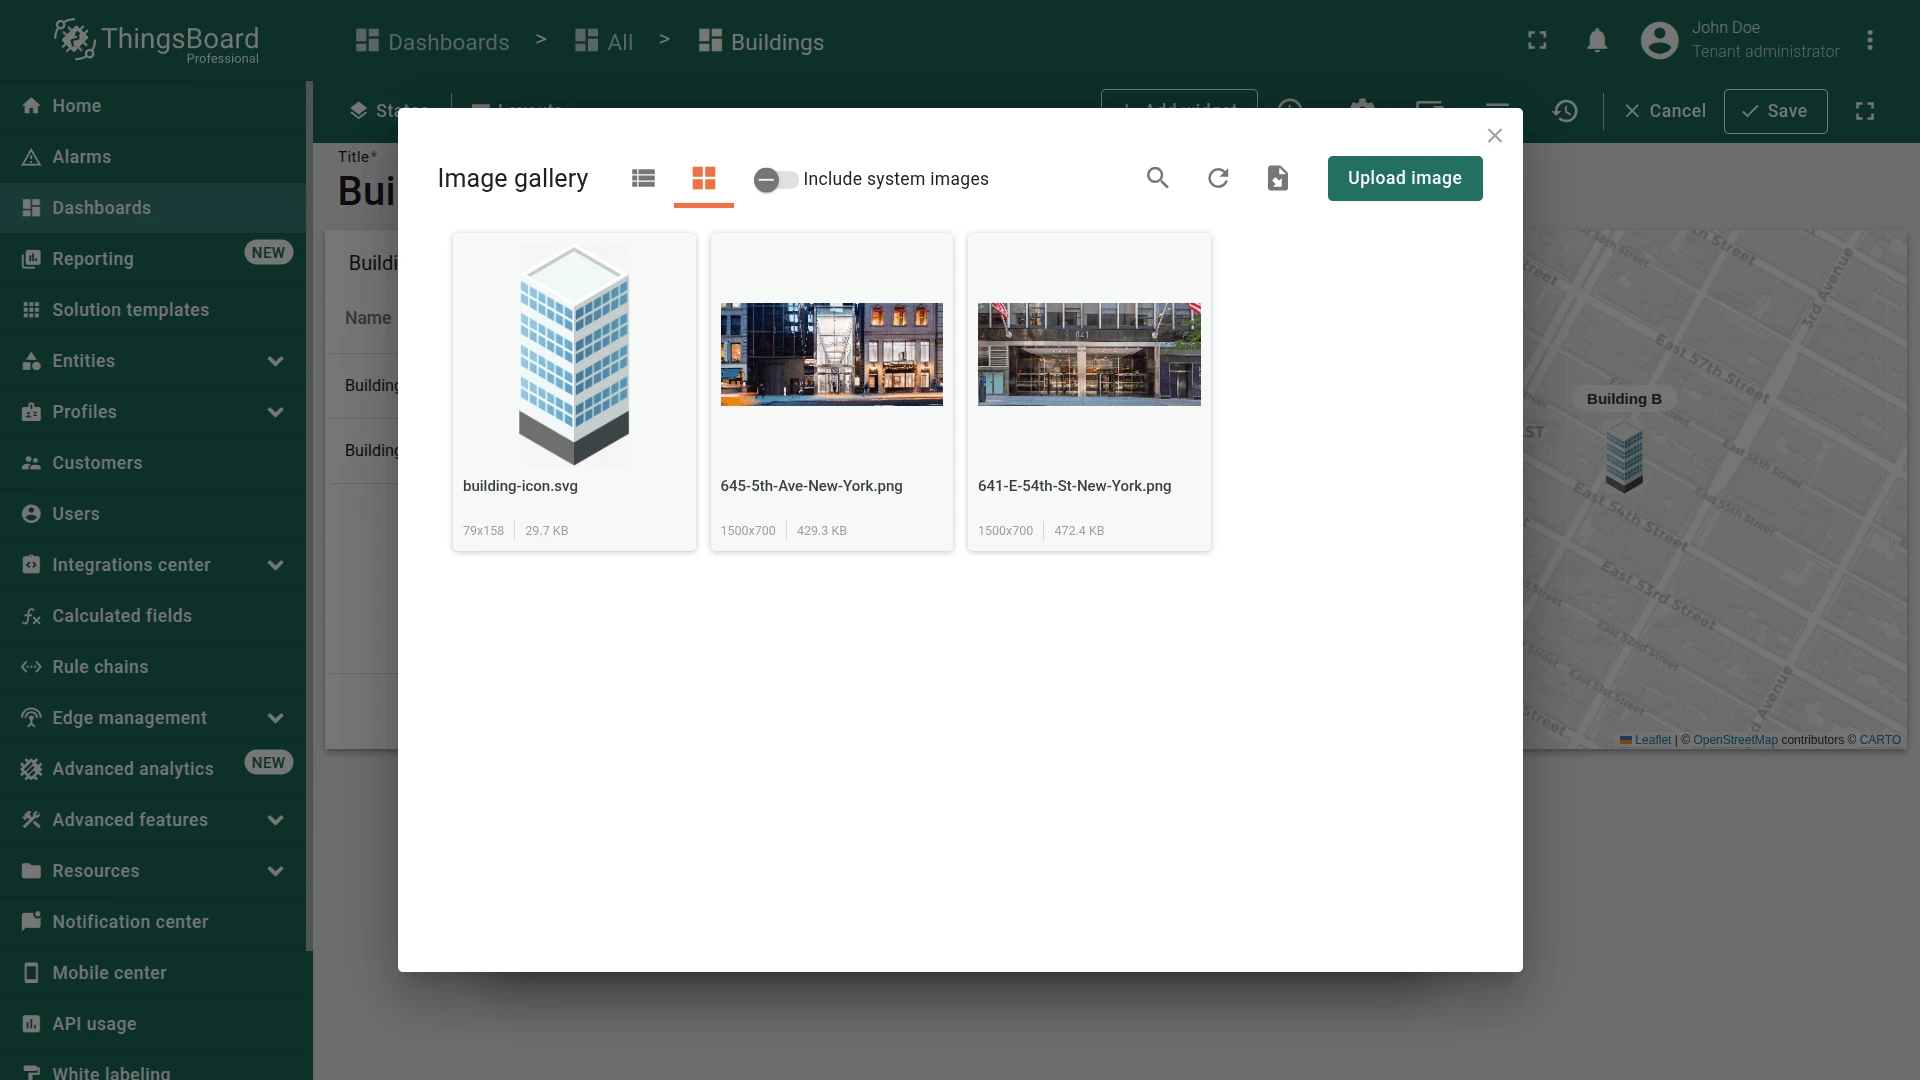
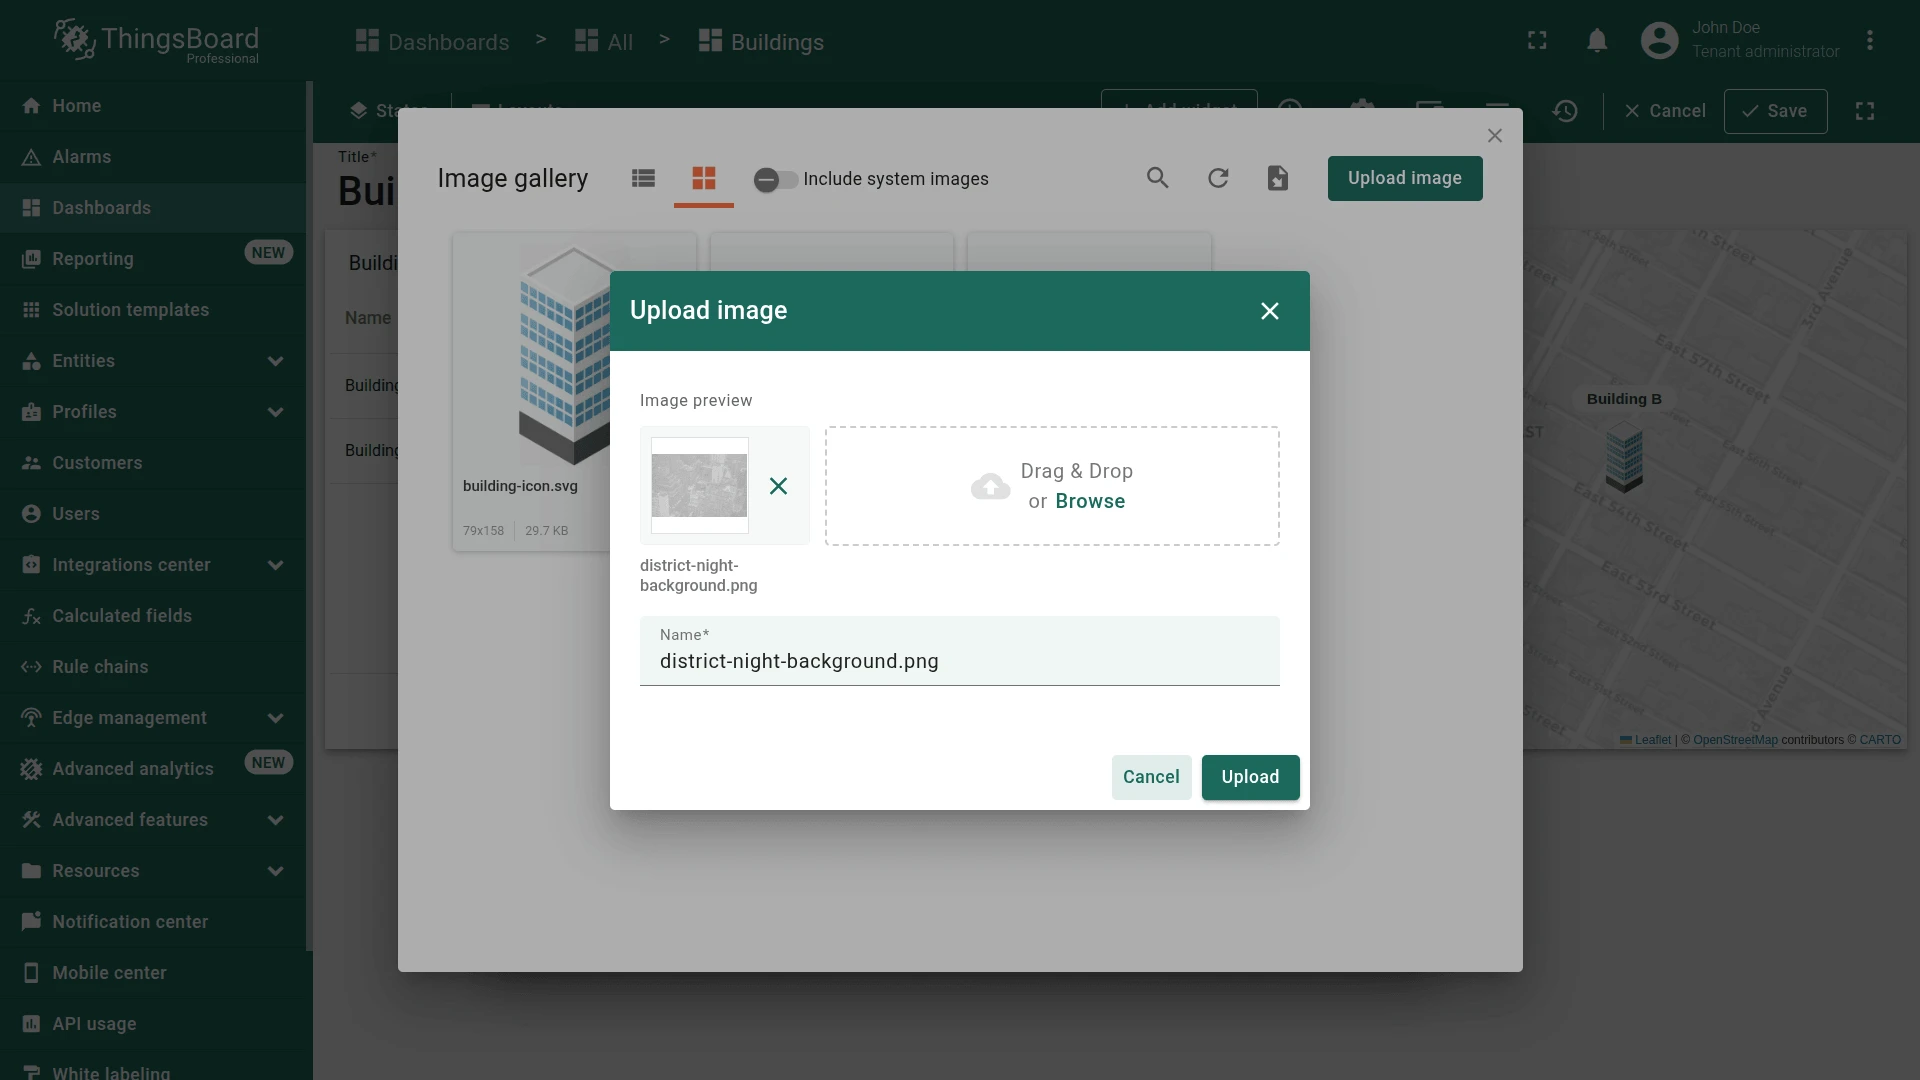
Upload Building Images
Section titled “Upload Building Images”Building images need to be uploaded to the Image gallery, which serves as a centralized repository for storing and managing images. They will be used in the tooltip of the map widget. You can use the Building A and Building B images from this guide or upload your own images.
Download the sample images:
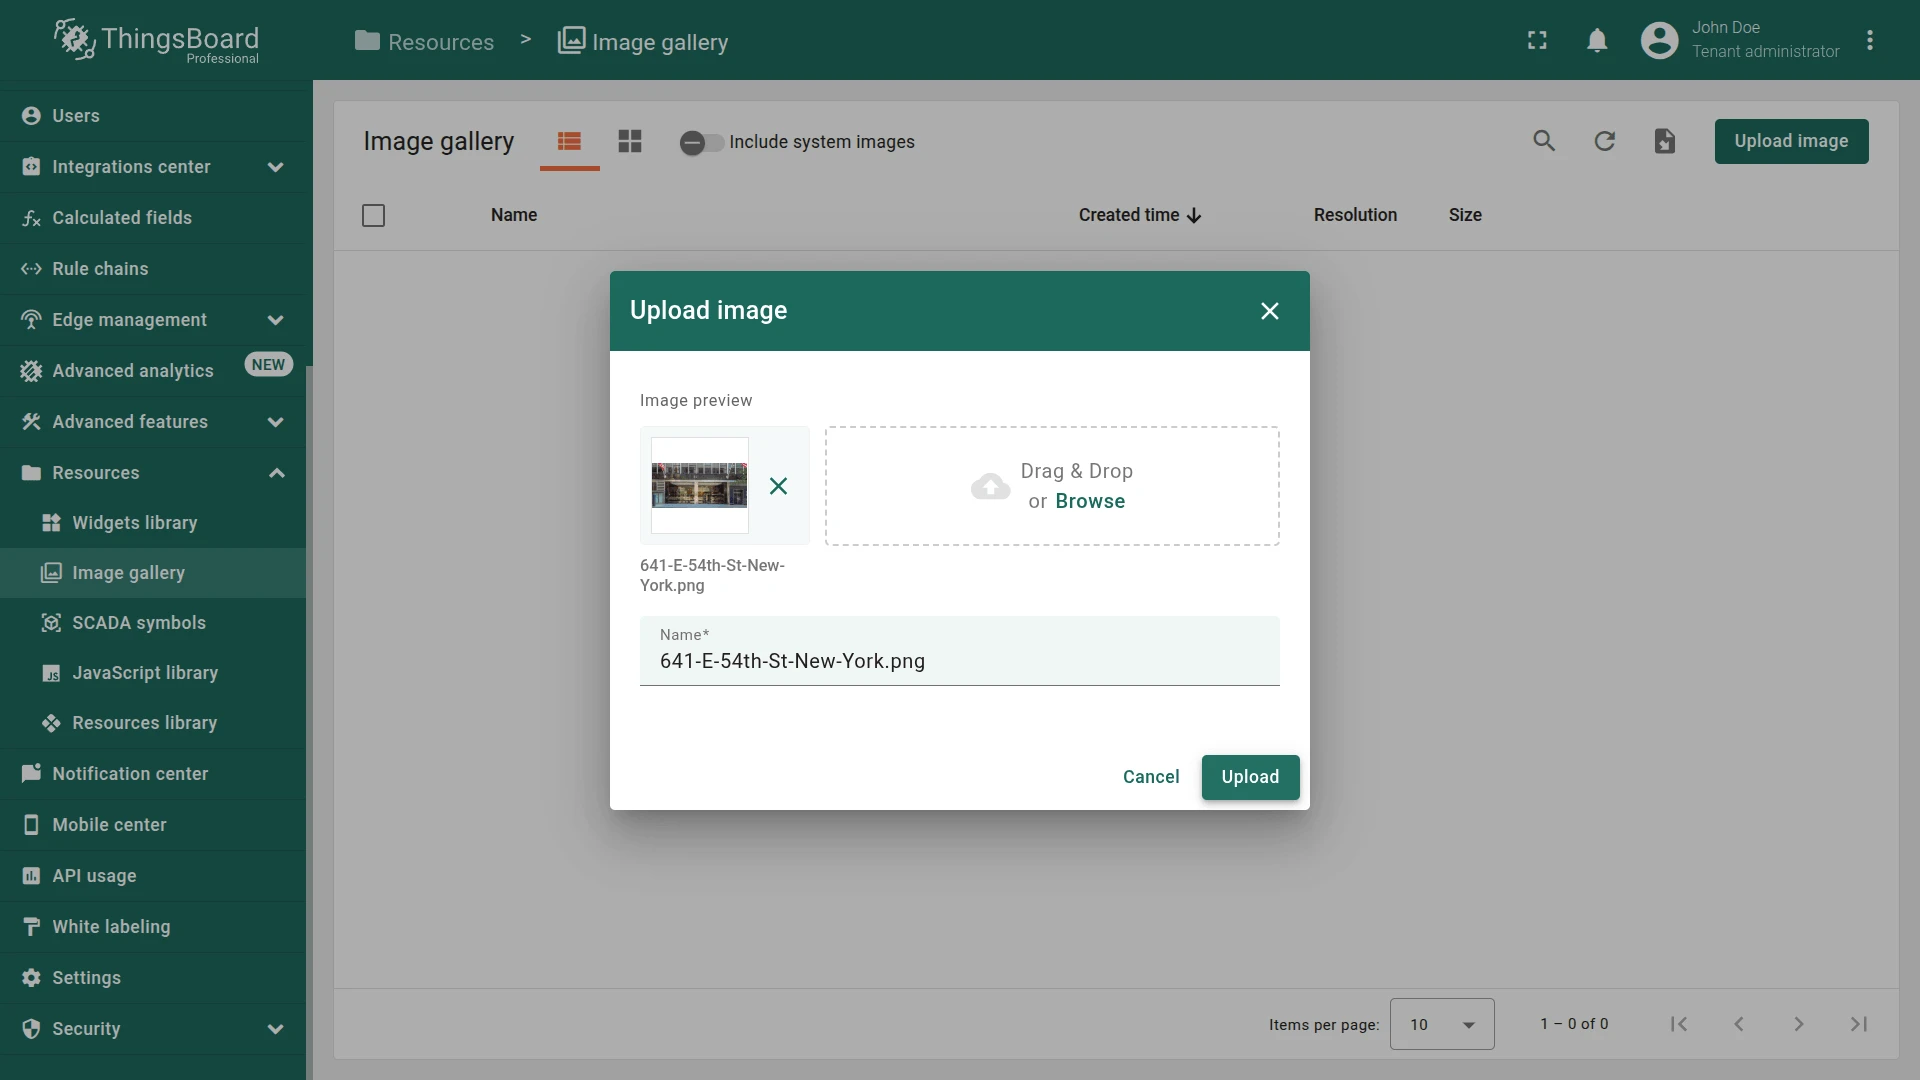
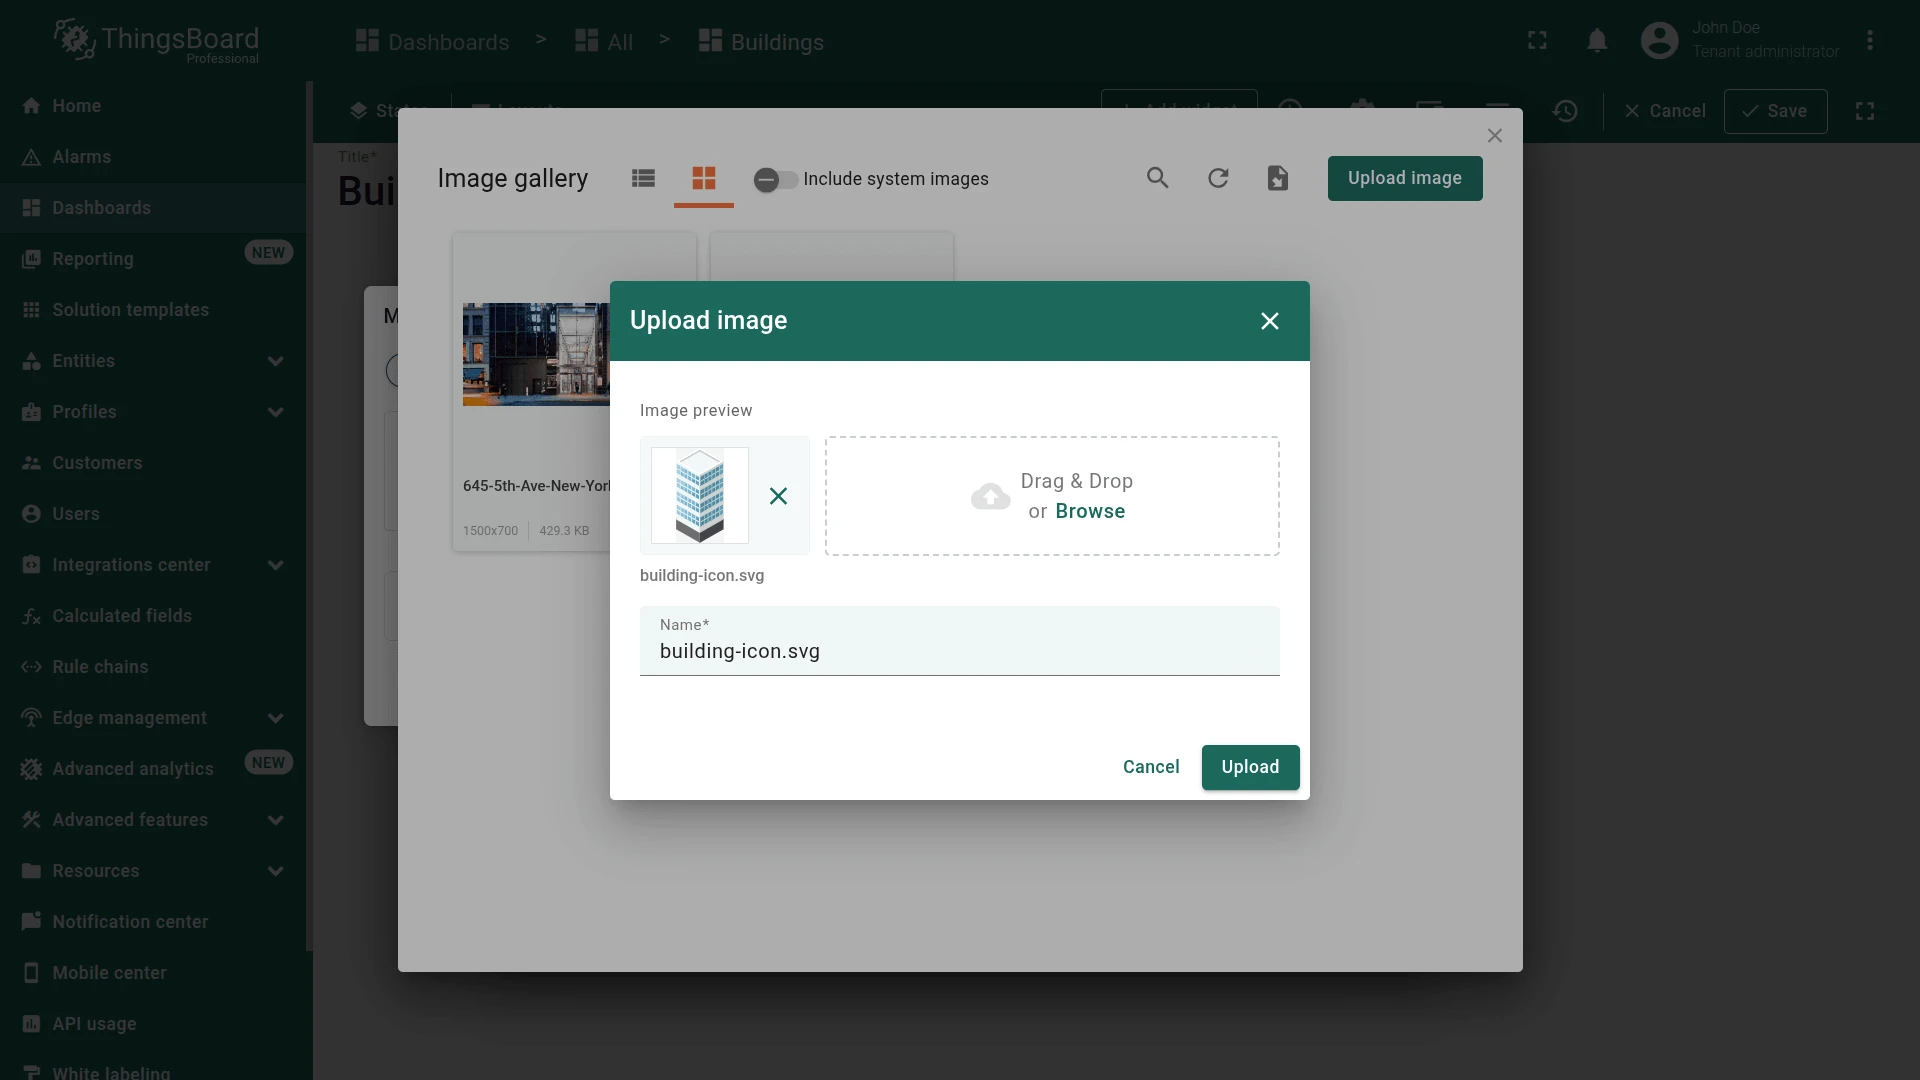
- Go to Resources ⇾ Image gallery.
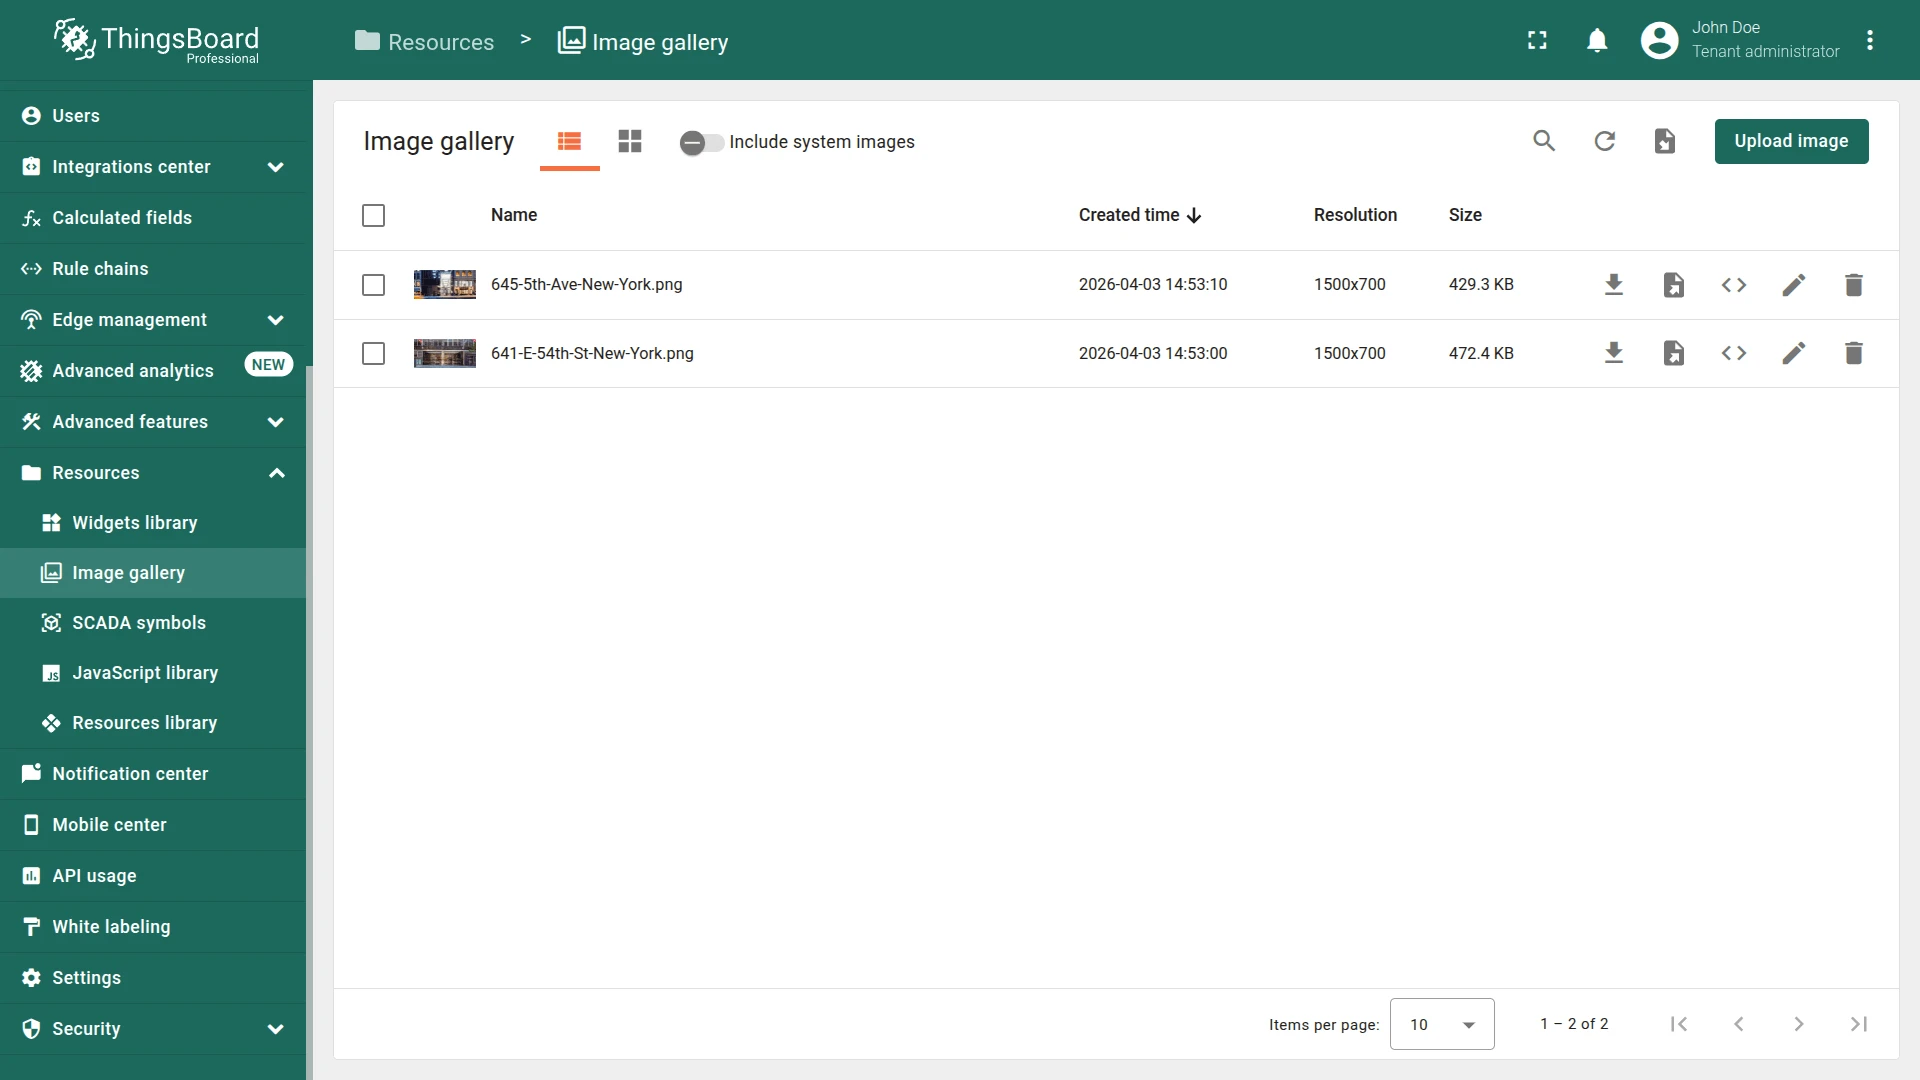
- Click Upload image and upload the photo for Building A, then for Building B.
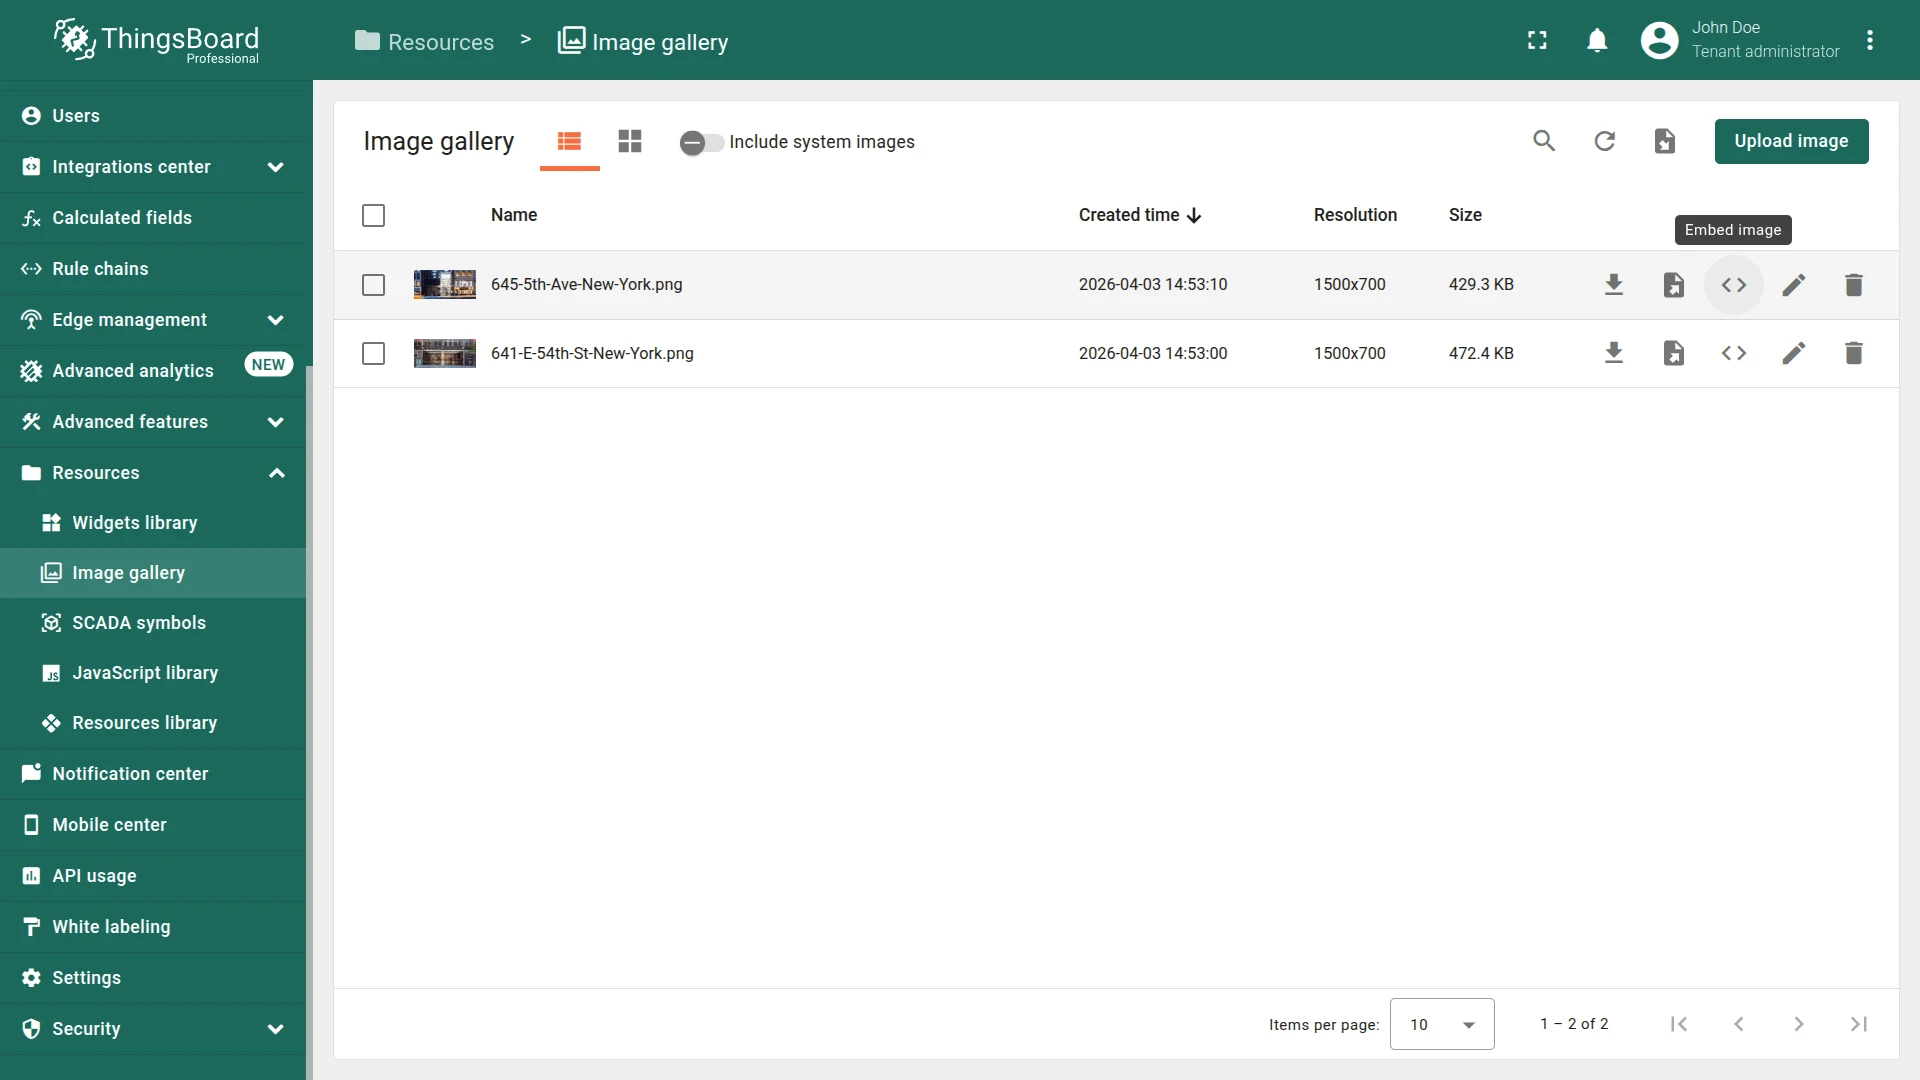
- Click the Embed image icon next to each uploaded image, copy and save the generated links. You will need these links in the next step.
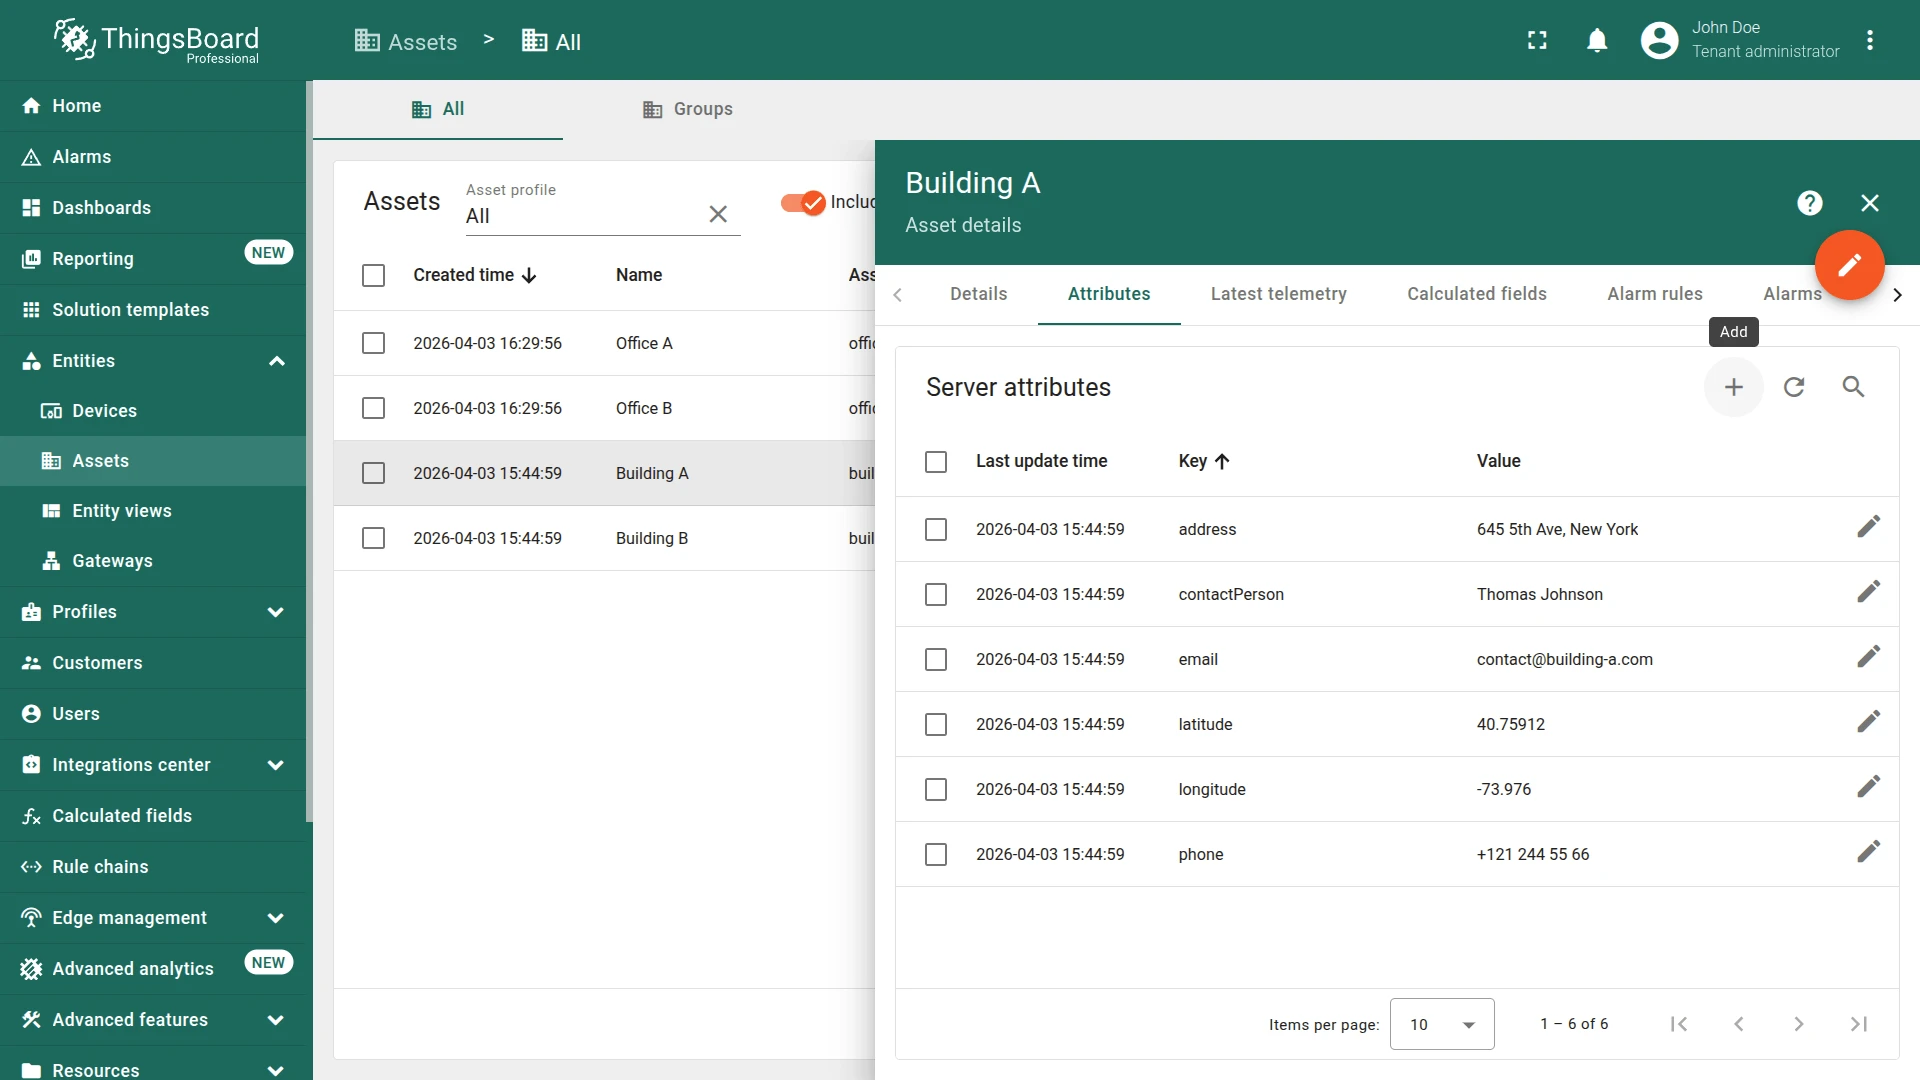
Add Image Attributes to Buildings
Section titled “Add Image Attributes to Buildings”Add the appropriate image URL for Building A and Building B as the buildingImage server attribute.
- Go to the Assets, open the Building A details and navigate to the Attributes tab.
- Click + and add an attribute with the image URL corresponding to this building.
- Repeat the same for Building B, using its corresponding image URL.


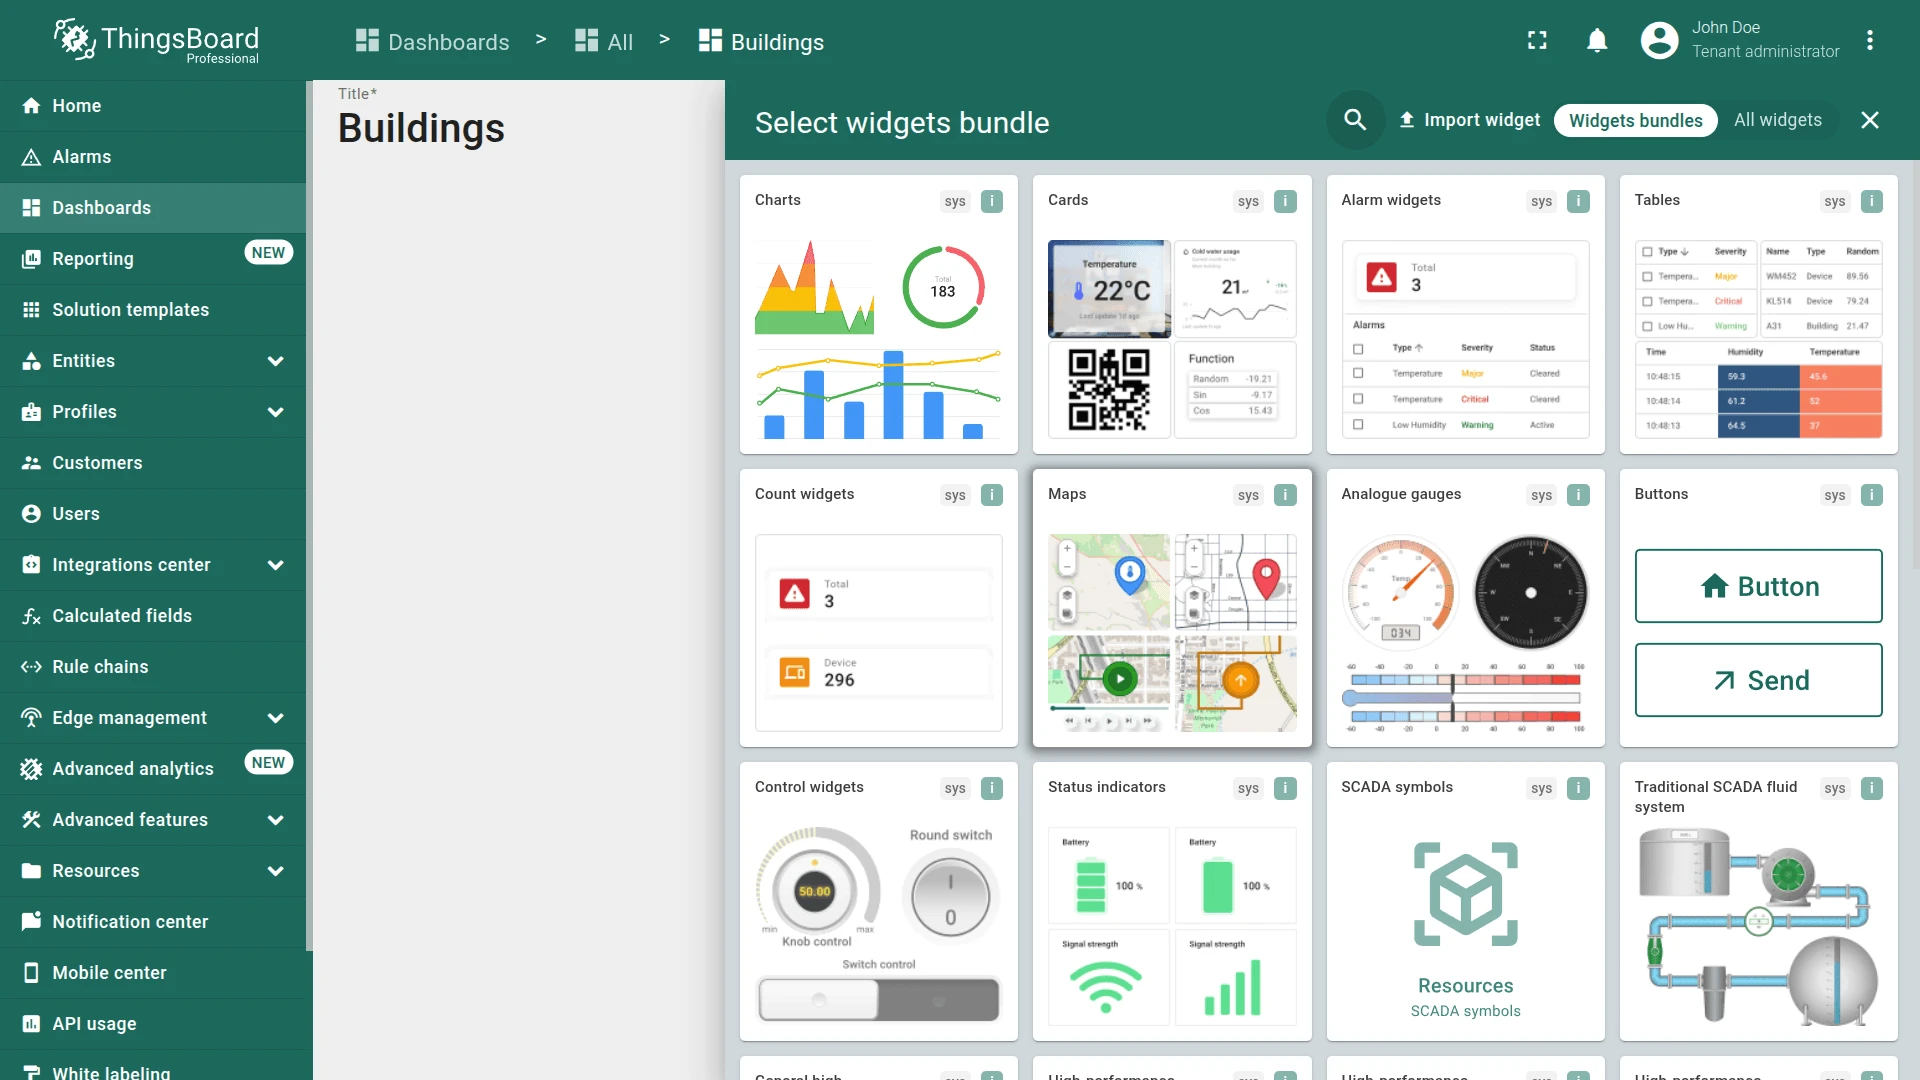
Add the Widget
Section titled “Add the Widget”With images uploaded and attributes set, add the OpenStreet Map widget to the dashboard.
- Navigate to Dashboards ⇾ Buildings.
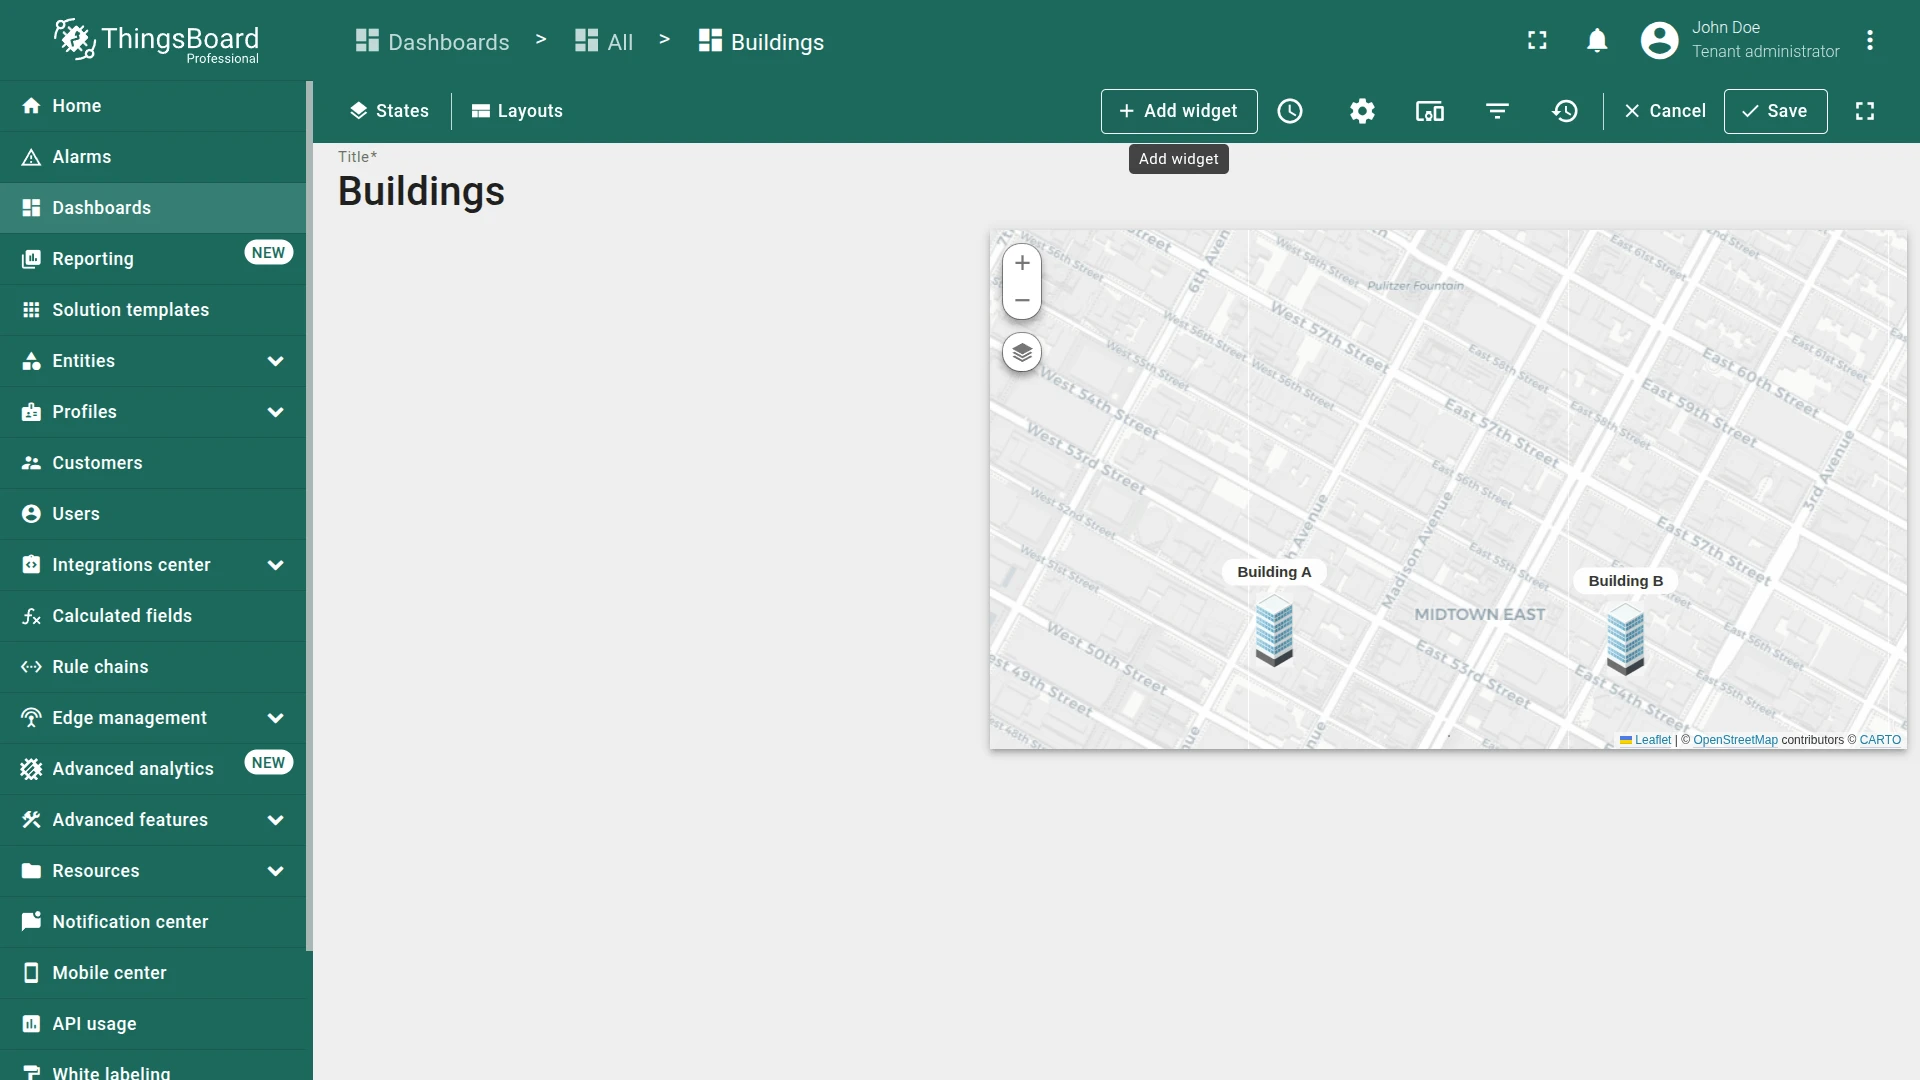
- Click + Add widget.
- Open the Buildings dashboard, enter edit mode, and click Add widget.
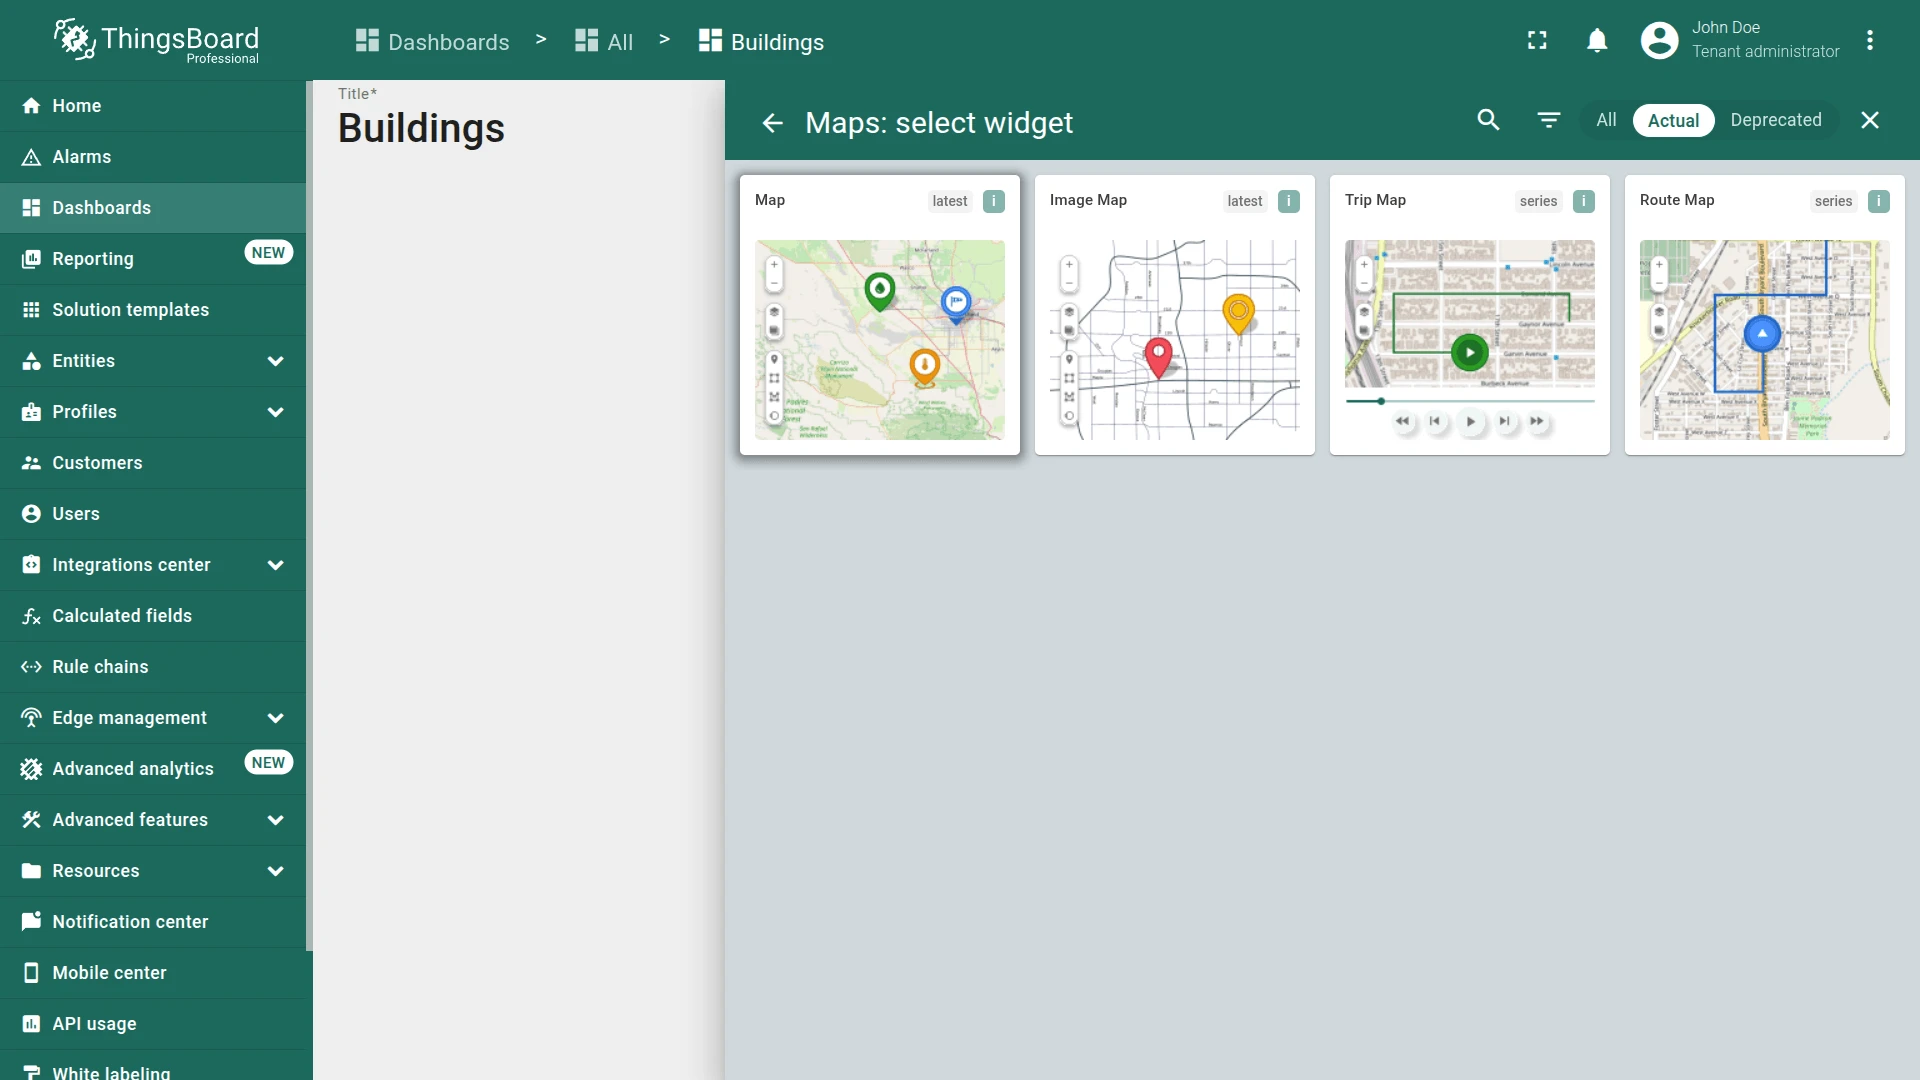
- Select Maps ⇾ Map.
- Open the widget configuration and switch to the Advanced tab.
- Select Positron layer for OpenStreet map type.
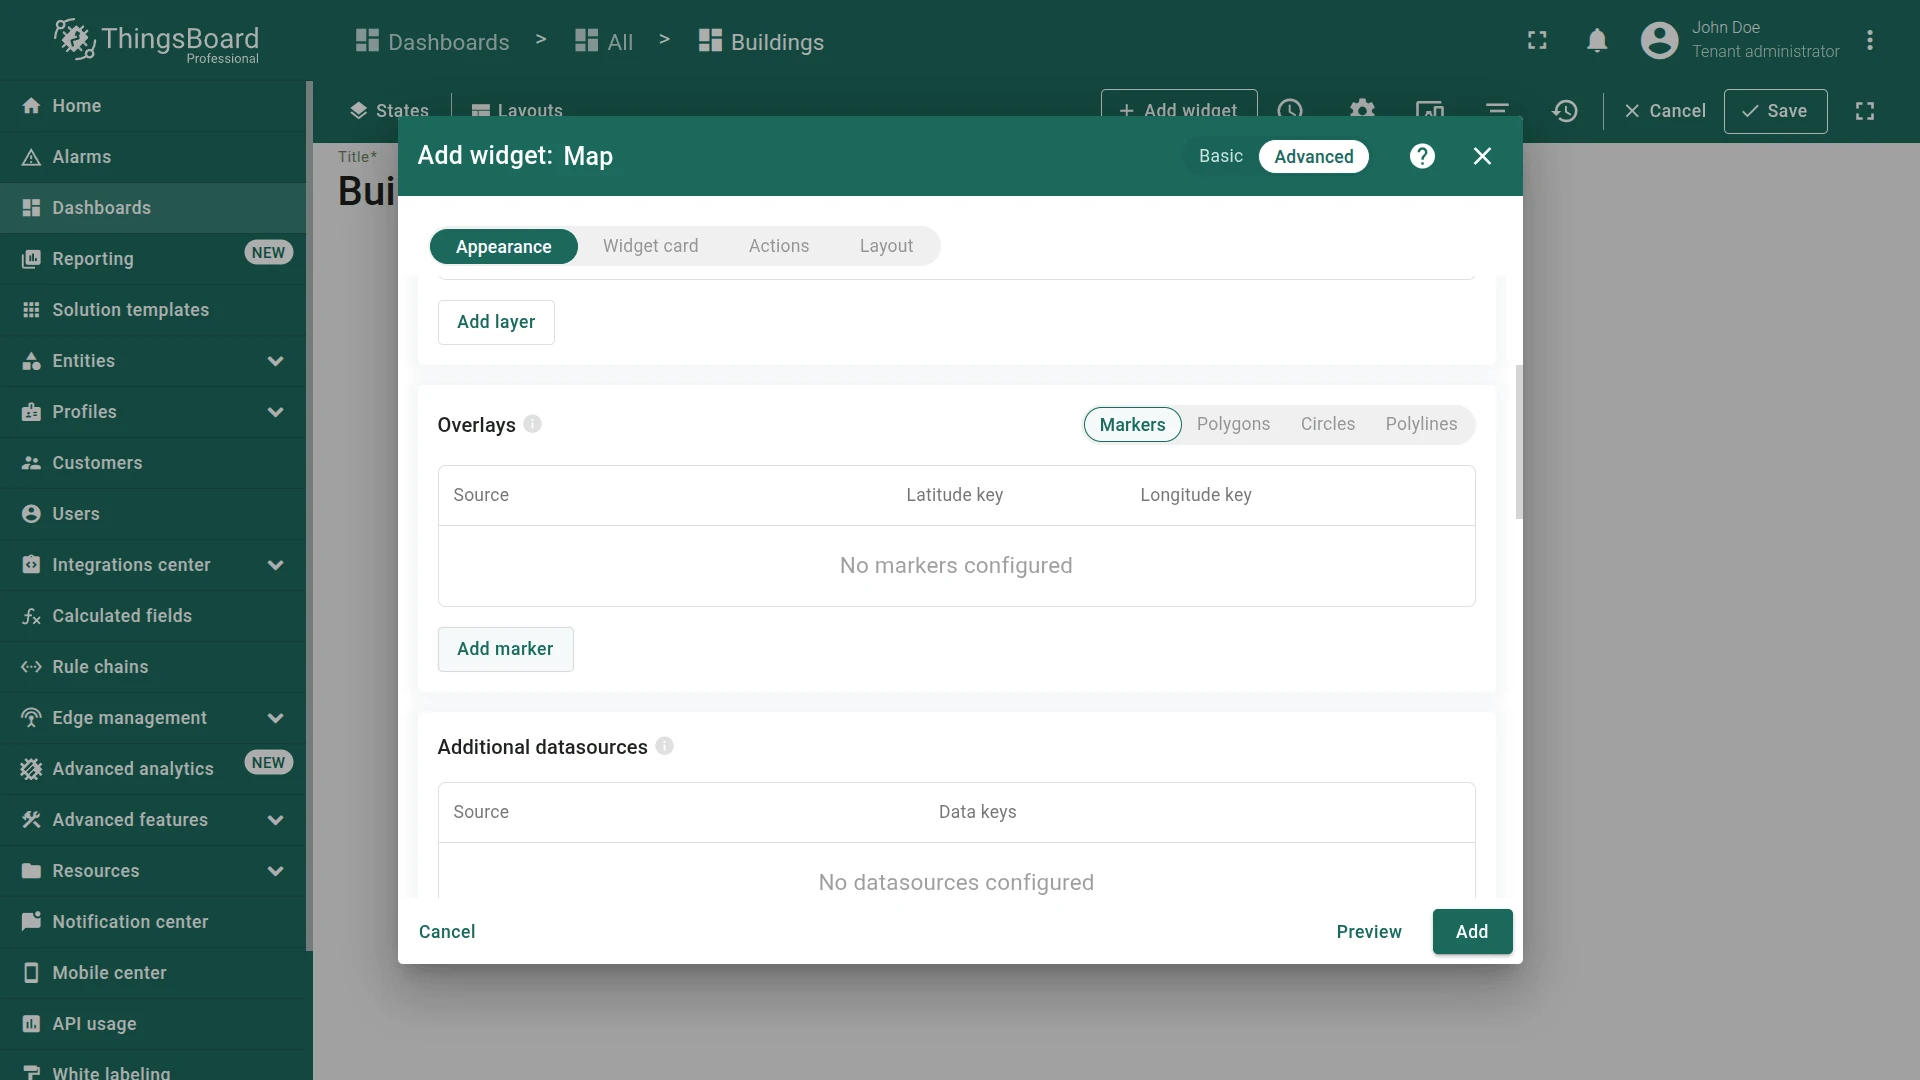
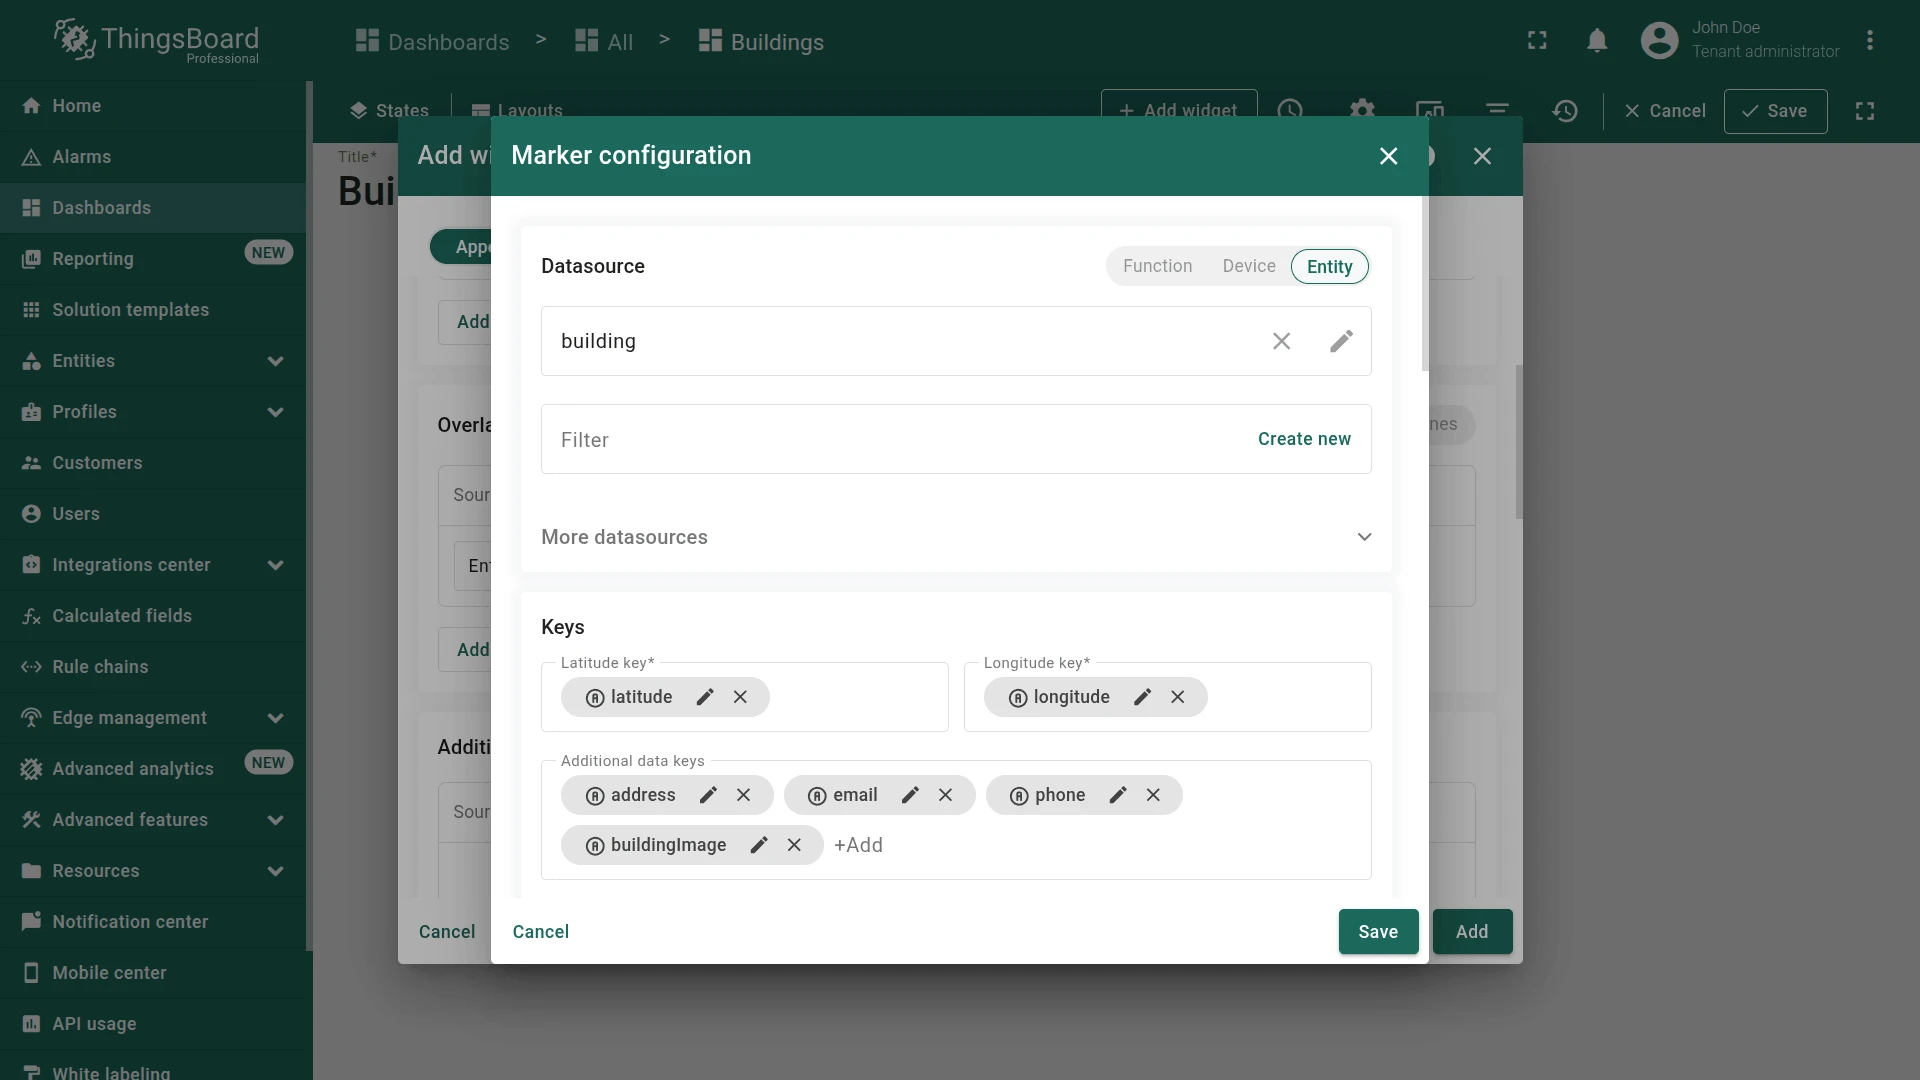
- Scroll to the Overlays section and click Add marker on the Markers tab.
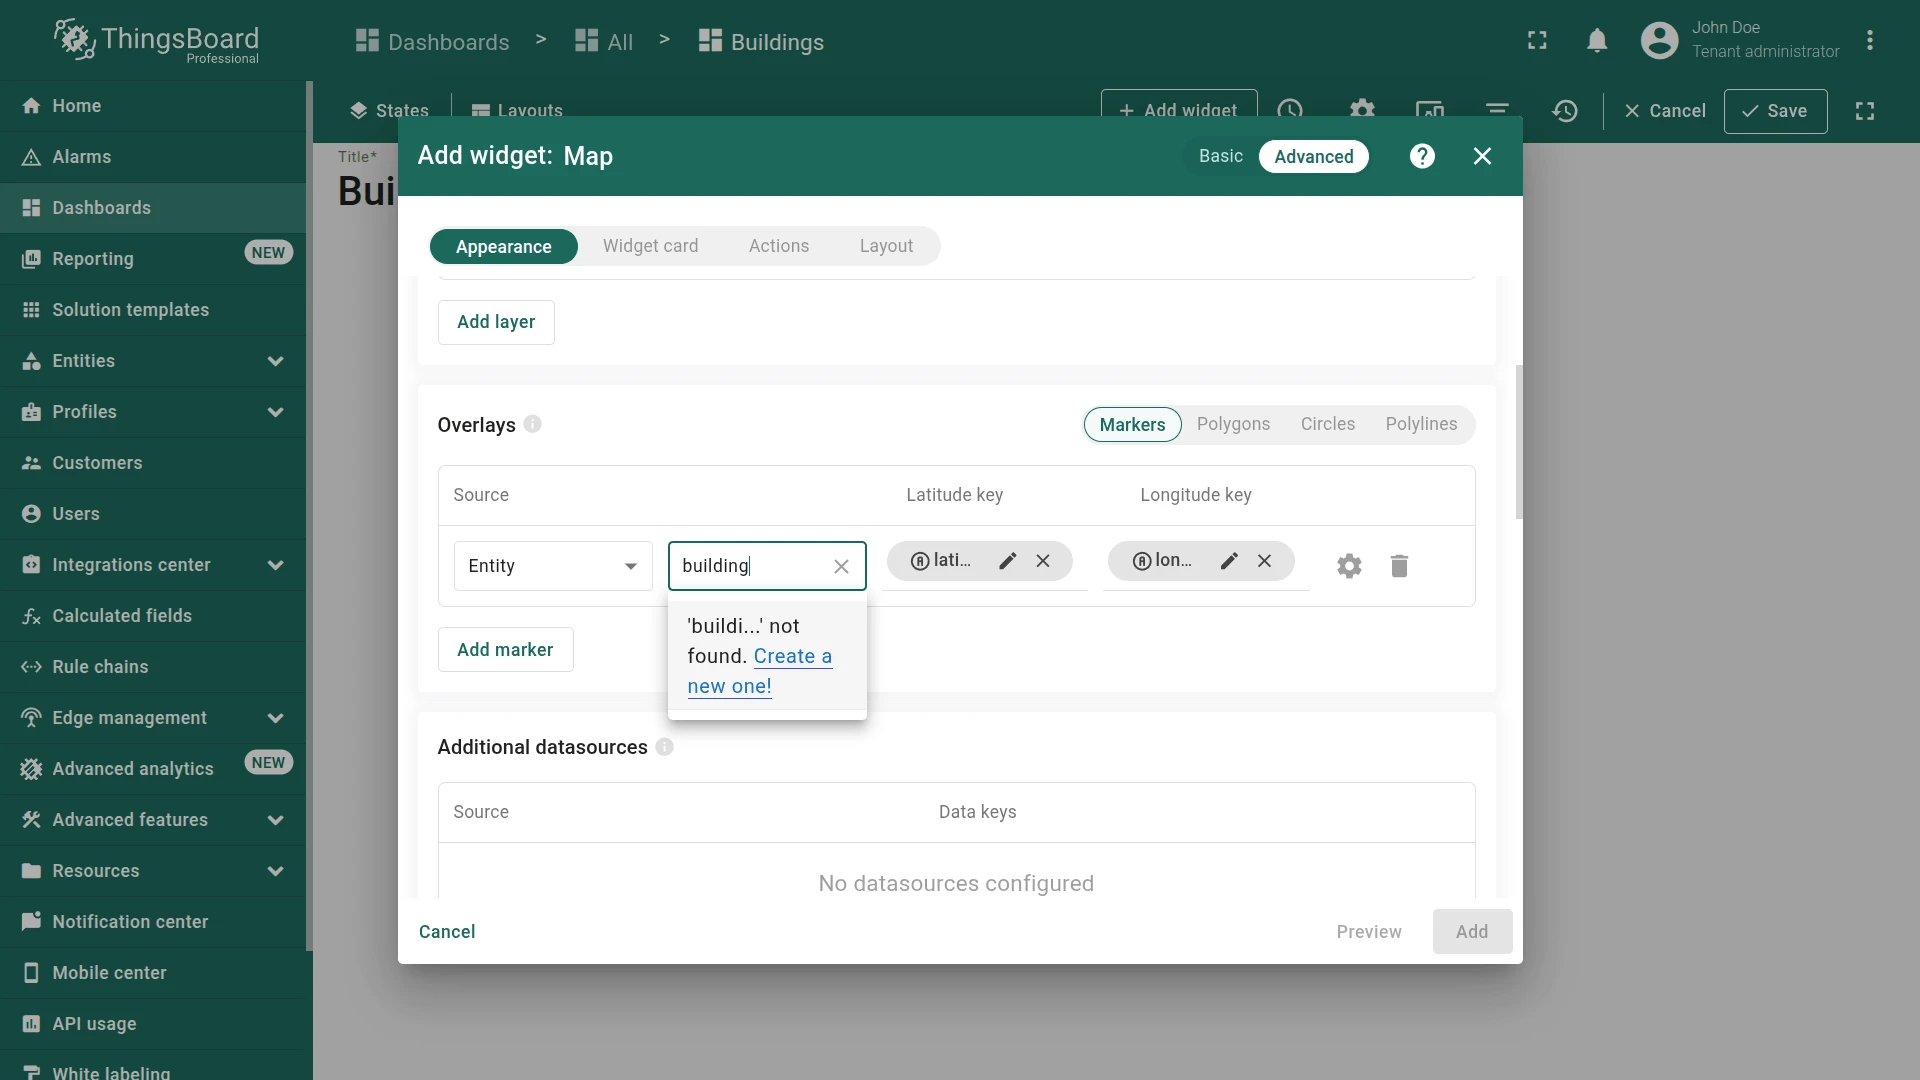
- Set Source to Entity, enter building as entity alias name, and click Create a new one!.
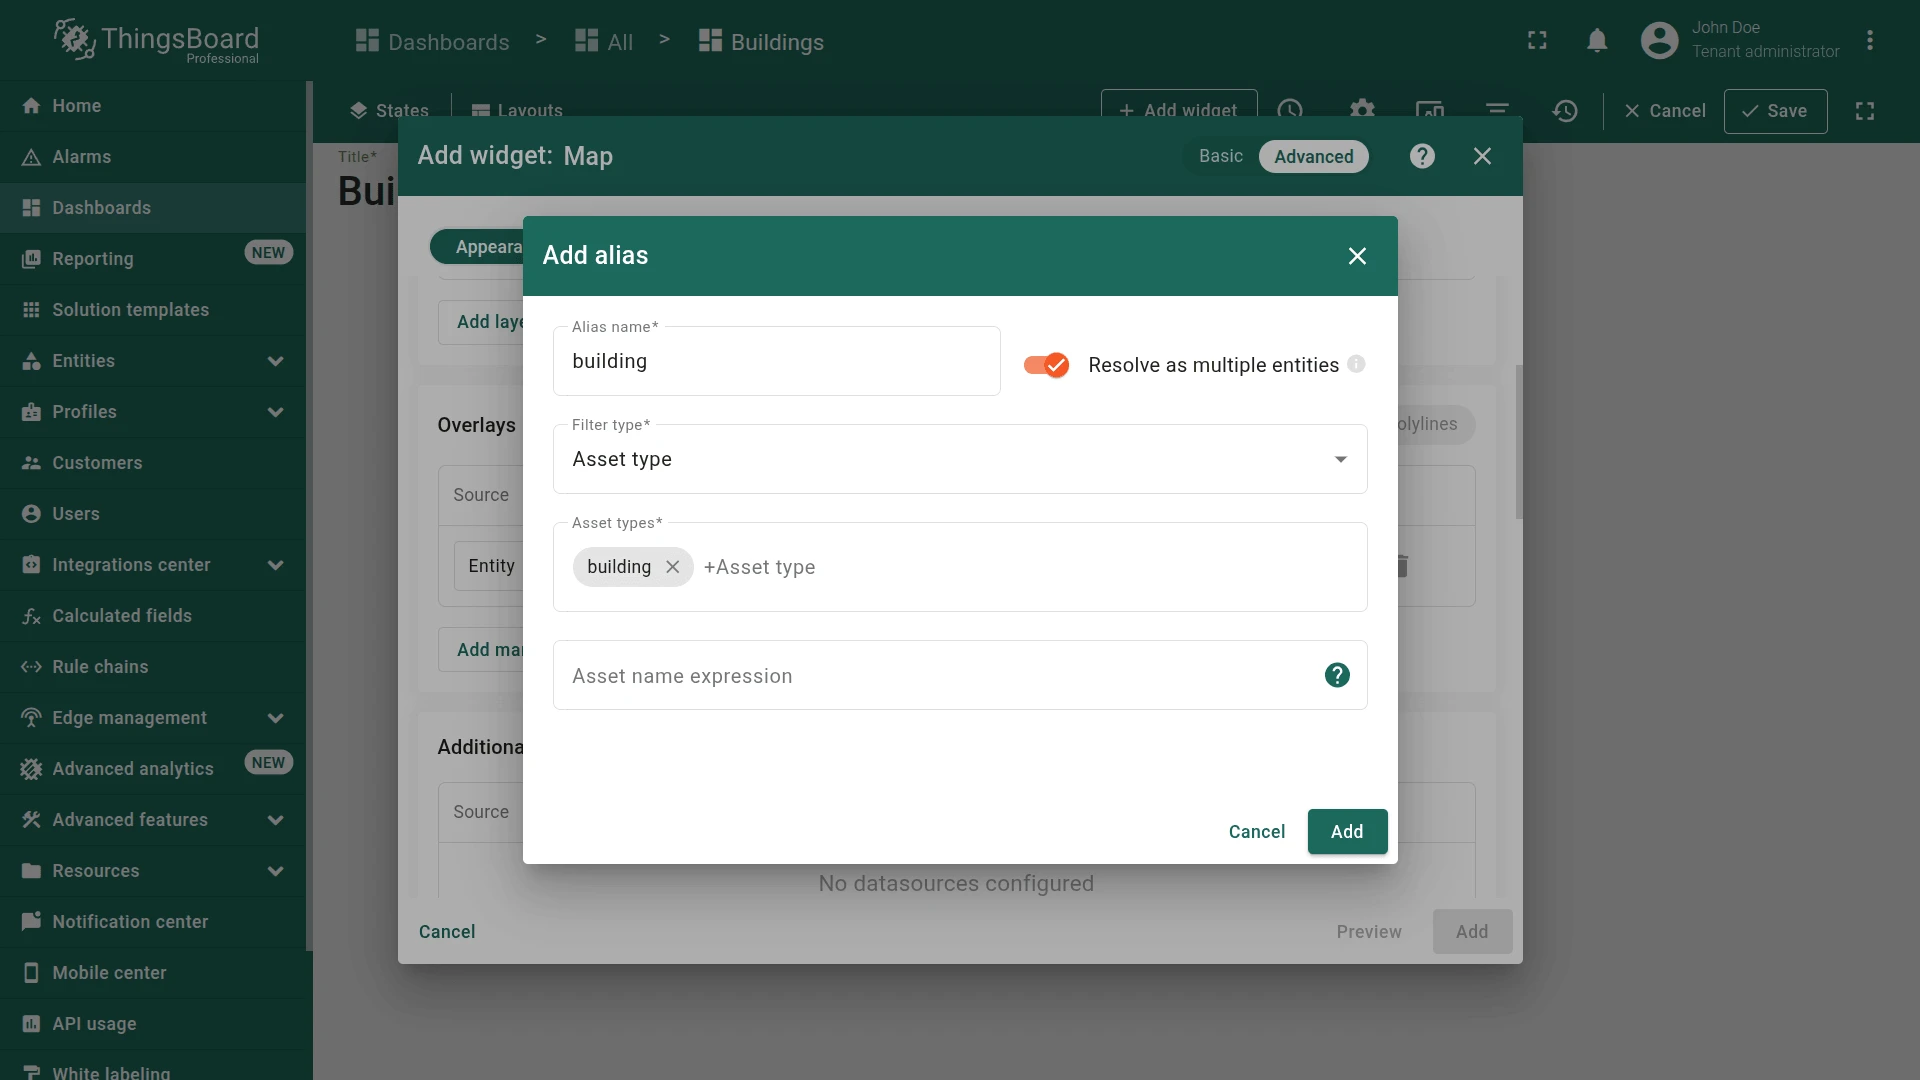
- Create alias:
- Set filter type to Asset type
- Specify asset type to building
- Click Add
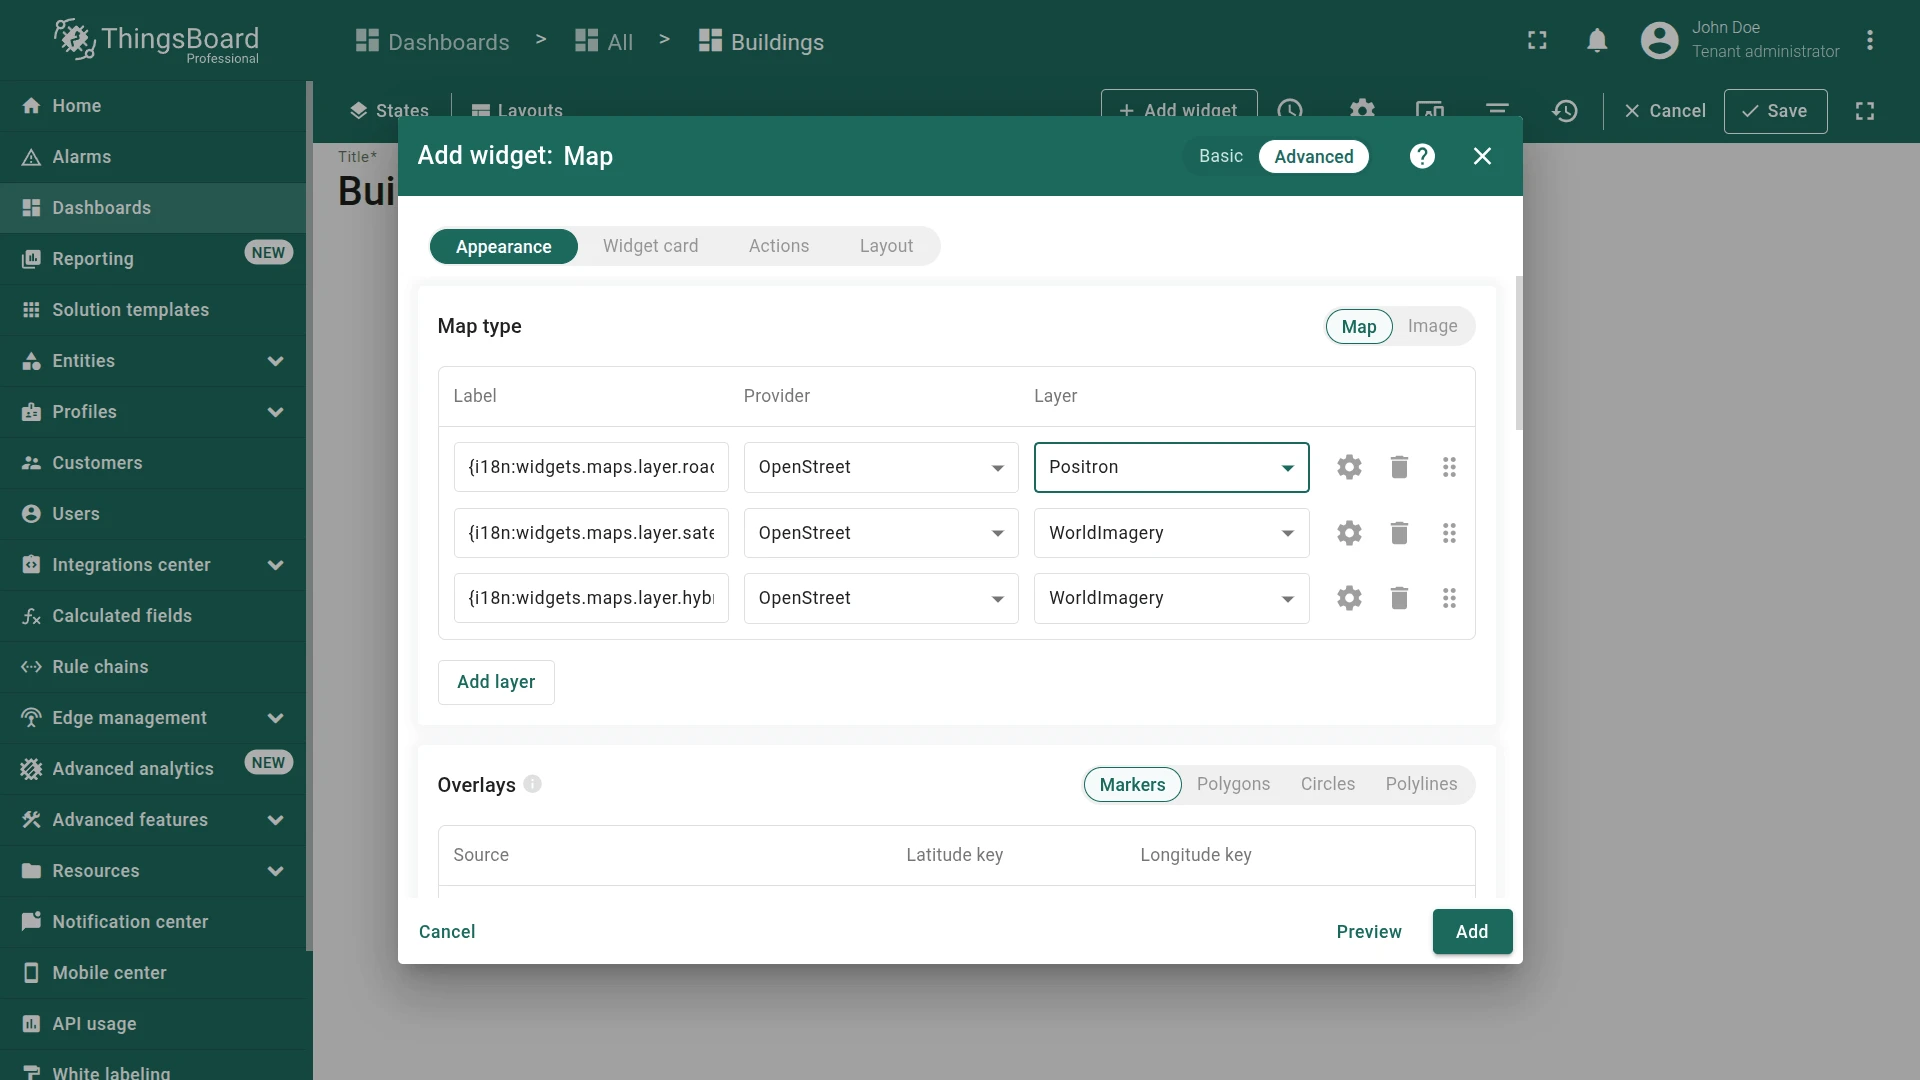
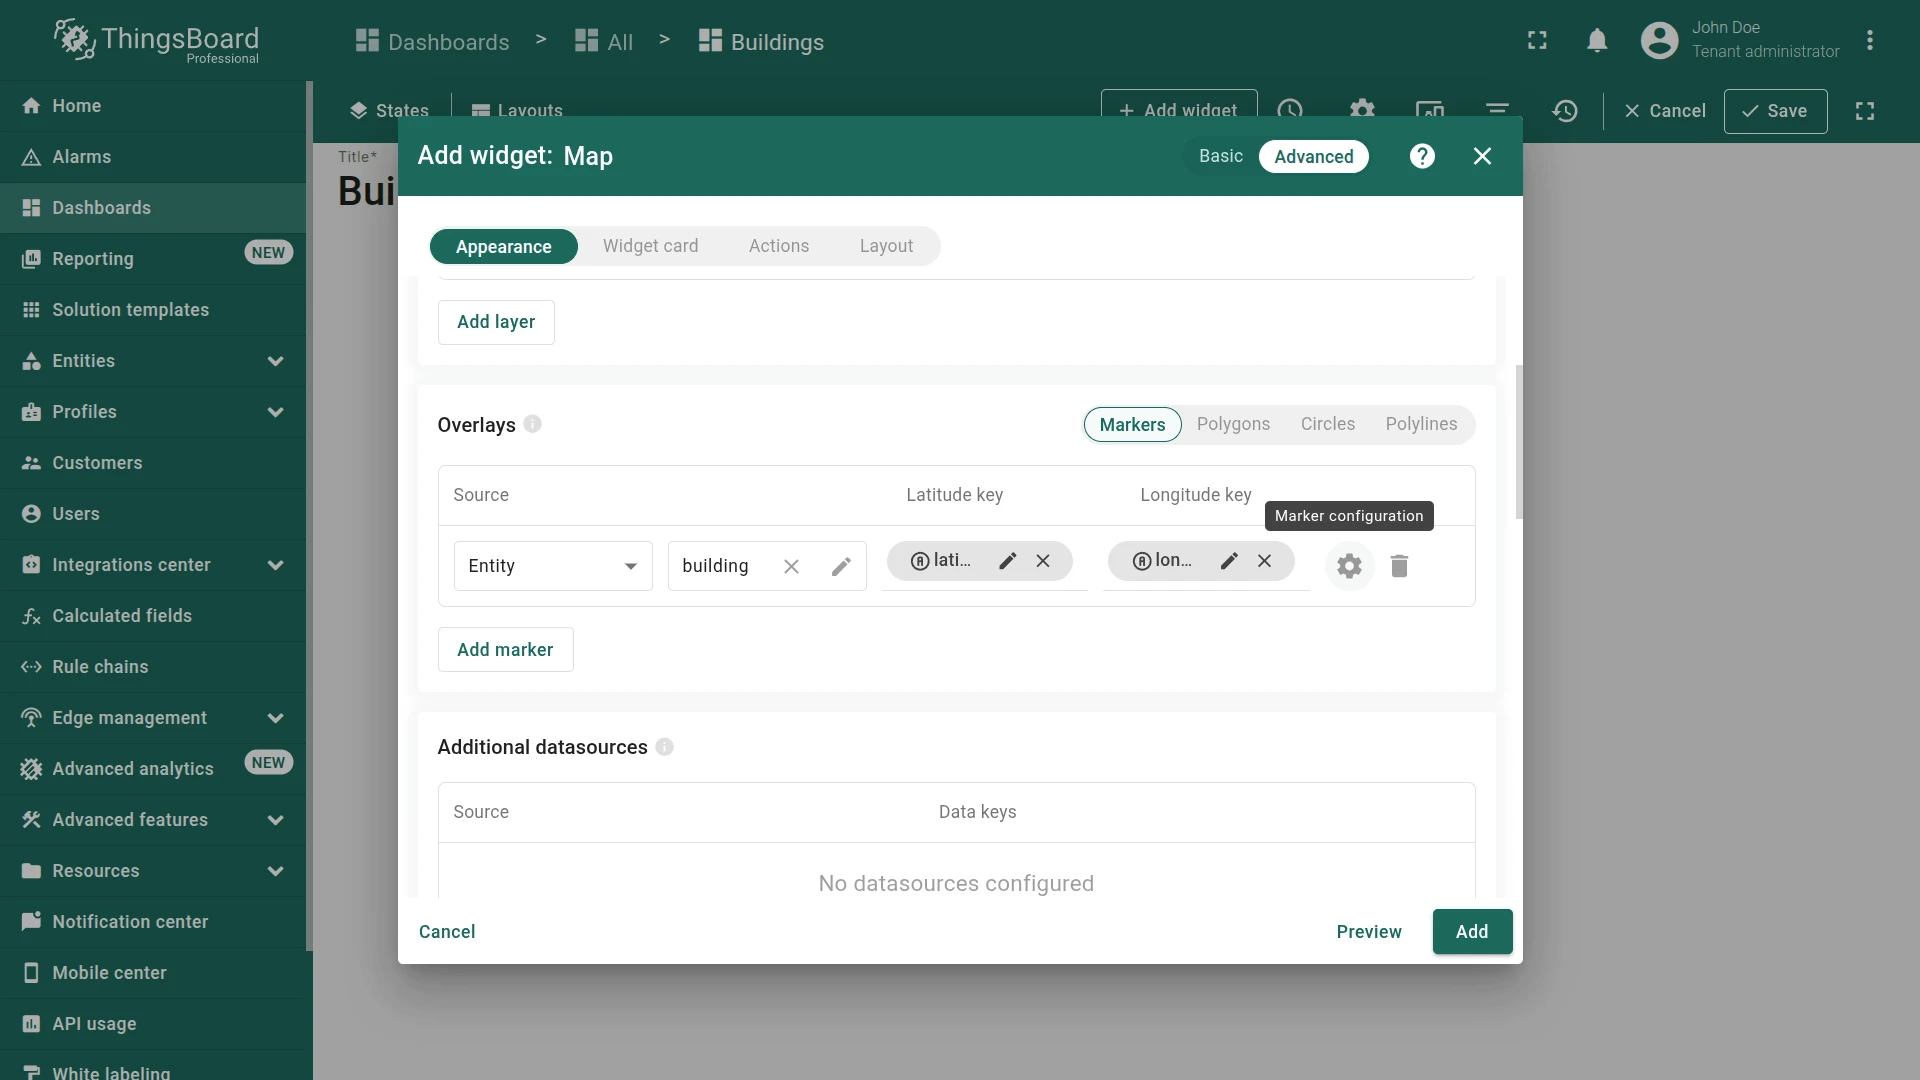
- Open marker configuration and verify that the marker uses the building alias and latitude/longitude keys are set.
- Configure data keys, including latitude, longitude, and add additional data keys:
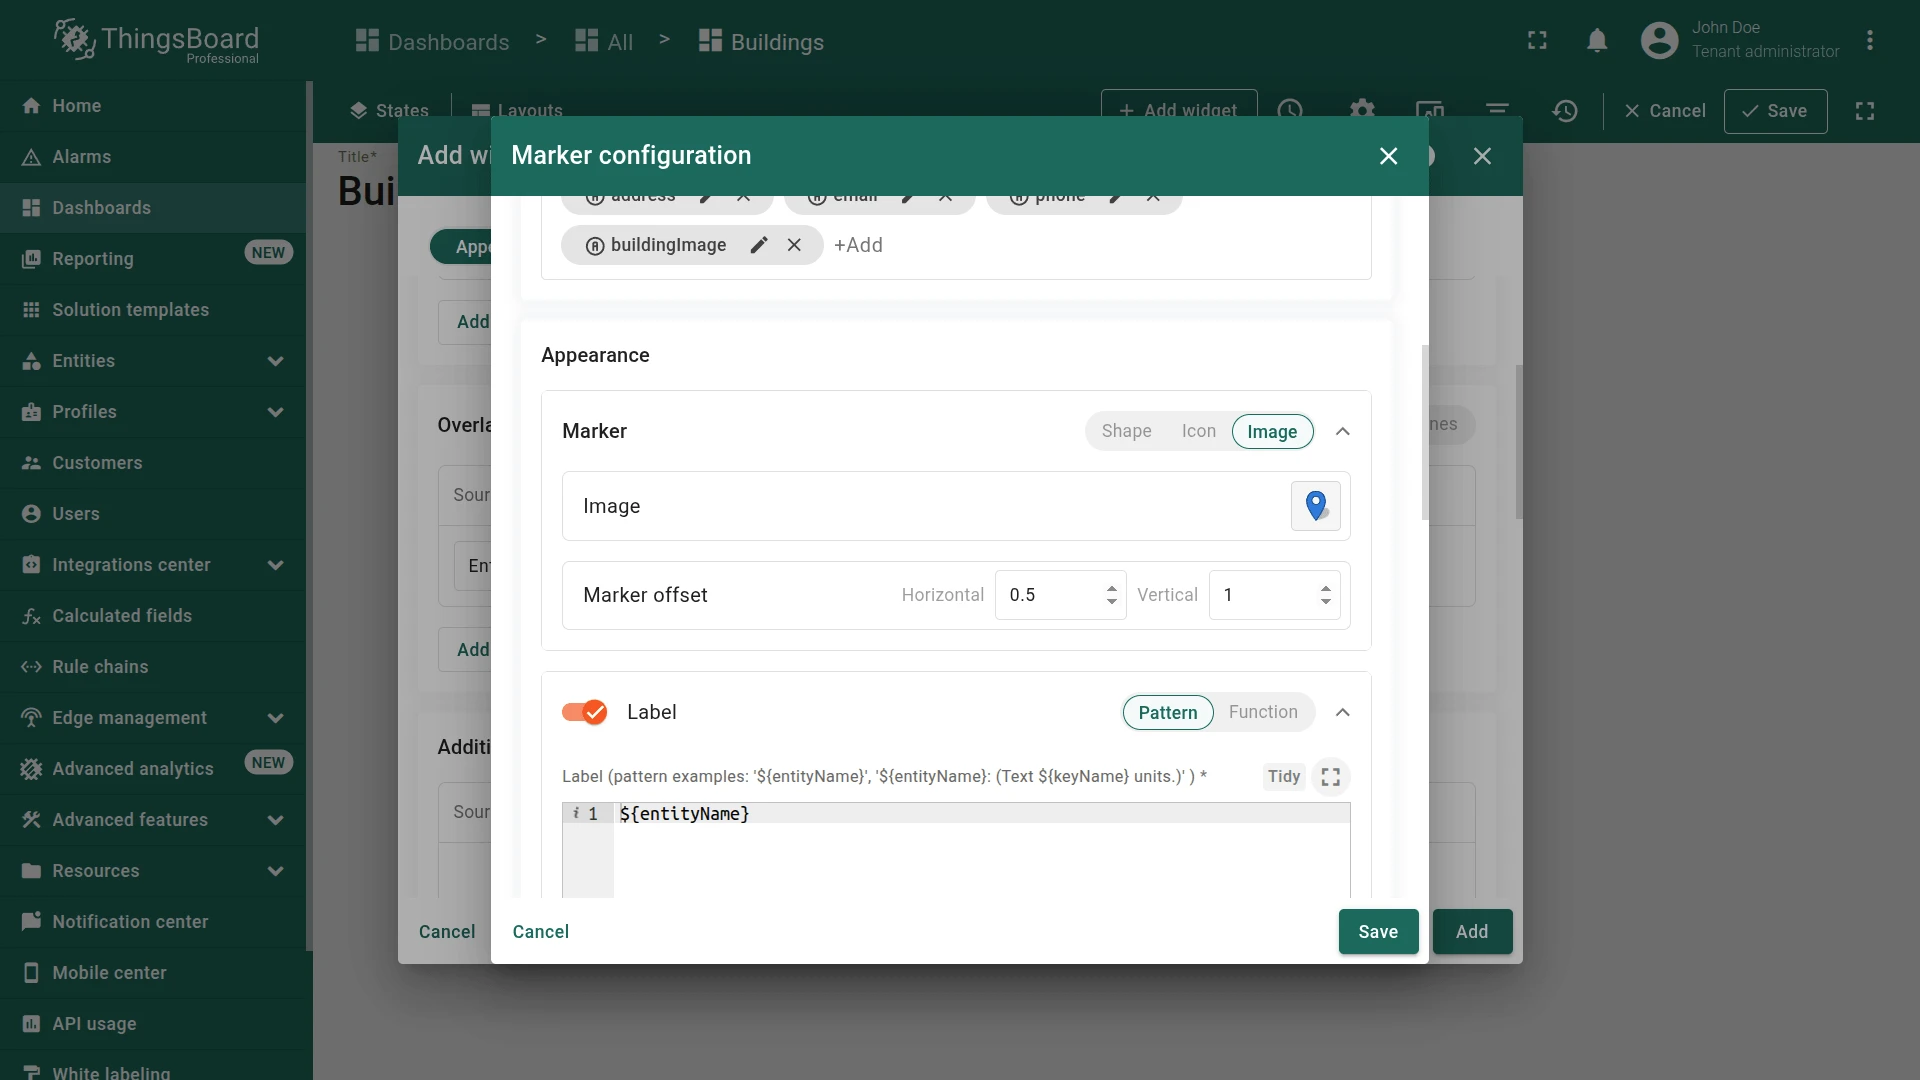
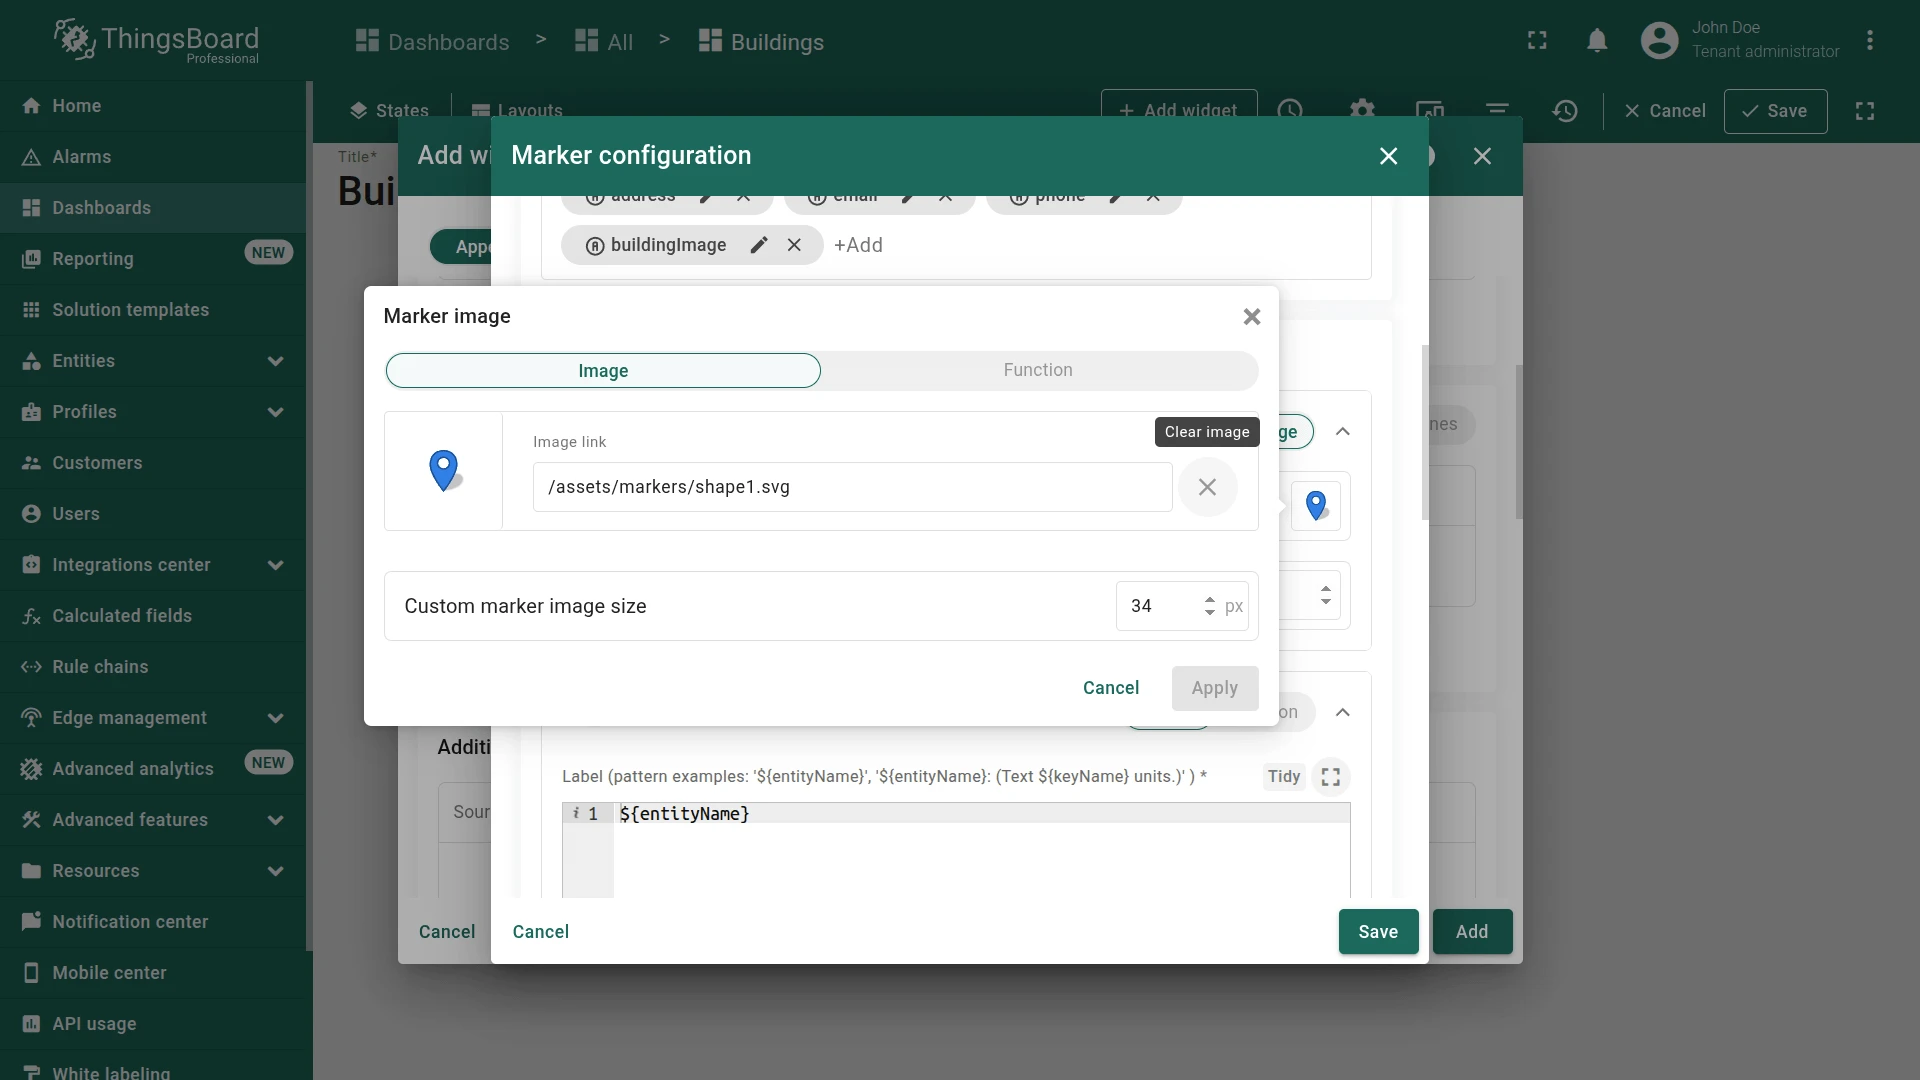
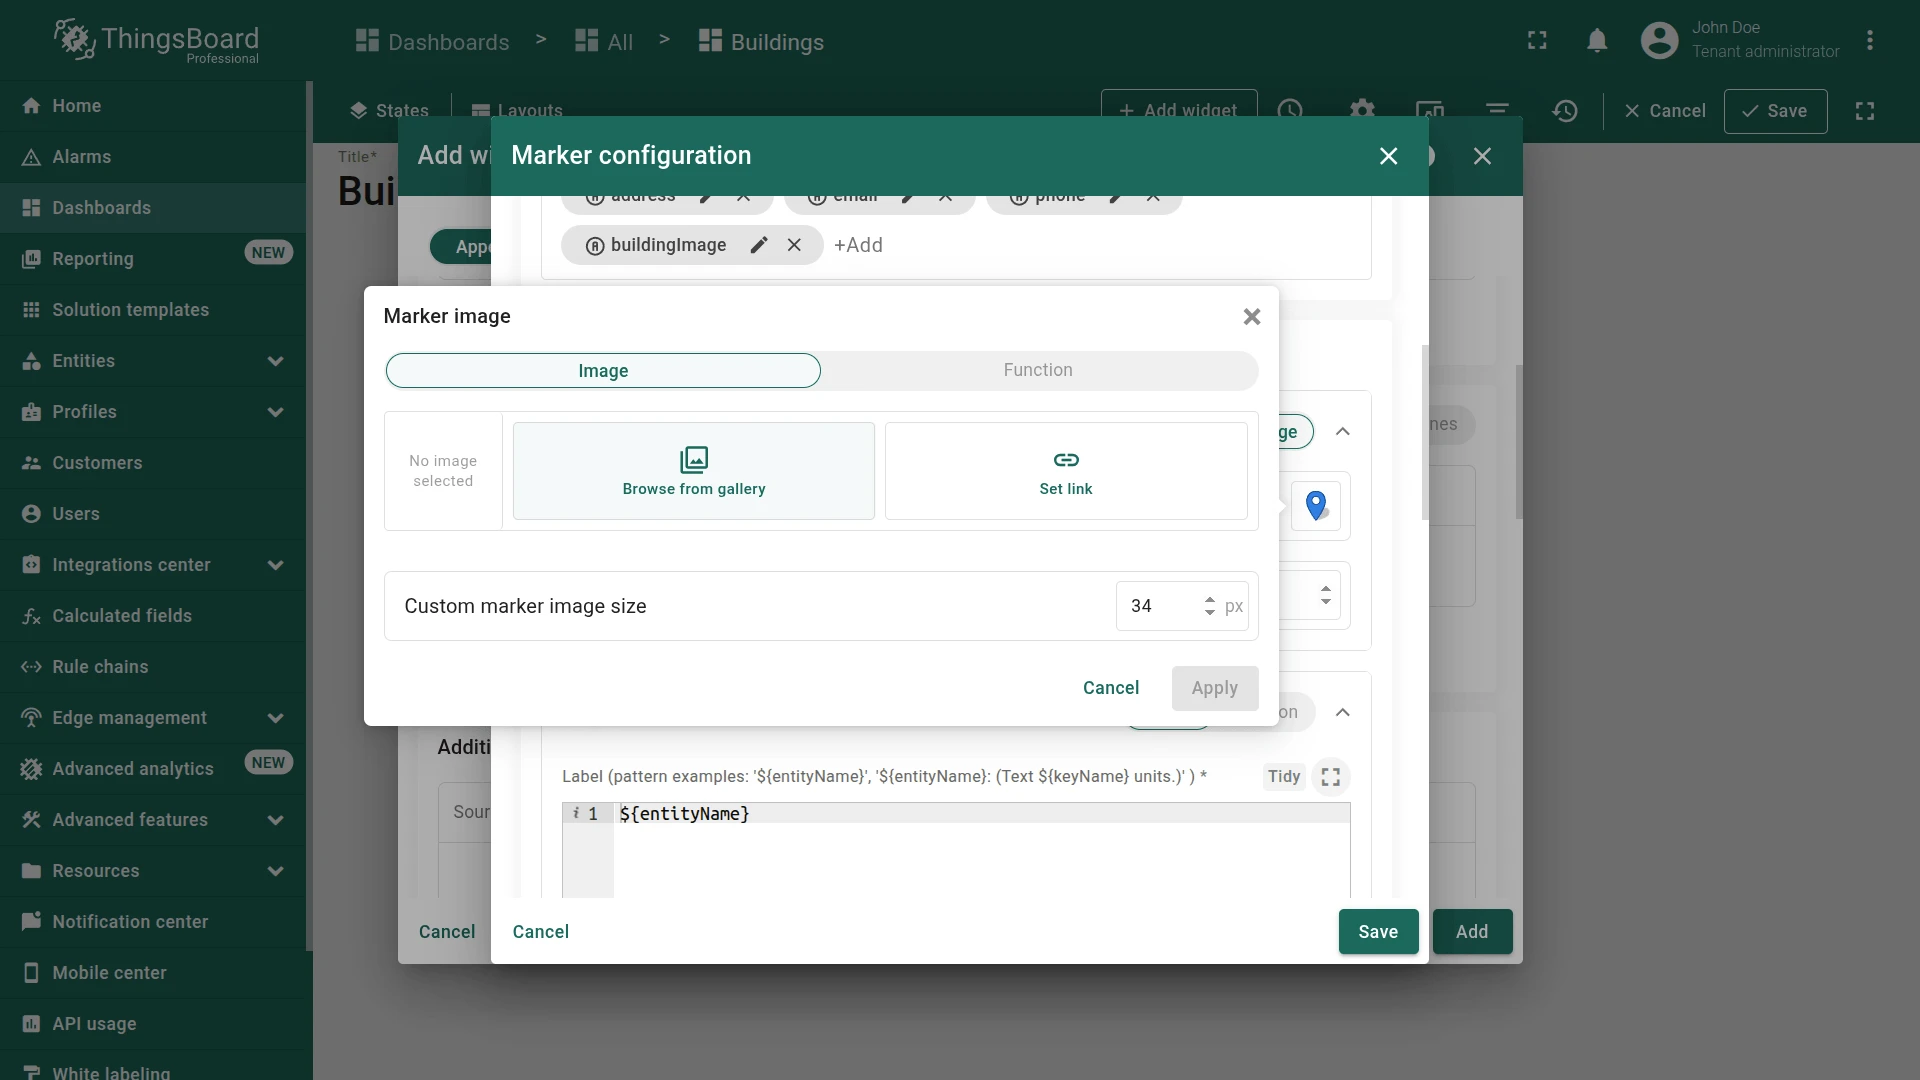
address,email,phone, andbuildingImage. - In the Appearance section, use an image as the marker:
- Download the image from the provided link
- Upload it to Image gallery and use
- Set the marker size to 60 pixels
- Click Apply
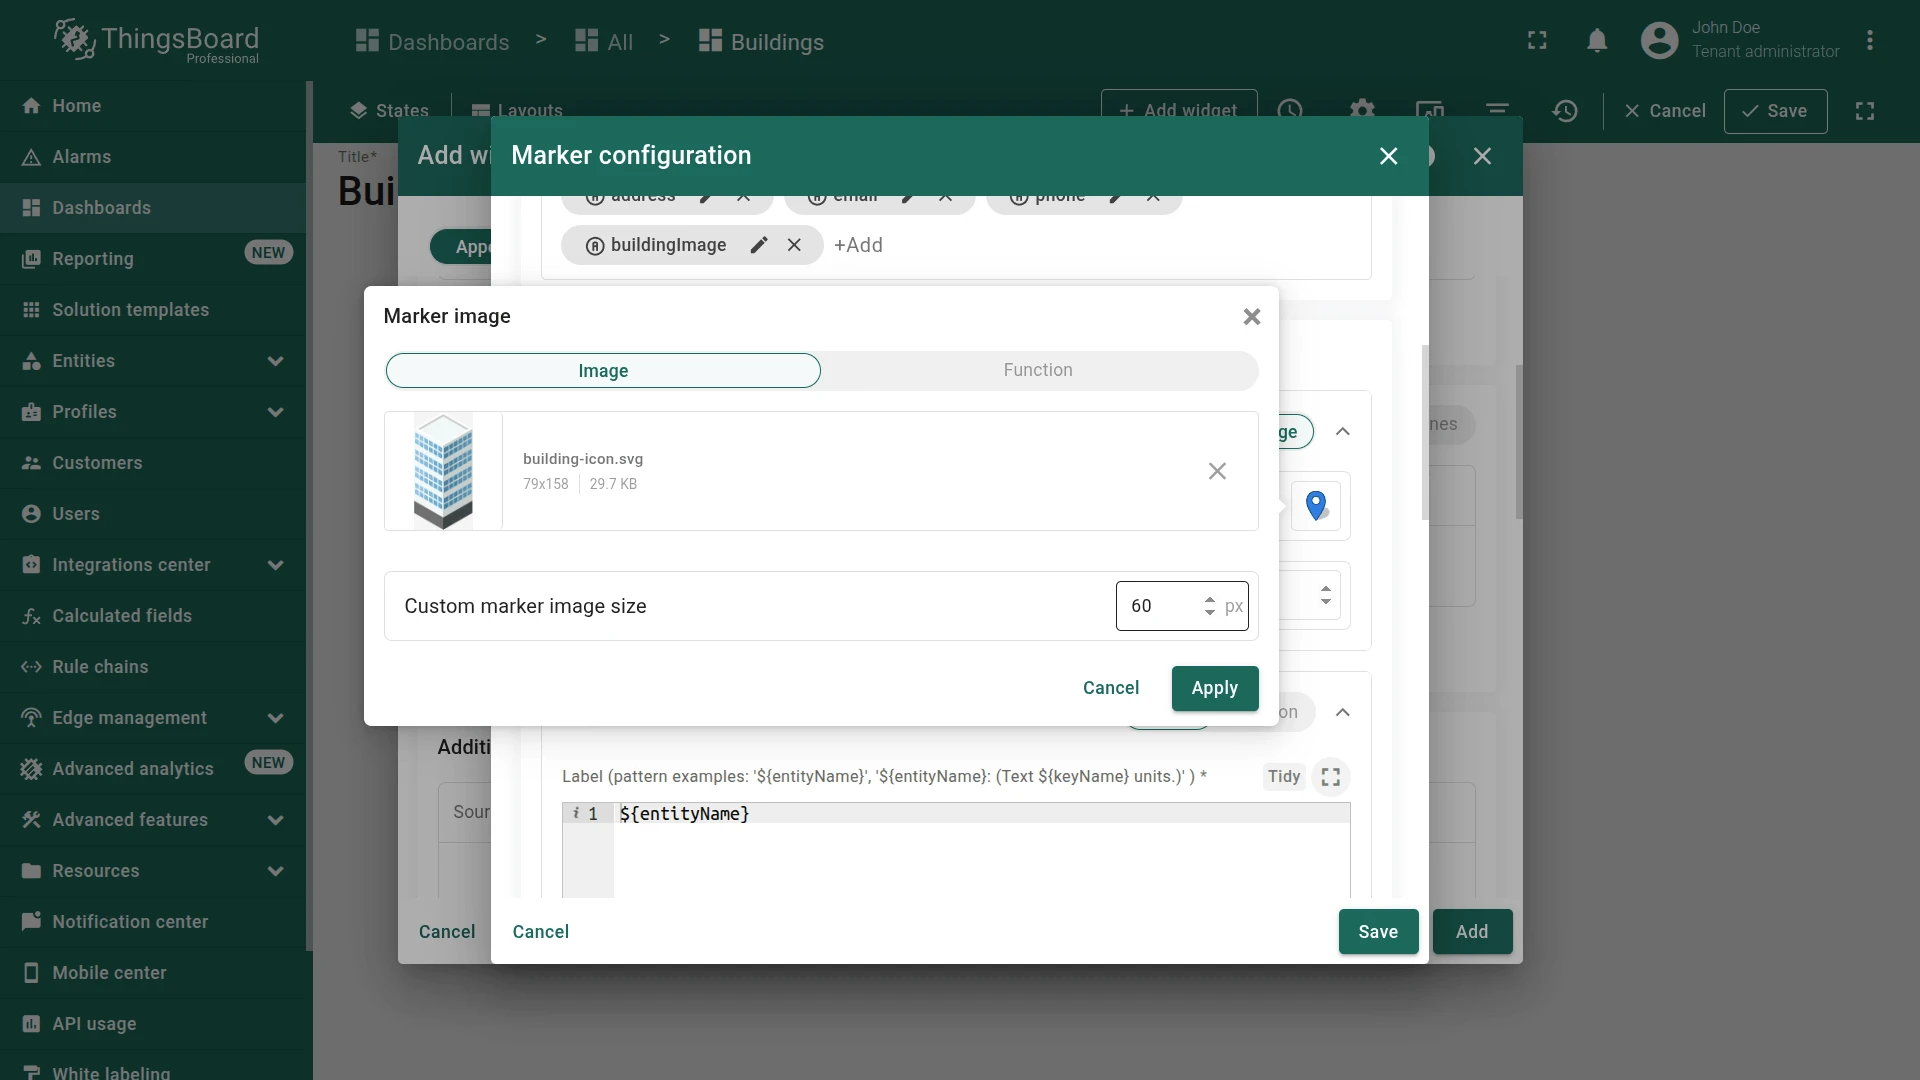
-
Verify that the custom marker image is applied.
-
Configure the marker label to display the entity name.
<div style="position: relative; white-space: nowrap; text-align: center; font-size: 12px; top: -5px;"><span style="border-radius: 10px; background-color: #fff; padding: 4px 12px;">${entityName}</span></div>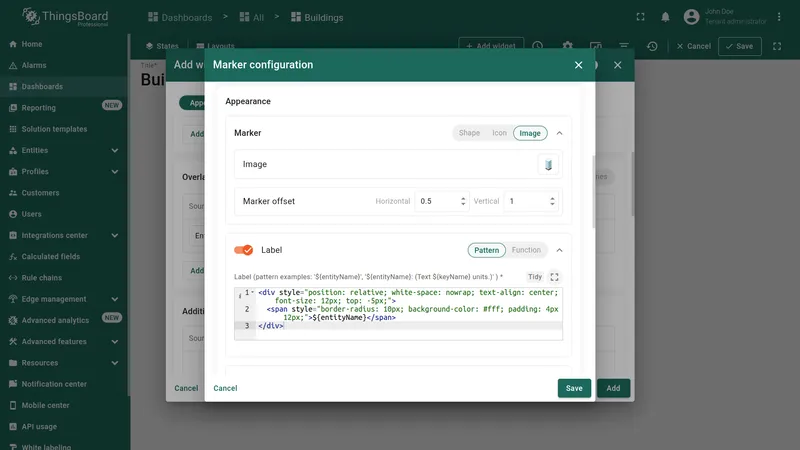

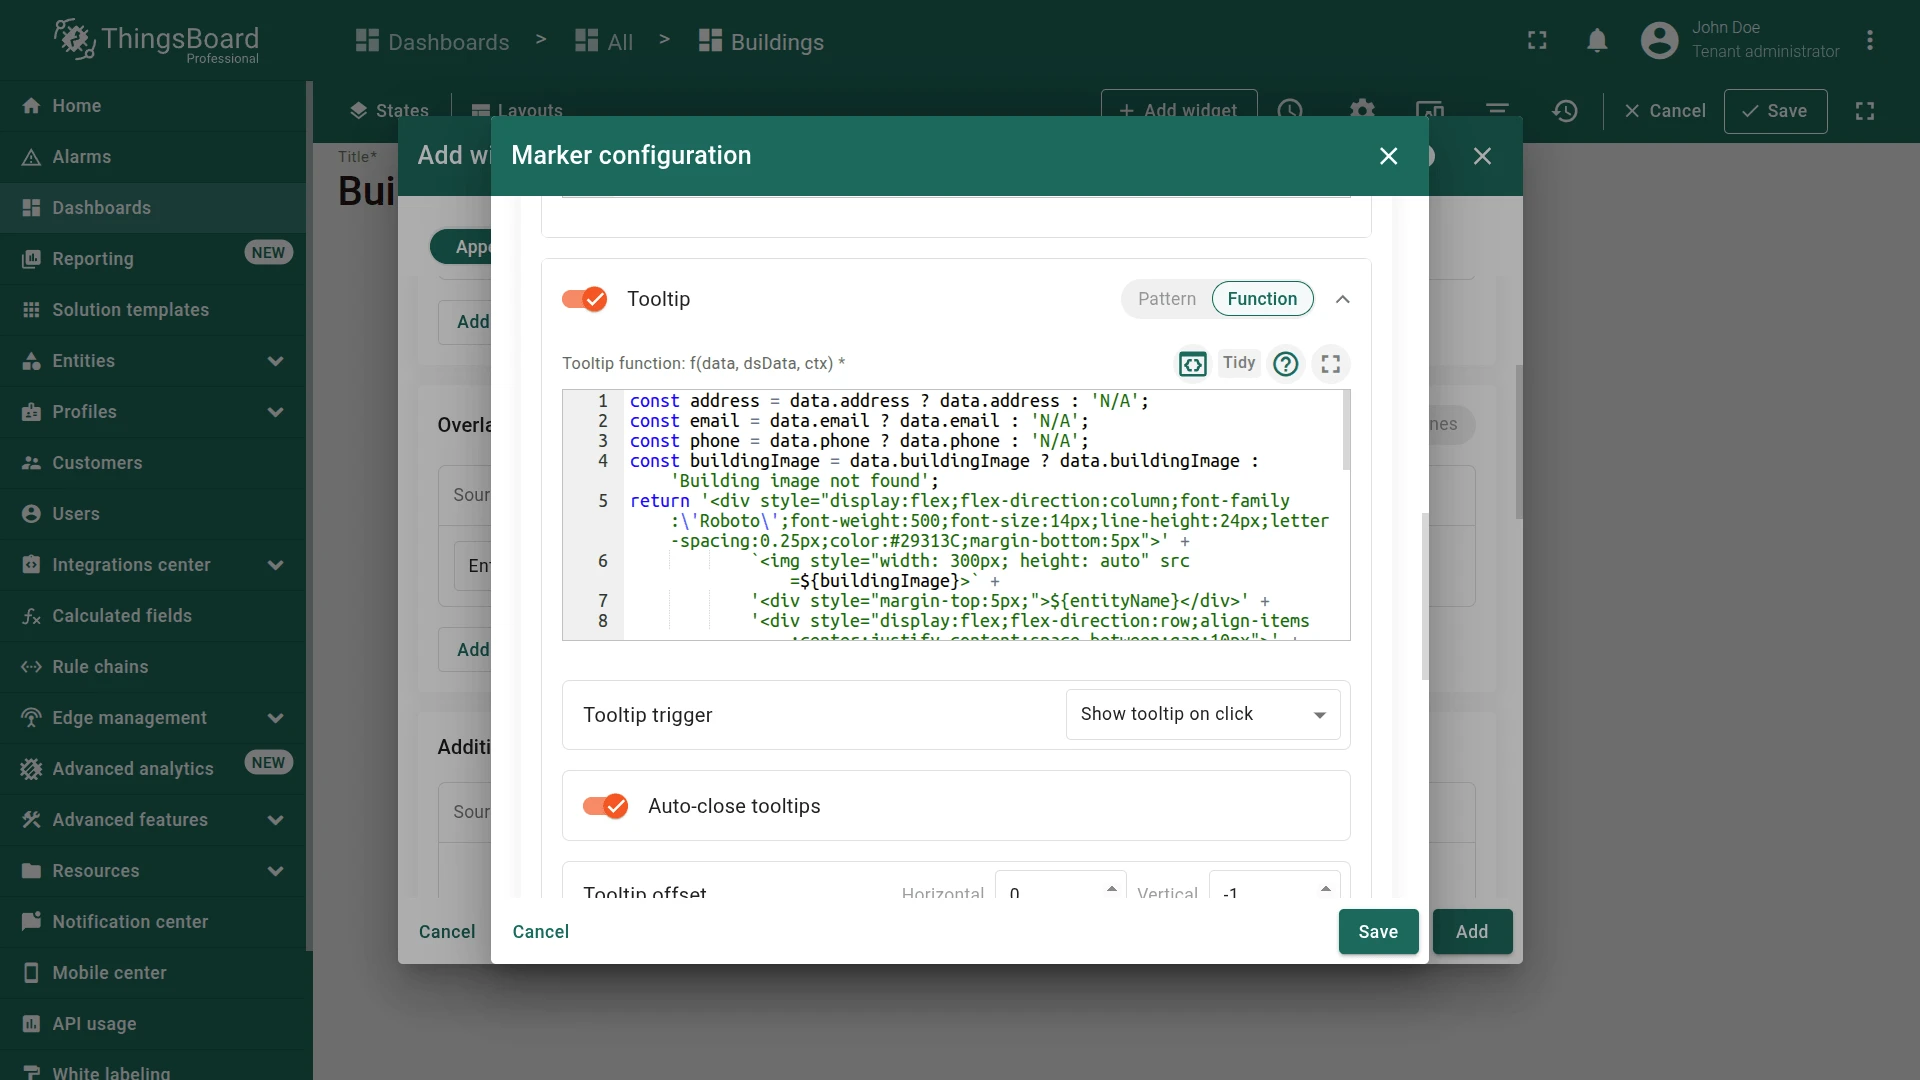
-
Configure the tooltip function to display additional building details.
 const address = data.address ? data.address : 'N/A';const email = data.email ? data.email : 'N/A';const phone = data.phone ? data.phone : 'N/A';const buildingImage = data.buildingImage ? data.buildingImage : 'Building image not found';return '<div style="display:flex;flex-direction:column;font-family:\'Roboto\';font-weight:500;font-size:14px;line-height:24px;letter-spacing:0.25px;color:#29313C;margin-bottom:5px">' +`<img style="width: 300px; height: auto" src=${buildingImage}>` +'<div style="margin-top:5px;">${entityName}</div>' +'<div style="display:flex;flex-direction:row;align-items:center;justify-content:space-between;gap:10px">' +'<div style="font-size:11px;line-height:16px;font-weight:500;color:rgba(0, 0, 0, 0.38);">Address</div>' +'<div style="font-size:12px;line-height:20px;font-weight:500;color:#29313C;letter-spacing:0.25px;text-align:right;">'+ address +'</div>' +'</div>' +'<div style="display:flex;flex-direction:row;align-items:center;justify-content:space-between;gap:10px">' +'<div style="font-size:11px;line-height:16px;font-weight:500;color:rgba(0, 0, 0, 0.38);">Email</div>' +'<div style="font-size:12px;line-height:20px;font-weight:500;color:#29313C;letter-spacing:0.25px;text-align:right;">'+ email +'</div>' +'</div>' +'<div style="display:flex;flex-direction:row;align-items:baseline;justify-content:space-between;gap:10px">' +'<div style="font-size:11px;line-height:16px;font-weight:500;color:rgba(0, 0, 0, 0.38);">Phone</div>' +'<div style="font-size:12px;line-height:20px;font-weight:500;color:#29313C;letter-spacing:0.25px;text-align:right;">'+ phone +'</div>' +'</div>' +'</div>';
-
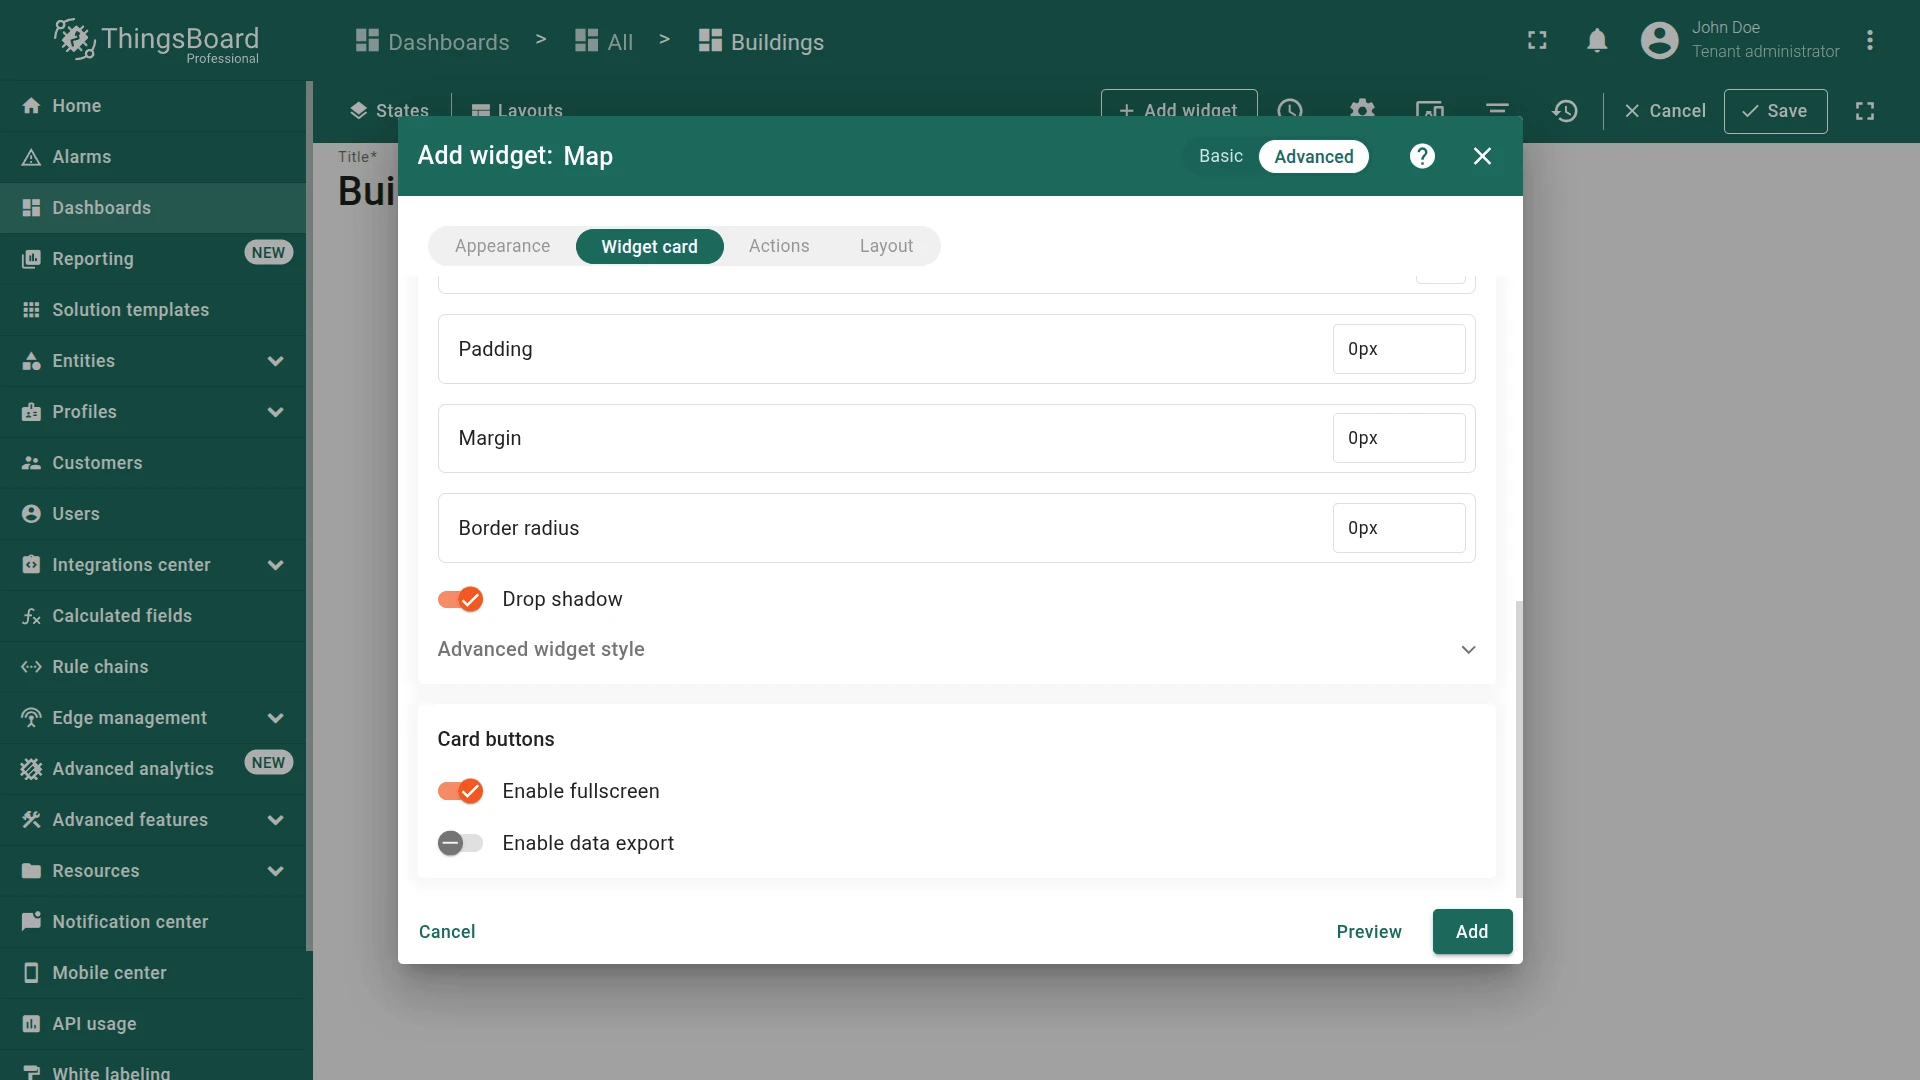
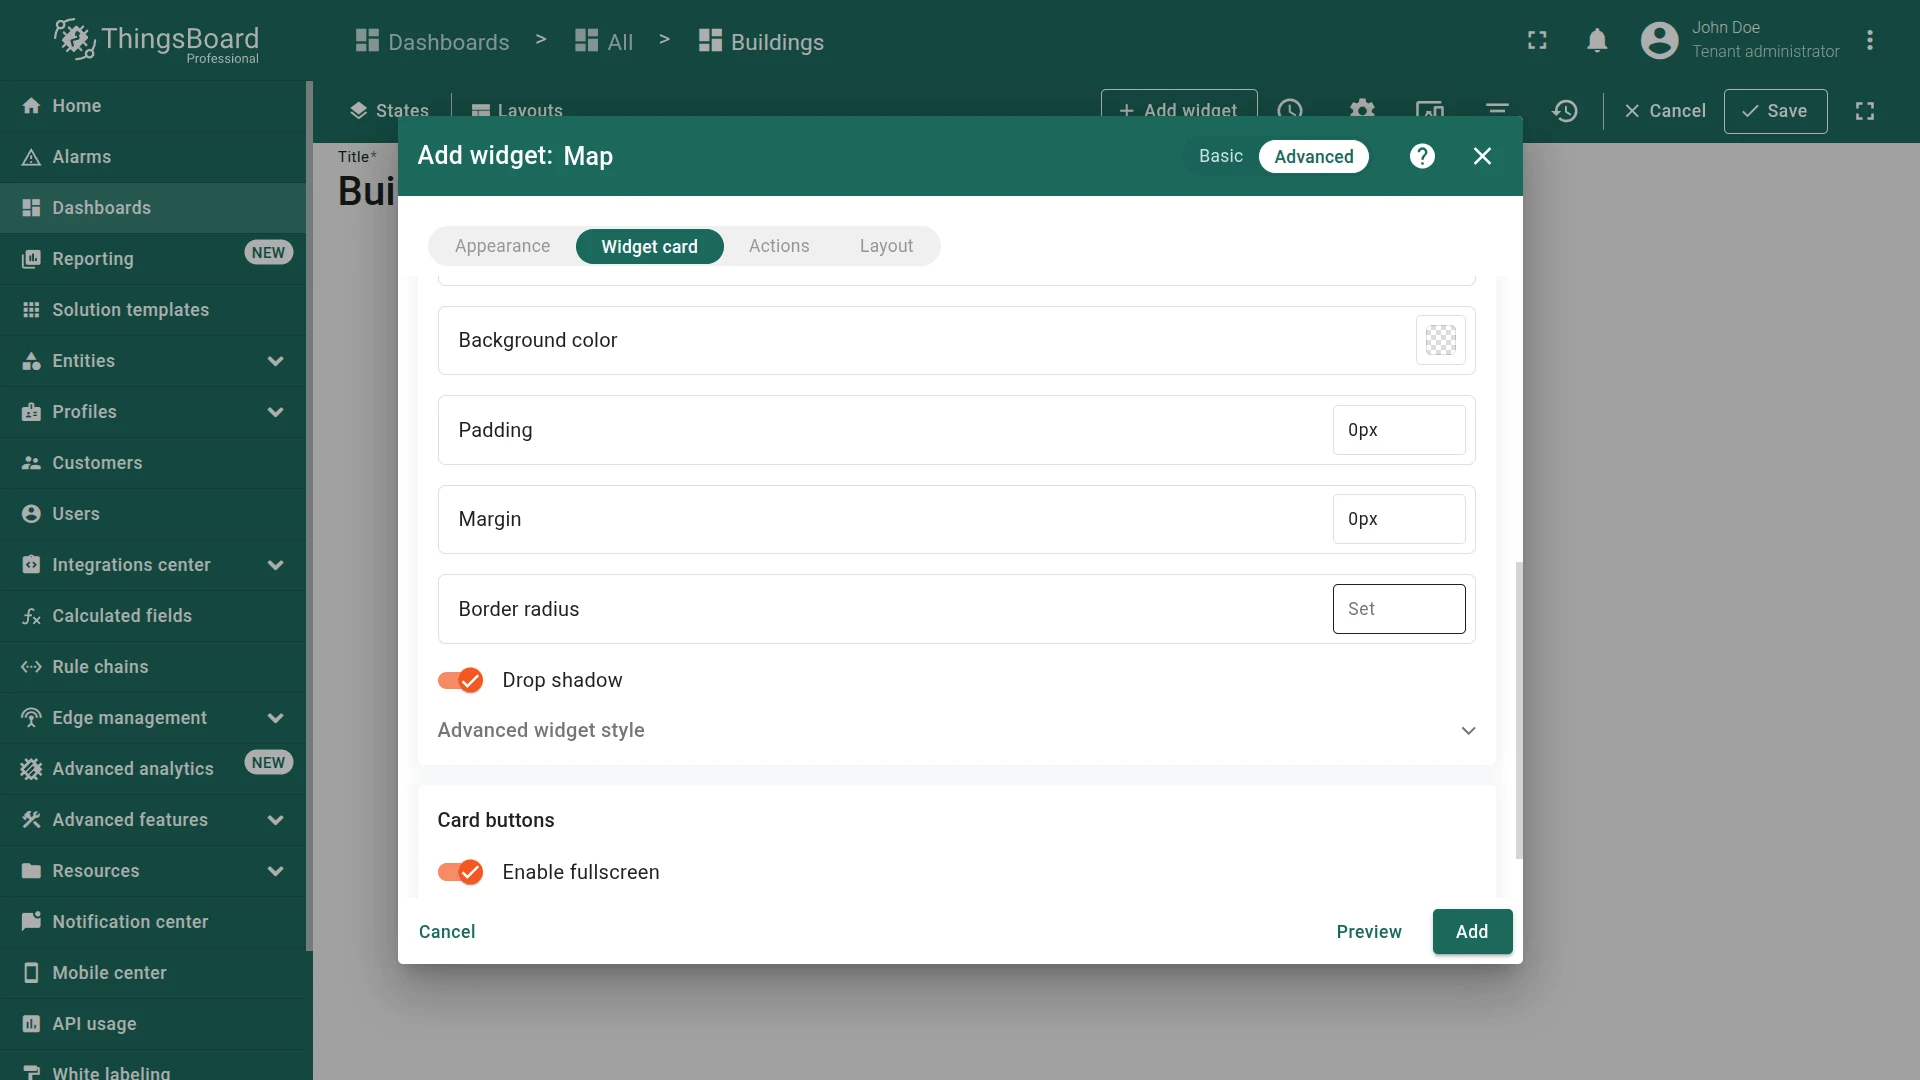
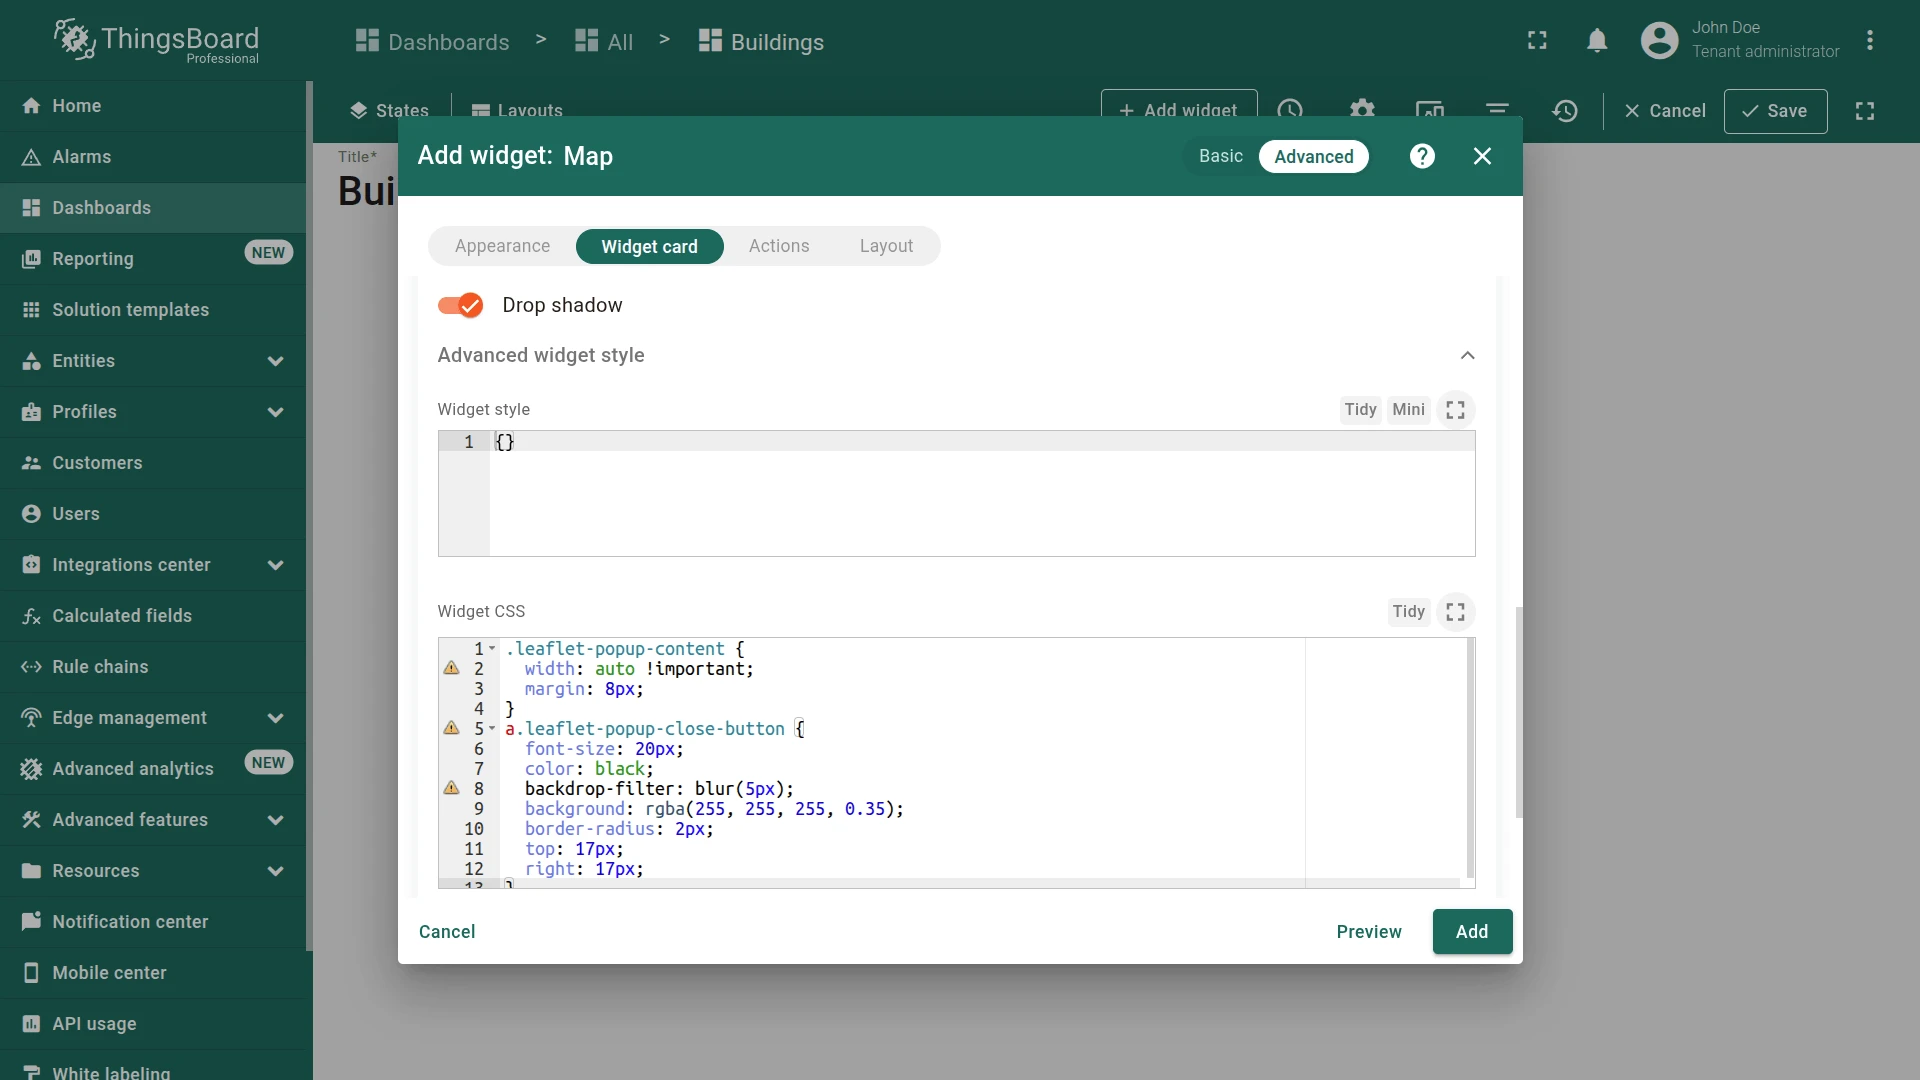
Scroll down and set card padding to
0. -
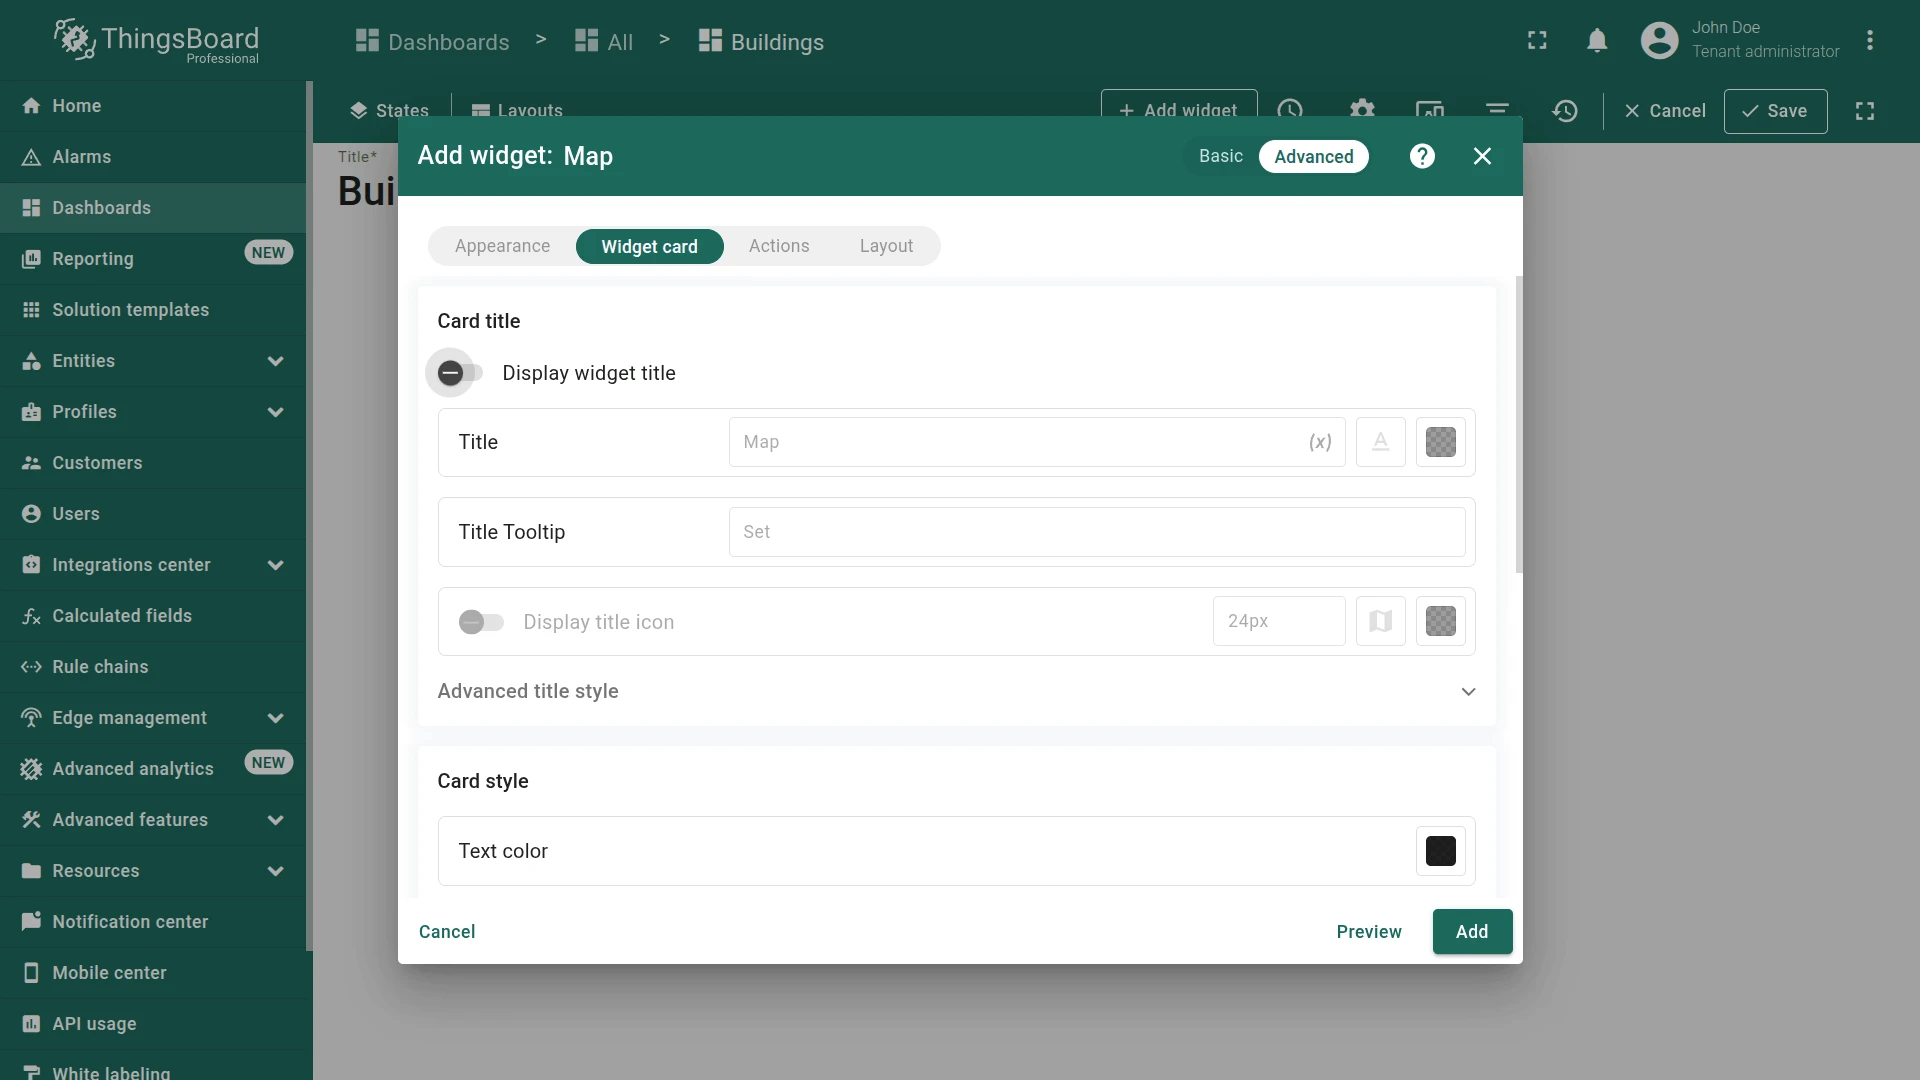
Navigate to the Widget card tab and turn off displaying the widget title.
-
Adjust advanced widget styles and apply CSS provided below:
.leaflet-popup-content { width: auto !important; margin: 8px; }a.leaflet-popup-close-button {font-size: 20px; color: black;backdrop-filter: blur(5px);background: rgba(255, 255, 255, 0.35);border-radius: 2px; top: 17px; right: 17px;}
- Click Add to finish.
Position the widget in the top-right corner of the dashboard and resize it by dragging its edges. Once the layout is adjusted, click Save in the top-right corner to apply the changes.
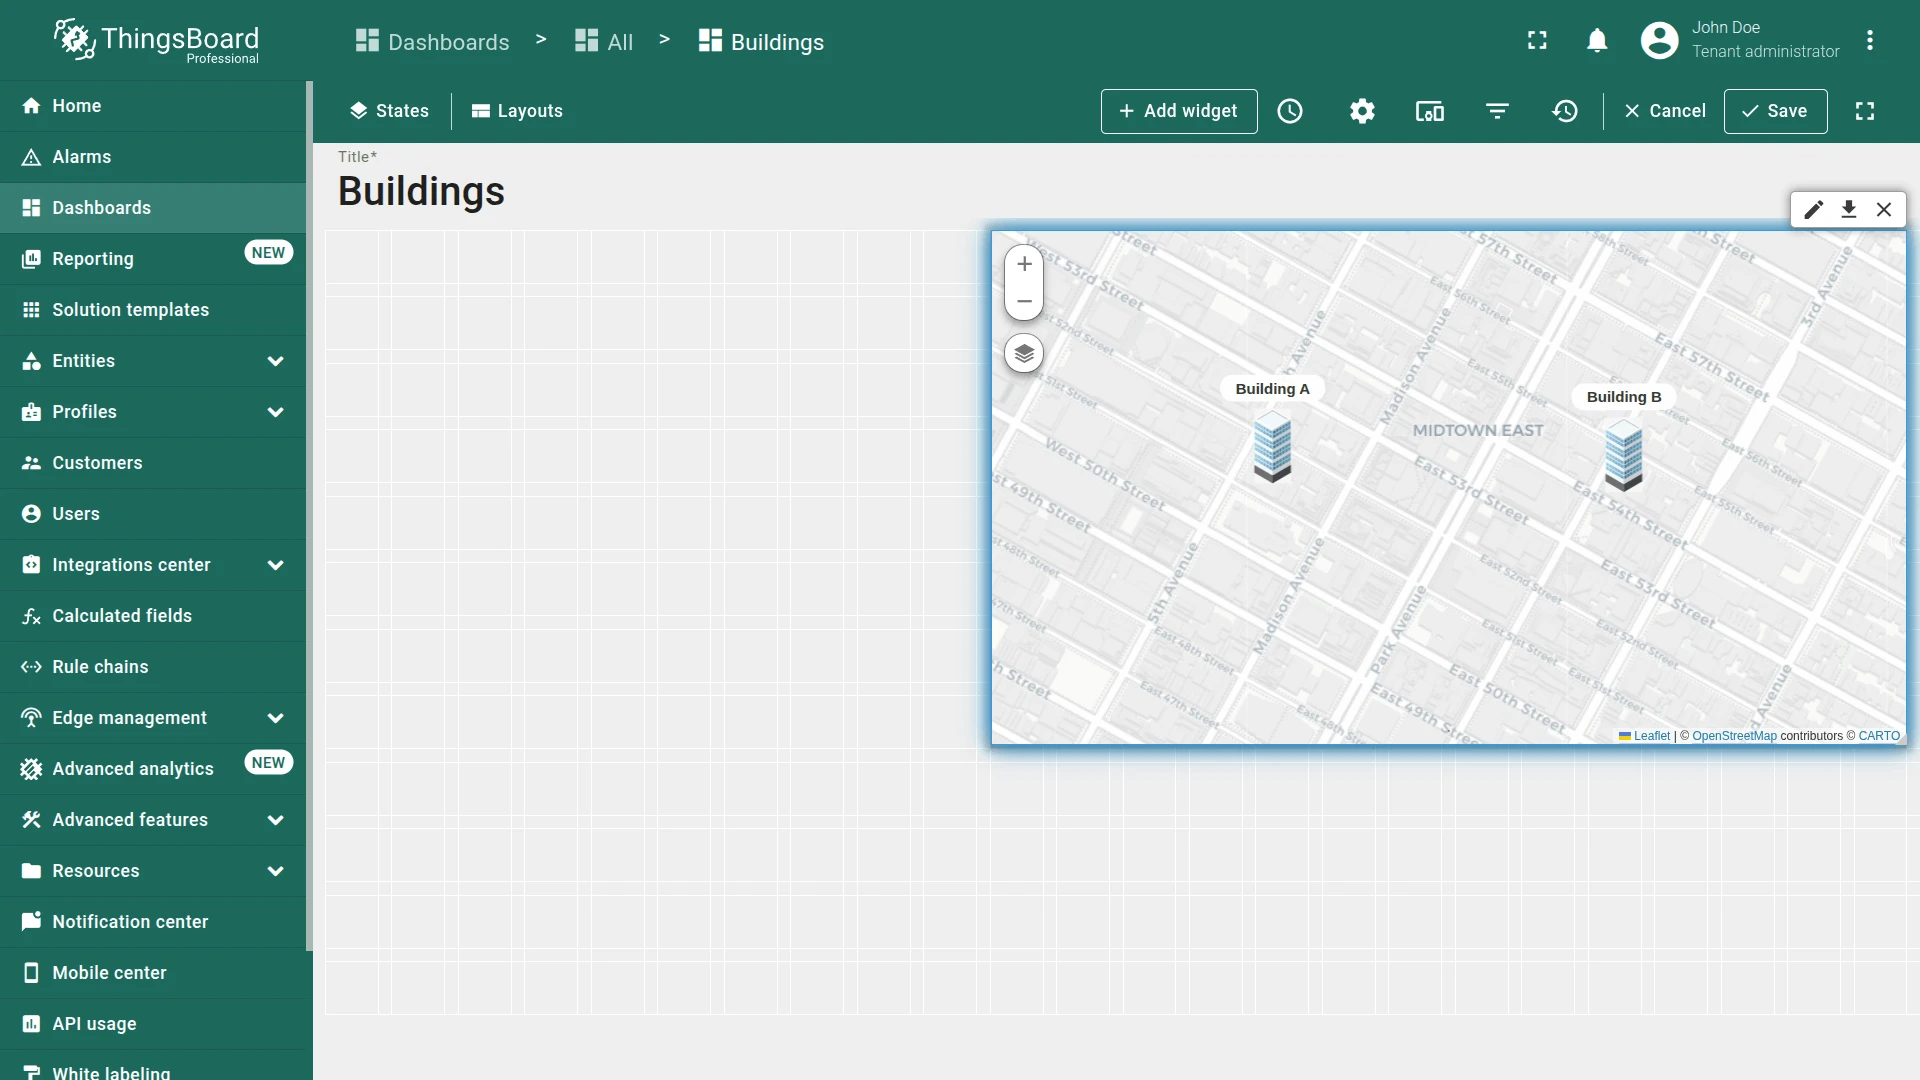
Now click on any building image to display a tooltip with information about it.
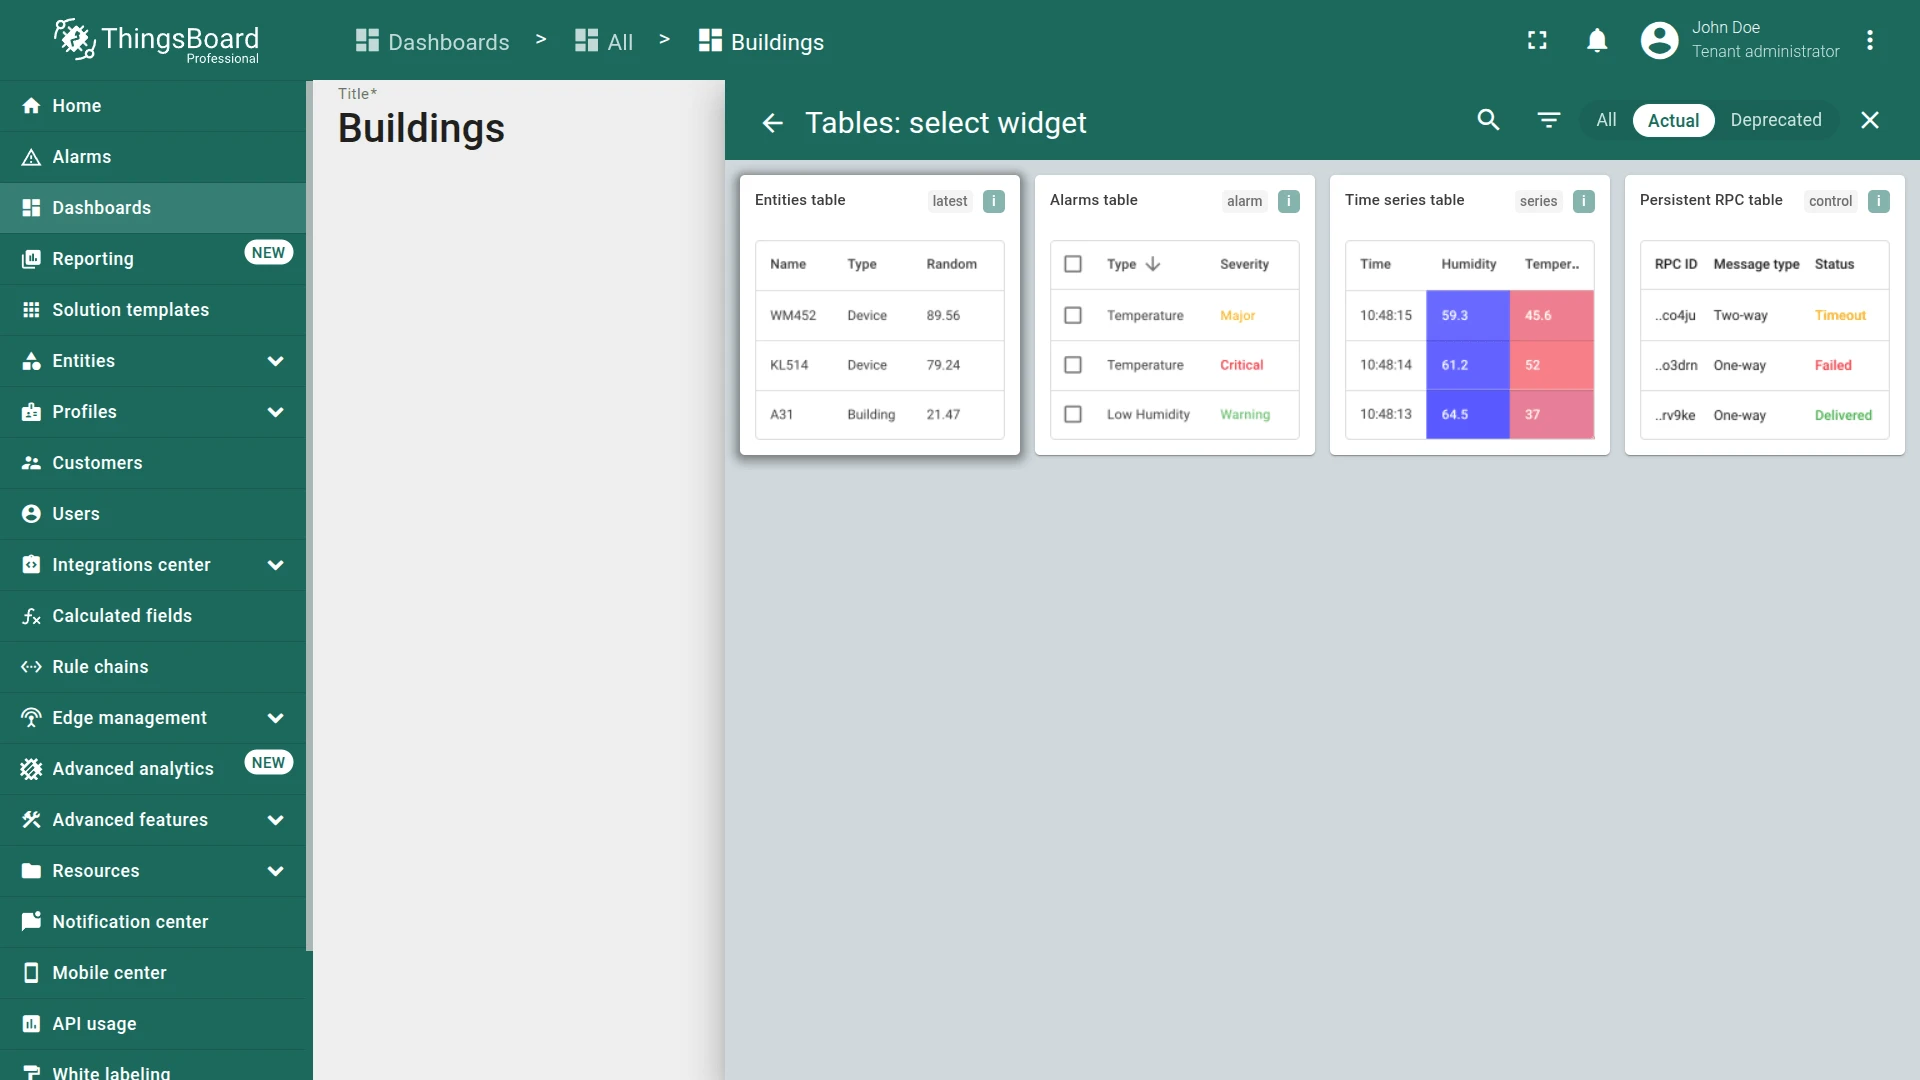
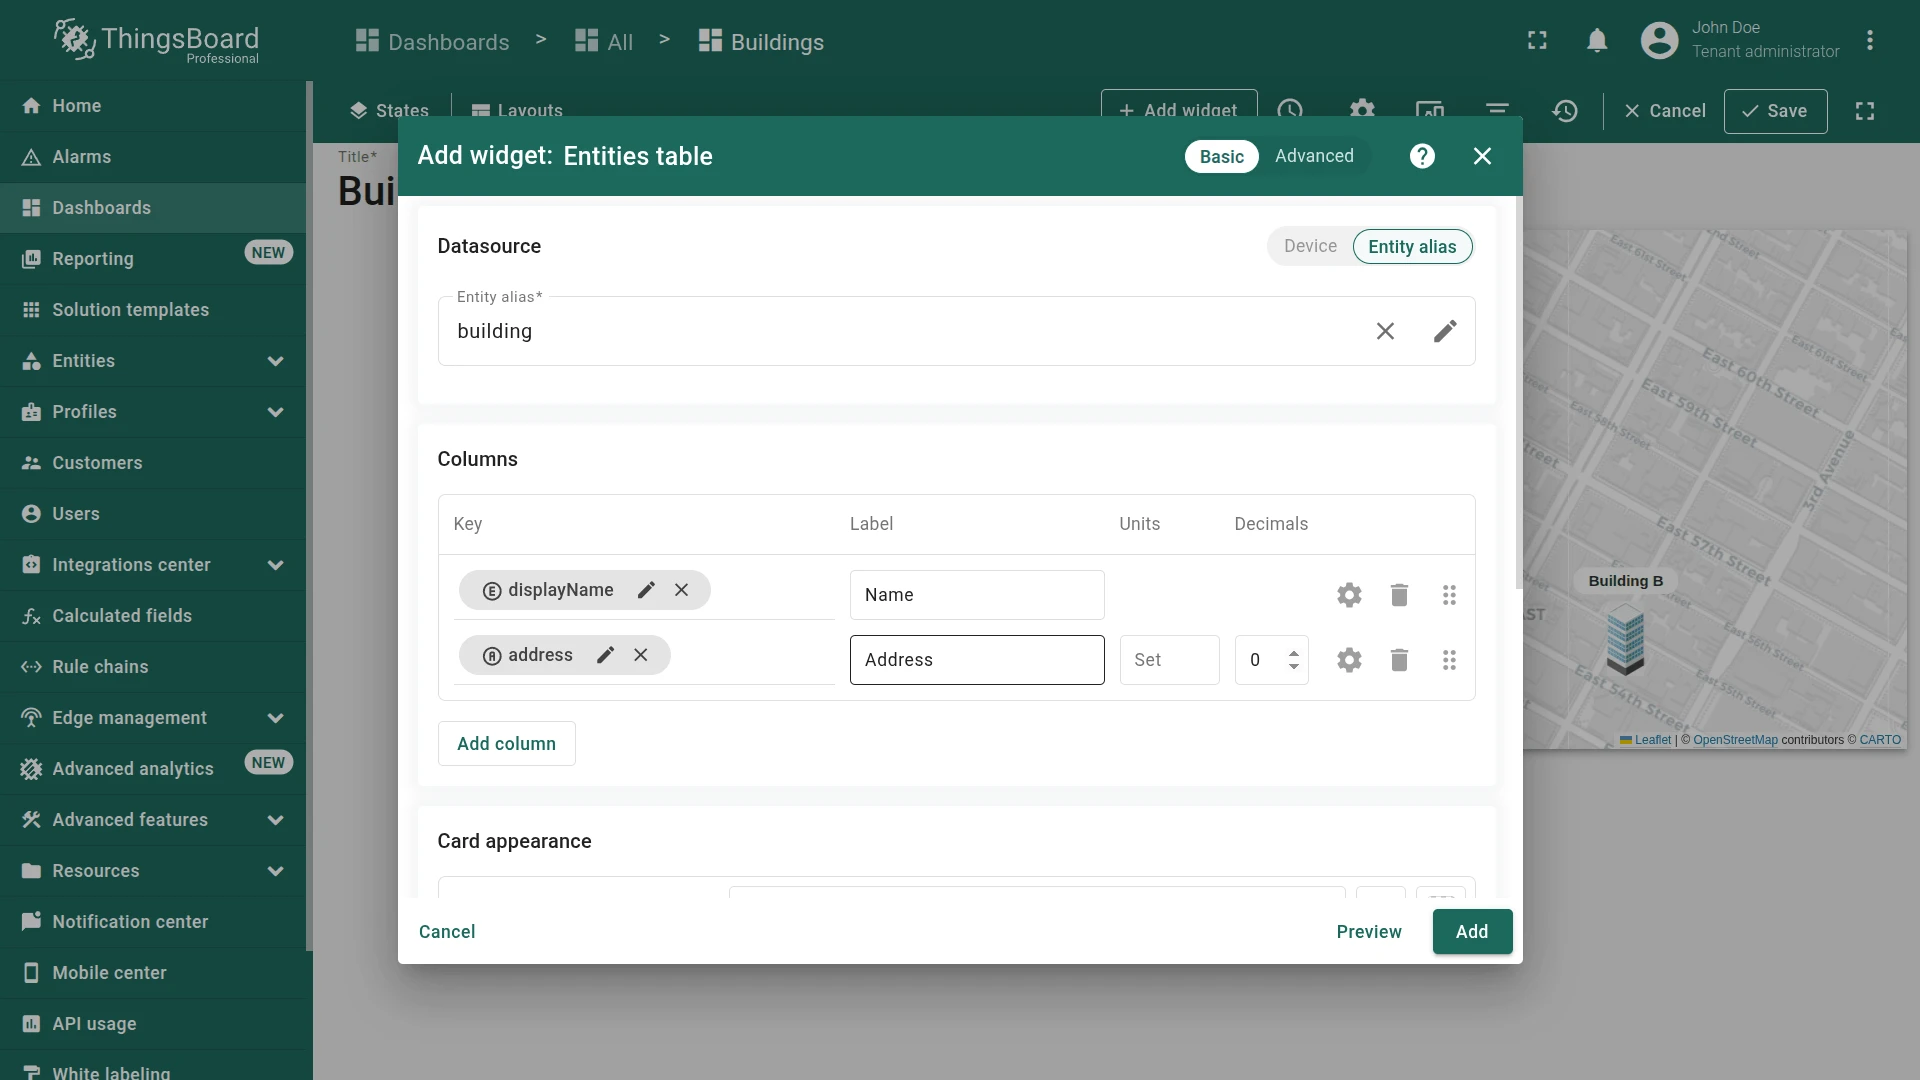
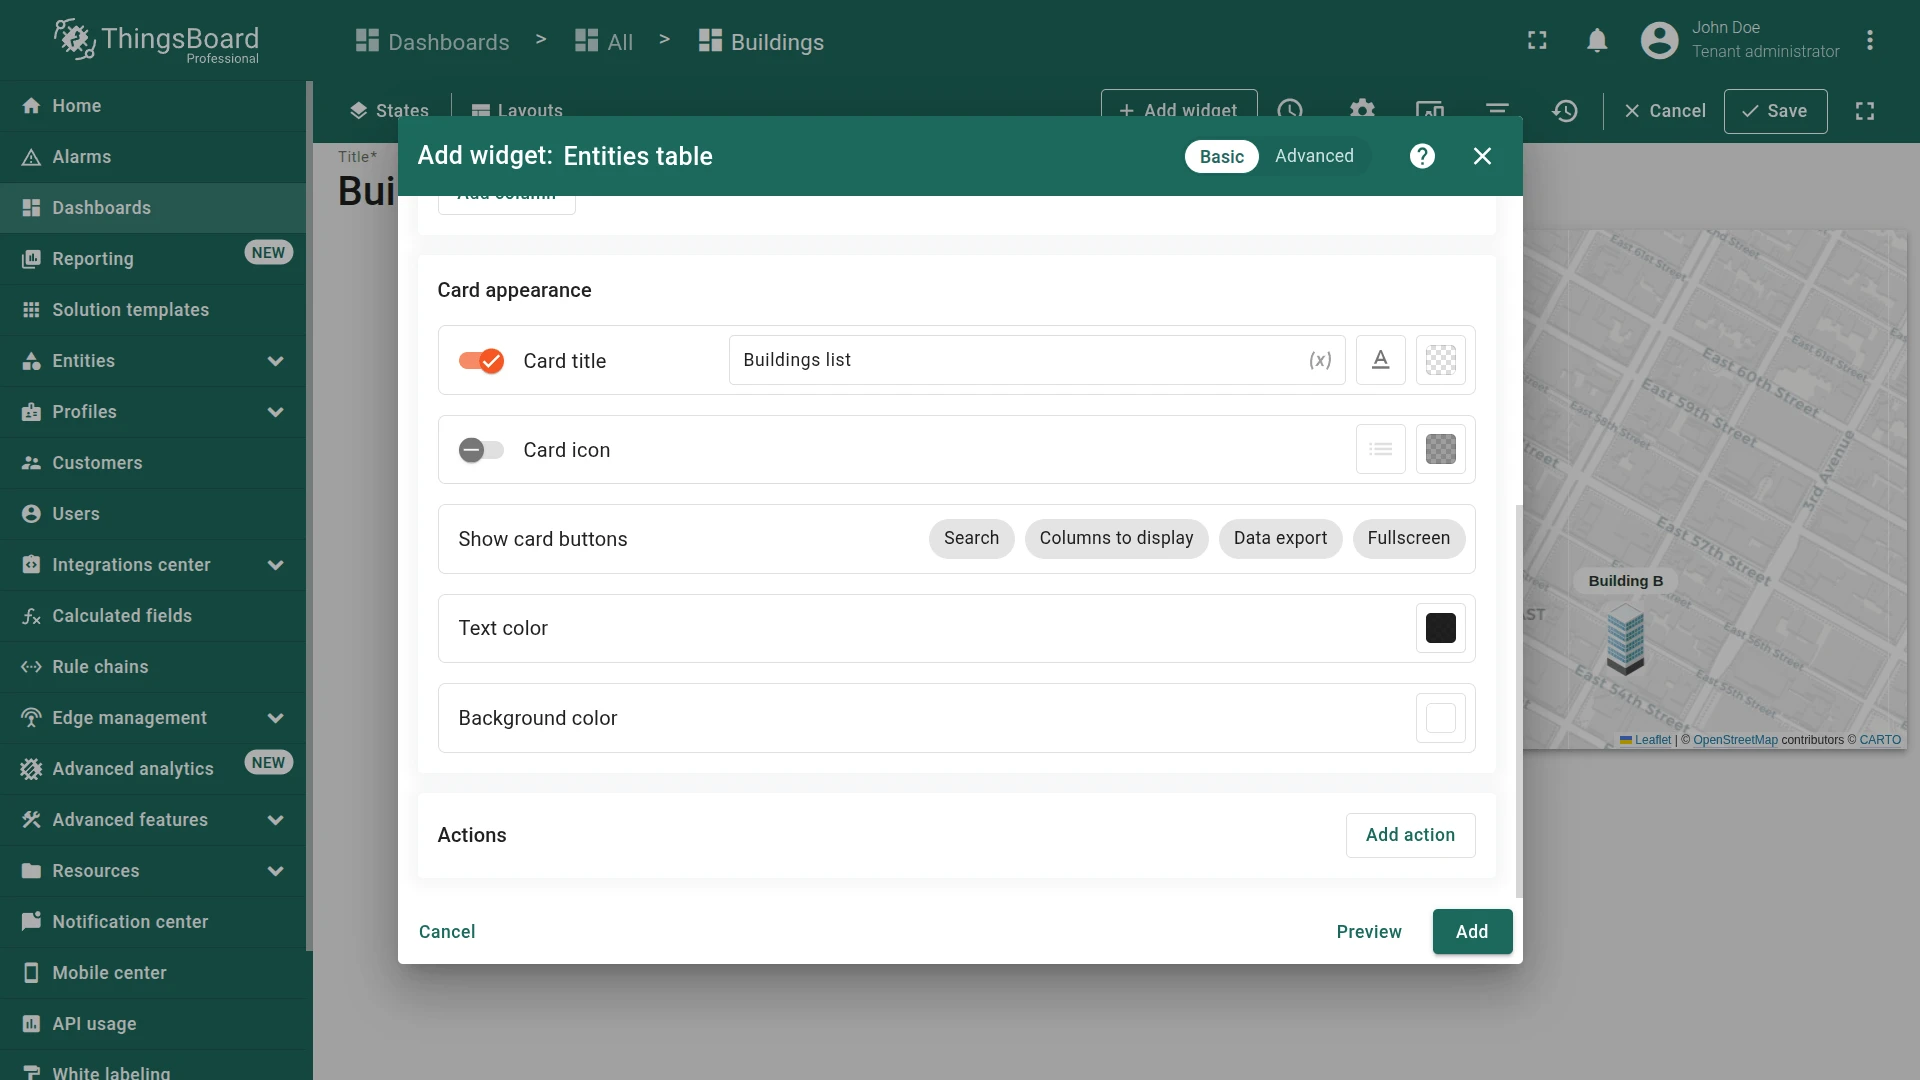
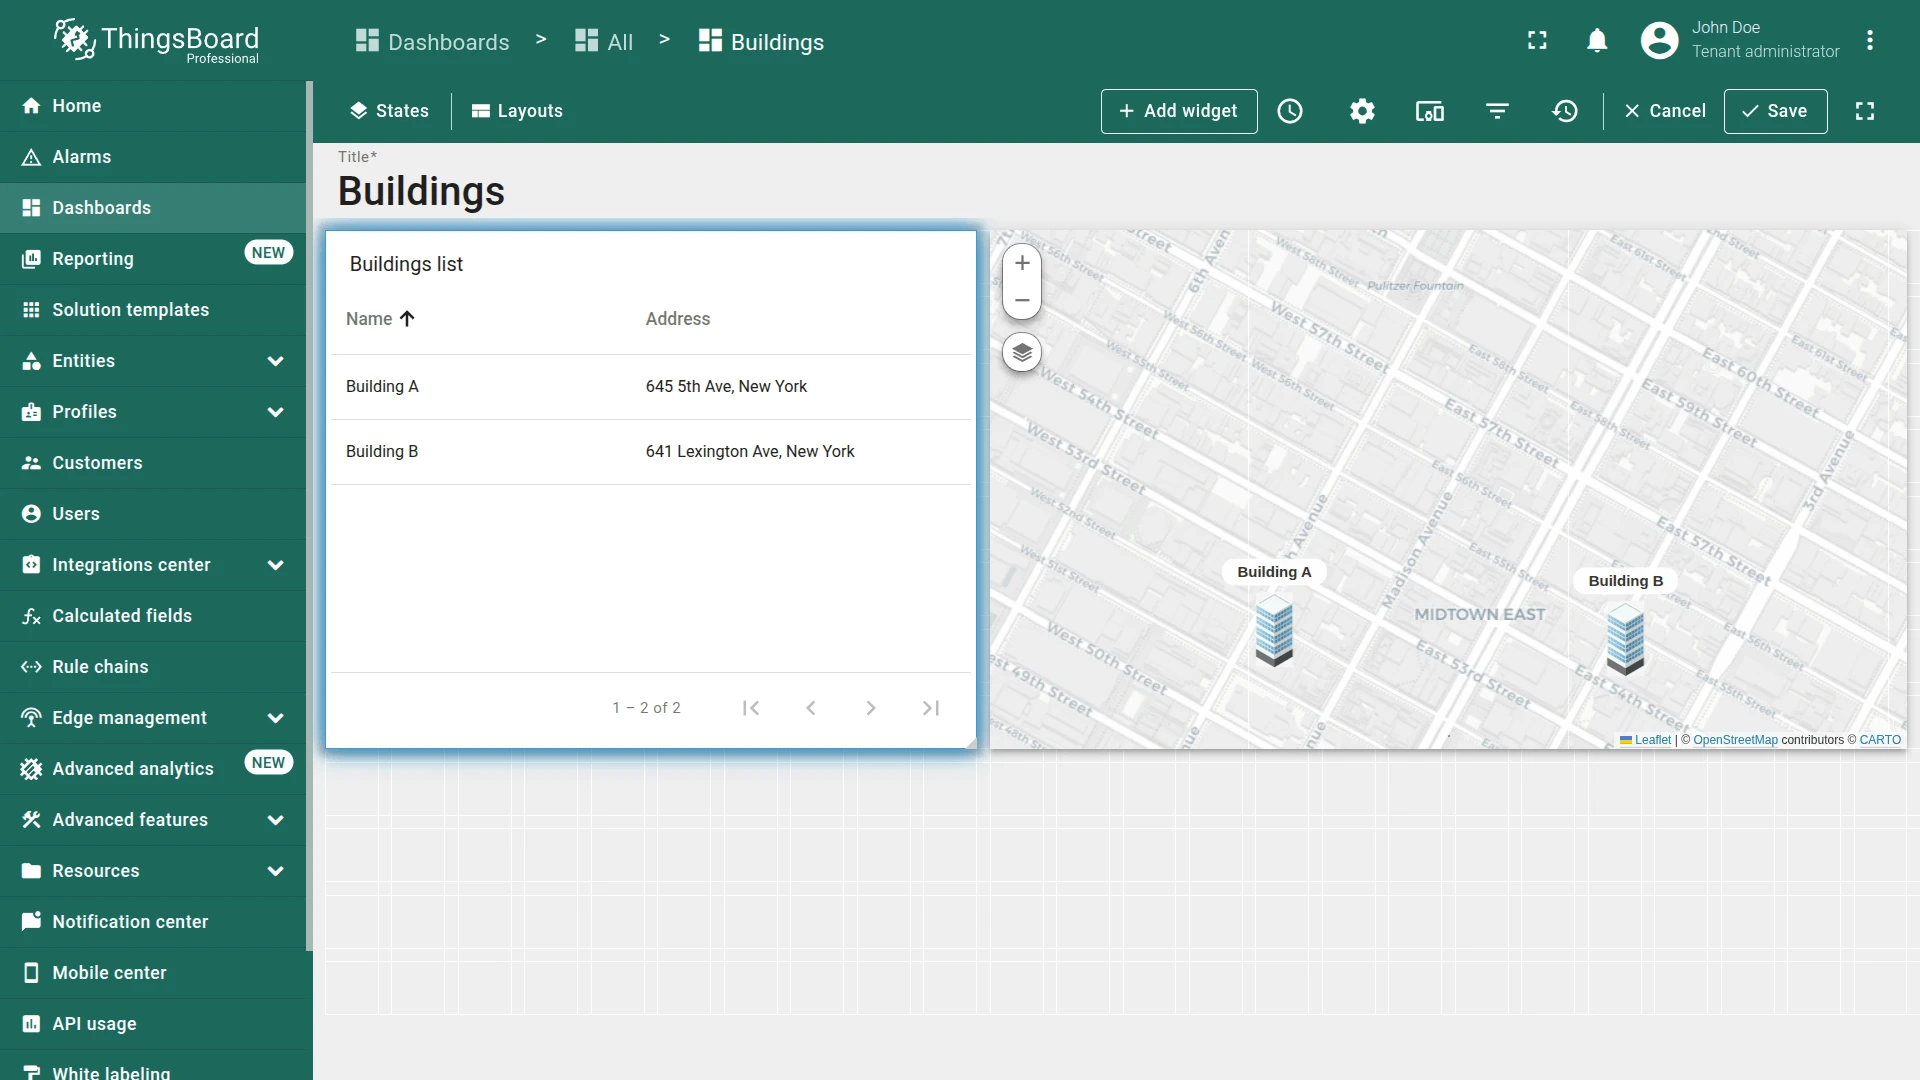
Step 1.6 Entities Table Widget
Section titled “Step 1.6 Entities Table Widget”The map shows building locations, but a list view makes it easy to scan building details at a glance. Add an Entities table widget to display both buildings alongside their addresses.
- In dashboard edit mode, click Add widget.
- Select Tables ⇾ Entities table.
- Set datasource to the building alias.
- Add
addressas a column key. - Set the card title to
Buildings list. - Uncheck all Show card buttons options.
- Click Add, resize the widget, then save the dashboard.
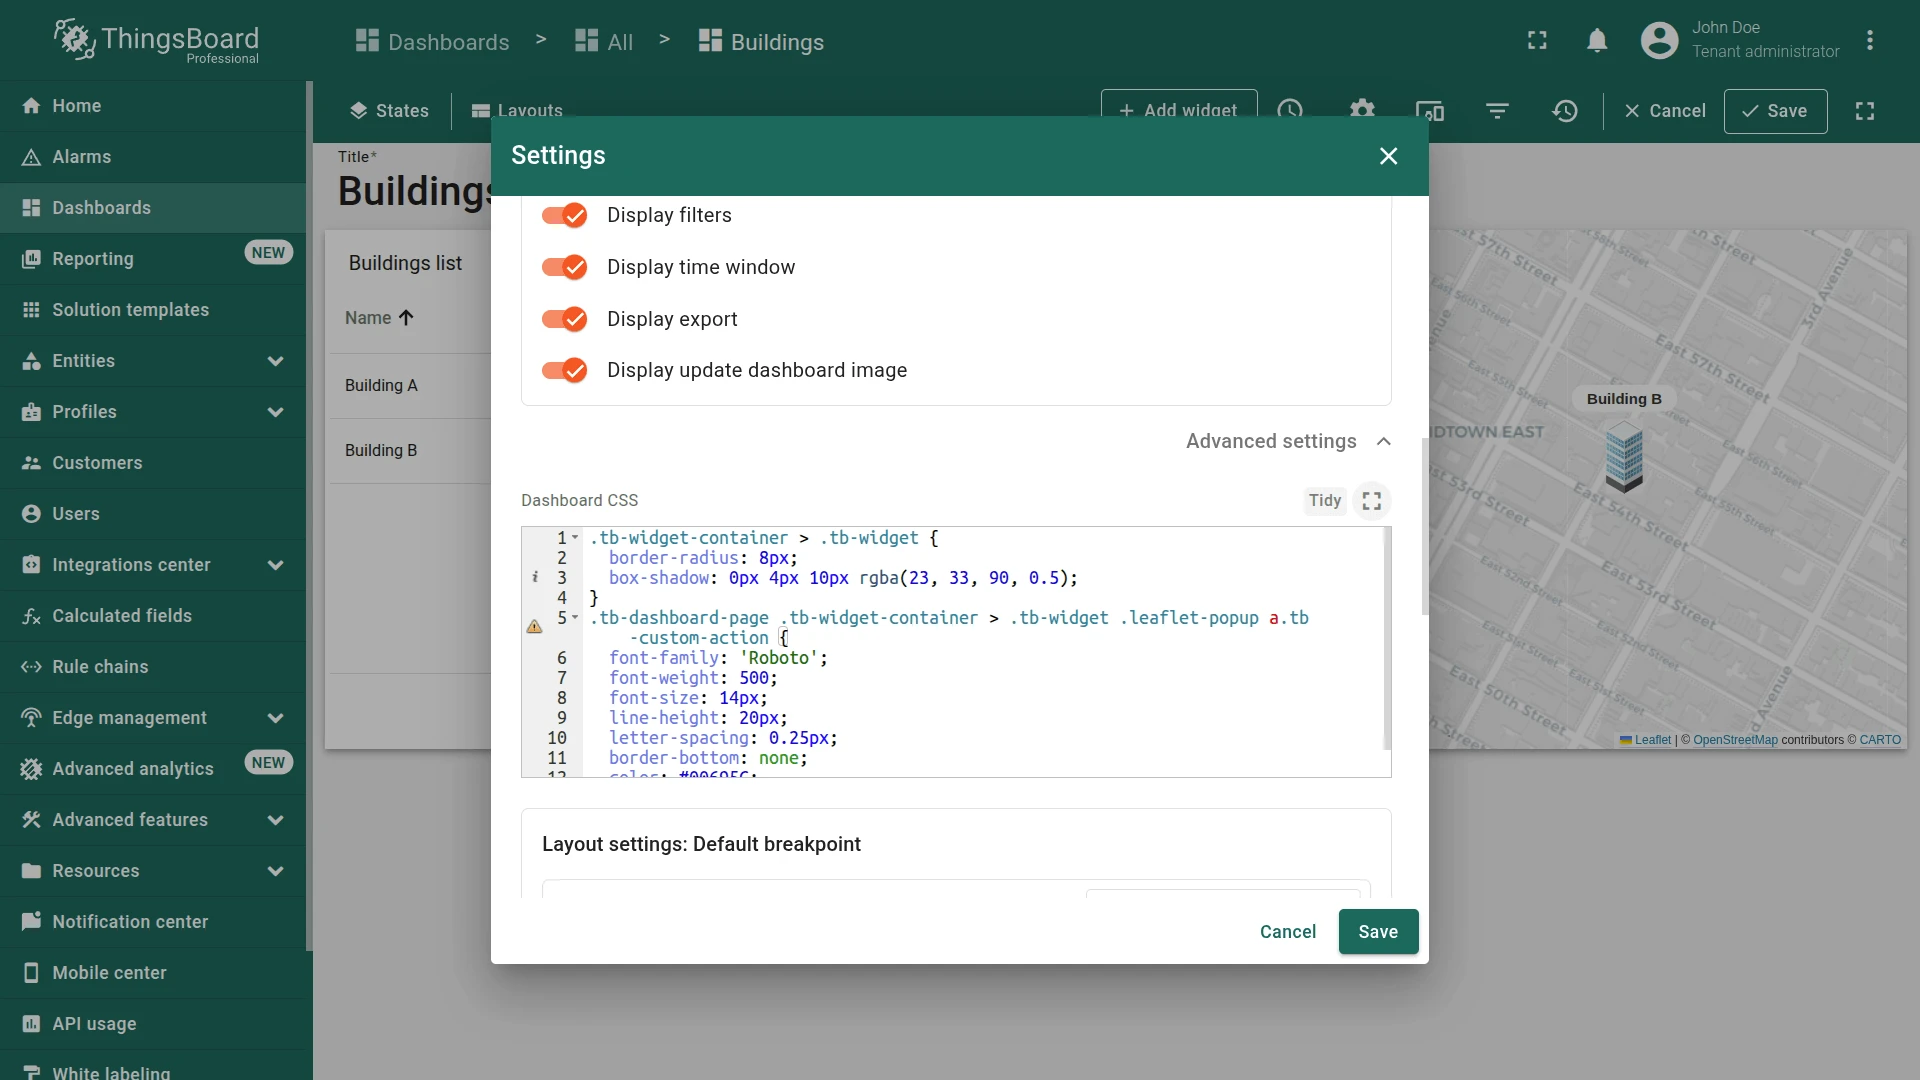
Step 1.7 Customize Dashboard Appearance
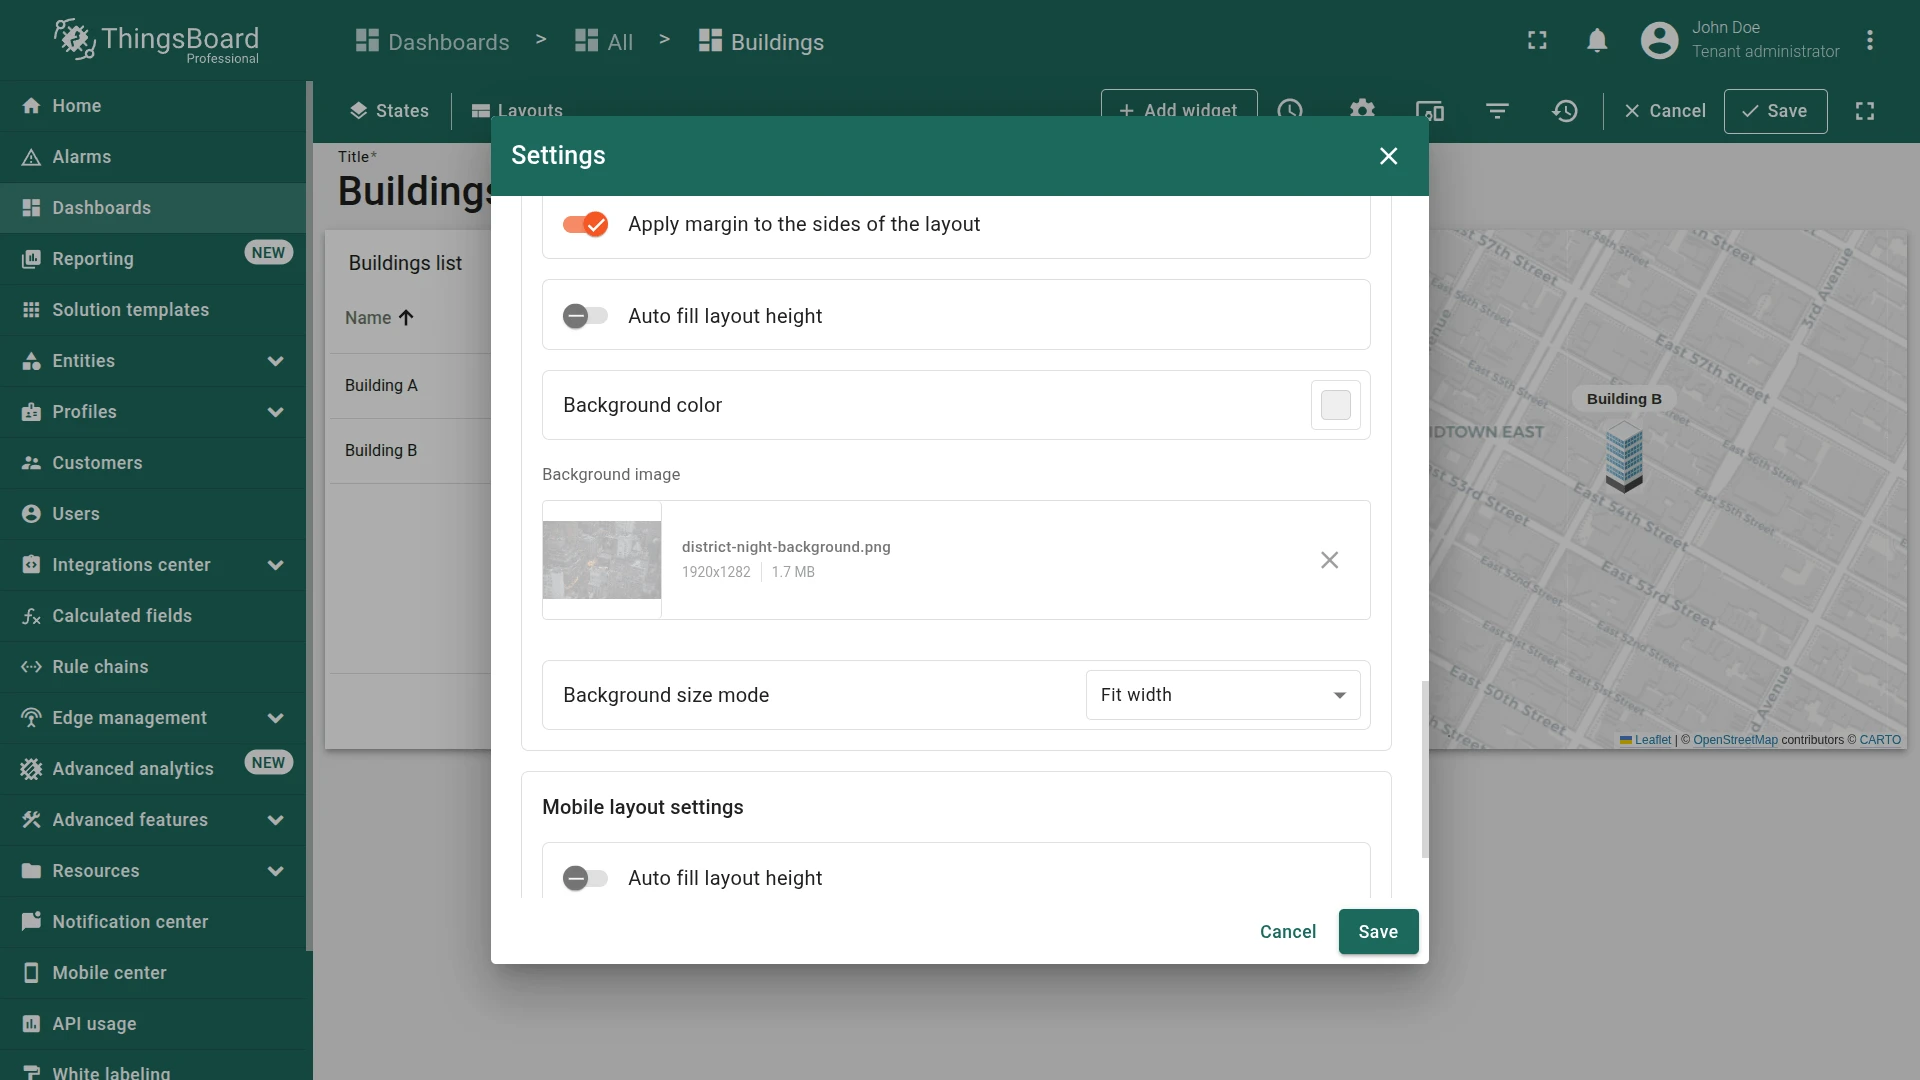
Section titled “Step 1.7 Customize Dashboard Appearance”Apply a background image and global CSS styles to give the dashboard a polished, professional look.
-
Click Settings on the dashboard toolbar.
-
In Advanced settings ⇾ Dashboard CSS, paste:
.tb-widget-container > .tb-widget {border-radius: 8px;box-shadow: 0px 4px 10px rgba(23, 33, 90, 0.5);}.tb-dashboard-page .tb-widget-container > .tb-widget .leaflet-popup a.tb-custom-action {font-family: 'Roboto';font-weight: 500;font-size: 14px;line-height: 20px;letter-spacing: 0.25px;border-bottom: none;color: #00695C;}This CSS snippet applies styles to elements with the
.tb-widgetclass that are direct children of the.tb-widget-container. It specifiesborder-radius: 8px, which gives the element soft rounded corners, andbox-shadow: 0px 4px 10px rgba(23, 33, 90, 0.5), which creates a semi-transparent shadow with a subtle blur, offset by 4 pixels downward, adding visual depth, and specifiesopacity: 0.9to make the element slightly transparent, allowing for some background visibility while maintaining the content’s visibility. -
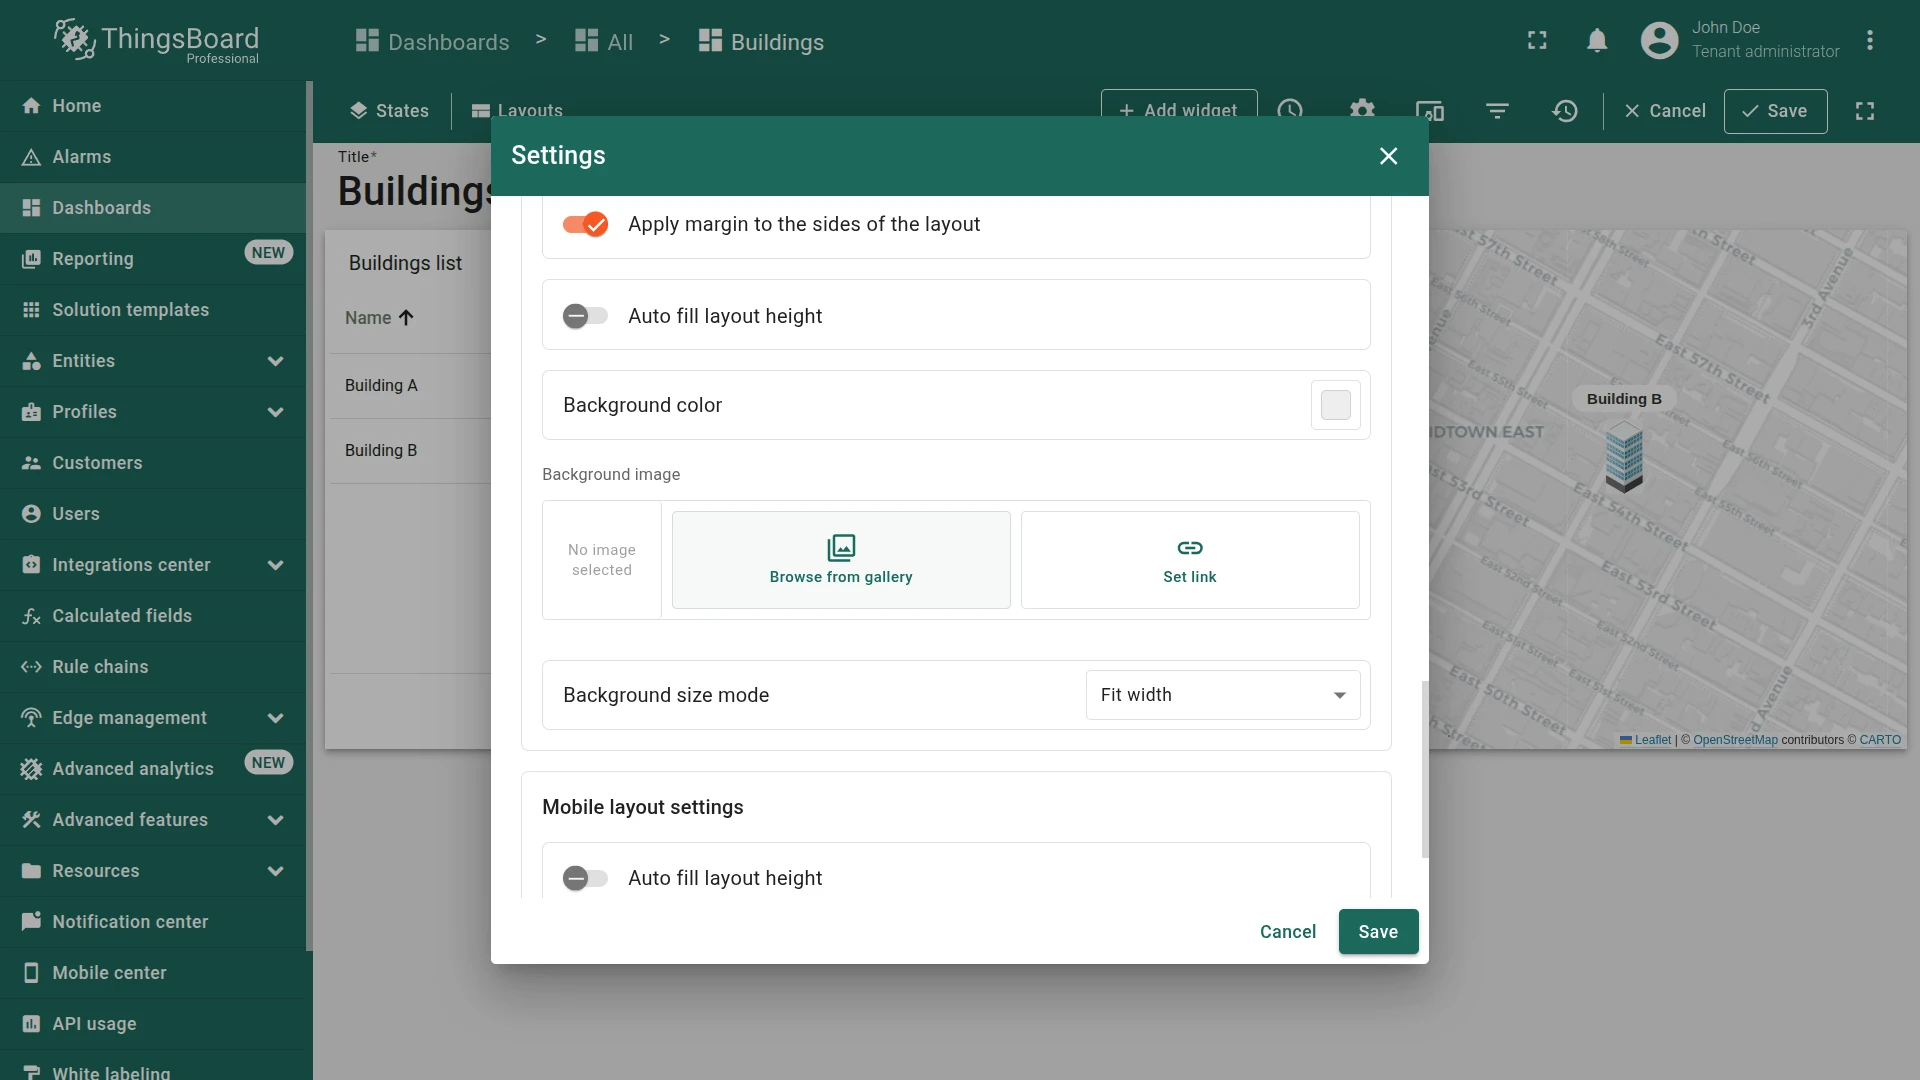
Download the sample background or use your own.
-
Scroll to Background image and click Browse from gallery.
-
Upload the background image if not already present, select it, and click Apply.
-
Save the layout settings, then save the dashboard.
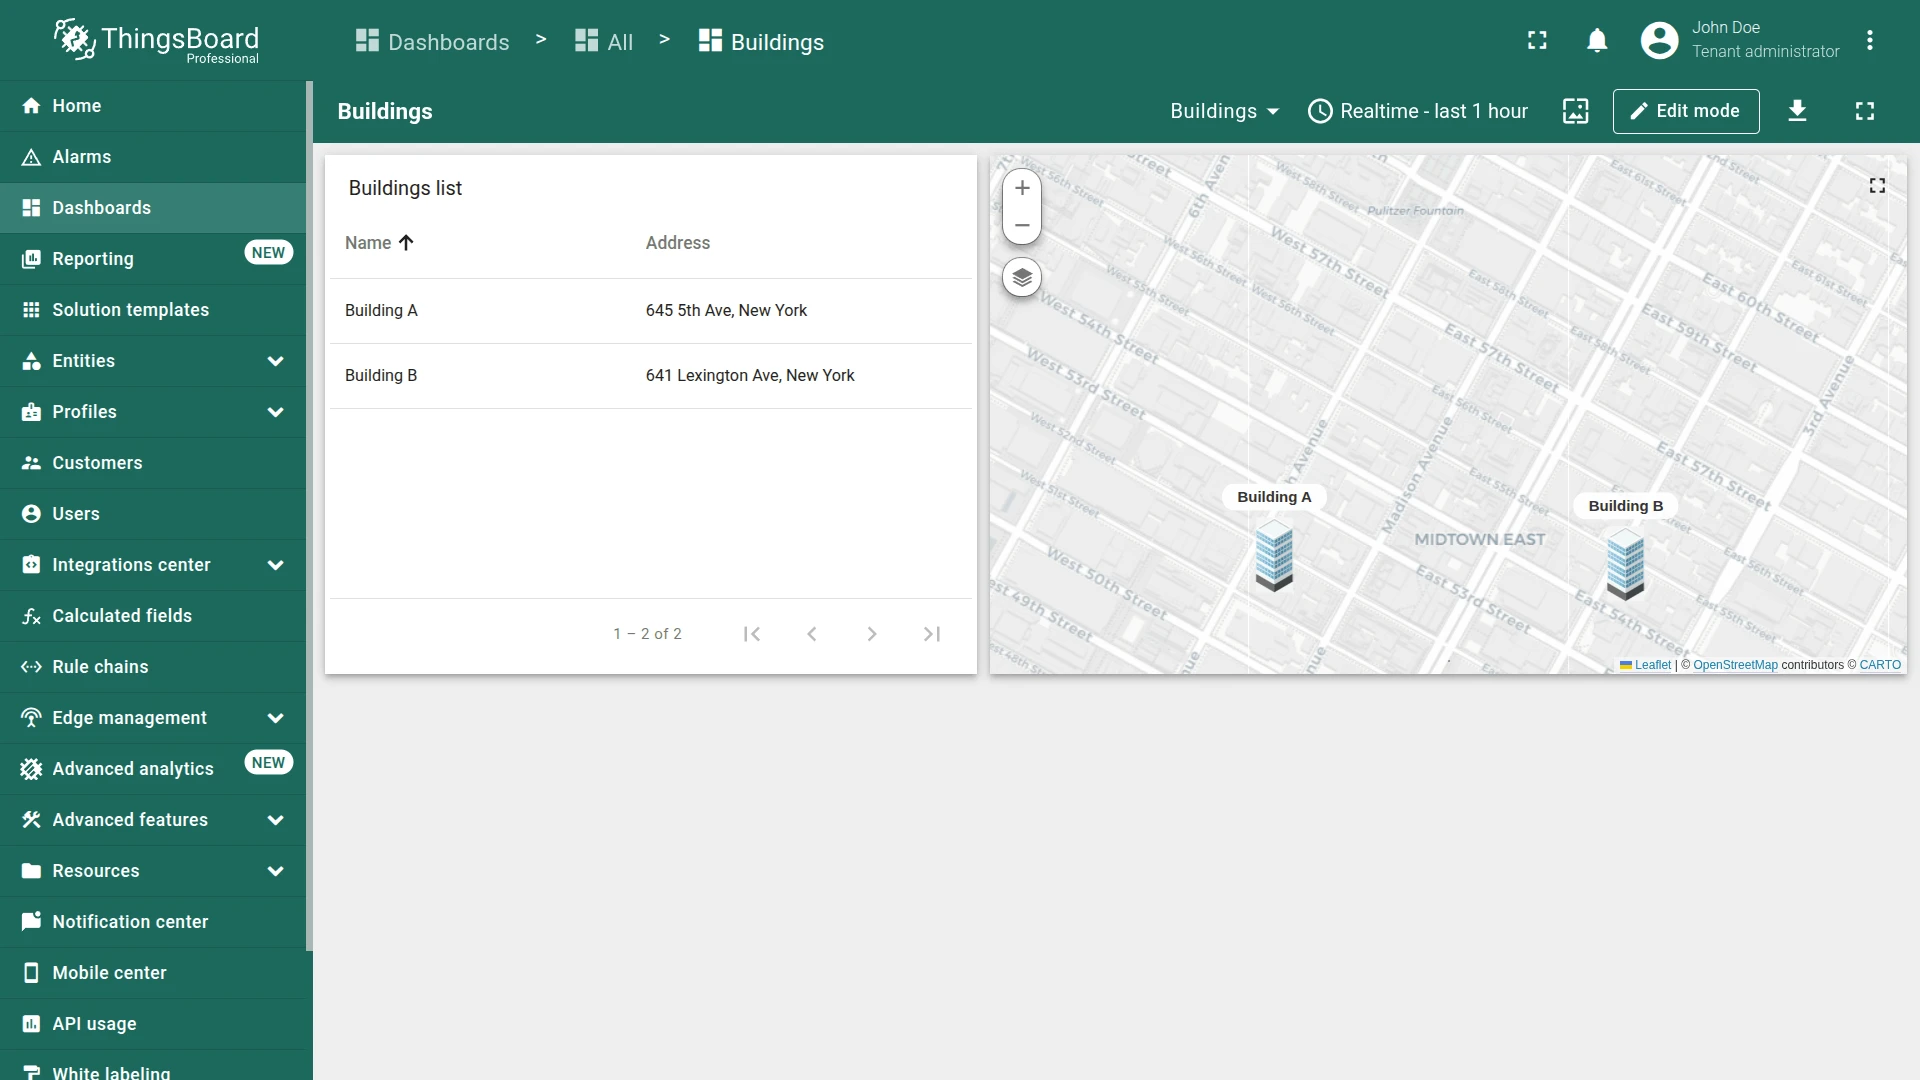
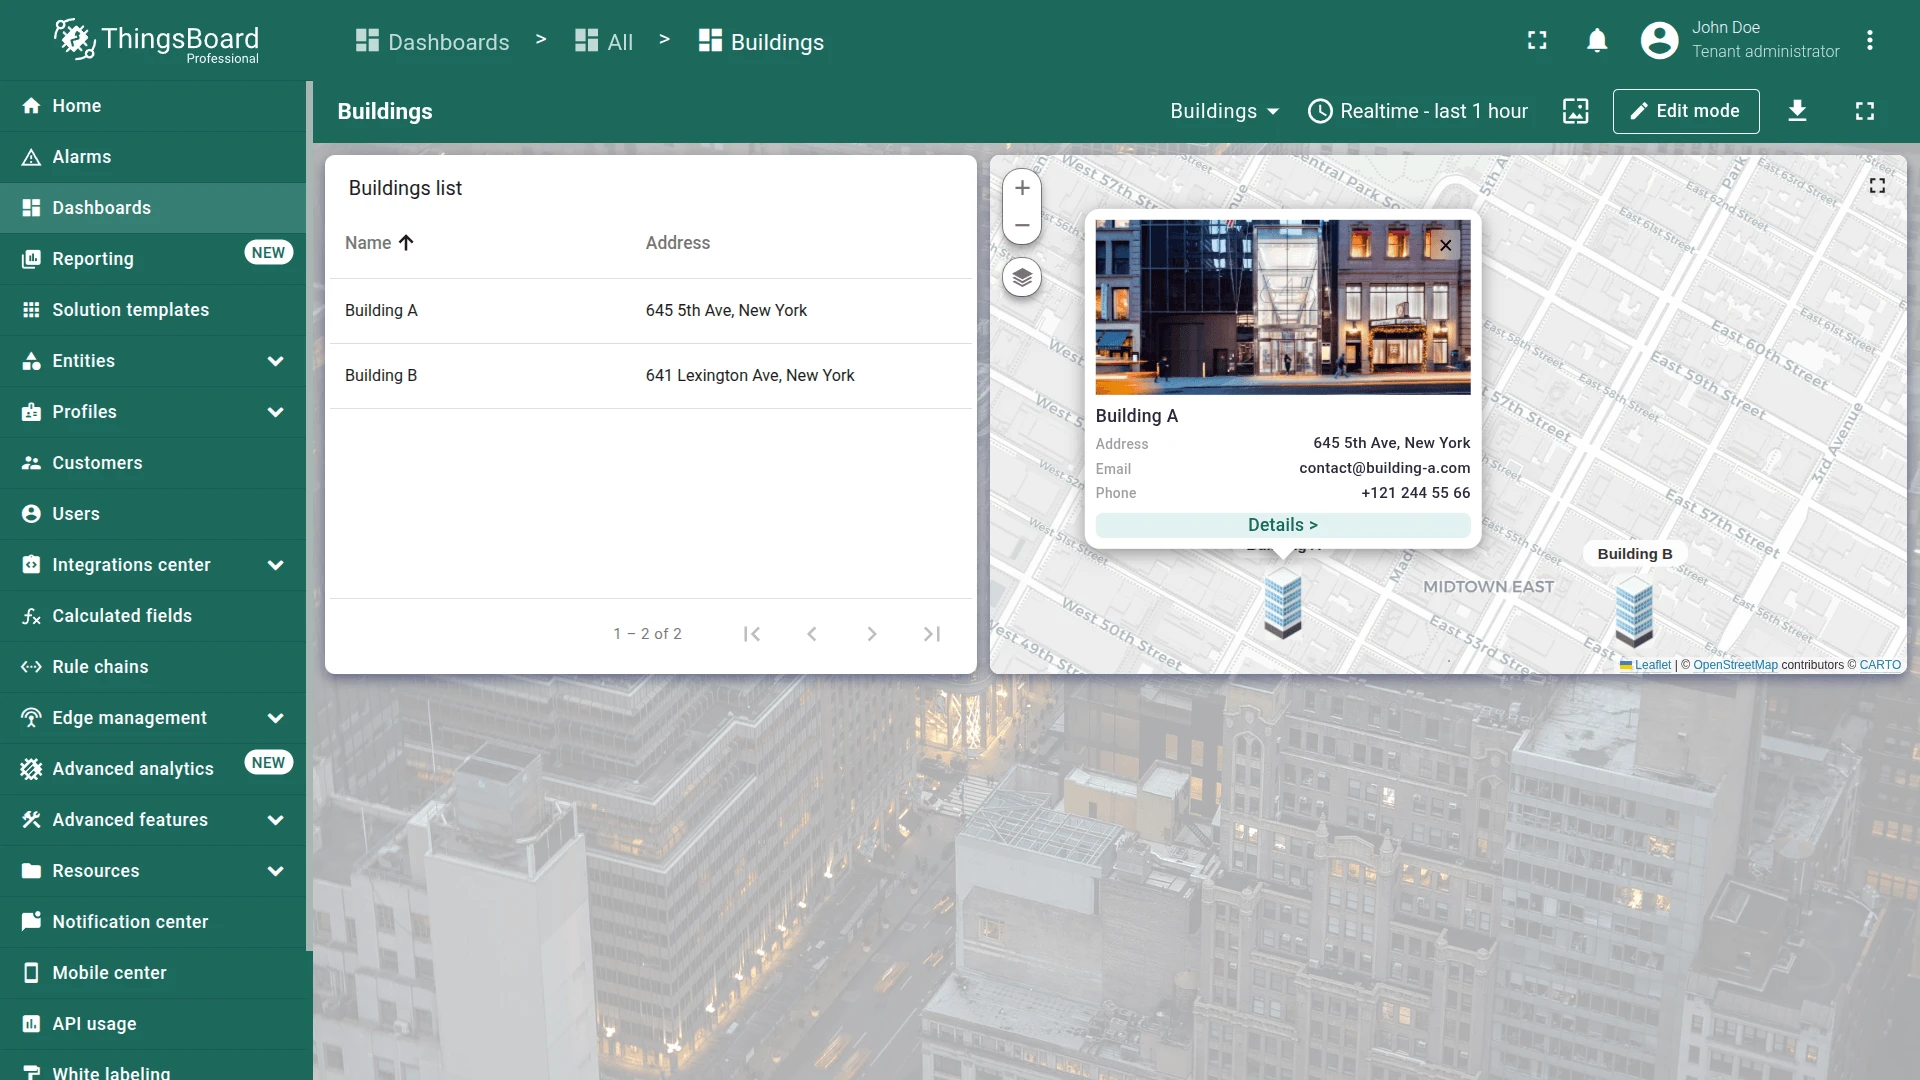
Final View
Section titled “Final View”As a result your dashboard should look like this:
Checklist for moving on
Section titled “Checklist for moving on”Was this helpful?