Speed Gauge
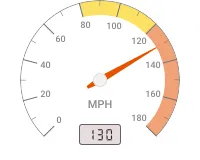
The Speed gauge is a semicircular dial styled after a classic speedometer, with color-coded zones that escalate from neutral through yellow to orange as values approach the configured maximum. Use it to convey how close a measured rate is to its operational limit — conveyor belt speed, motor RPM, wind speed, or network throughput where operators must immediately recognize when a value enters a warning or critical zone.
Adding the Widget
Section titled “Adding the Widget”- Open the dashboard in edit mode. Click Add widget in the top toolbar, or click the Add new widget icon in the center of an empty dashboard.
- In the widget bundle selection dialog, find and click Analogue gauges.
- Select the Speed gauge widget.
- Configure the datasource and appearance, then click Add.
Configuration
Section titled “Configuration”All settings in this section use Basic mode — a quick-start configuration covering the essentials. For finer widget controls like title font, card style, and tooltip, switch to the Advanced tab.
Datasource
Section titled “Datasource”Select the source of the speed value:
- Device — a specific device; the gauge displays the latest telemetry value from this device.
- Entity alias — a set of entities matched by an entity alias; use this when the target device is selected dynamically at runtime.
Add exactly one data key — the telemetry key whose value the gauge will display (for example, speed).
Gauge Appearance
Section titled “Gauge Appearance”Controls the visual elements of the dial face.
| Setting | Description |
|---|---|
| Units title | Toggle to show or hide a label in the center of the dial. Disabled by default — the dial face shows only the unit string. Enter the text and set its color and font when enabled. |
| Units | The unit string displayed in the center of the dial (default: mph). Set the display text, color, and font. Click the settings icon to configure unit conversion — see Unit conversion. |
| Value | Toggle to show or hide the digital readout at the bottom of the dial. Set the number of digits and the text color and font. |
| Ticks | The minimum and maximum values displayed on the scale (default: 0 to 180). Set tick label color and font. |
| Arrow and scale default color | The color of the needle and the unmarked portion of the scale arc. |
| Plate color | Background fill color of the gauge face. |
| Scale colors | Toggle to enable range-based color zones on the scale arc. When enabled, click the color swatch to open the Color settings dialog and define value ranges with individual colors — for example, yellow from 80 to 100 and orange from 120 to 180 to mark caution and high-speed zones. |
Card Appearance
Section titled “Card Appearance”| Setting | Description |
|---|---|
| Background color | Solid color background for the widget card. |
| Show card buttons | Toggle Data export and Fullscreen buttons in the widget header. |
| Card border radius | Corner rounding in pixels. |
Actions
Section titled “Actions”The Speed gauge supports the Widget header button action — a button placed in the widget header that triggers a configured action when clicked.
Troubleshooting
Section titled “Troubleshooting”Gauge Shows No Data
| Cause | Solution |
|---|---|
| Wrong data key name | Confirm the key name matches the telemetry key sent by the device. Key names are case-sensitive. |
| Device not sending data | Open Devices → Latest telemetry and check for recent values. If empty, verify the device transport configuration and access token. |
| Entity alias resolves to no entities | Open Entity aliases in the dashboard and verify the alias returns results. |
Needle Is Pegged at the Minimum or Maximum
| Cause | Solution |
|---|---|
| Ticks range too narrow | Increase the Ticks max value to cover the actual value range reported by the device. |
| Wrong telemetry key selected | Confirm the data key matches the key your device actually reports. |
Value Shows as N/A or Stops Updating
| Cause | Solution |
|---|---|
| Device has stopped sending telemetry | Check device connectivity and the last activity timestamp in Devices → Latest telemetry. |
| Wrong datasource entity selected | Verify the correct device or alias is selected in the datasource configuration. |
Was this helpful?