AI Predictive Maintenance
This guide builds an end-to-end IoT anomaly detection pipeline: devices send vibration, temperature, and acoustic data ⇾ Calculated Fields maintain a rolling window ⇾ an AI request rule node classifies anomalies ⇾ ThingsBoard creates alarms and sends notifications.
Architecture
Section titled “Architecture”

Prerequisites
Section titled “Prerequisites”- ThingsBoard version 4.2+.
- Device(s) capable of sending the required telemetry values (this guide emulates them with
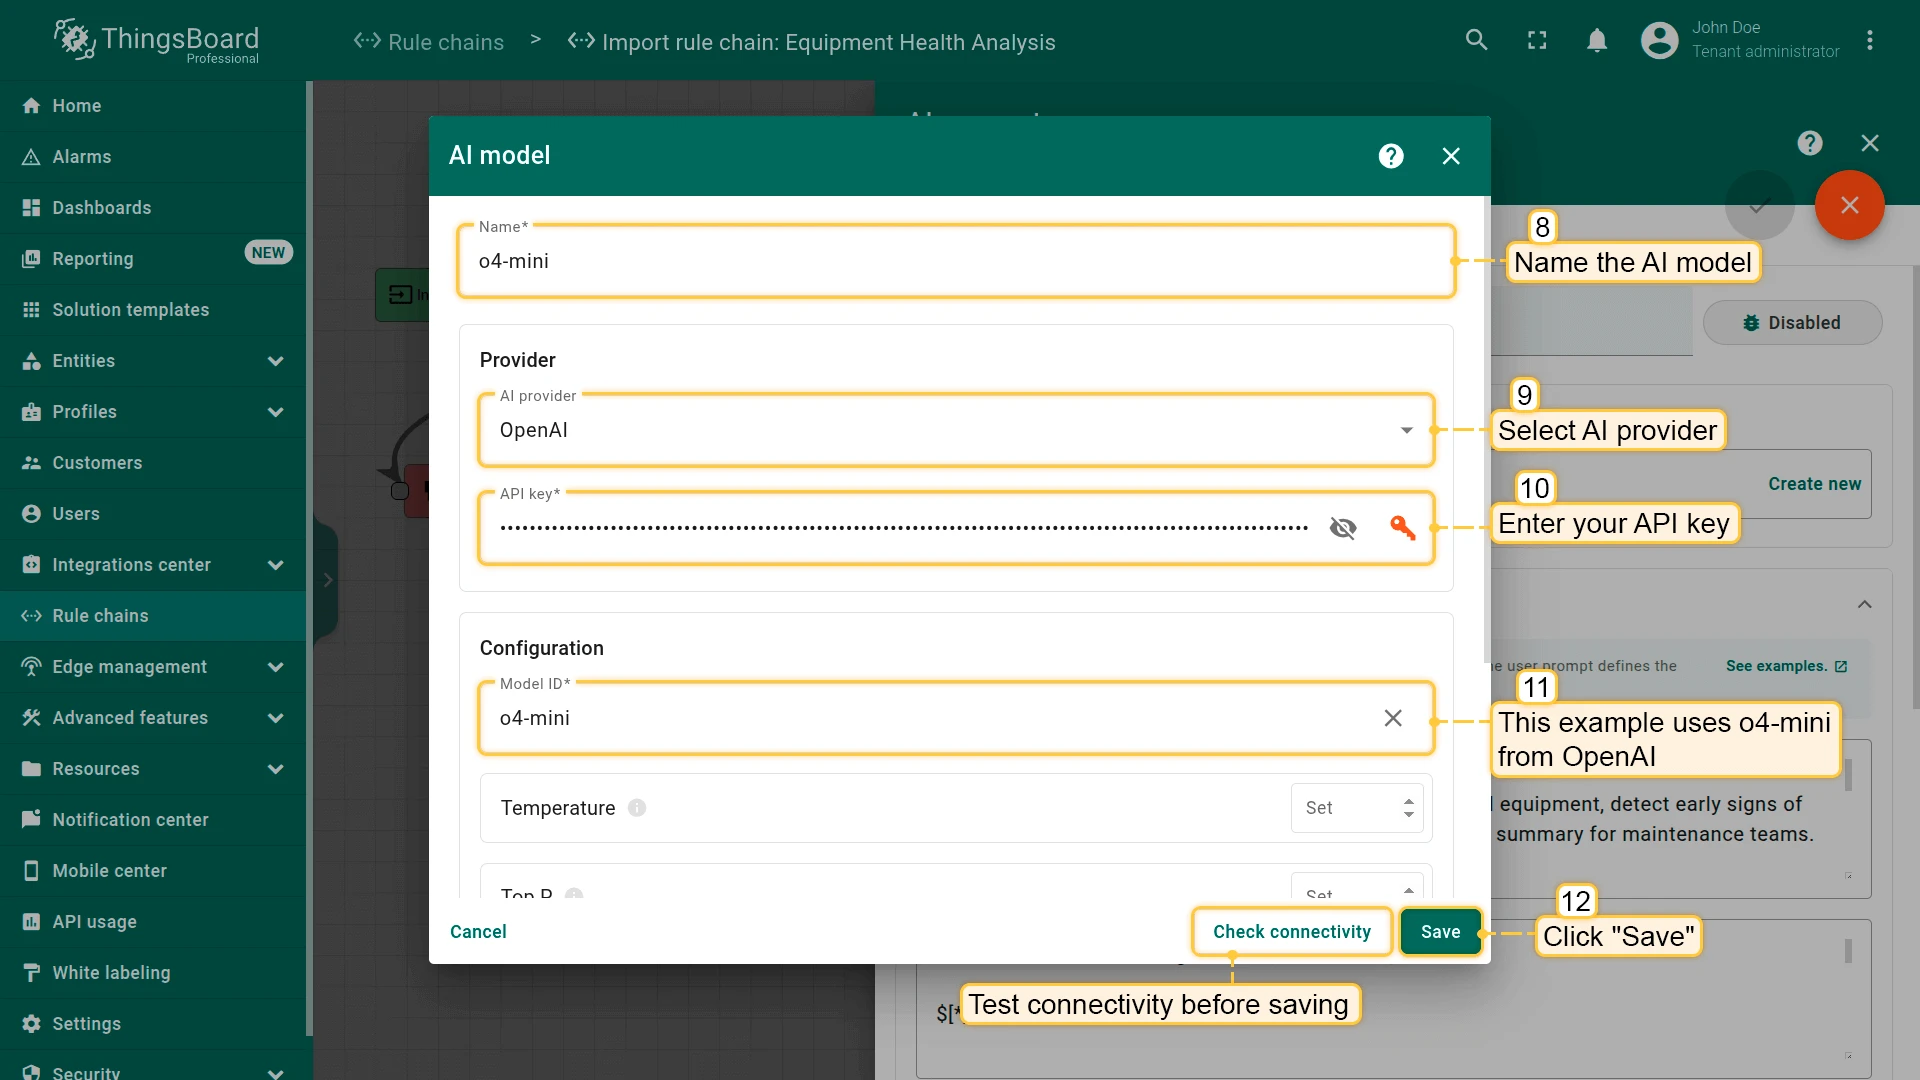
curl). - LLM provider credentials (OpenAI, Azure OpenAI, etc.) — see AI models.
Telemetry input and output
Section titled “Telemetry input and output”Expected telemetry keys (per device):
| Key | Type | Description |
|---|---|---|
vibration | float | Vibration level in mm/s |
temperature | float | Temperature in °C |
acousticDev | float | Acoustic deviation from baseline in % |
AI output (JSON):
{ "anomaly": "Bearing Wear", "summary": "Vibration has reached 7.4 mm/s and temperature is at 86 °C accompanied by irregular acoustic patterns, indicating bearing wear. Recommend immediate bearing inspection and replacement to avoid catastrophic failure."}Calculated field configuration
Section titled “Calculated field configuration”The calculated field maintains a rolling window of the last 100 readings (configurable, maximum 1000) and forwards them to the rule engine as a single message.
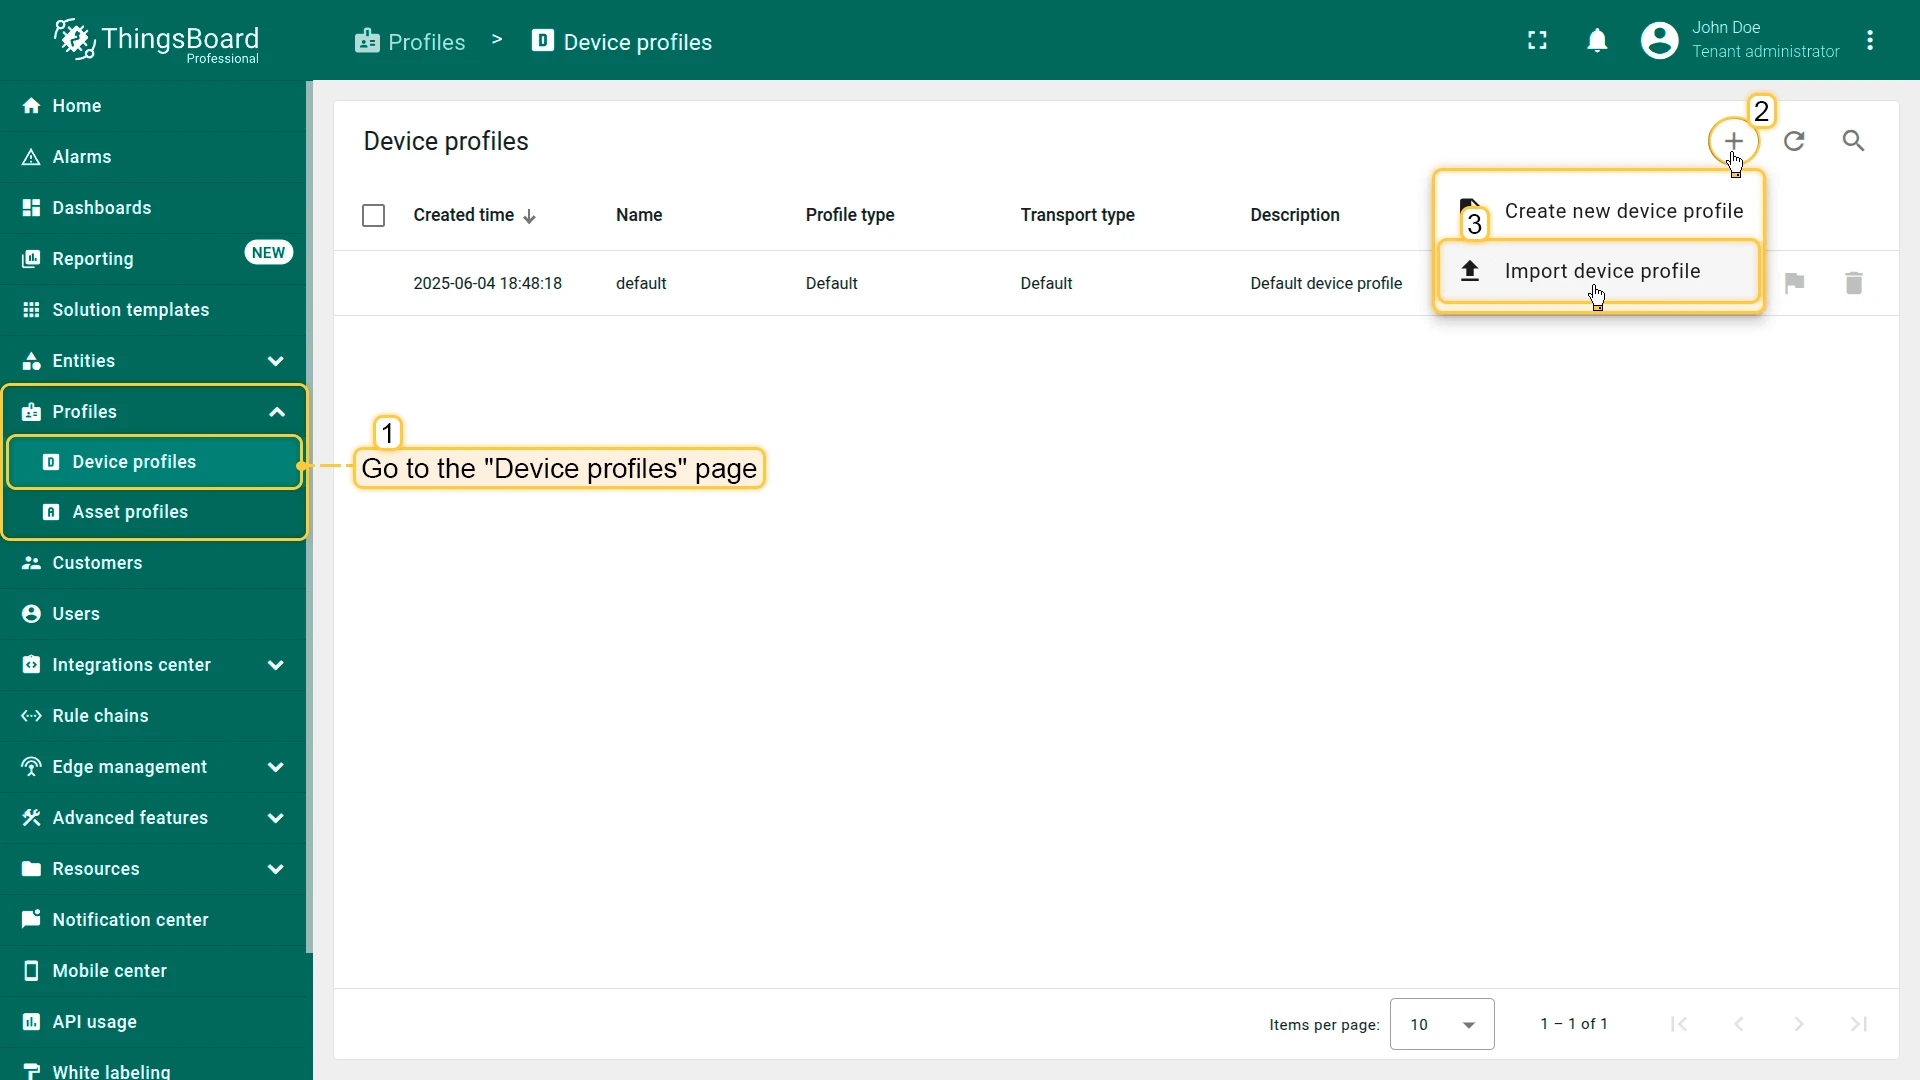
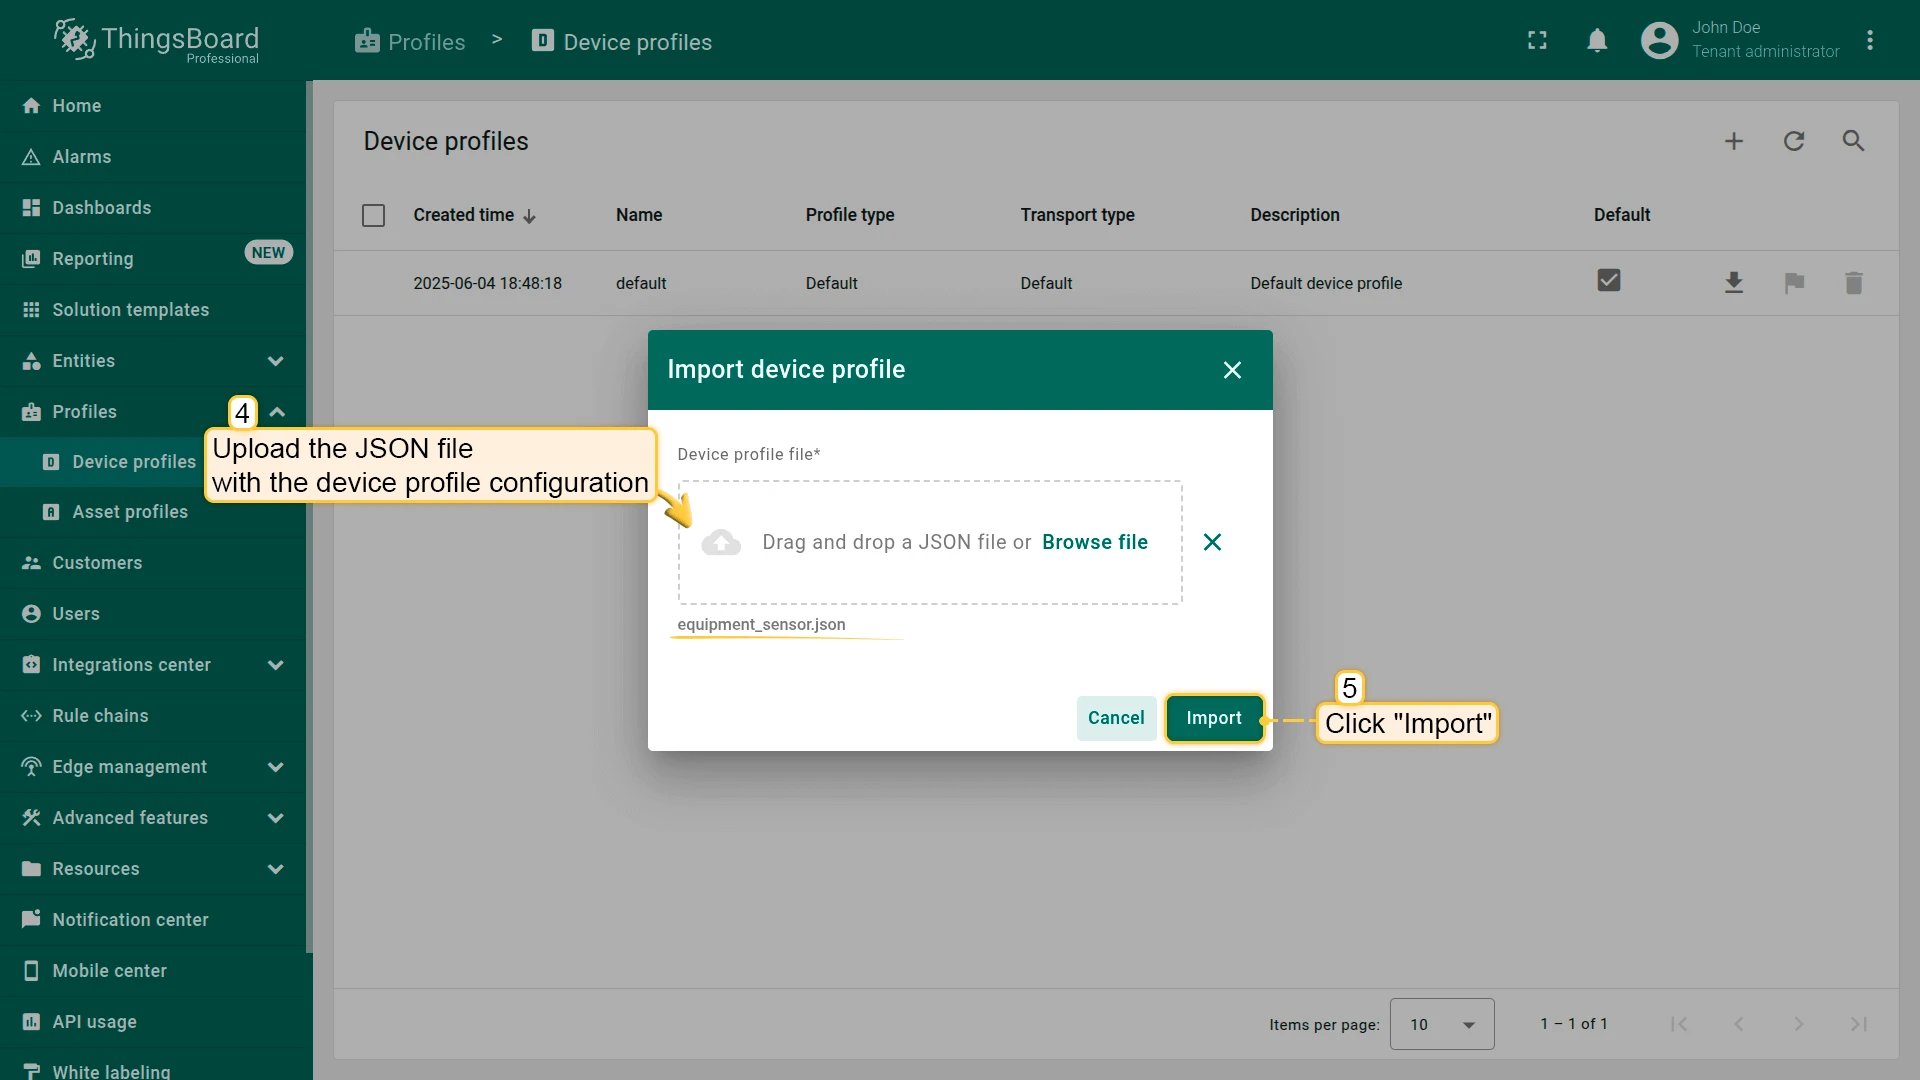
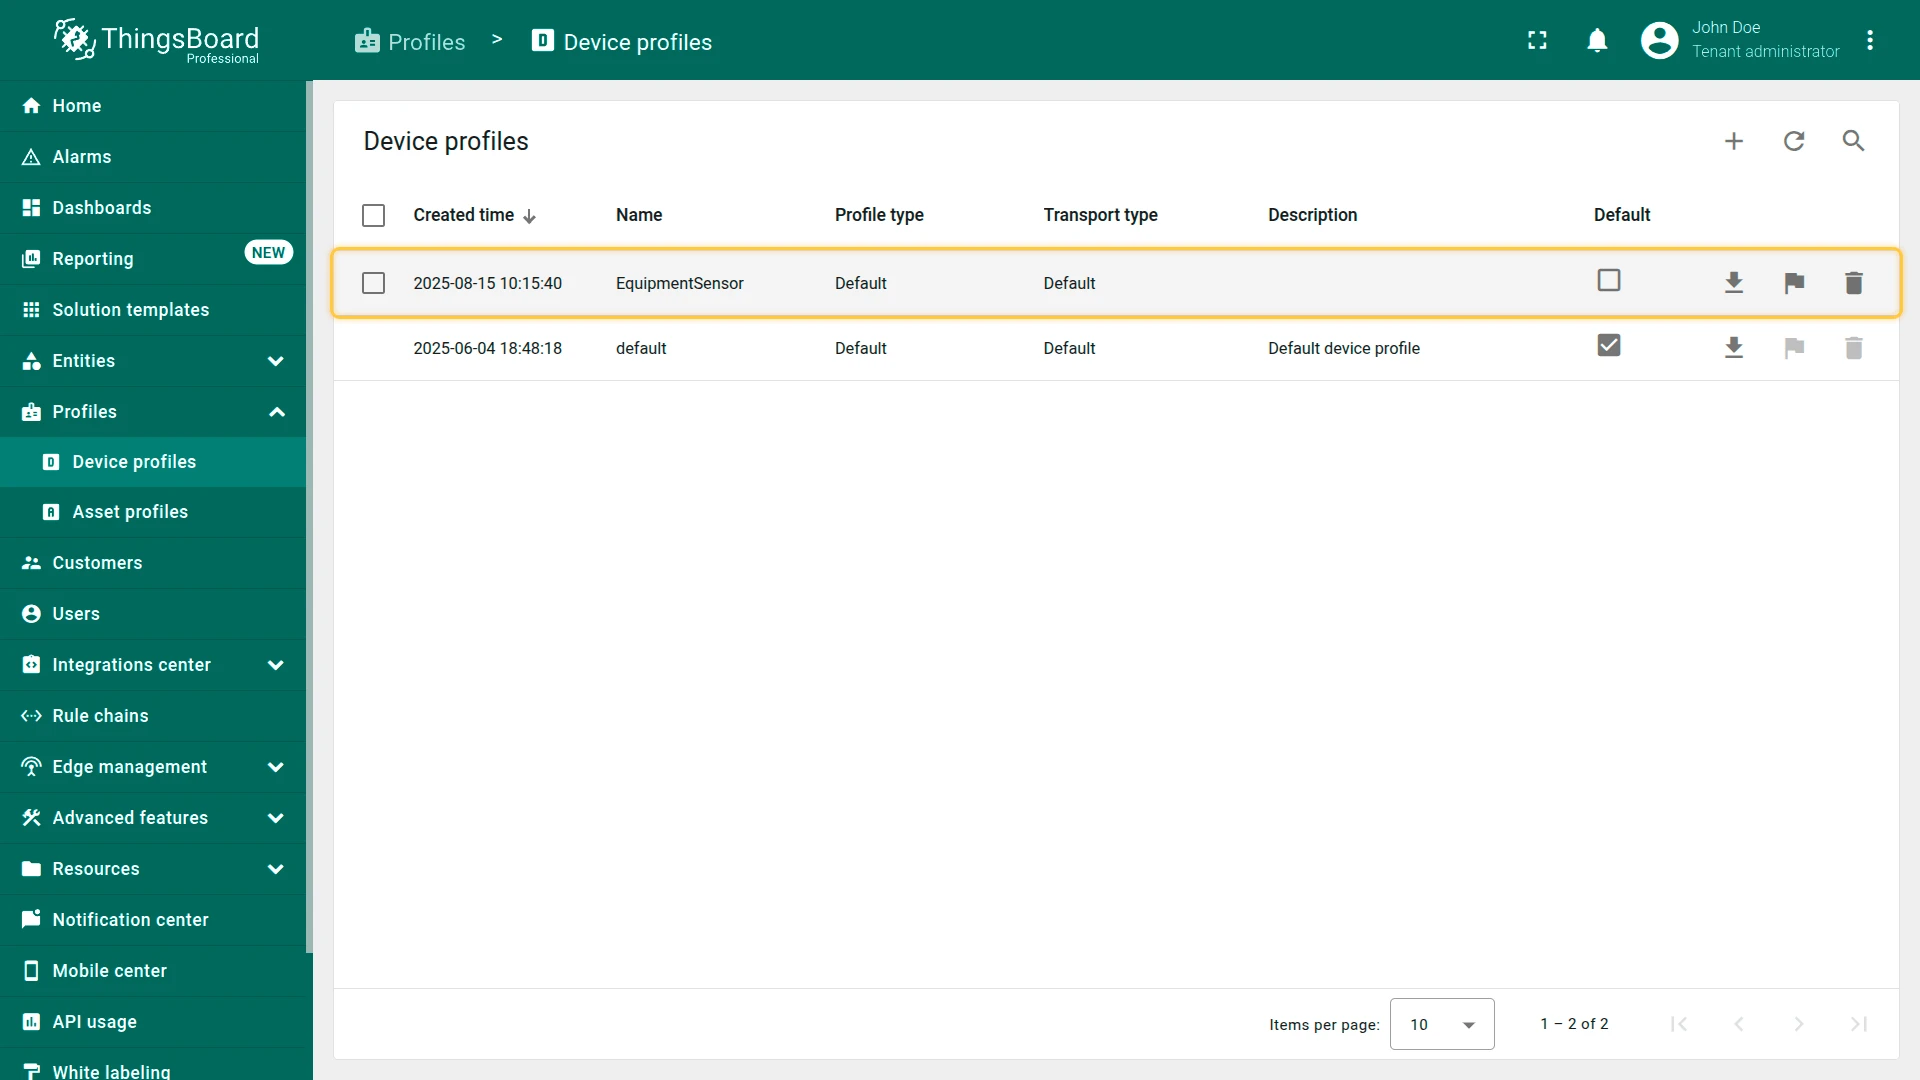
-
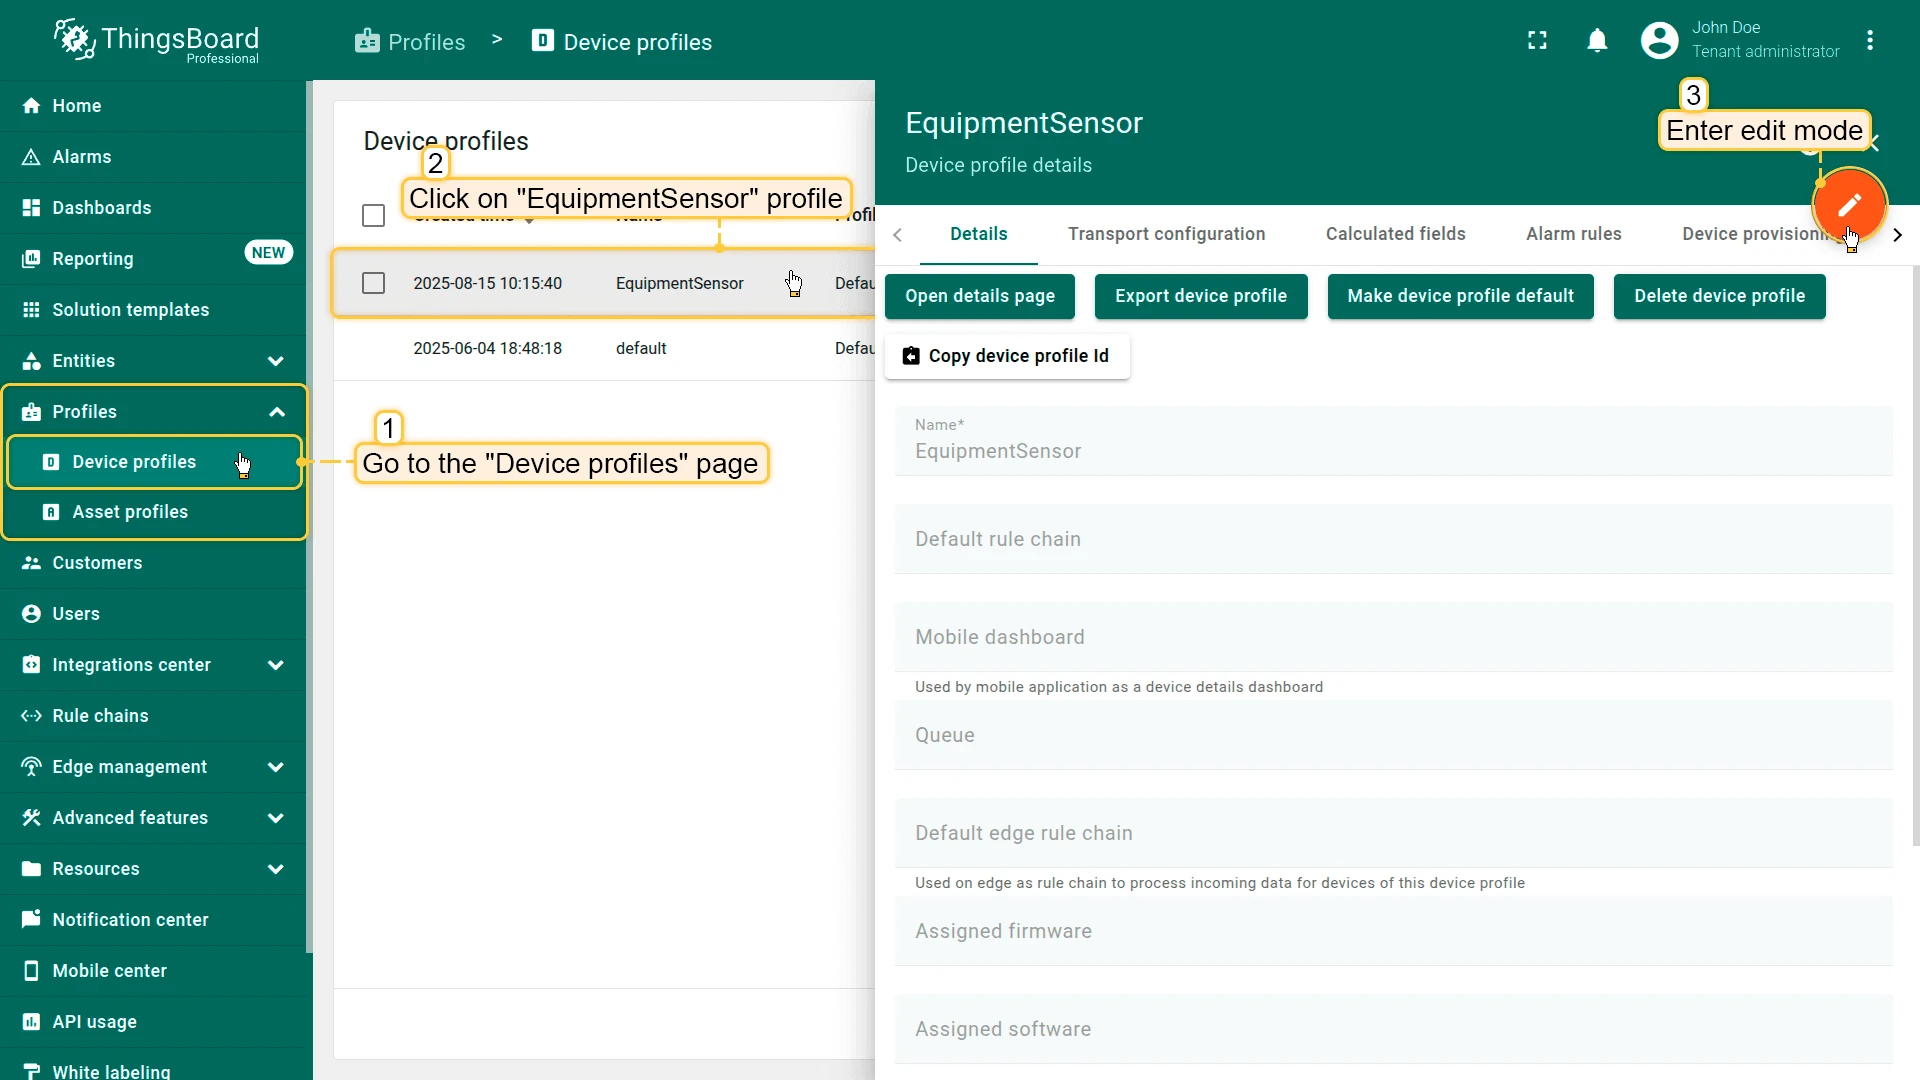
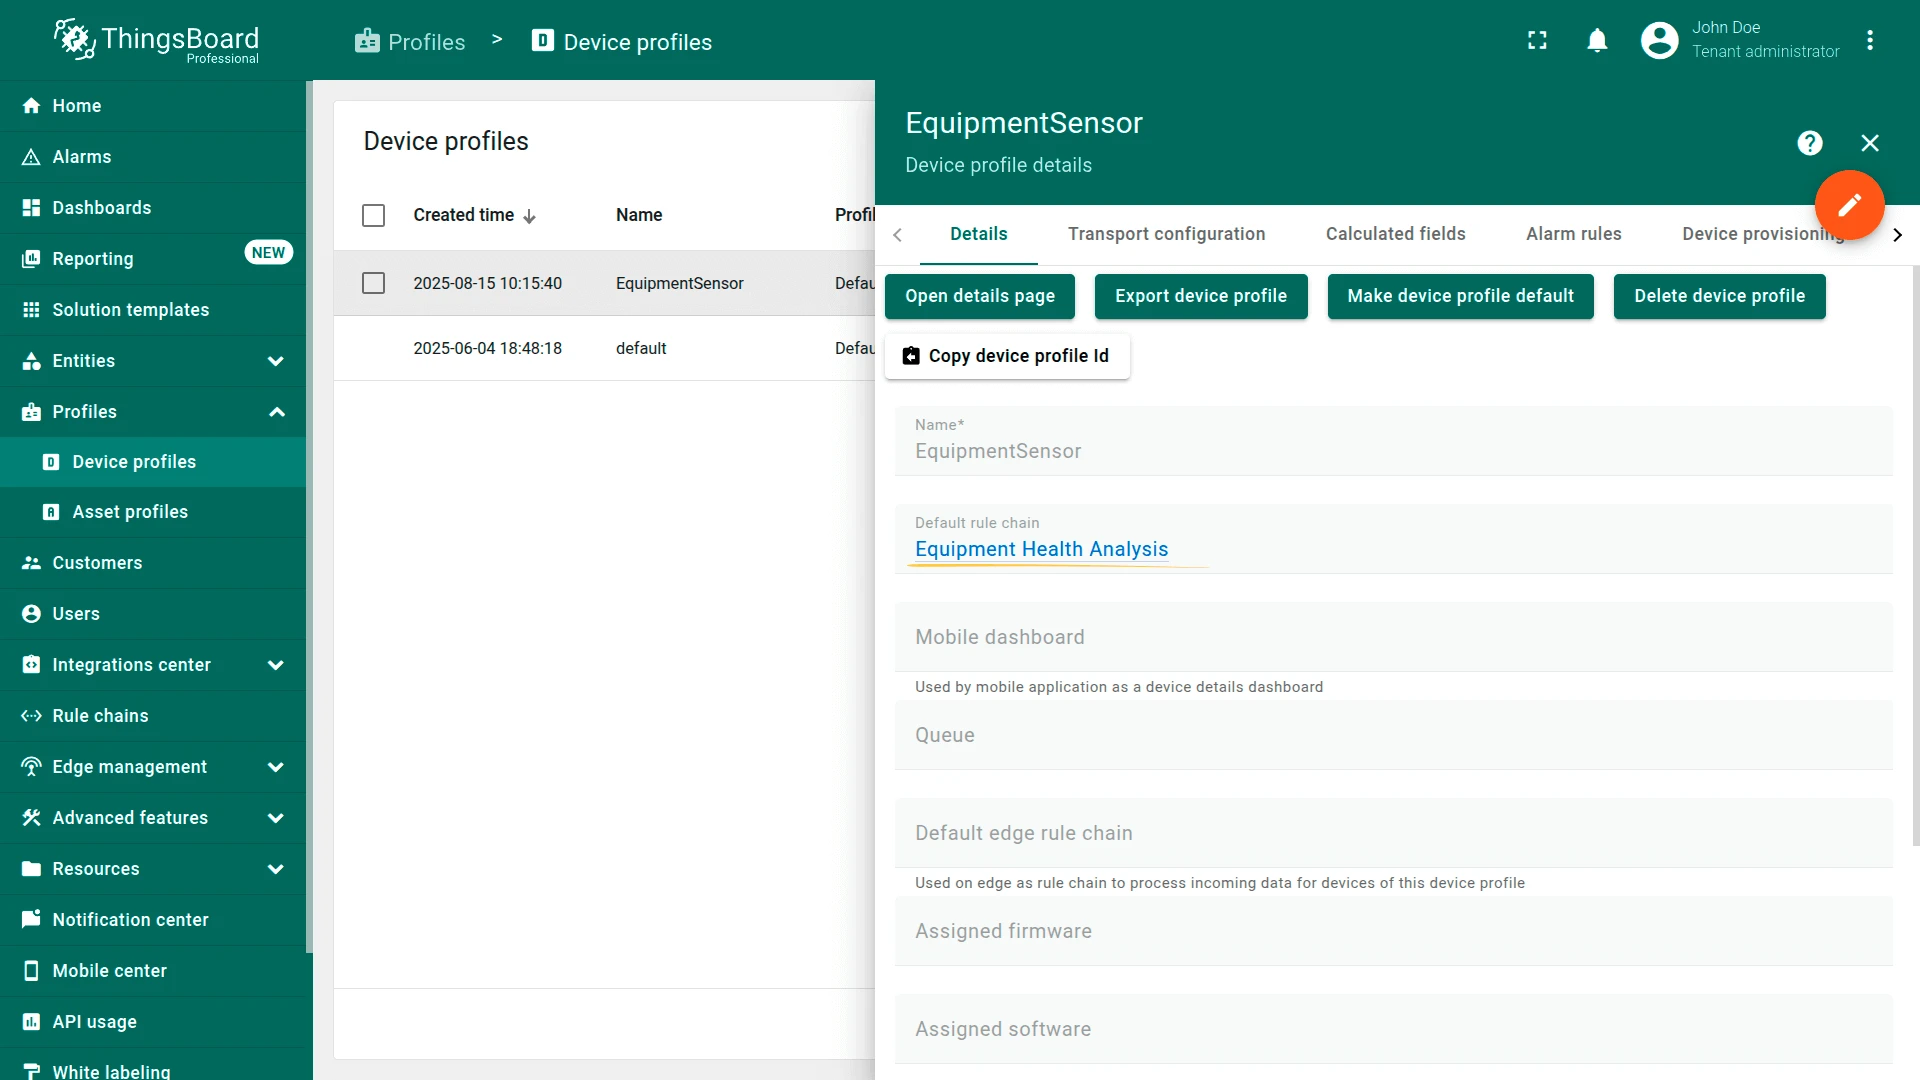
Download and import the EquipmentSensor device profile into your ThingsBoard instance.
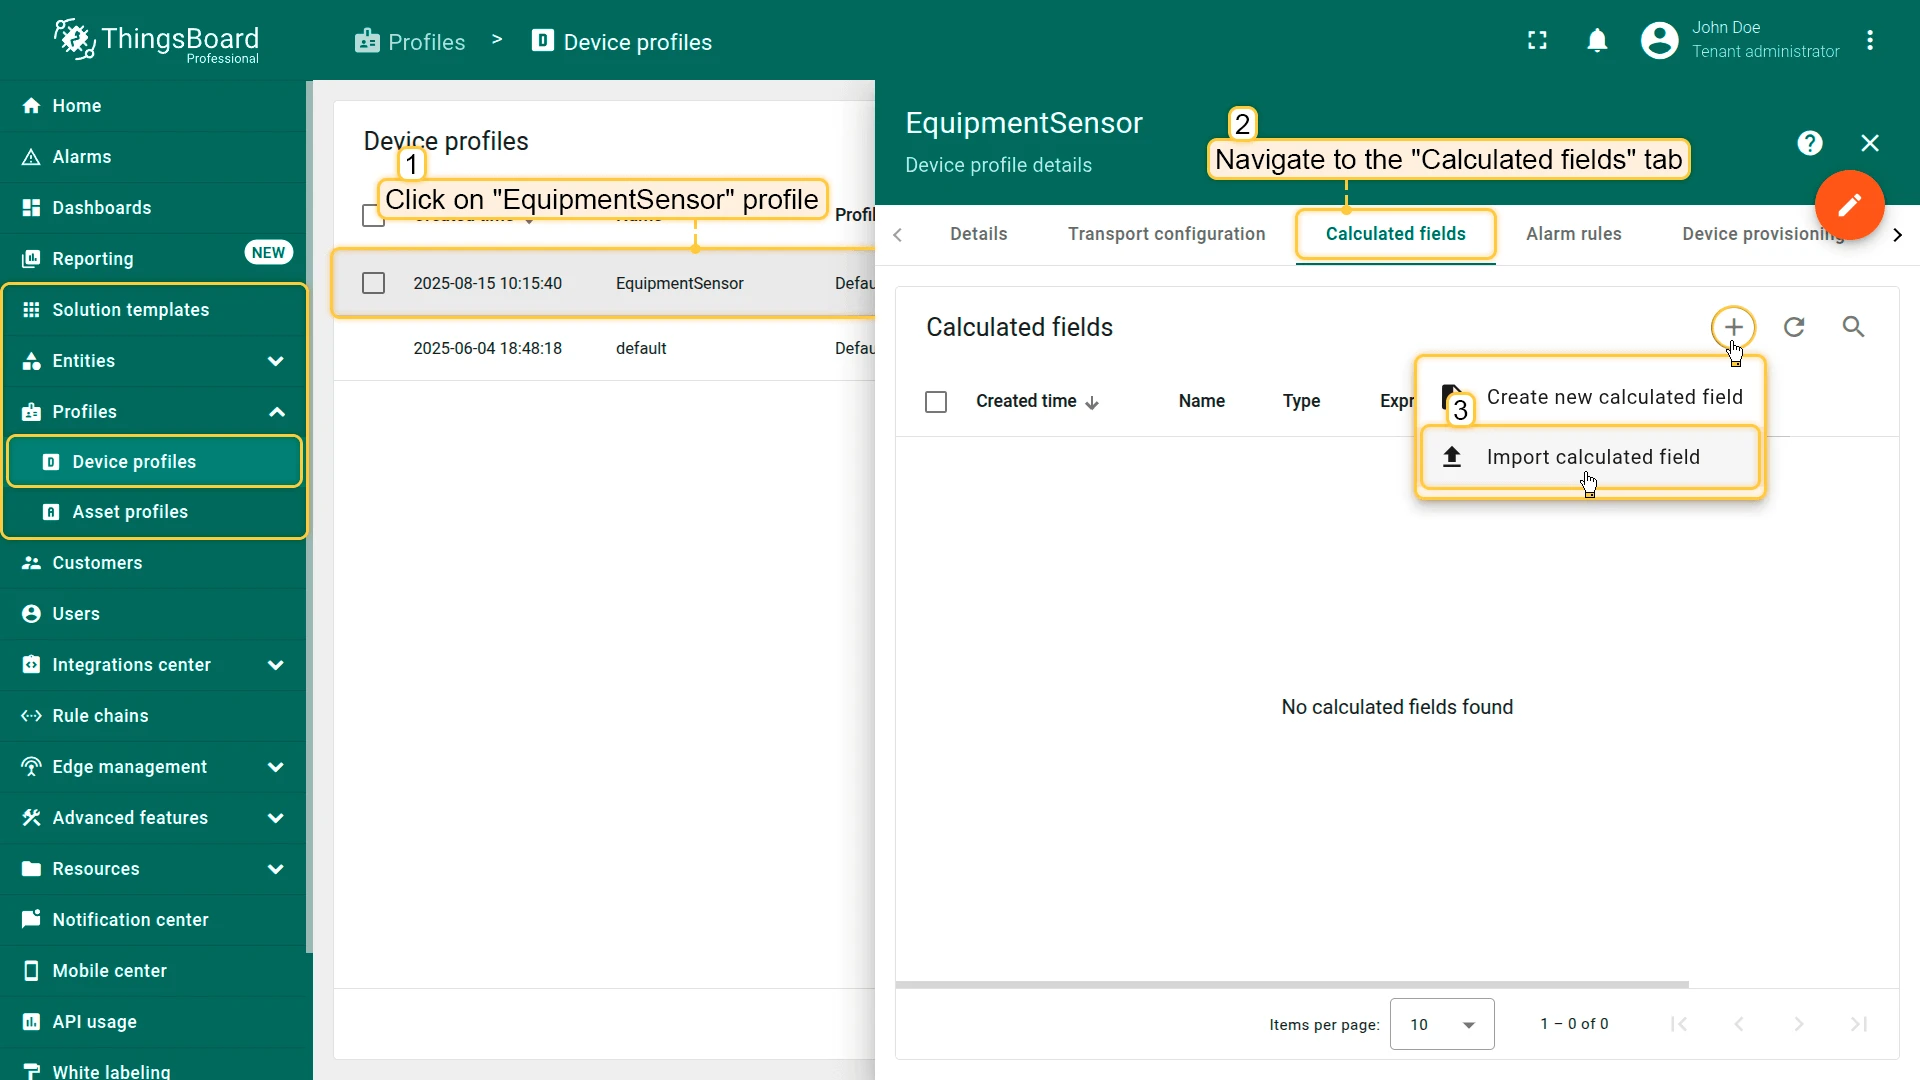
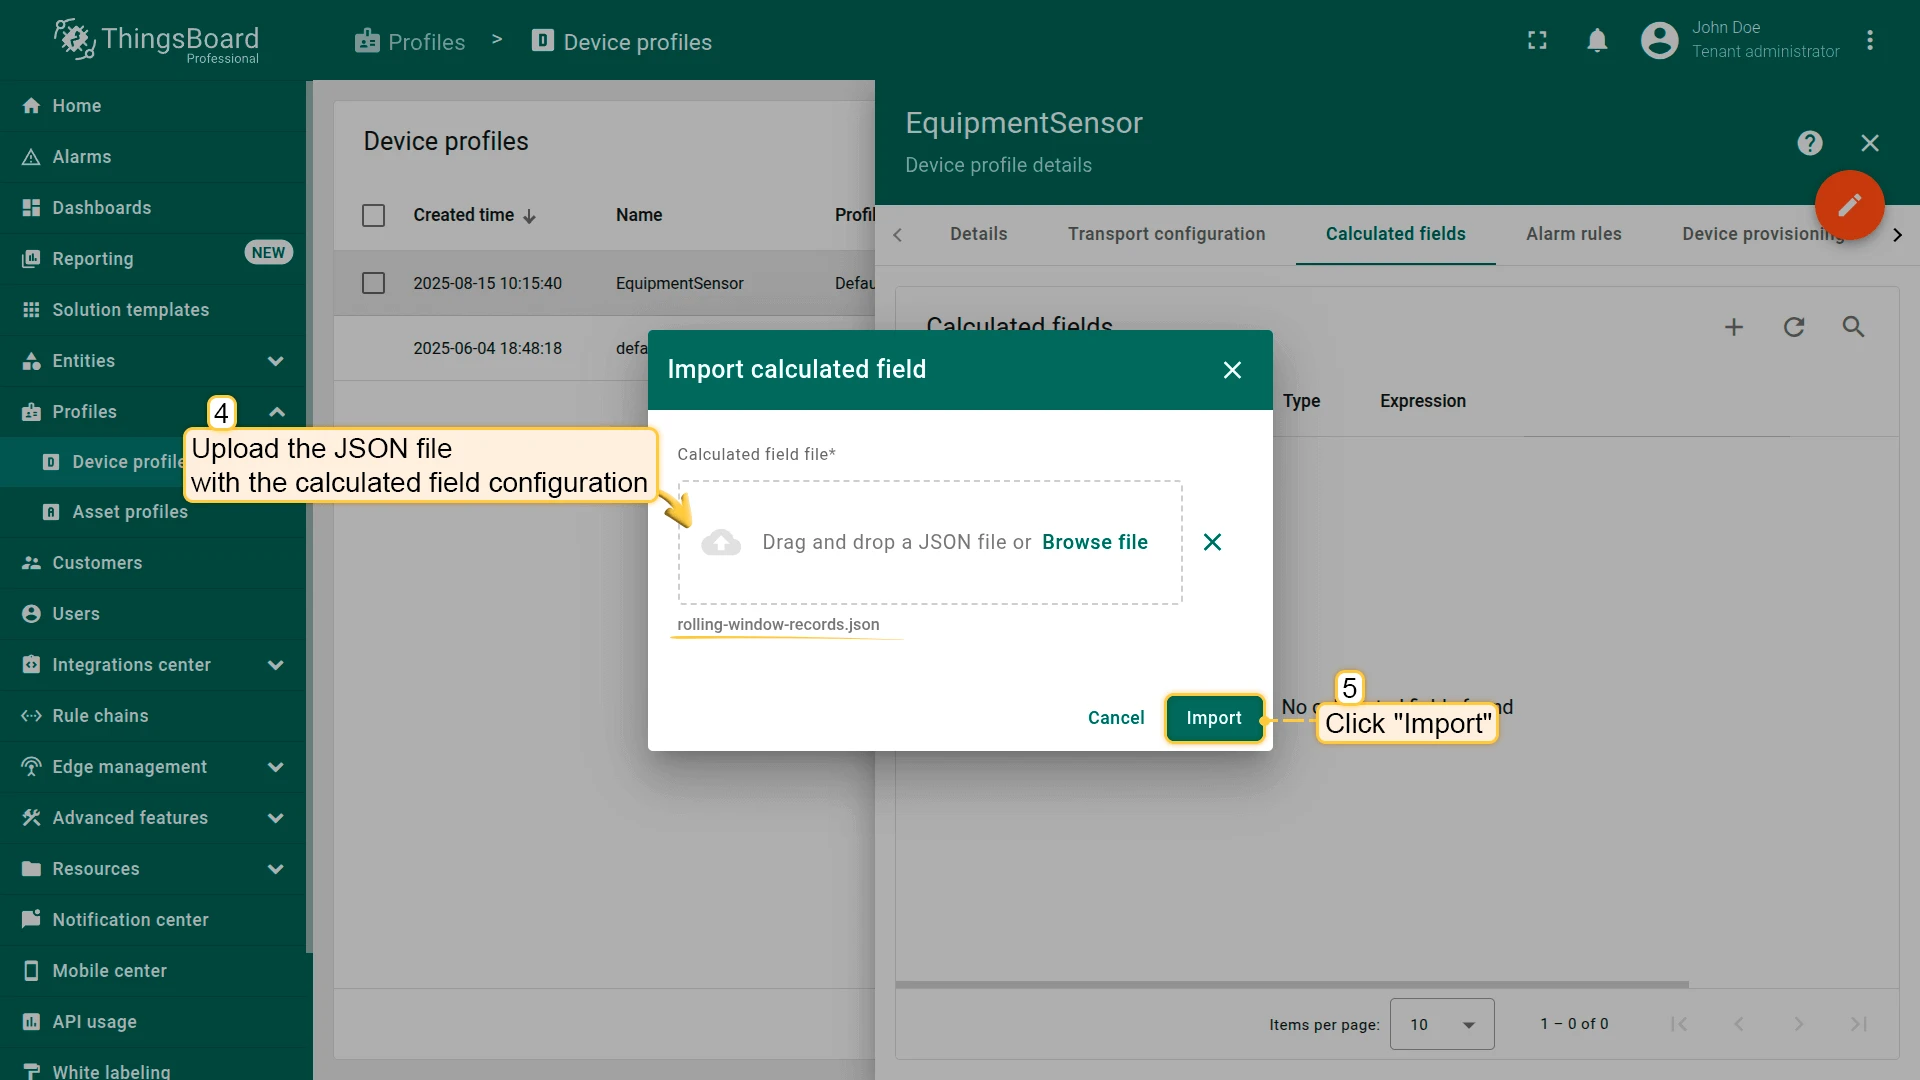
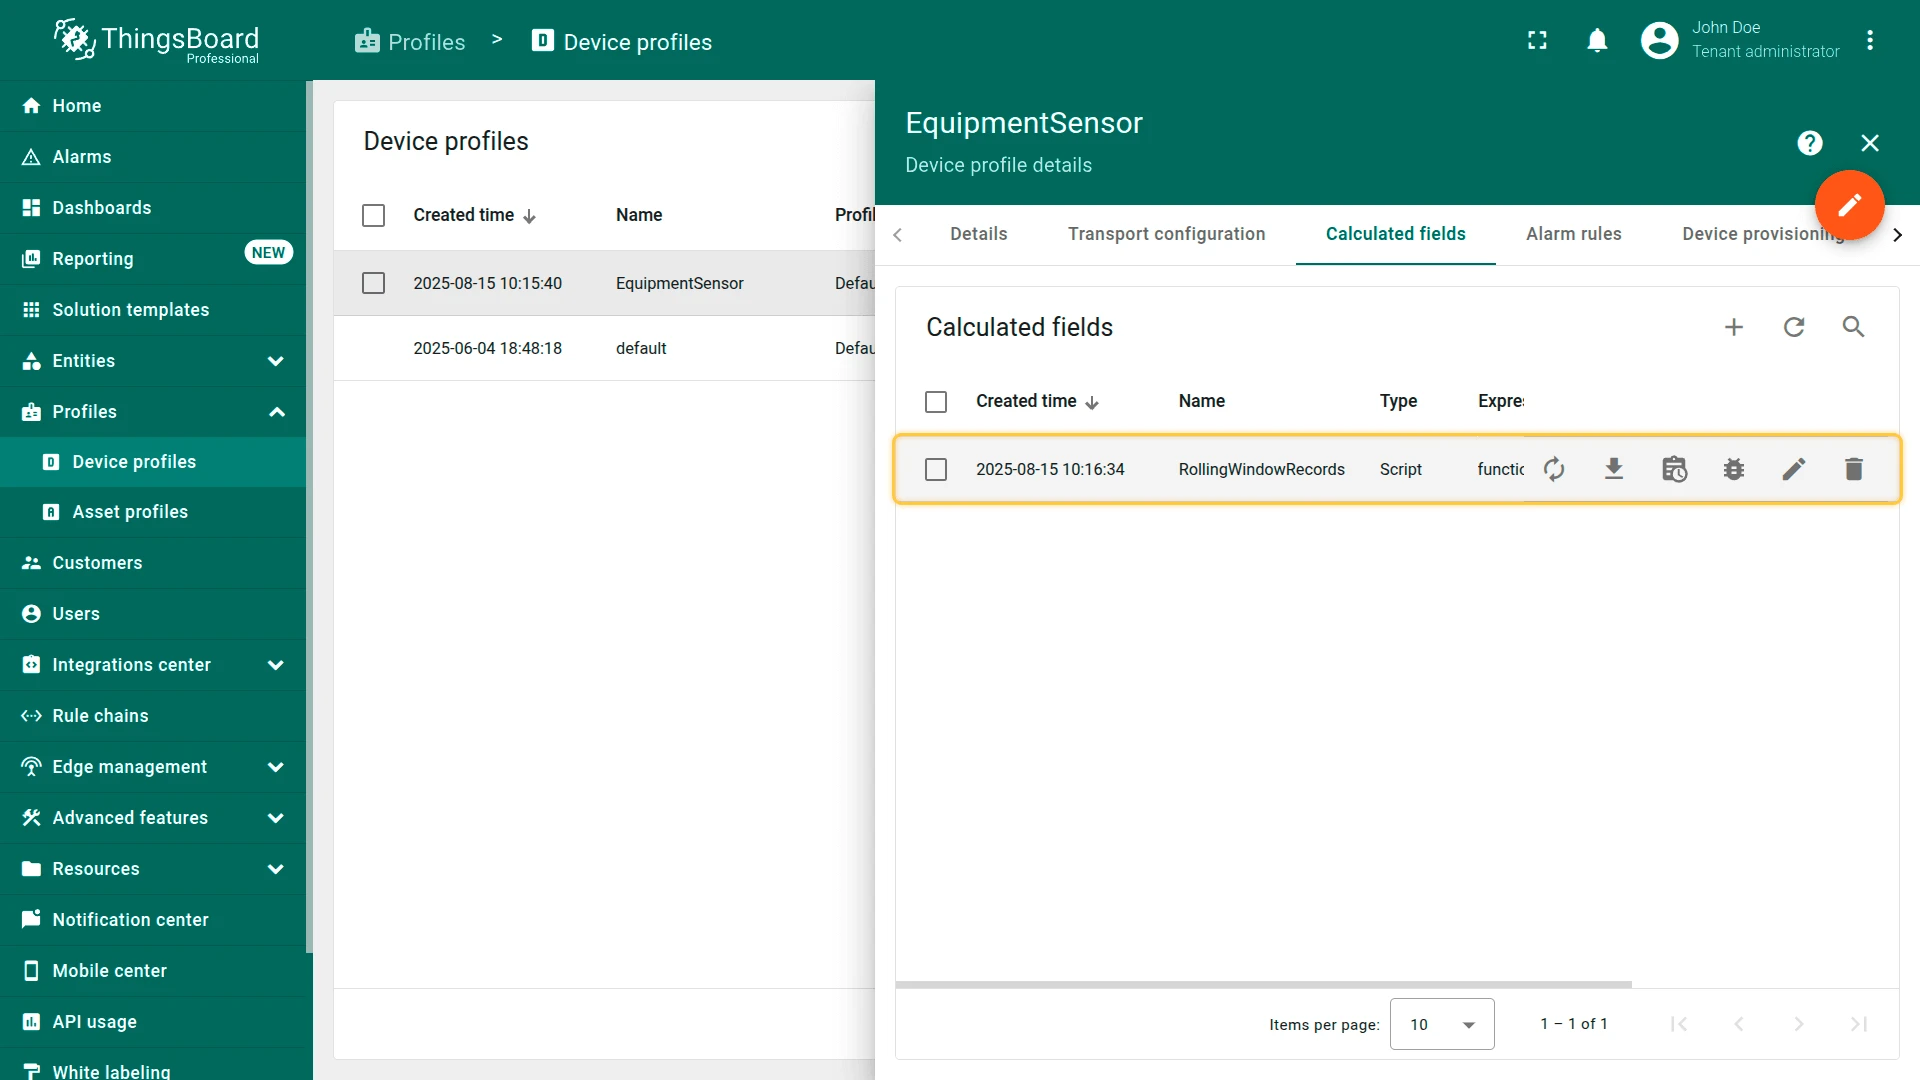
-
Download and import the calculated field into the EquipmentSensor device profile.
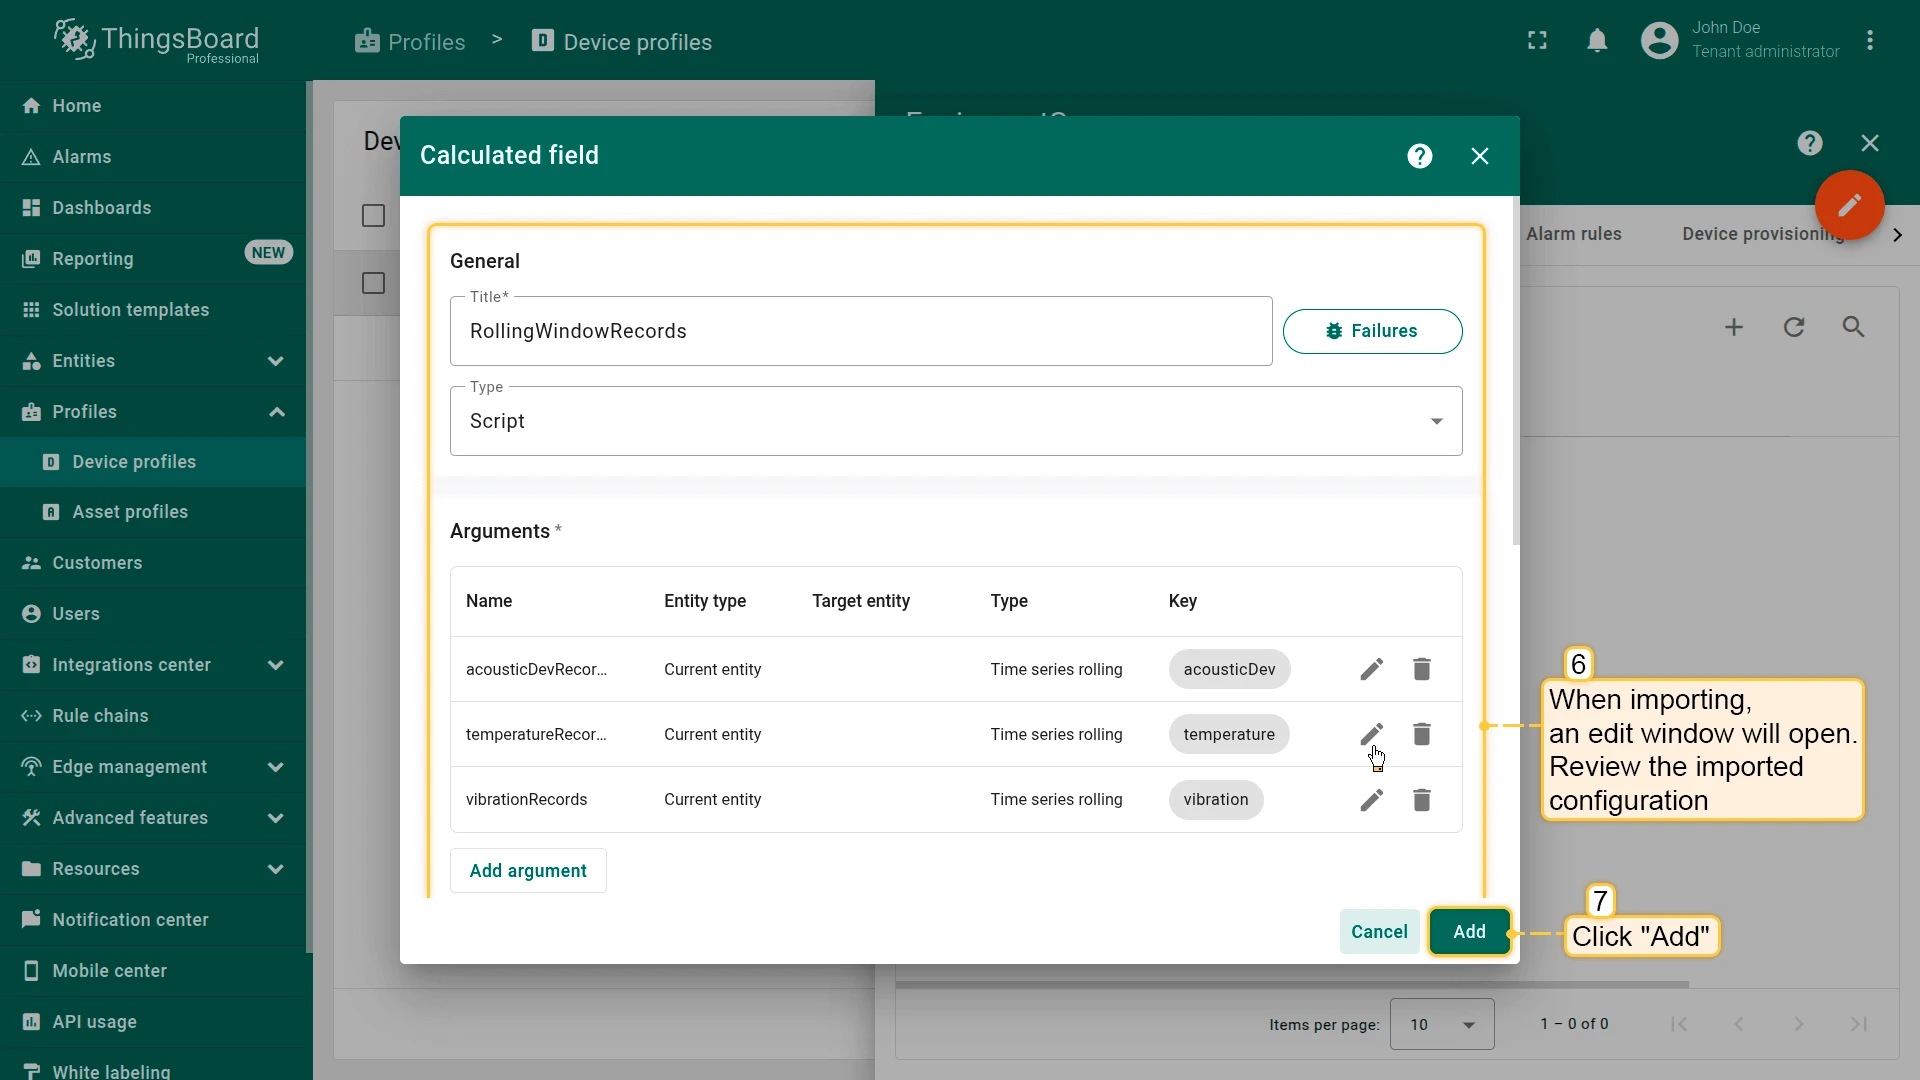
Key notes:
- Rolling window time range is set to 1 day.
- The number of stored values is set to 100. The default maximum is 1000, configurable in system settings.
- The TBEL script outputs the rolling values in a single message to the rule engine:
// Output raw values of the rolling argumentsreturn { "acousticDevRecords": acousticDevRecords, "temperatureRecords": temperatureRecords, "vibrationRecords": vibrationRecords};Rule chain configuration
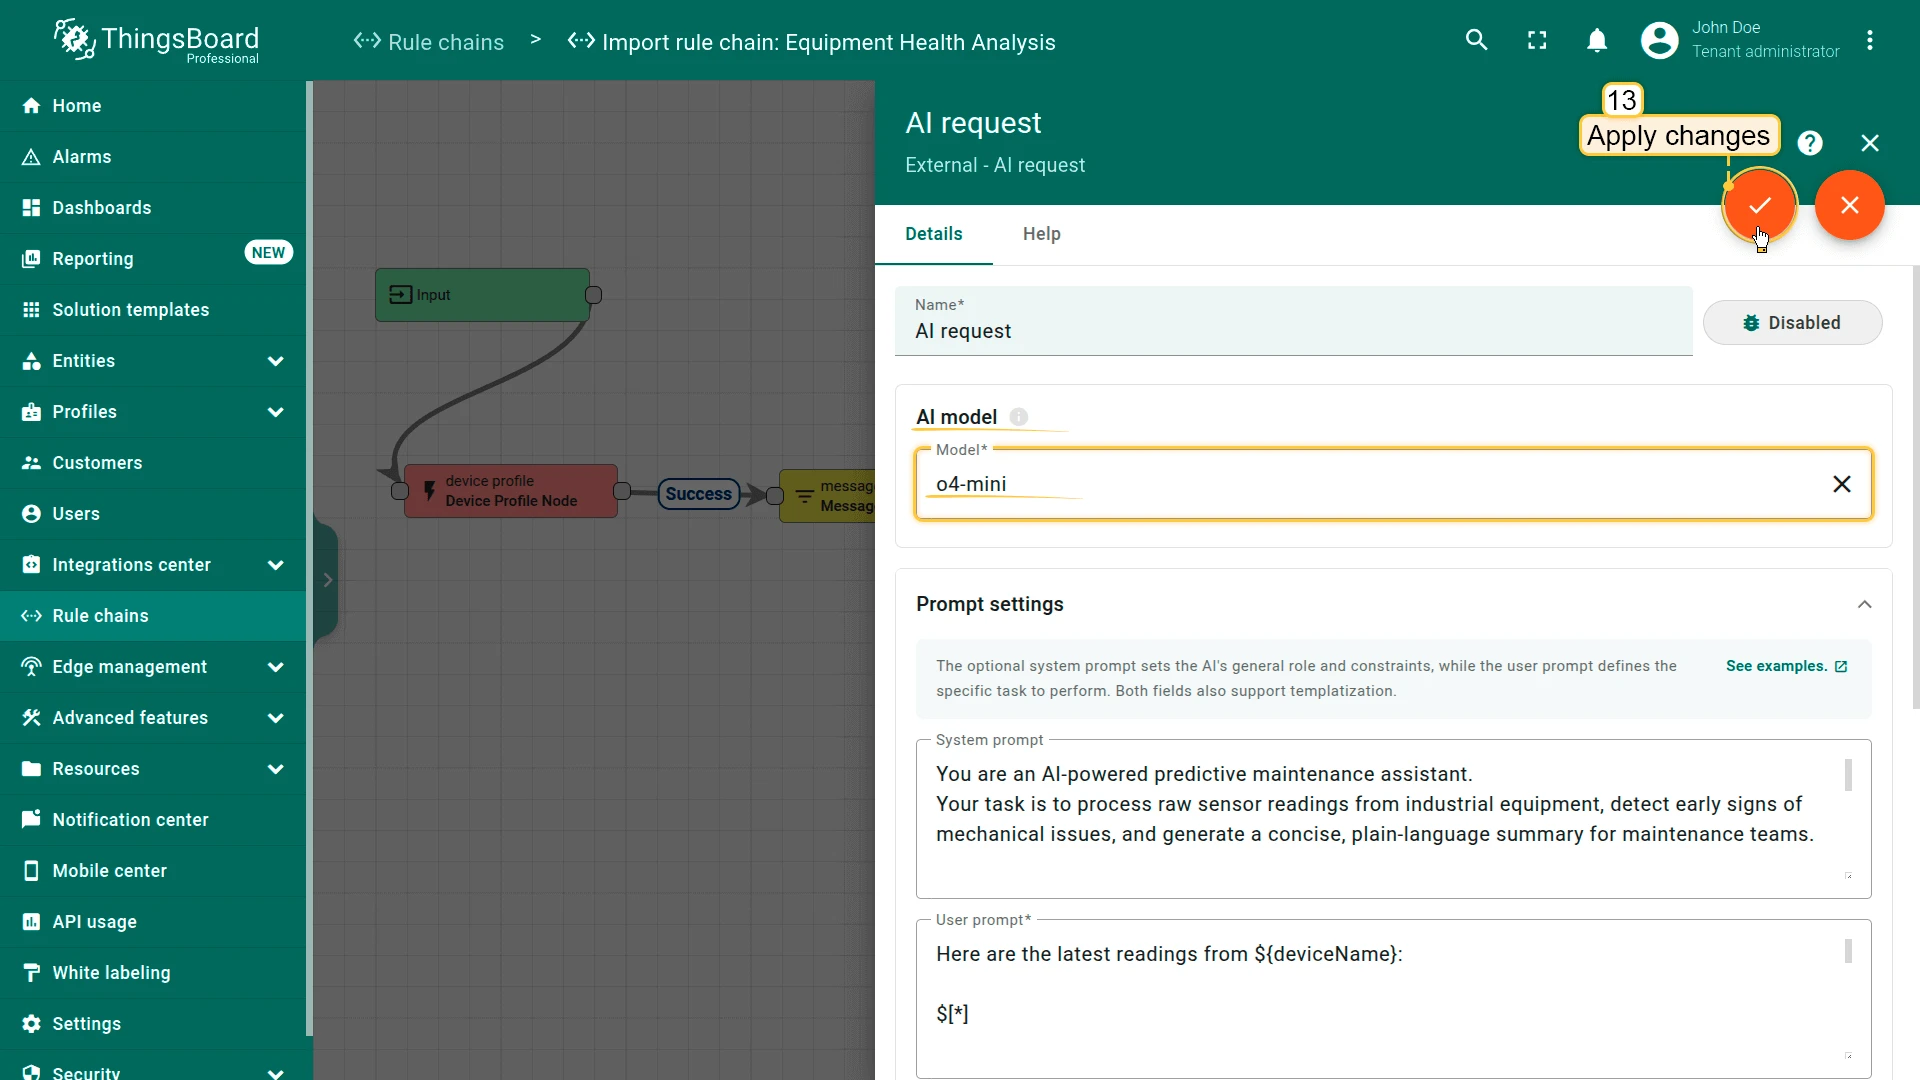
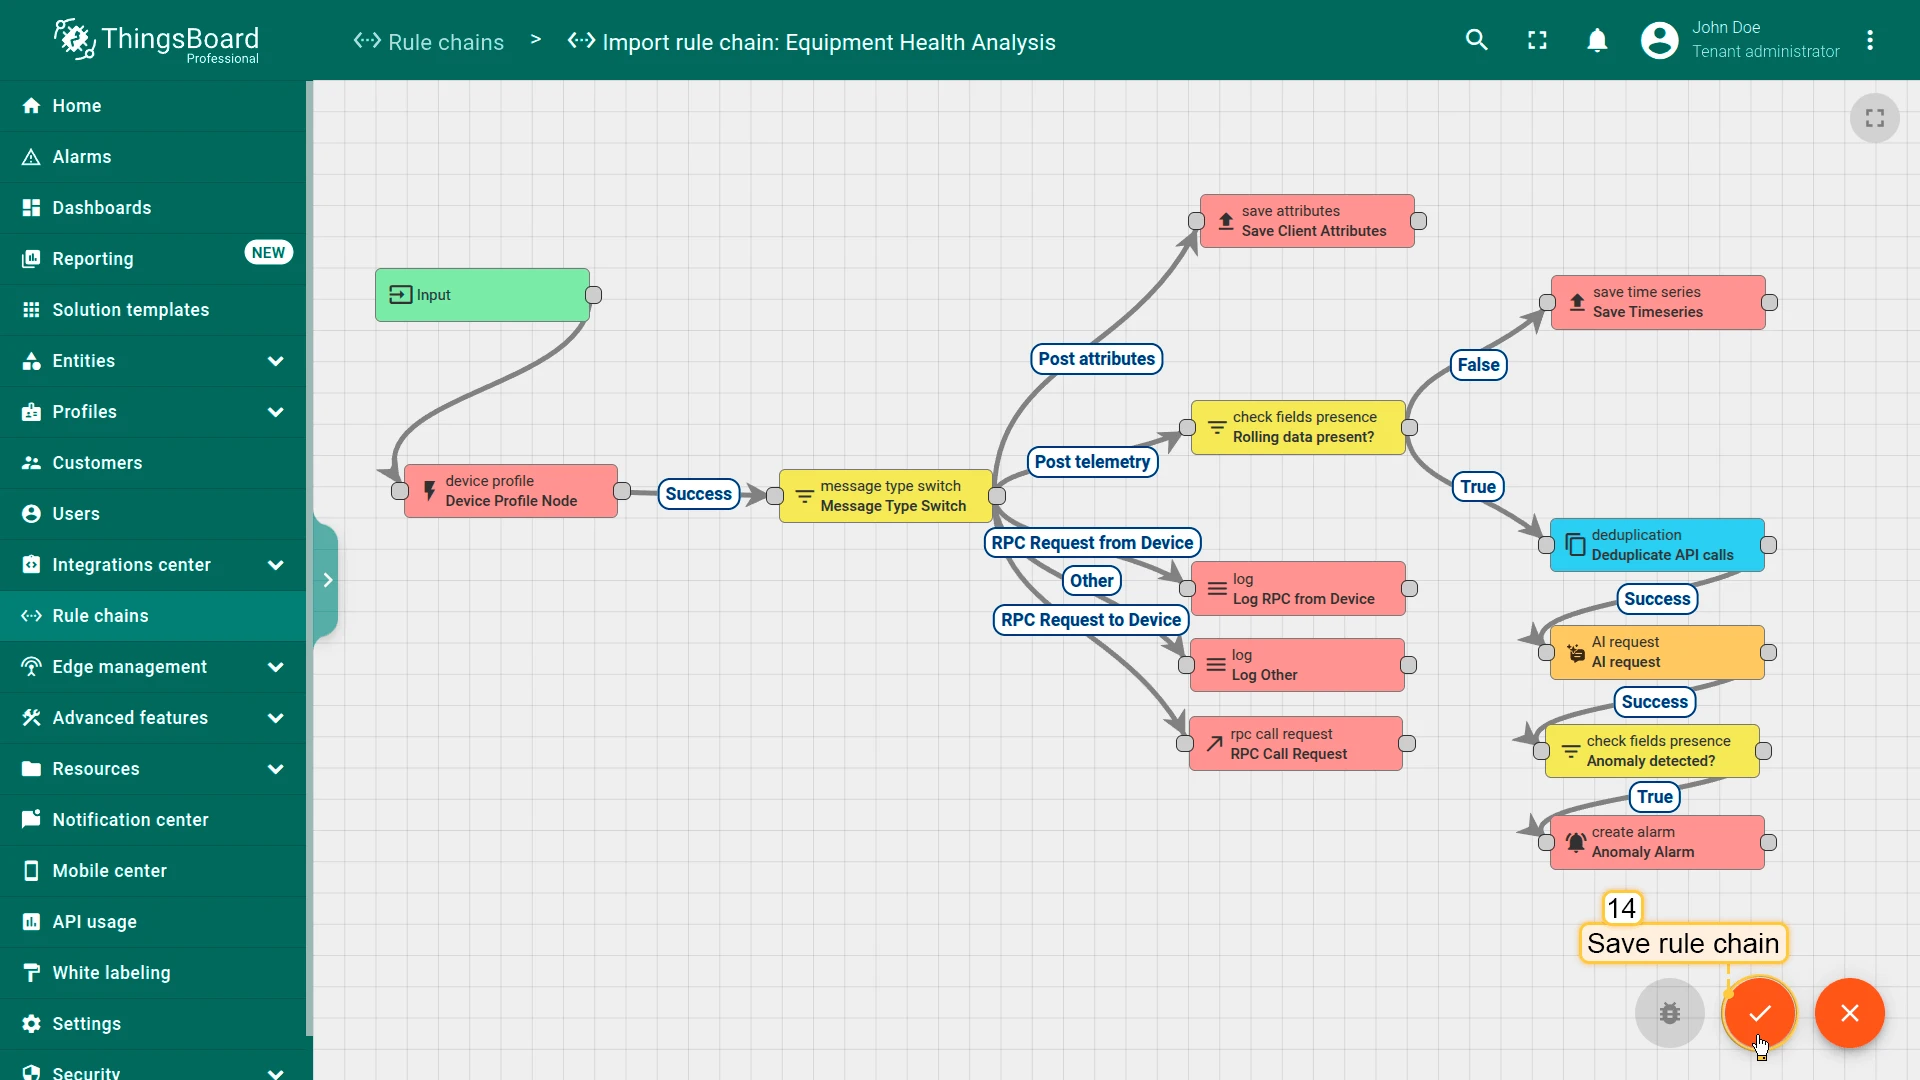
Section titled “Rule chain configuration”The rule chain analyzes the rolling window data, classifies anomalies, and generates a plain-language summary. It works with OpenAI or any other configured LLM provider.
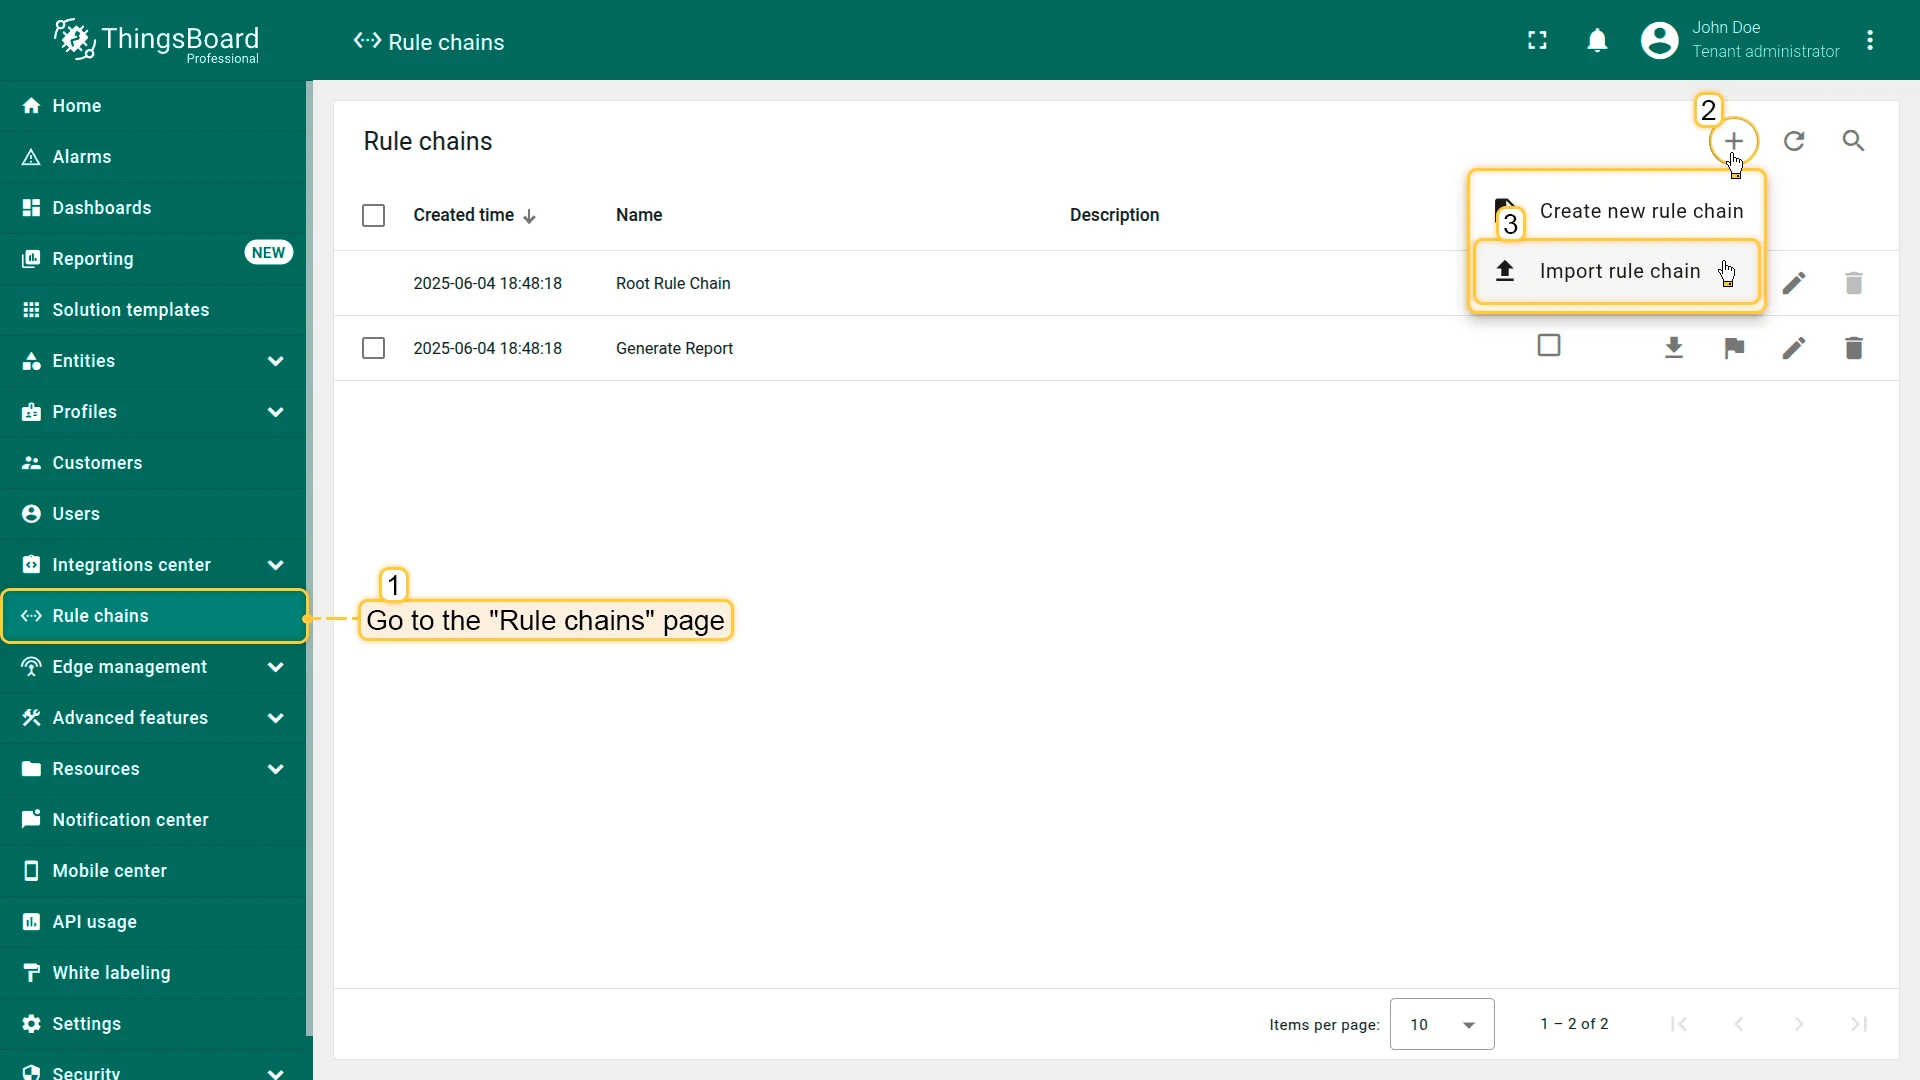
-
Download the Equipment Health Analysis rule chain JSON file.
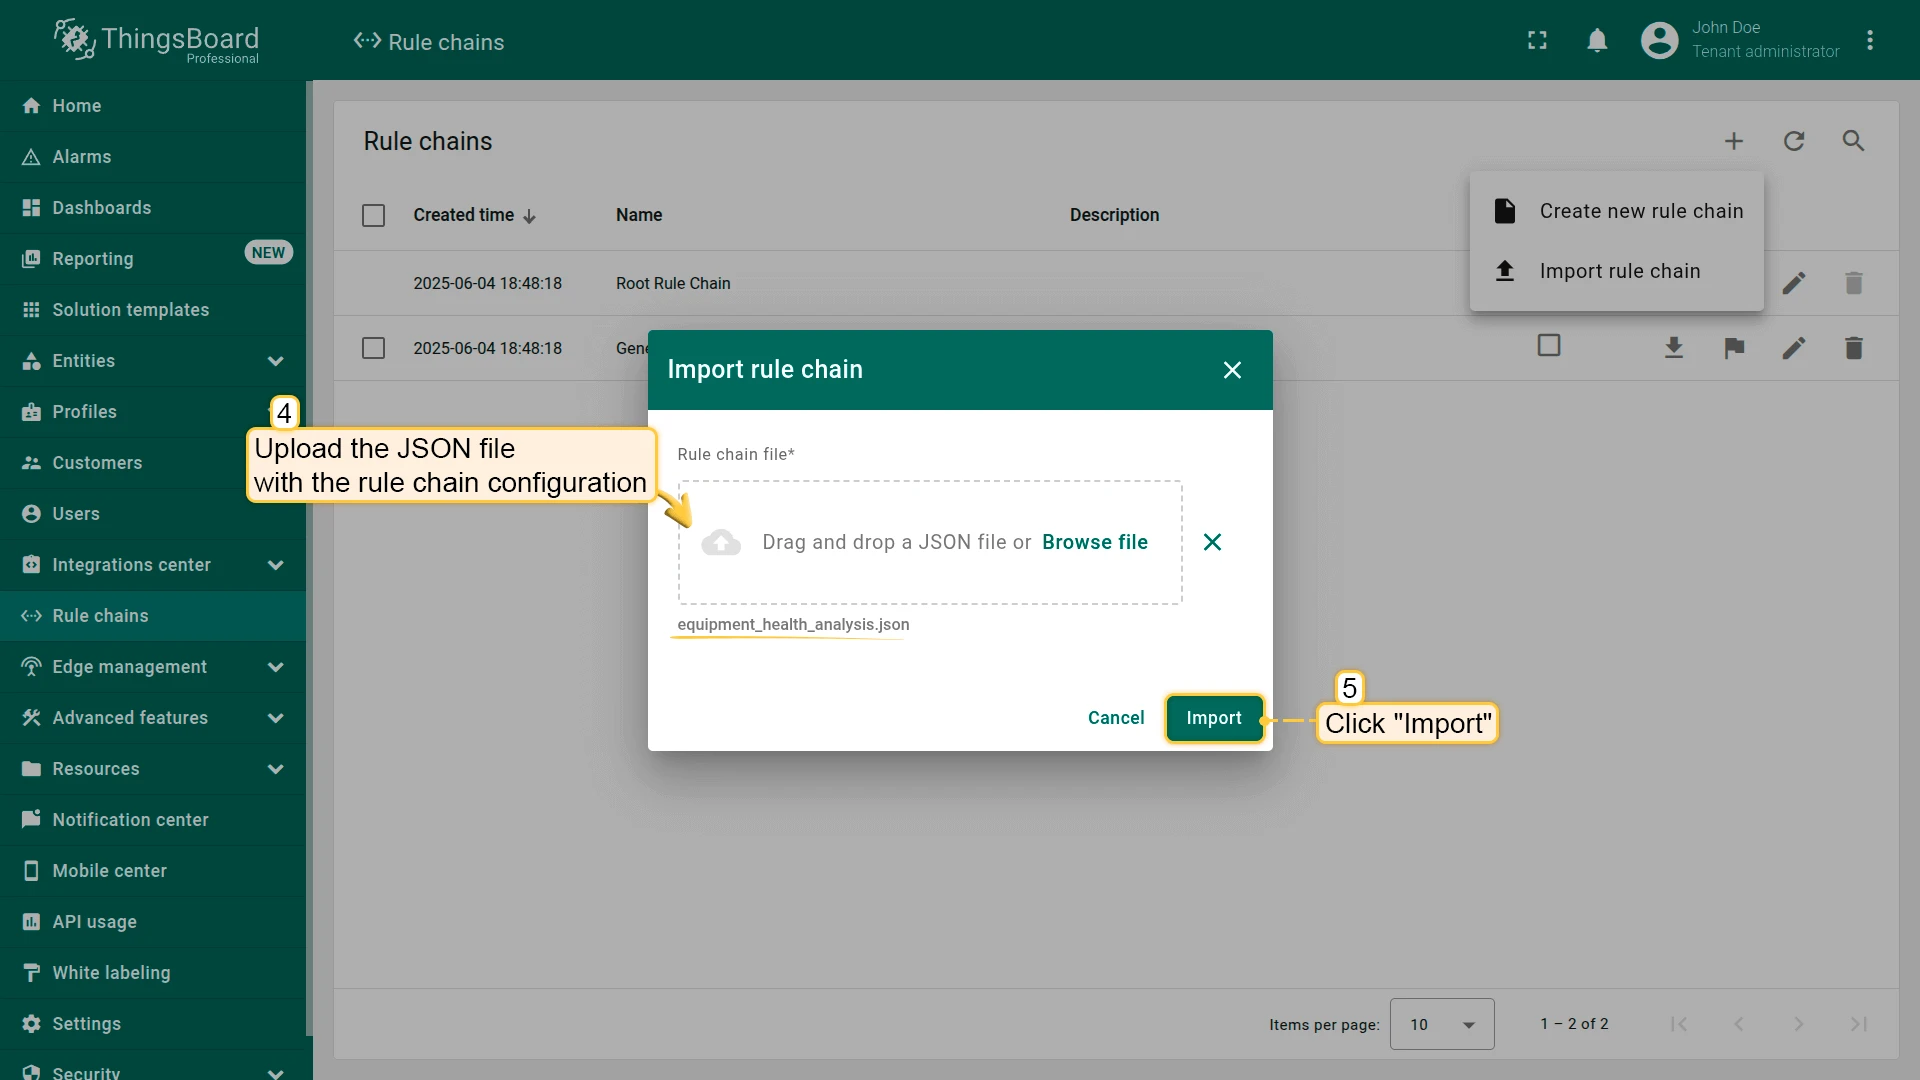
-
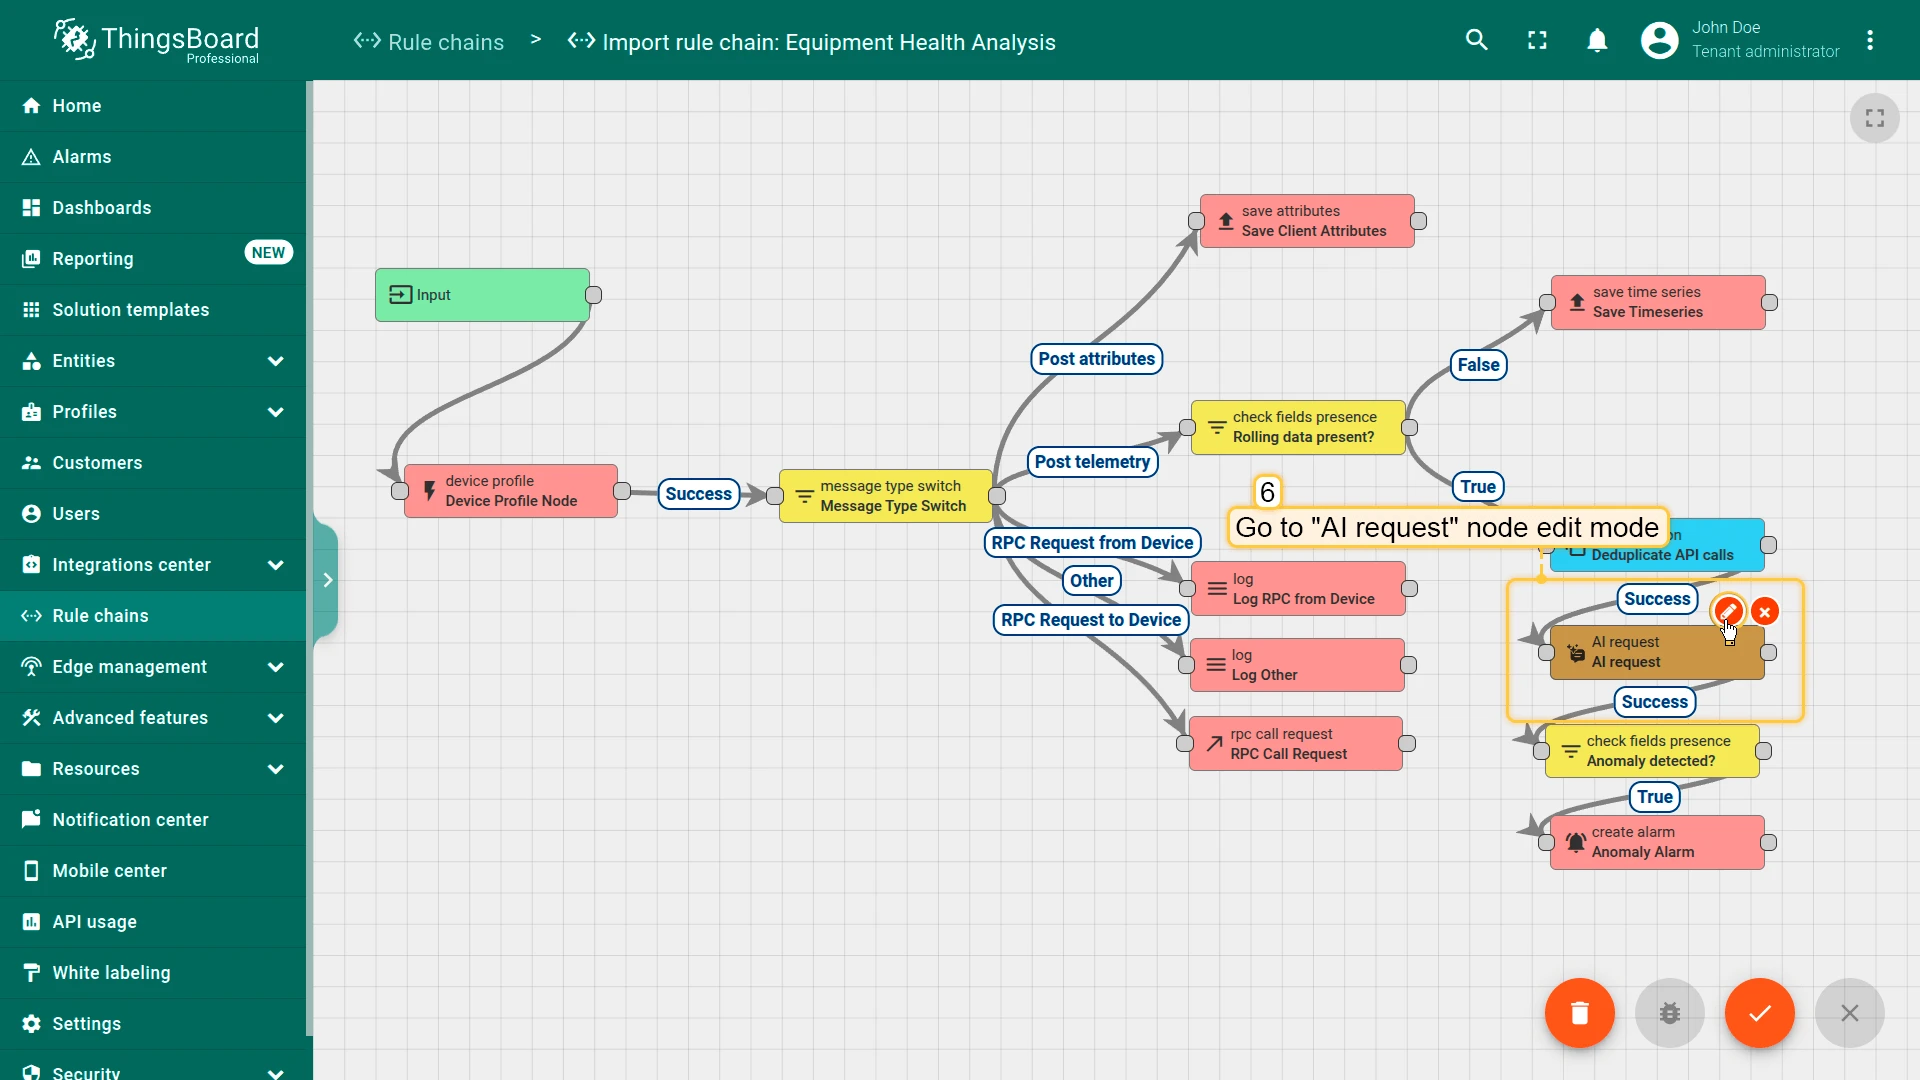
Import the rule chain and review its nodes.
-
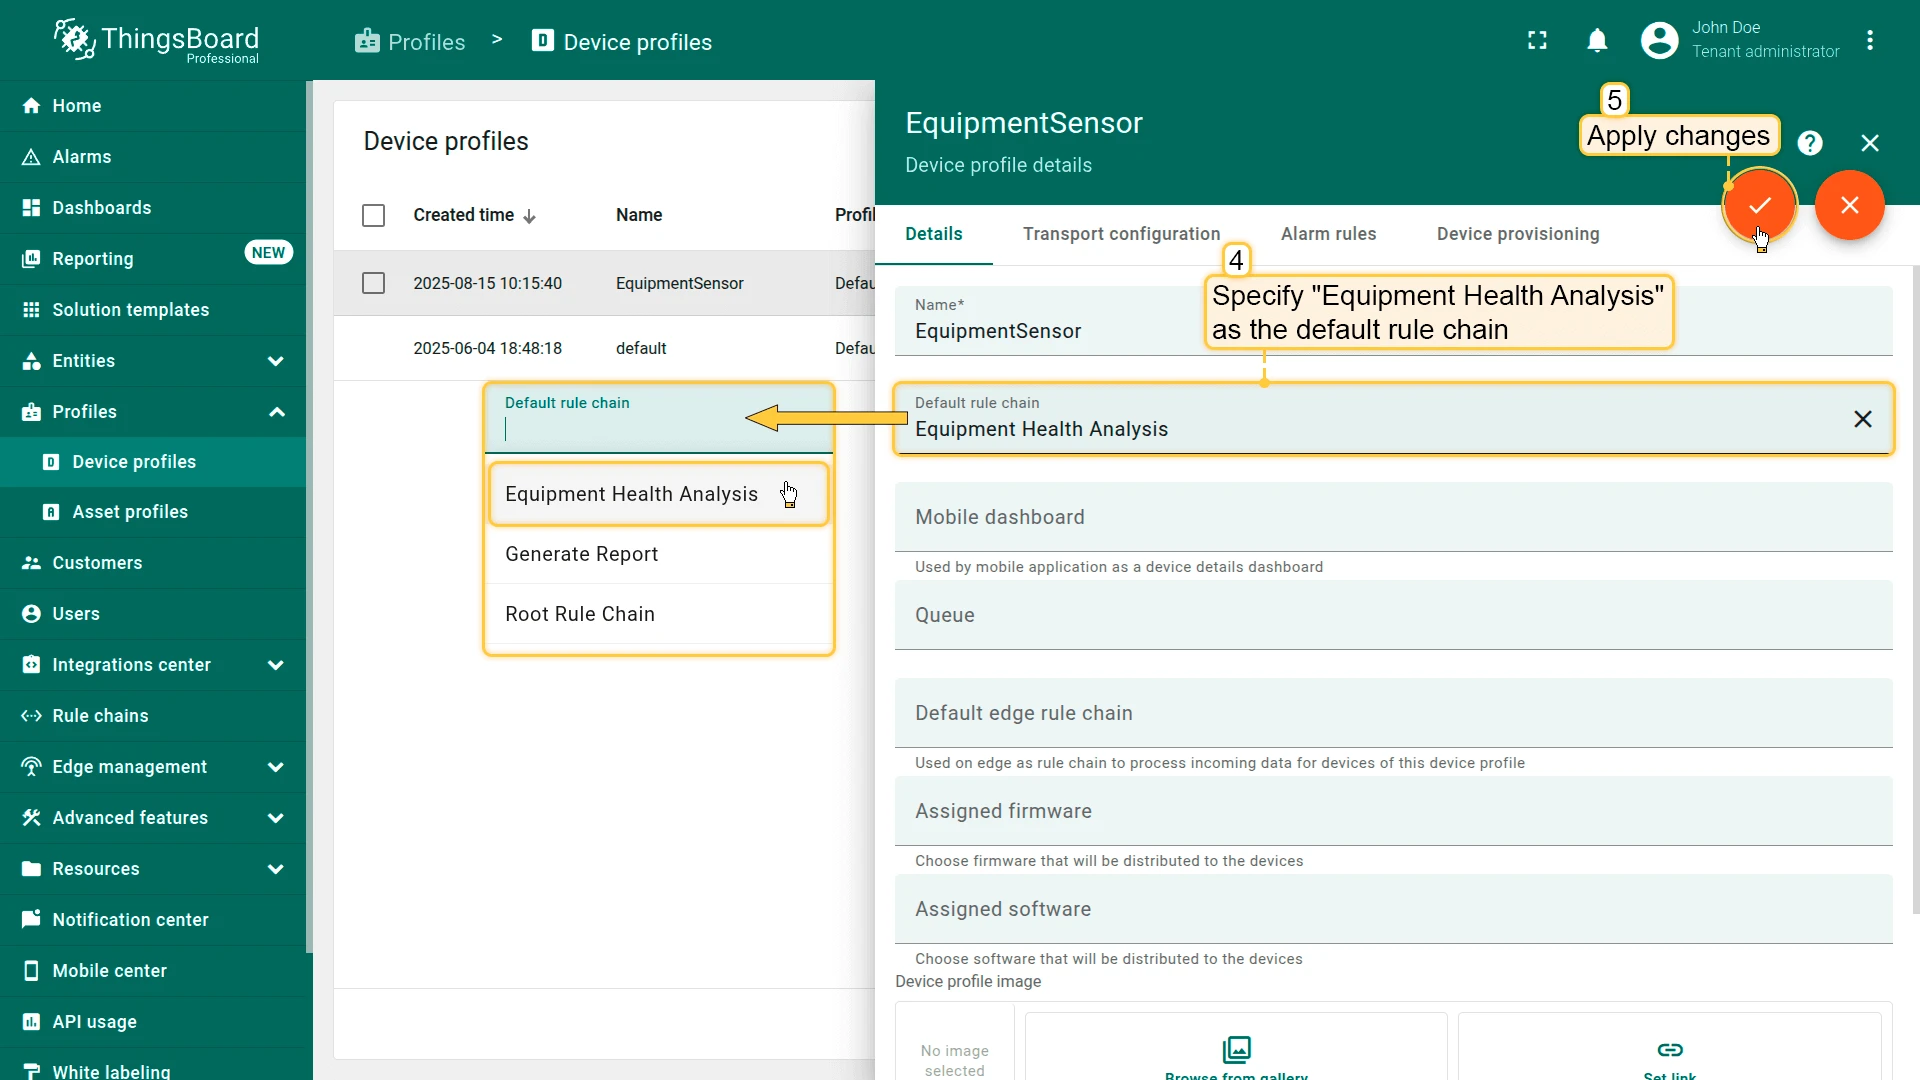
Update the EquipmentSensor profile to reference the Equipment Health Analysis rule chain.
Important details:
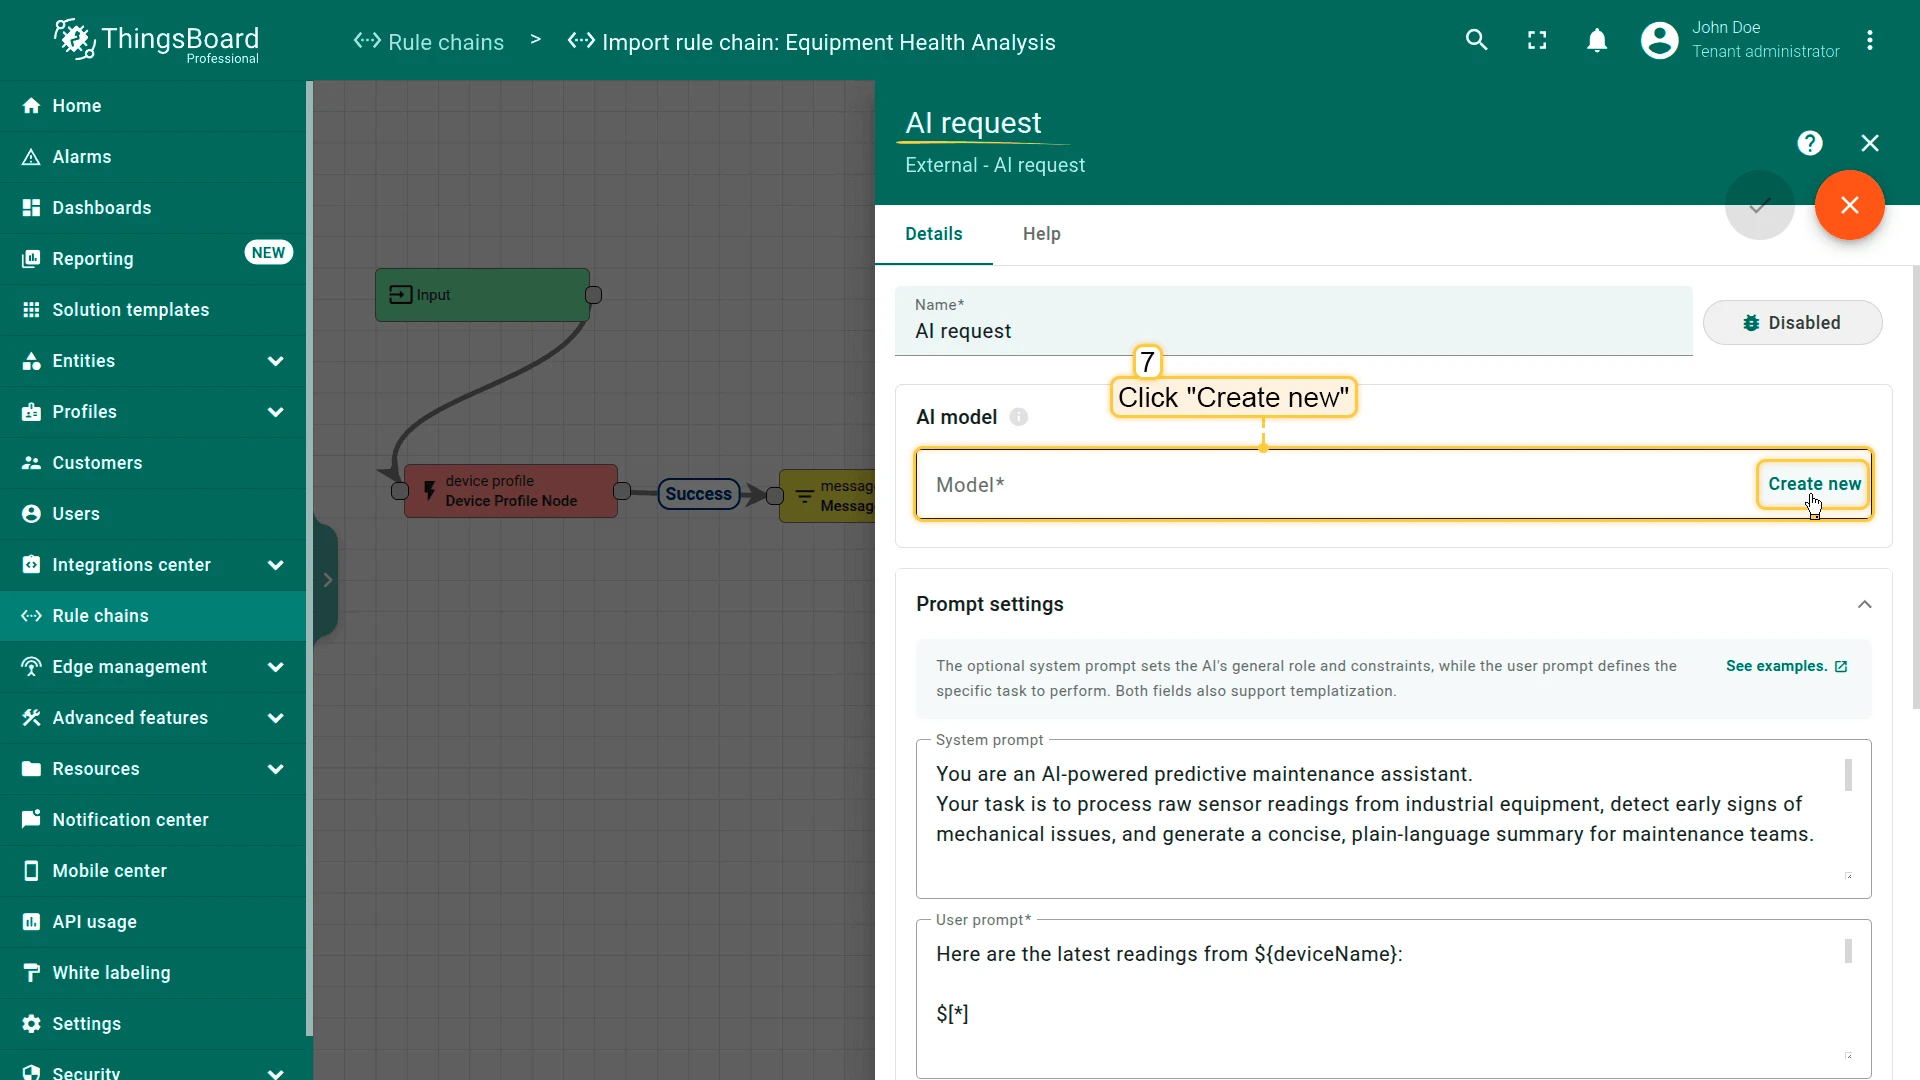
- System and user prompts can reference incoming message data using templatization:
$[*]— entire message body${'{*}'}— entire message metadata$[key]— a specific message body field${'{key}'}— a specific metadata value
- Supported response formats: TEXT, JSON, and JSON Schema (this guide uses JSON Schema).
- A deduplication node with a 5-second interval is used to reduce AI token usage.
Testing
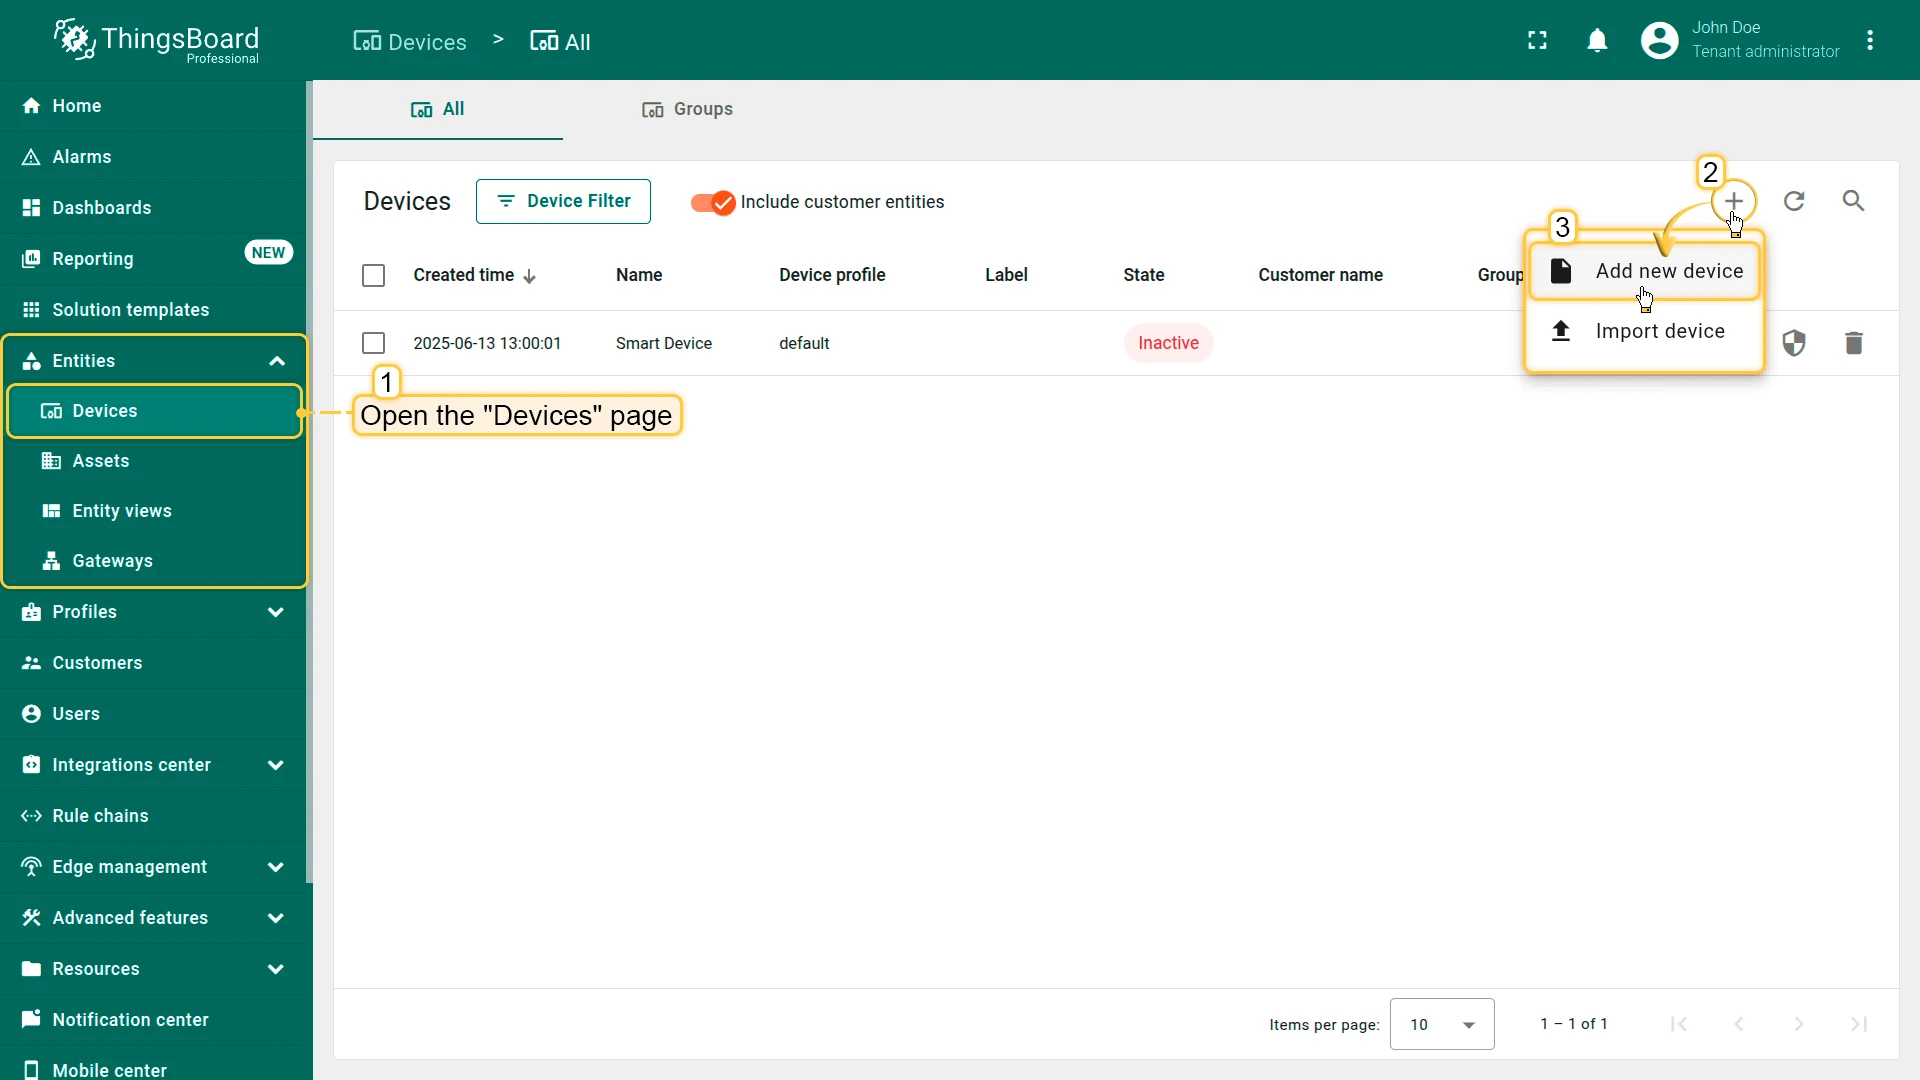
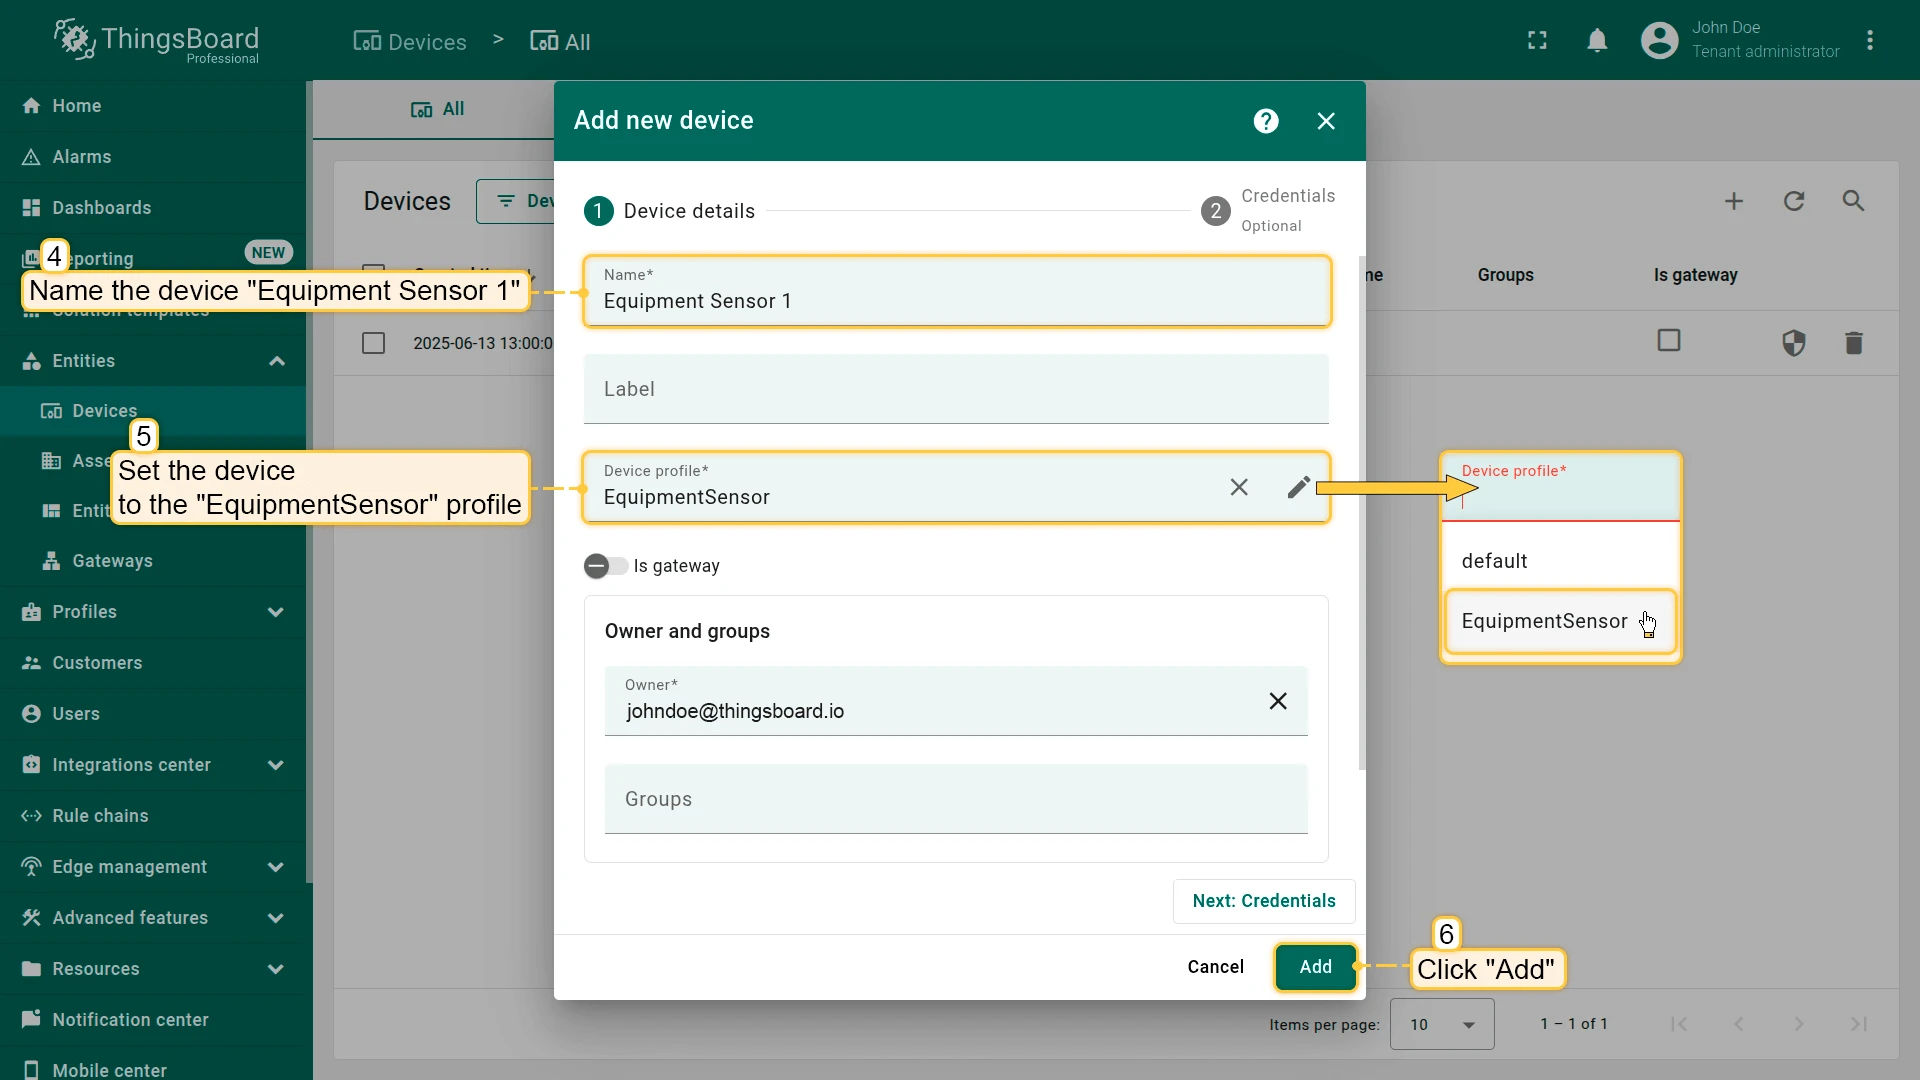
Section titled “Testing”-
Create a test device Equipment Sensor 1 with the EquipmentSensor profile.
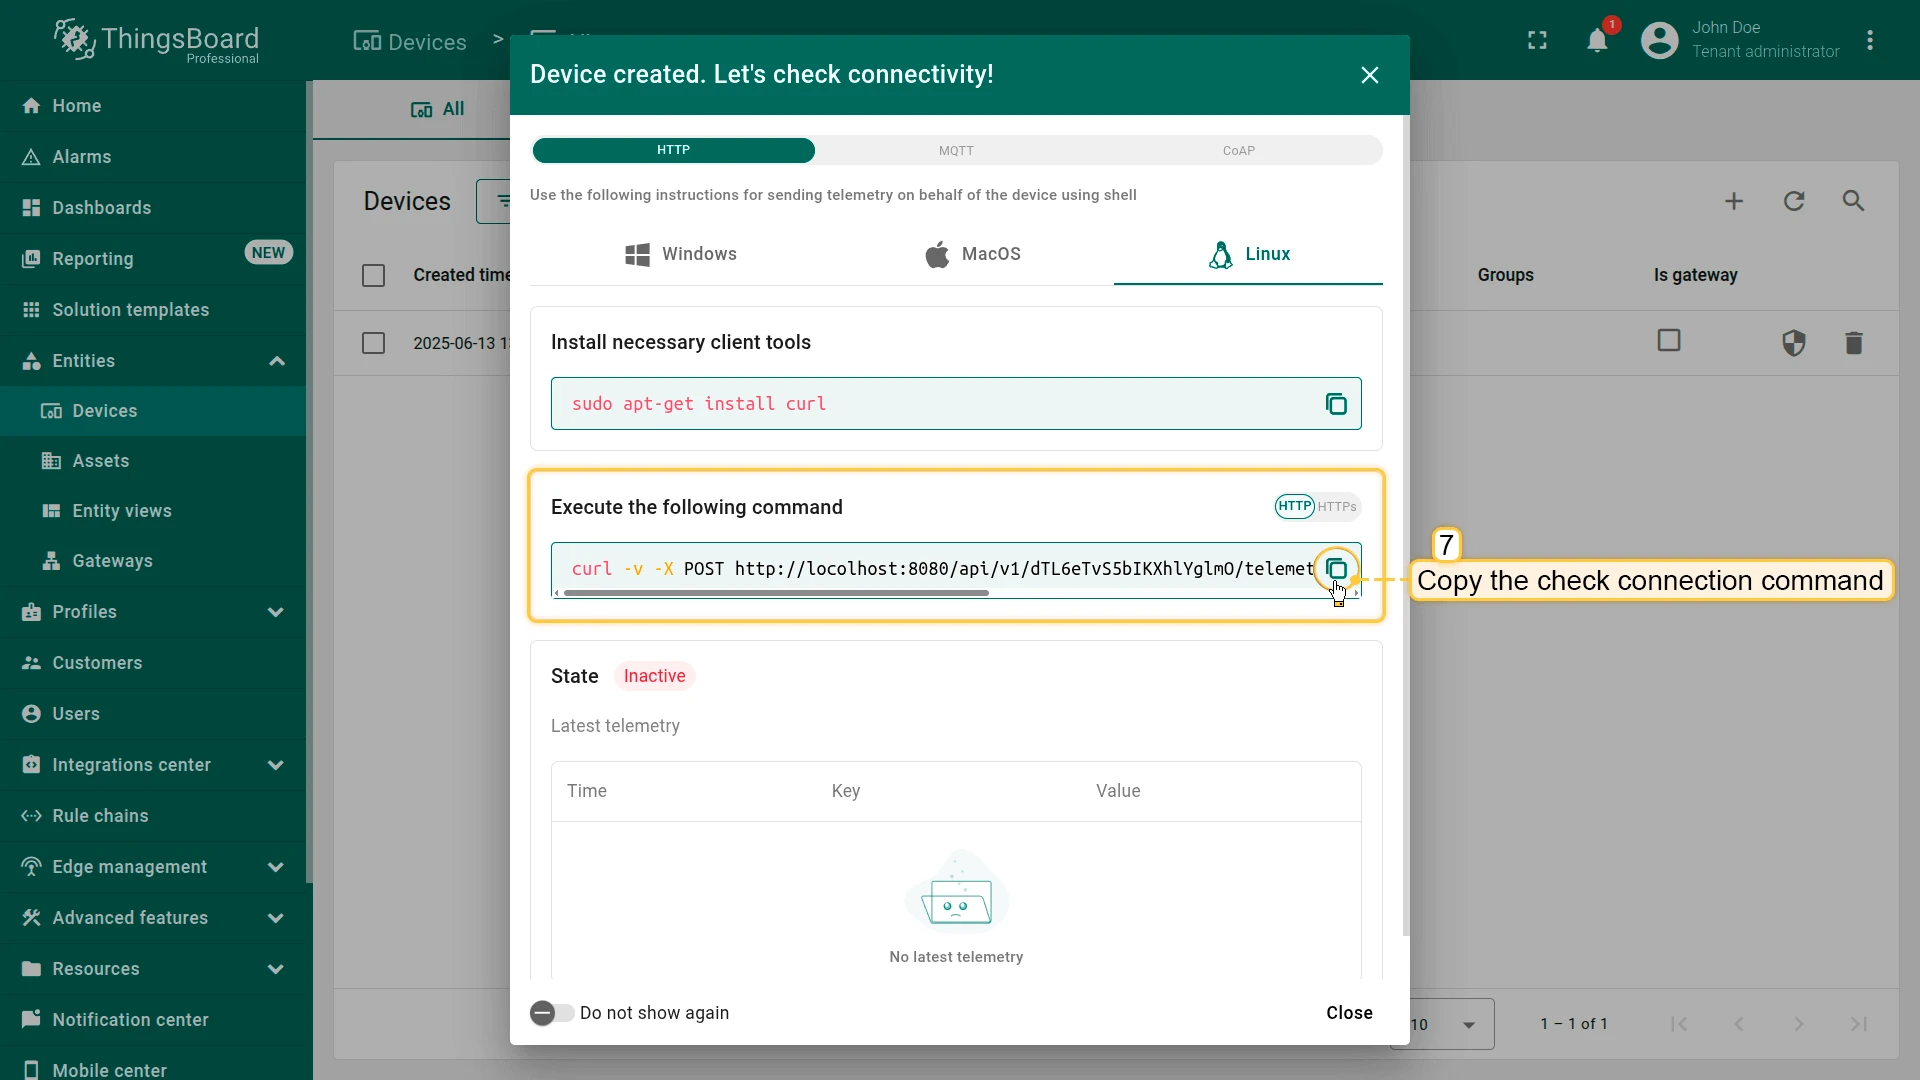
-
Copy the Check connectivity command from the device details.

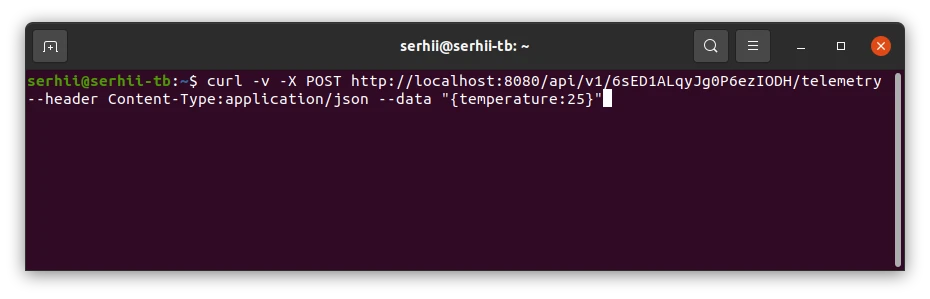
Your command will look something like this:
Terminal window curl -v -X POST http://$THINGSBOARD_HOST_NAME/api/v1/$YOUR_DEVICE_ACCESS_TOKEN/telemetry \--header Content-Type:application/json \--data "{temperature:25}"Replace
$THINGSBOARD_HOST_NAMEwith the host of your ThingsBoard instance, and$YOUR_DEVICE_ACCESS_TOKENwith your device’s access token.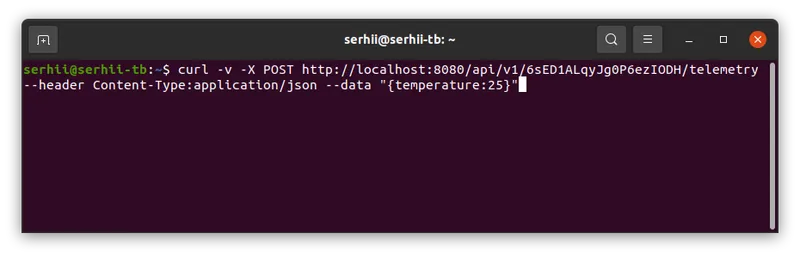
-
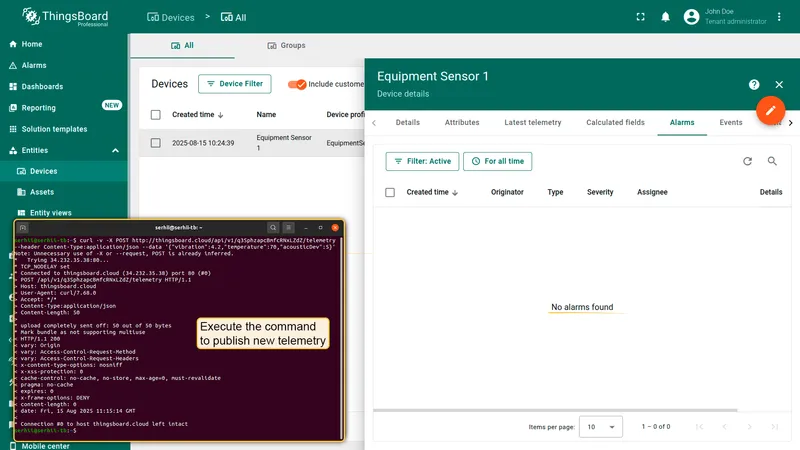
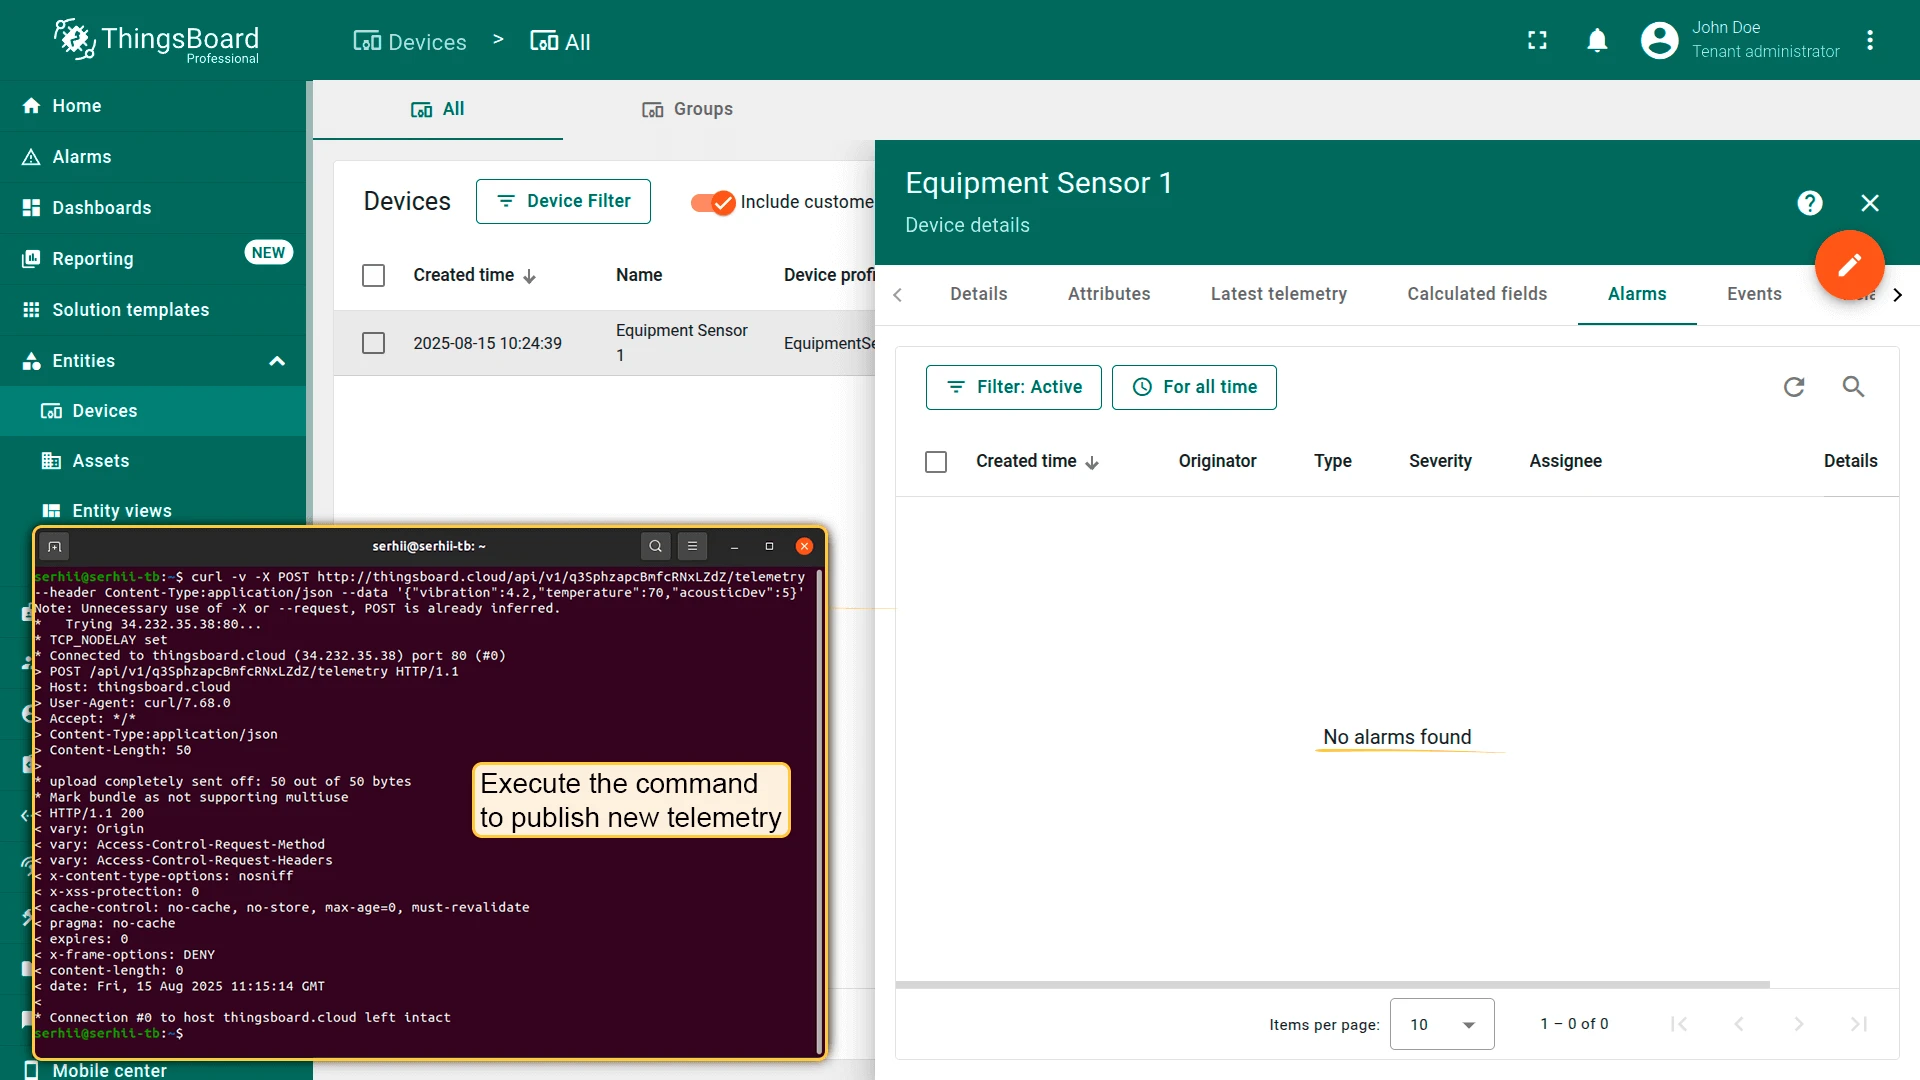
No alarm case — send normal readings.
Terminal window curl -v -X POST http://$THINGSBOARD_HOST_NAME/api/v1/$YOUR_DEVICE_ACCESS_TOKEN/telemetry \--header Content-Type:application/json \--data '{"vibration":4.2,"temperature":70,"acousticDev":5}'No alarm is created because the values are within normal ranges.
-
Bearing wear detection — send anomalous readings.
Terminal window curl -v -X POST http://$THINGSBOARD_HOST_NAME/api/v1/$YOUR_DEVICE_ACCESS_TOKEN/telemetry \--header Content-Type:application/json \--data '{"vibration":8.2,"temperature":88,"acousticDev":5}'An alarm is created. Example AI output:
{"anomaly": "Bearing Wear","summary": "Vibration has reached 7.4 mm/s and temperature is at 86 °C accompanied by irregular acoustic patterns, indicating bearing wear. Recommend immediate bearing inspection and replacement to avoid catastrophic failure."}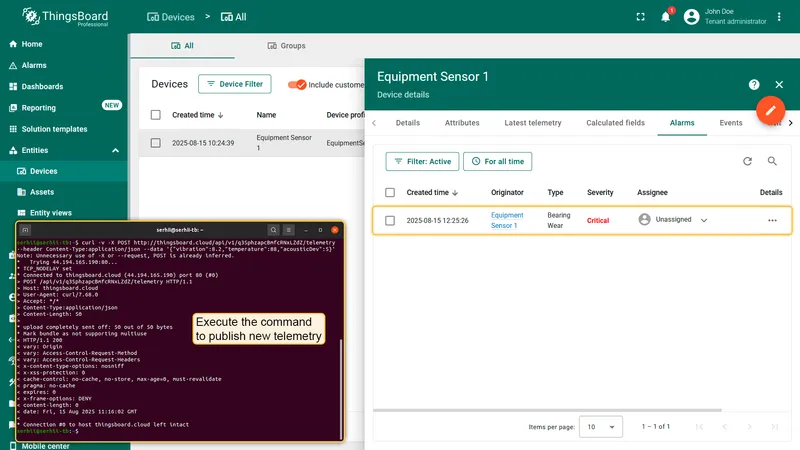
-
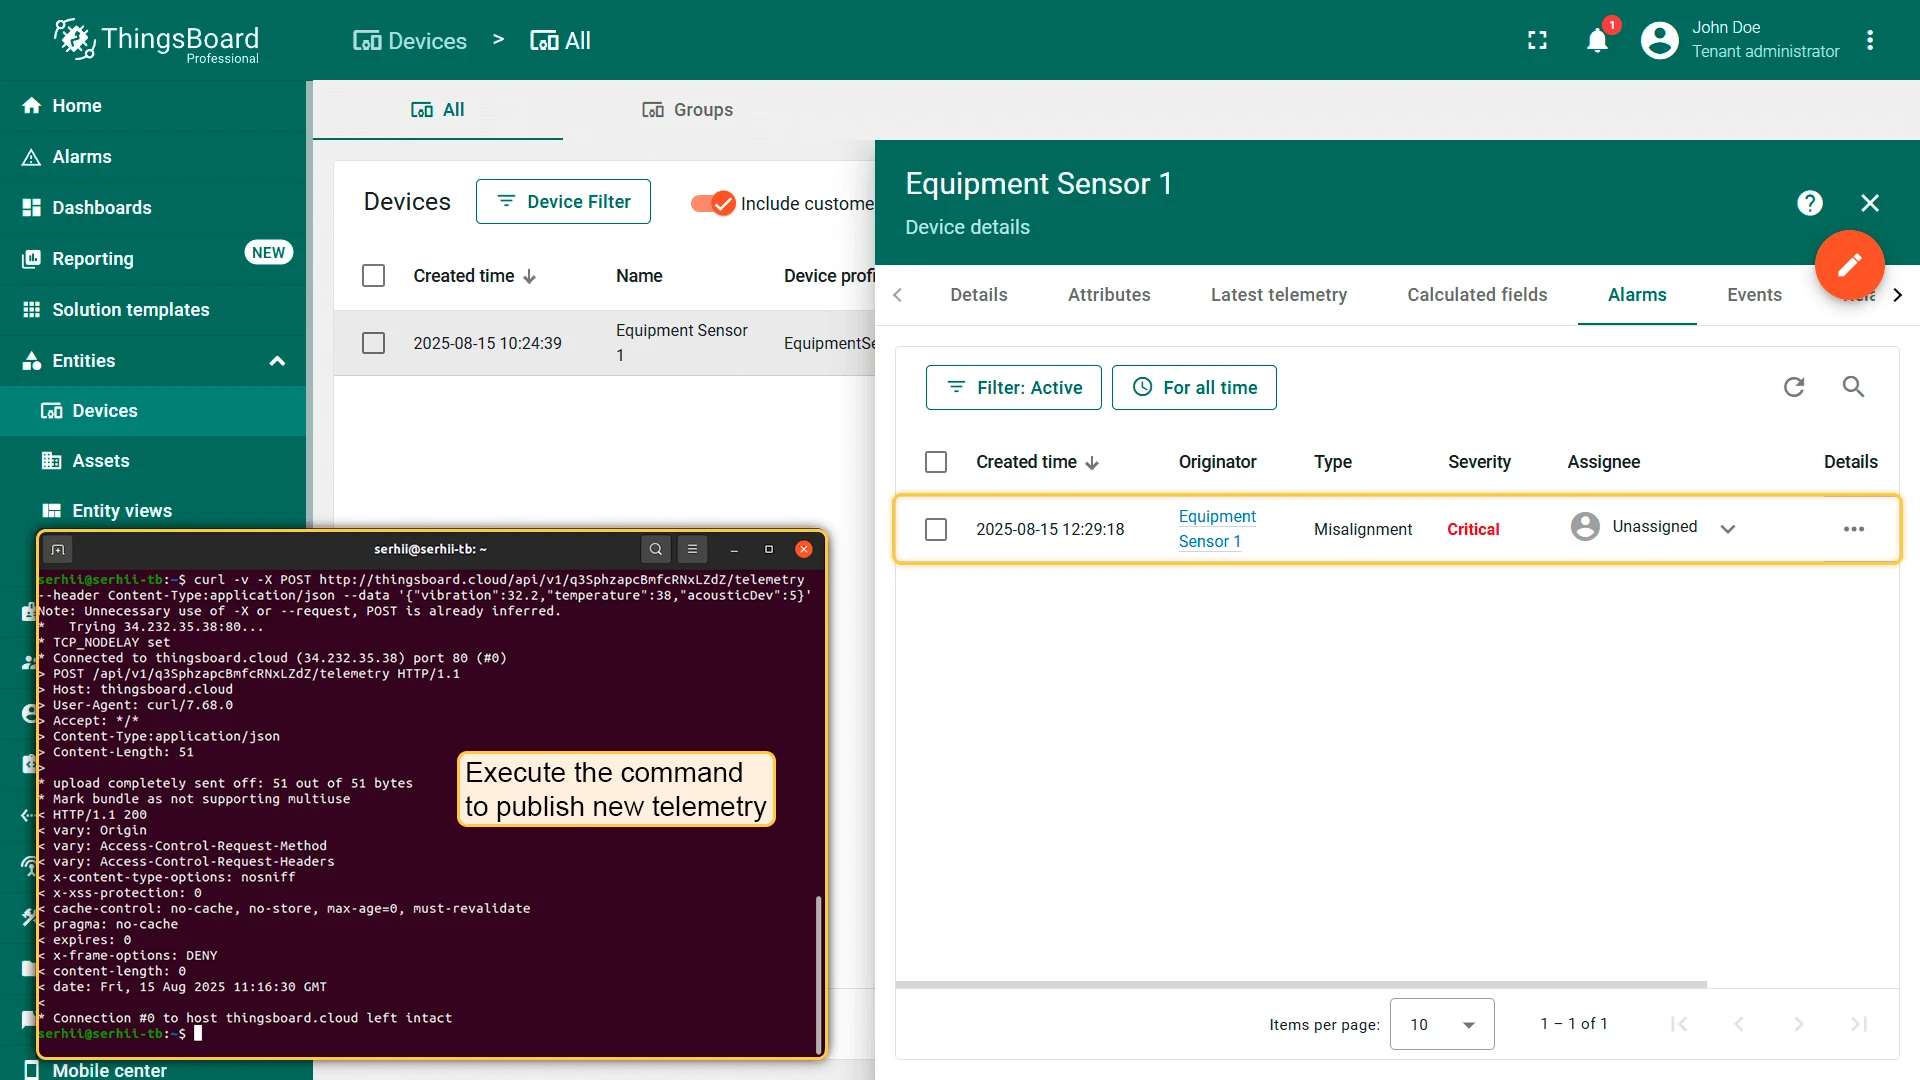
Misalignment detection — send a different anomaly pattern.
Terminal window curl -v -X POST http://$THINGSBOARD_HOST_NAME/api/v1/$YOUR_DEVICE_ACCESS_TOKEN/telemetry \--header Content-Type:application/json \--data '{"vibration":32.2,"temperature":38,"acousticDev":5}'An alarm is created. Example AI output:
{"anomaly": "Misalignment","summary": "A sudden vibration spike to 32.2 mm/s without a corresponding temperature rise or acoustic deviation indicates likely misalignment in the drive train. Please perform an immediate shaft-and-coupling alignment check to prevent further mechanical damage."}

Performance and cost controls
Section titled “Performance and cost controls”API costs are controlled by the provider’s API key and billing — ThingsBoard does not track usage or enforce limits internally. To manage costs effectively:
- Deduplication — use the deduplication node to batch incoming messages (e.g., 5-second window) so the AI is called once per batch, not per telemetry message.
- Early filters — skip the AI call entirely if all metrics are within normal bands. Add a script filter node before the AI request node.
- Payload compacting — send statistics (min, mean, max, standard deviation, trend) instead of full arrays if the prompt allows.
- Model selection — smaller models (e.g.,
gpt-4o-mini) are significantly cheaper per token than large models while still providing good anomaly classification.
Troubleshooting
Section titled “Troubleshooting”| Problem | Steps |
|---|---|
| No alarms created | 1. Verify raw device data appears in the Latest telemetry tab. 2. Enable and review calculated field debug events. 3. Enable and review the corresponding rule node debug events. |
| High costs | Increase the deduplication period, tune the prompt to use fewer tokens, or switch to a cheaper AI model. |
Next steps
Section titled “Next steps”- Configure additional AI models to compare different providers.
- Add notifications to alert operators when alarms are created.
- Experiment with AI prompts and share your feedback with the community.
Was this helpful?