SCADA Energy management
SCADA (Supervisory Control and Data Acquisition) systems play a crucial role in energy monitoring and management, providing real-time insights into power generation, distribution, and consumption. With the ThingsBoard platform, businesses can integrate advanced SCADA solutions to optimize energy efficiency, reduce costs, and enhance system reliability. The ability to collect, analyze, and visualize data from multiple energy sources helps operators make informed decisions and respond swiftly to changing conditions.

With a single installation action, the template deploys a fully functional solution that includes dashboards, devices, alarms, calculated fields, and gateway configuration. The solution is suitable for proof-of-concept deployments as well as a foundation for production energy management applications.
Key application areas
Section titled “Key application areas”SCADA systems with energy monitoring capabilities are widely applicable in various sectors, including:
- Industrial facilities: Used in manufacturing plants to monitor, control, and optimize energy consumption across machines and processes
- Renewable energy plants: Essential for managing solar farms and wind parks, tracking generation, performance, and system health in real time
- Utilities and power grids: Supports grid stability by supervising power distribution, load balancing, and fault detection across large-scale networks
- Smart buildings: Improves energy efficiency in commercial and residential buildings by managing lighting, HVAC, and electrical systems
- Data centers: Monitors energy usage, ensures continuous power delivery, and manages backup systems to avoid downtime
Install solution template
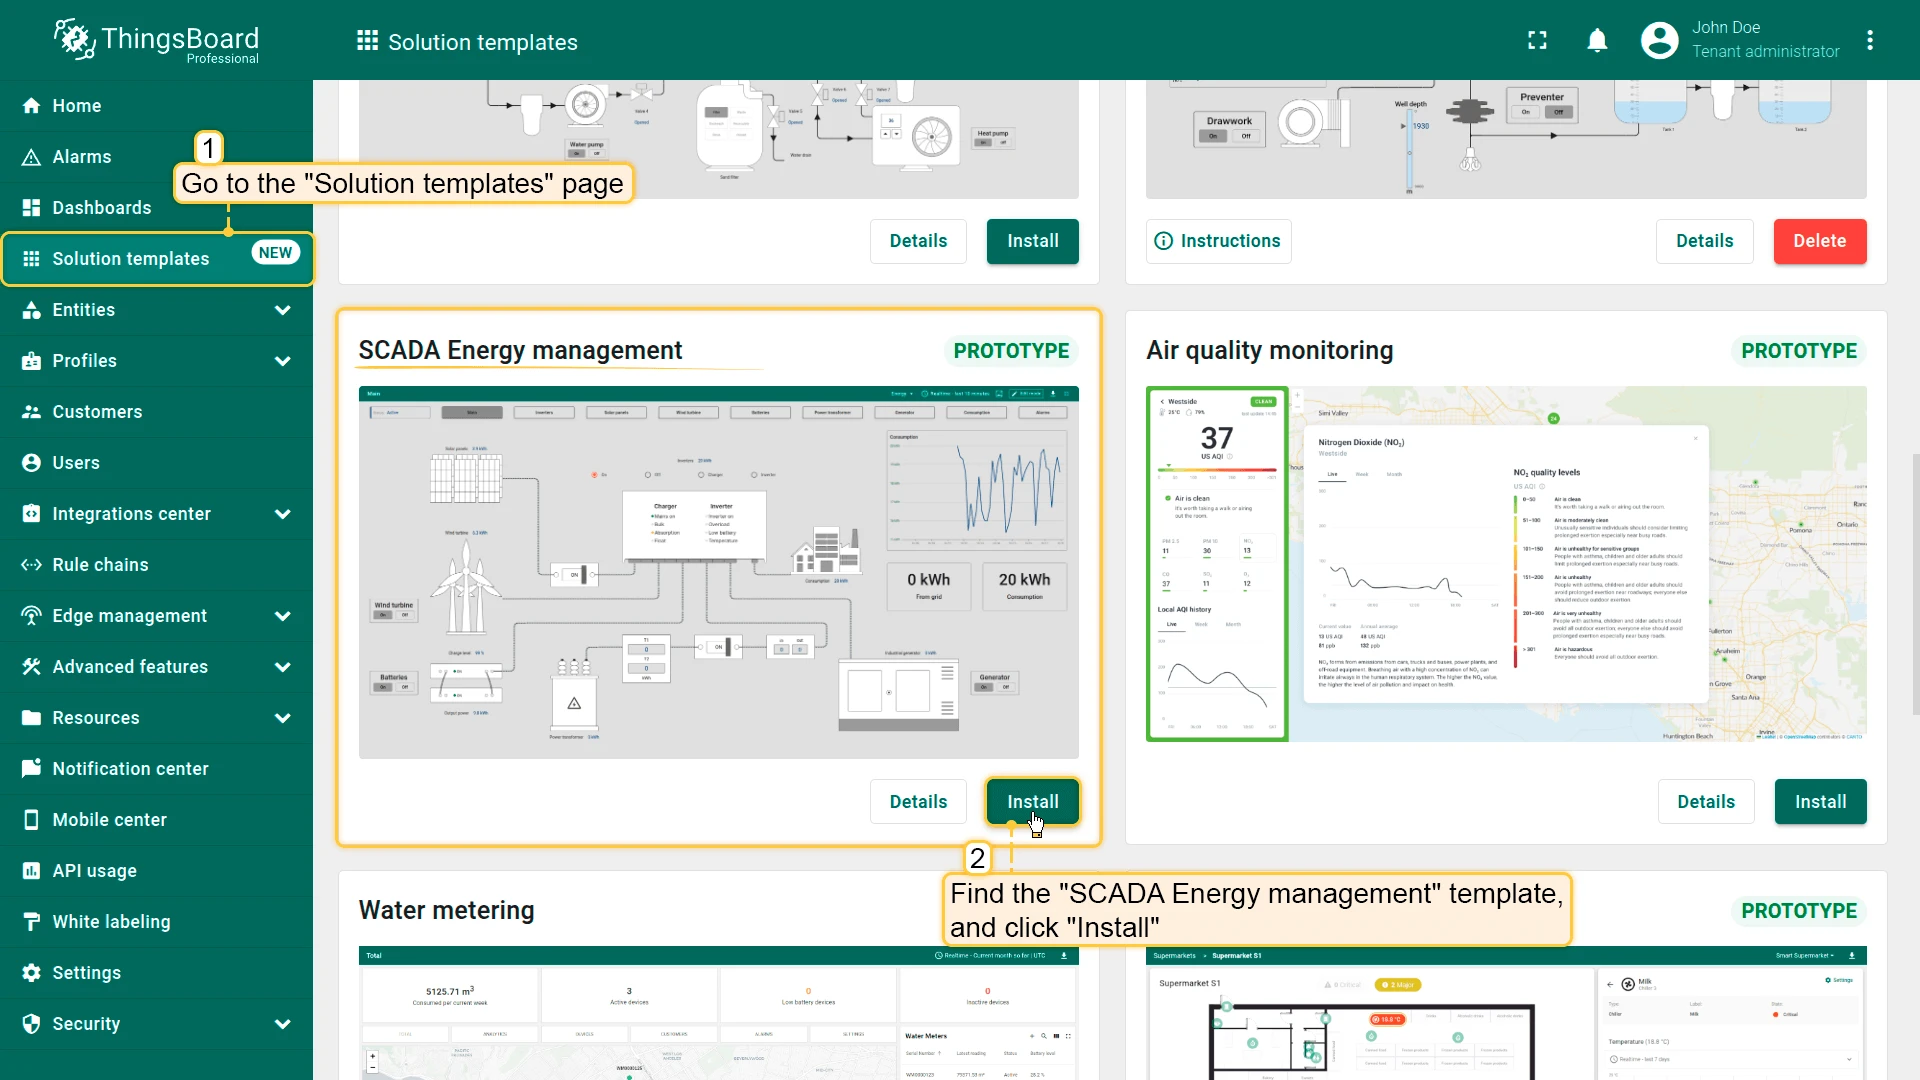
Section titled “Install solution template”To understand how the SCADA Energy management template works, start by installing the solution template.
- Go to Solution templates in the main menu.
- Find SCADA Energy management and click Install.
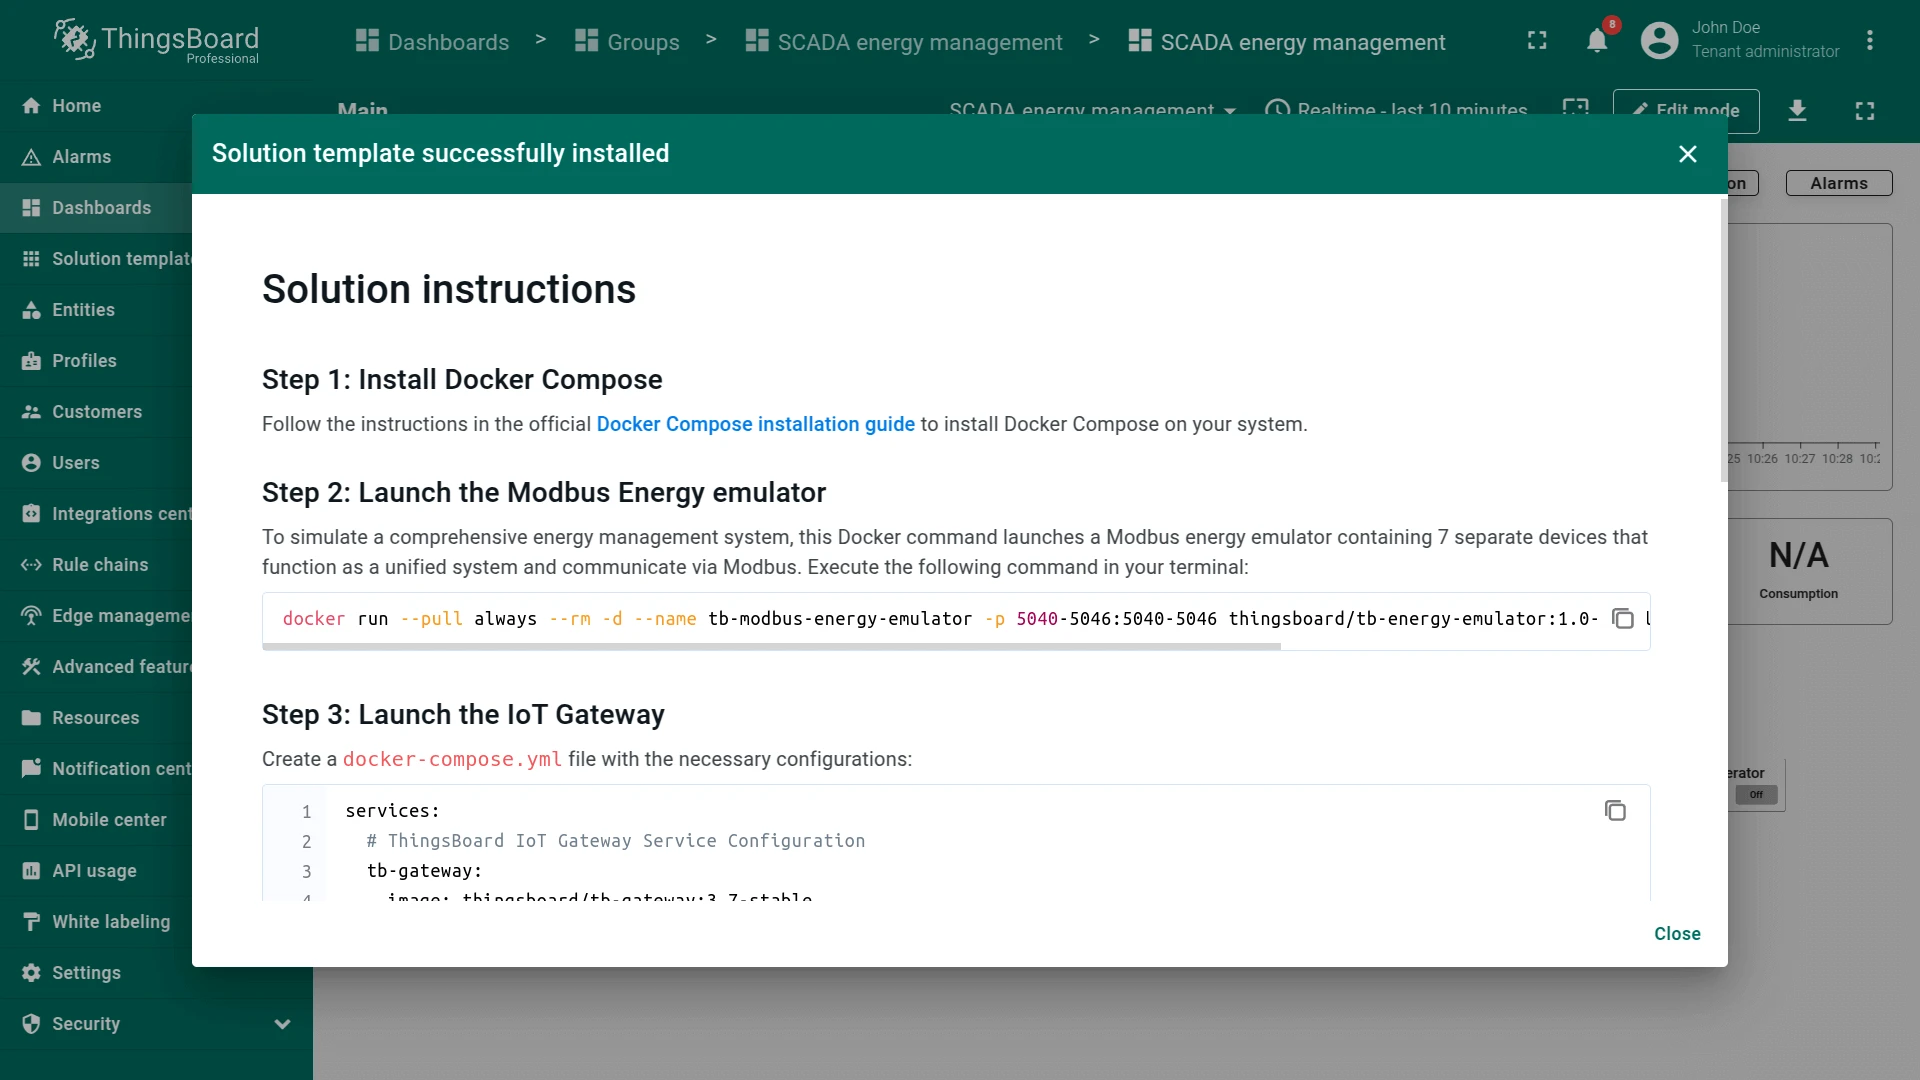
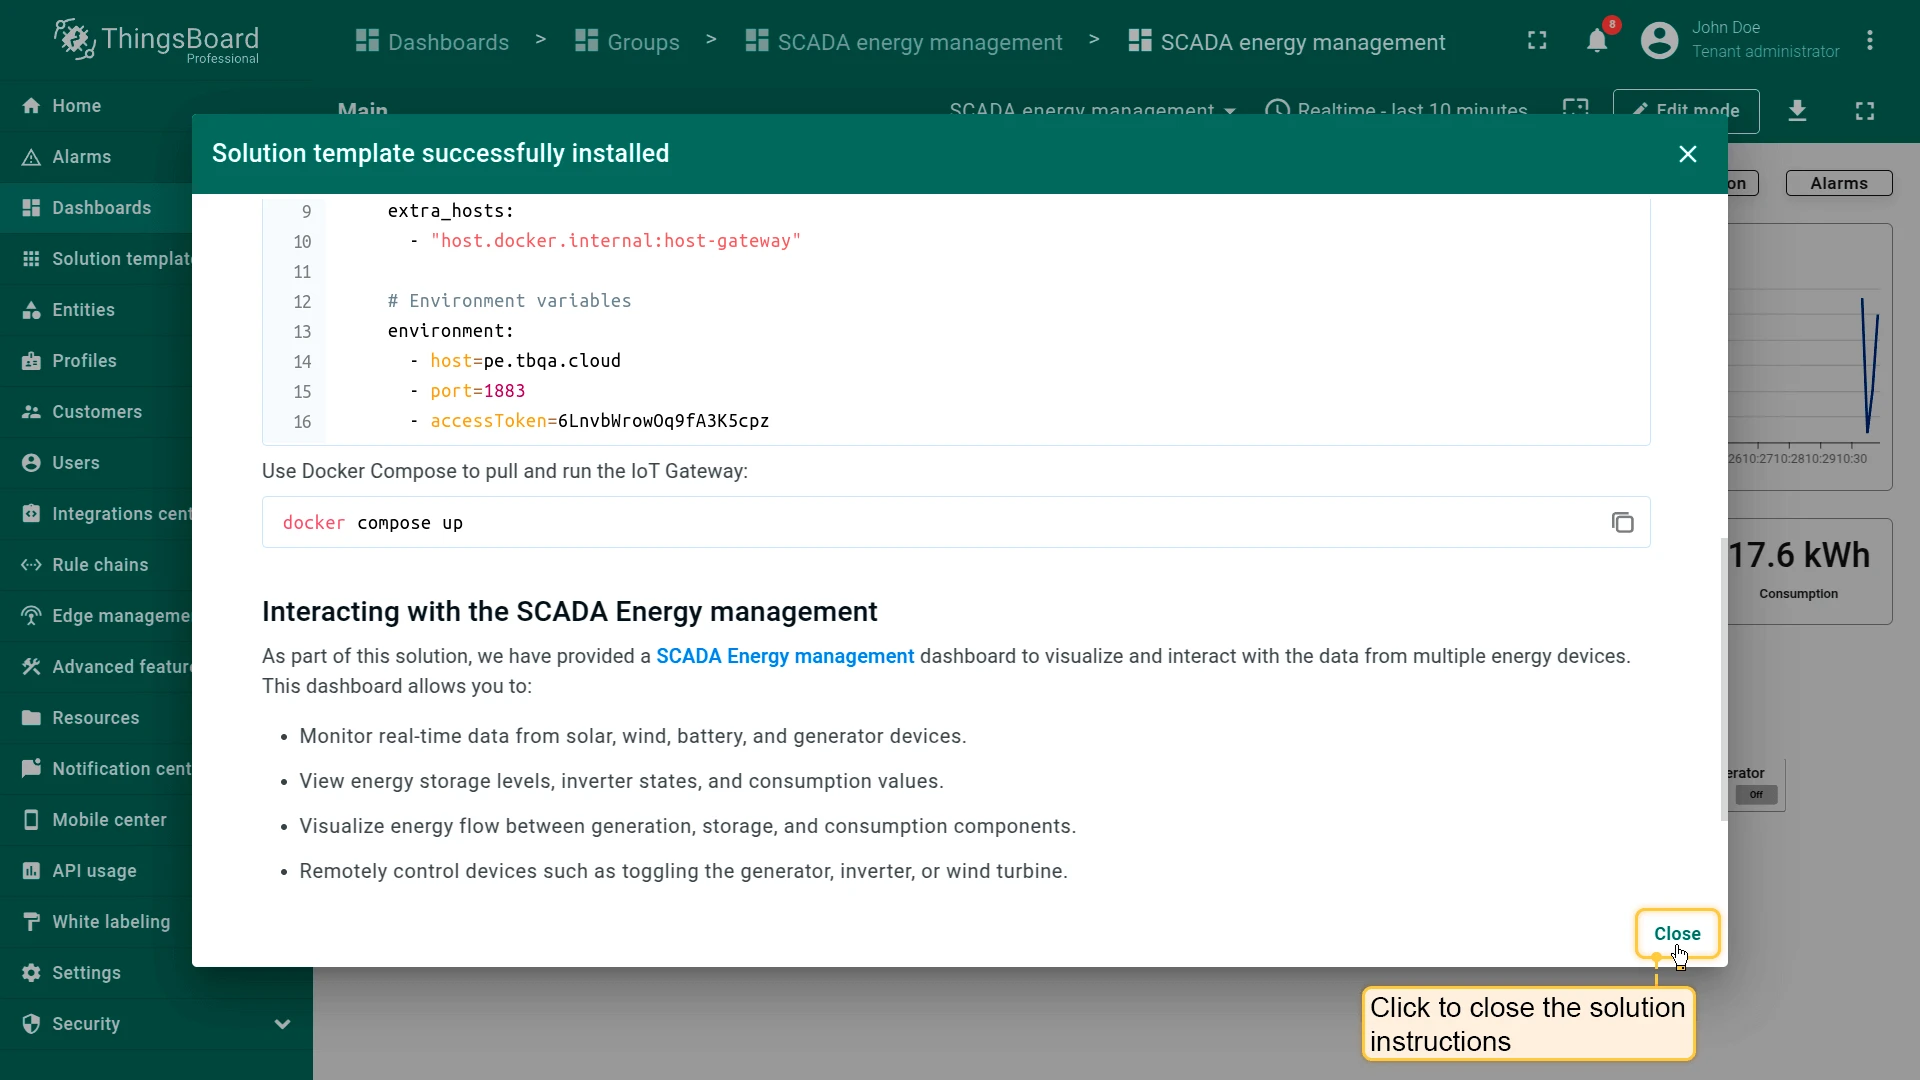
- Follow the provided configuration instructions and click Close.
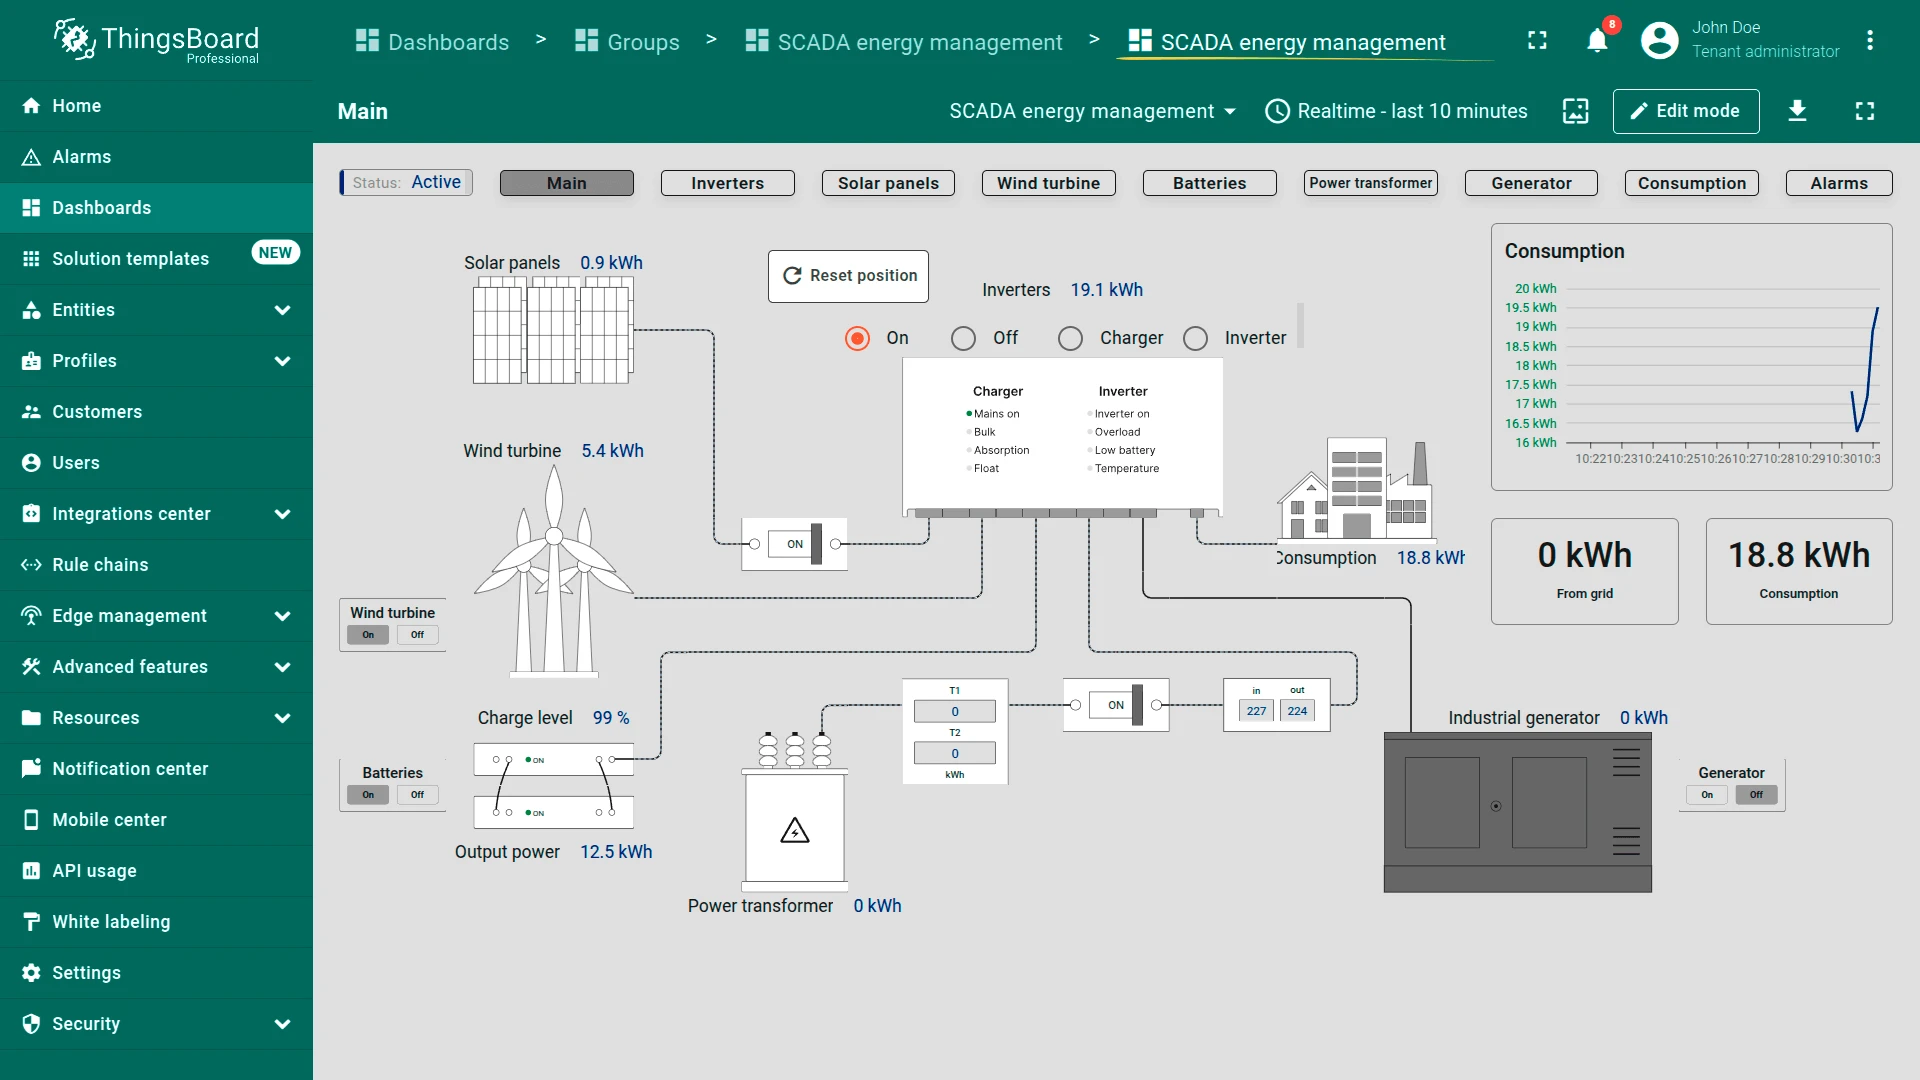
- The SCADA Energy management dashboard opens automatically.
After installation, a fully functional simulation for monitoring energy infrastructure is created automatically. No physical devices or custom code are required to start exploring the solution.
System components
Section titled “System components”The SCADA Energy management system includes:
- Devices: Sensors and actuators installed on energy generation sources. They collect and transmit data such as the condition of solar panels, rotor speed of a wind turbine, input and output voltage of a transformer, generator performance metrics, and many other parameters
- Modbus protocol: The primary communication protocol for data exchange between devices. It ensures reliable connection and seamless integration of equipment with the SCADA system
- Gateway: A device that transmits data from sensors to the ThingsBoard platform. It converts and relays data over the network for further processing
- ThingsBoard: An IoT platform where data is collected, analyzed, and visualized. It allows operators to access information and set up alerts for critical parameter changes
- Dashboard visualization: Track solar, wind, battery, generator, and consumption data in a single unified dashboard, enabling energy managers to make smarter and faster decisions
Dashboard
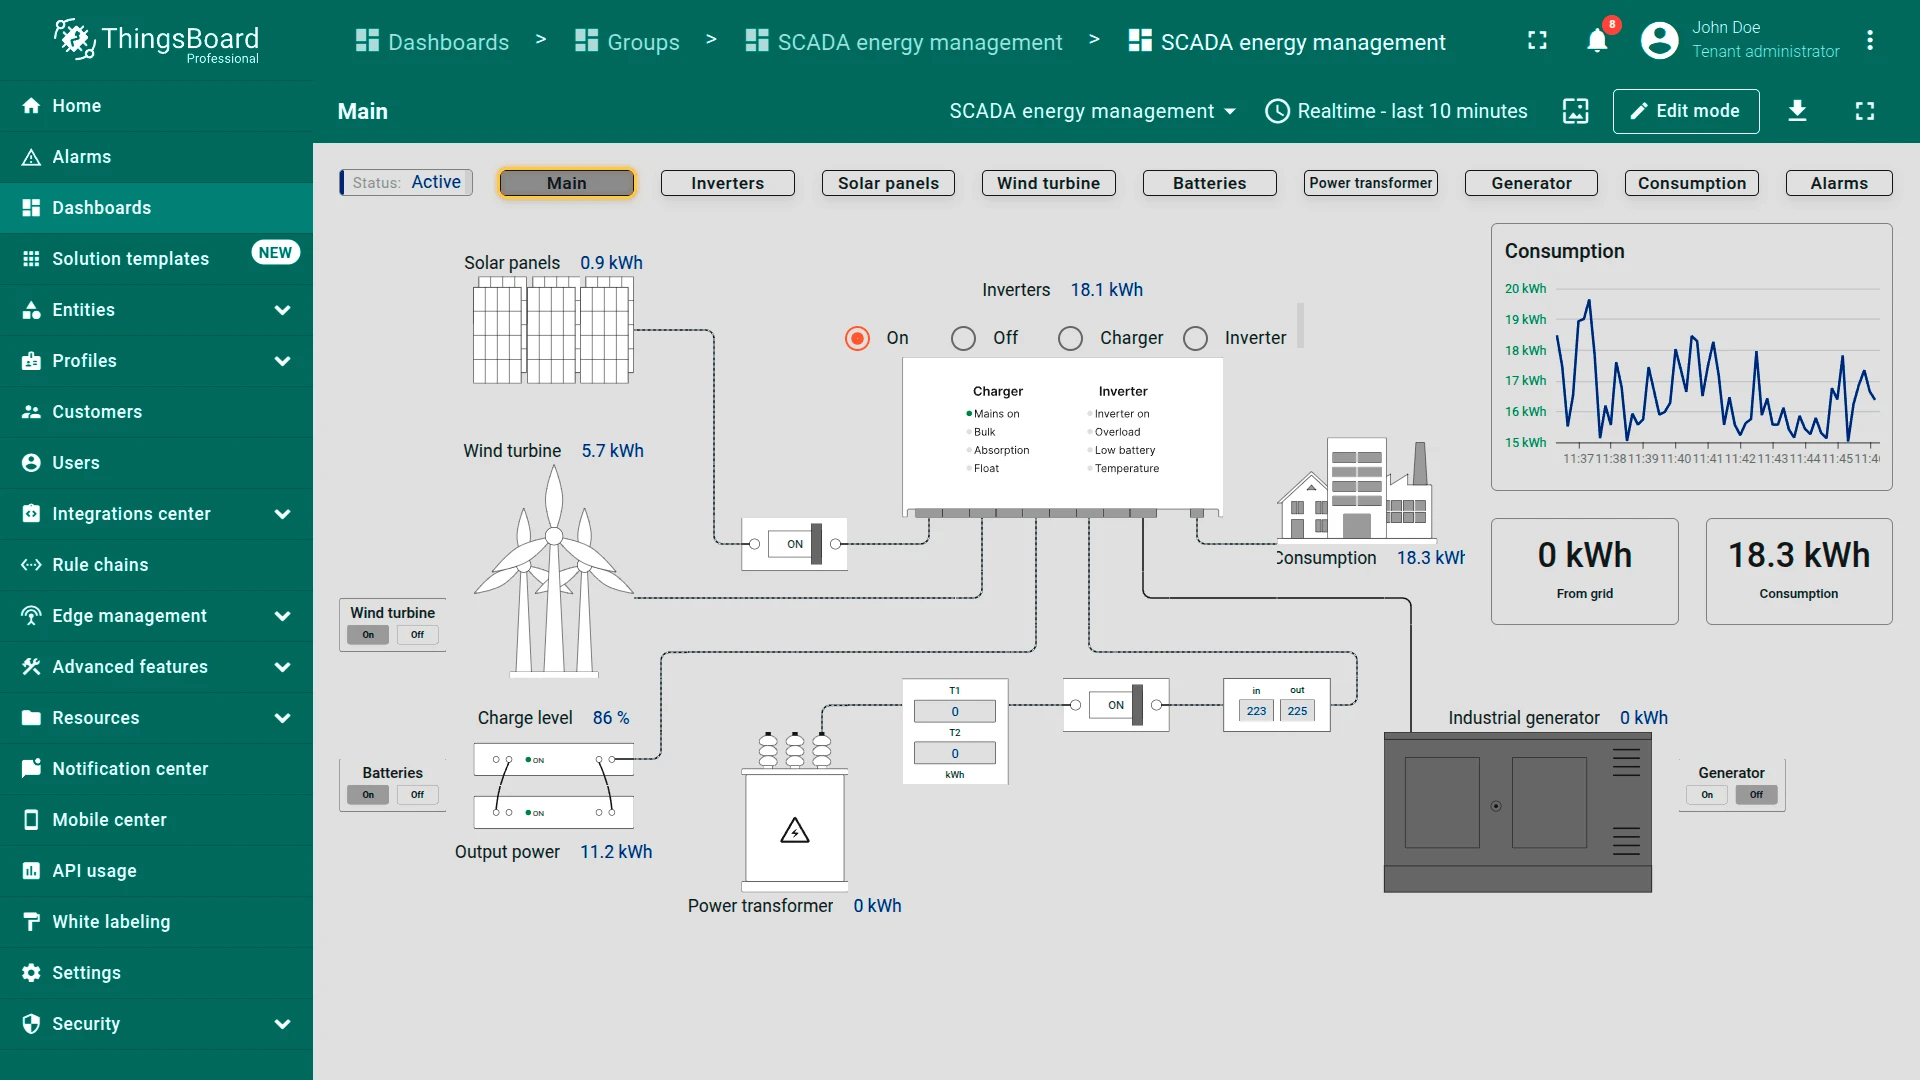
Section titled “Dashboard”The SCADA System for Smart Energy Management dashboard is designed for monitoring, controlling, and optimizing energy resources in real time. It enables operators to track the status of the energy system, analyze energy flows, and oversee the performance of generators, inverters, transformers, batteries, solar panels, and wind turbines. The dashboard helps detect faults, prevent failures, and improve energy efficiency through built-in alarms and historical data analysis.
Dashboard states
Section titled “Dashboard states”Navigate through dashboard states using navigation buttons to track and manage details for each energy component:
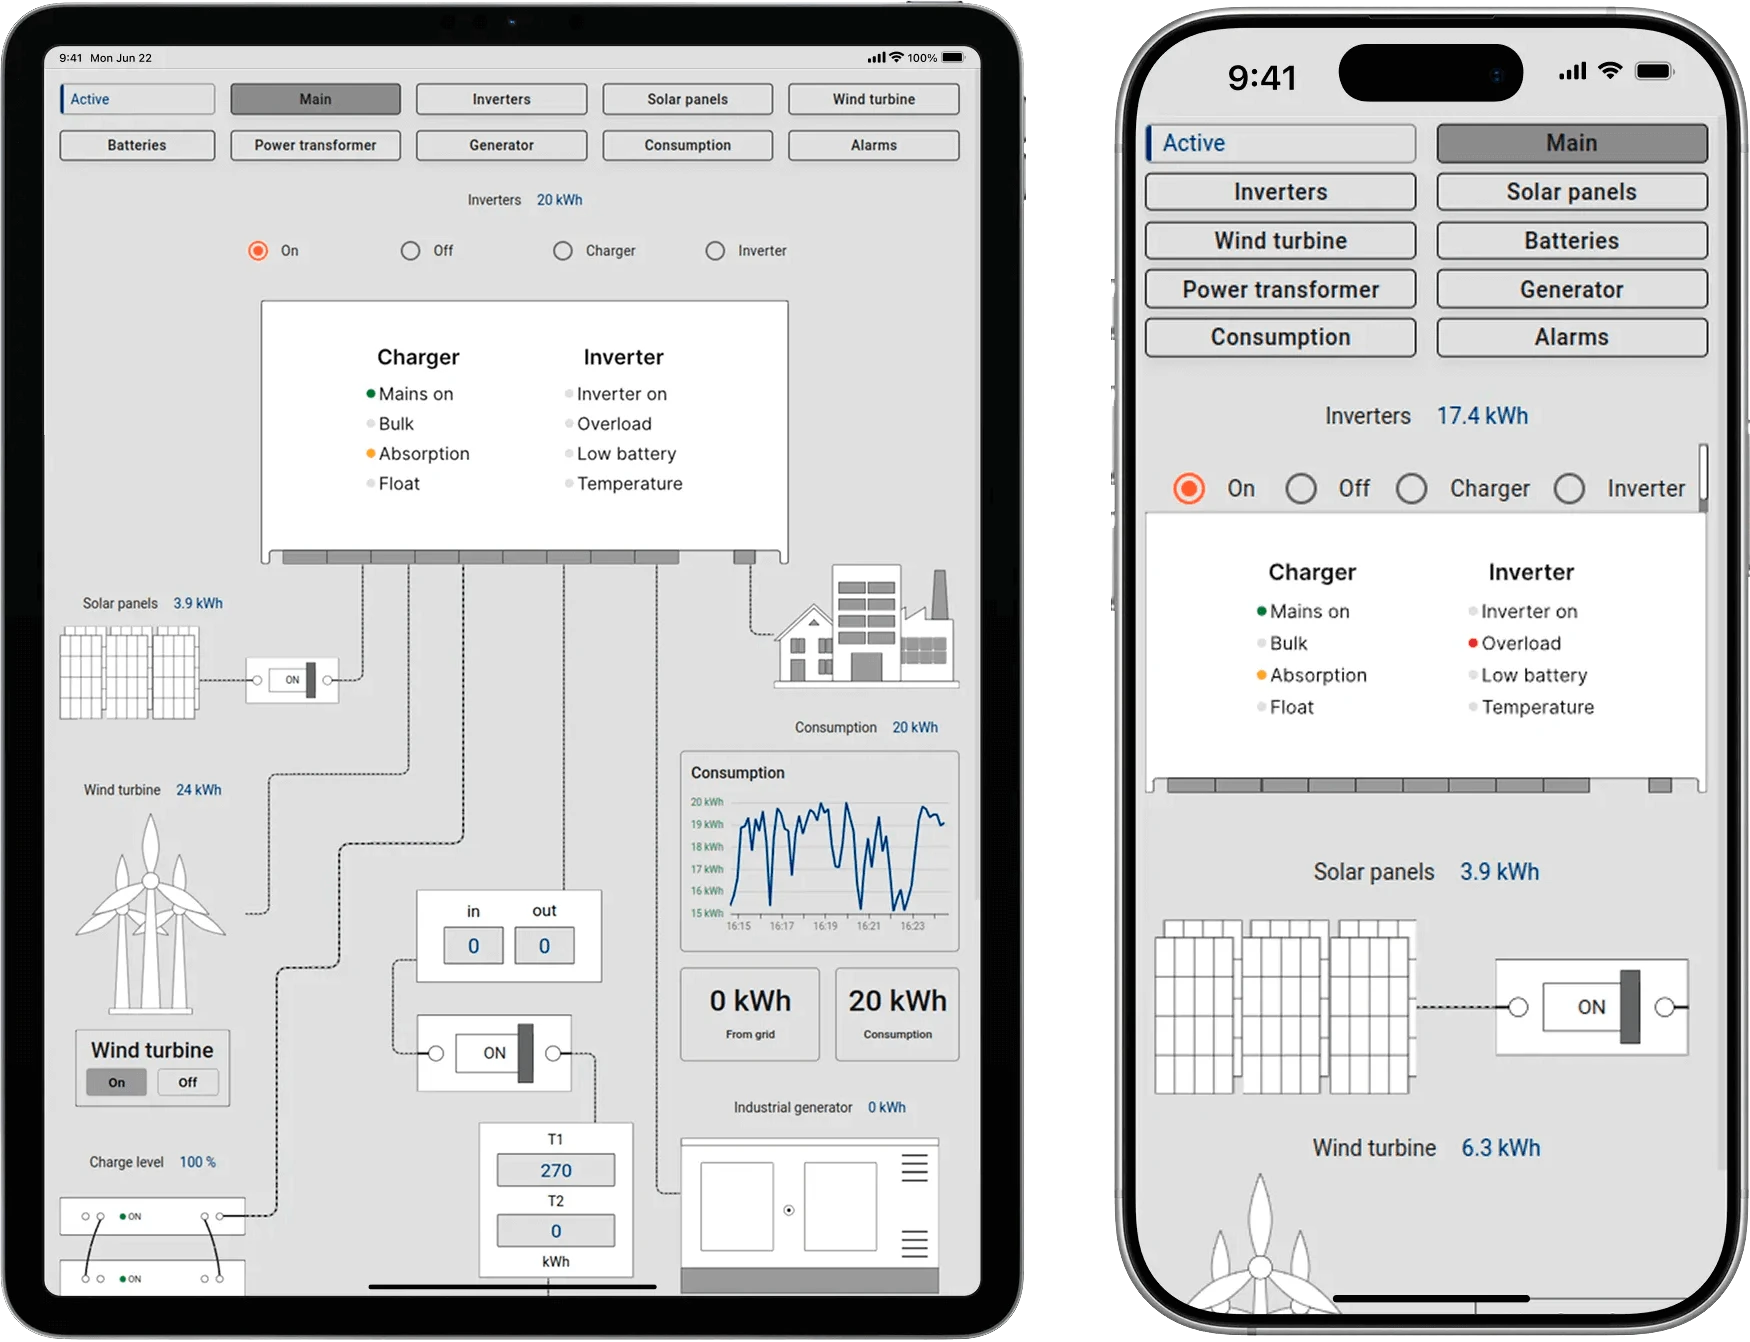
- Main dashboard state: Provides a high-level overview of the energy system. Shows the status of power sources (solar, wind, batteries, transformers, generators), real-time energy flow, and consumption. Key metrics like grid input, power usage, and battery levels are displayed with interactive controls to manage sources
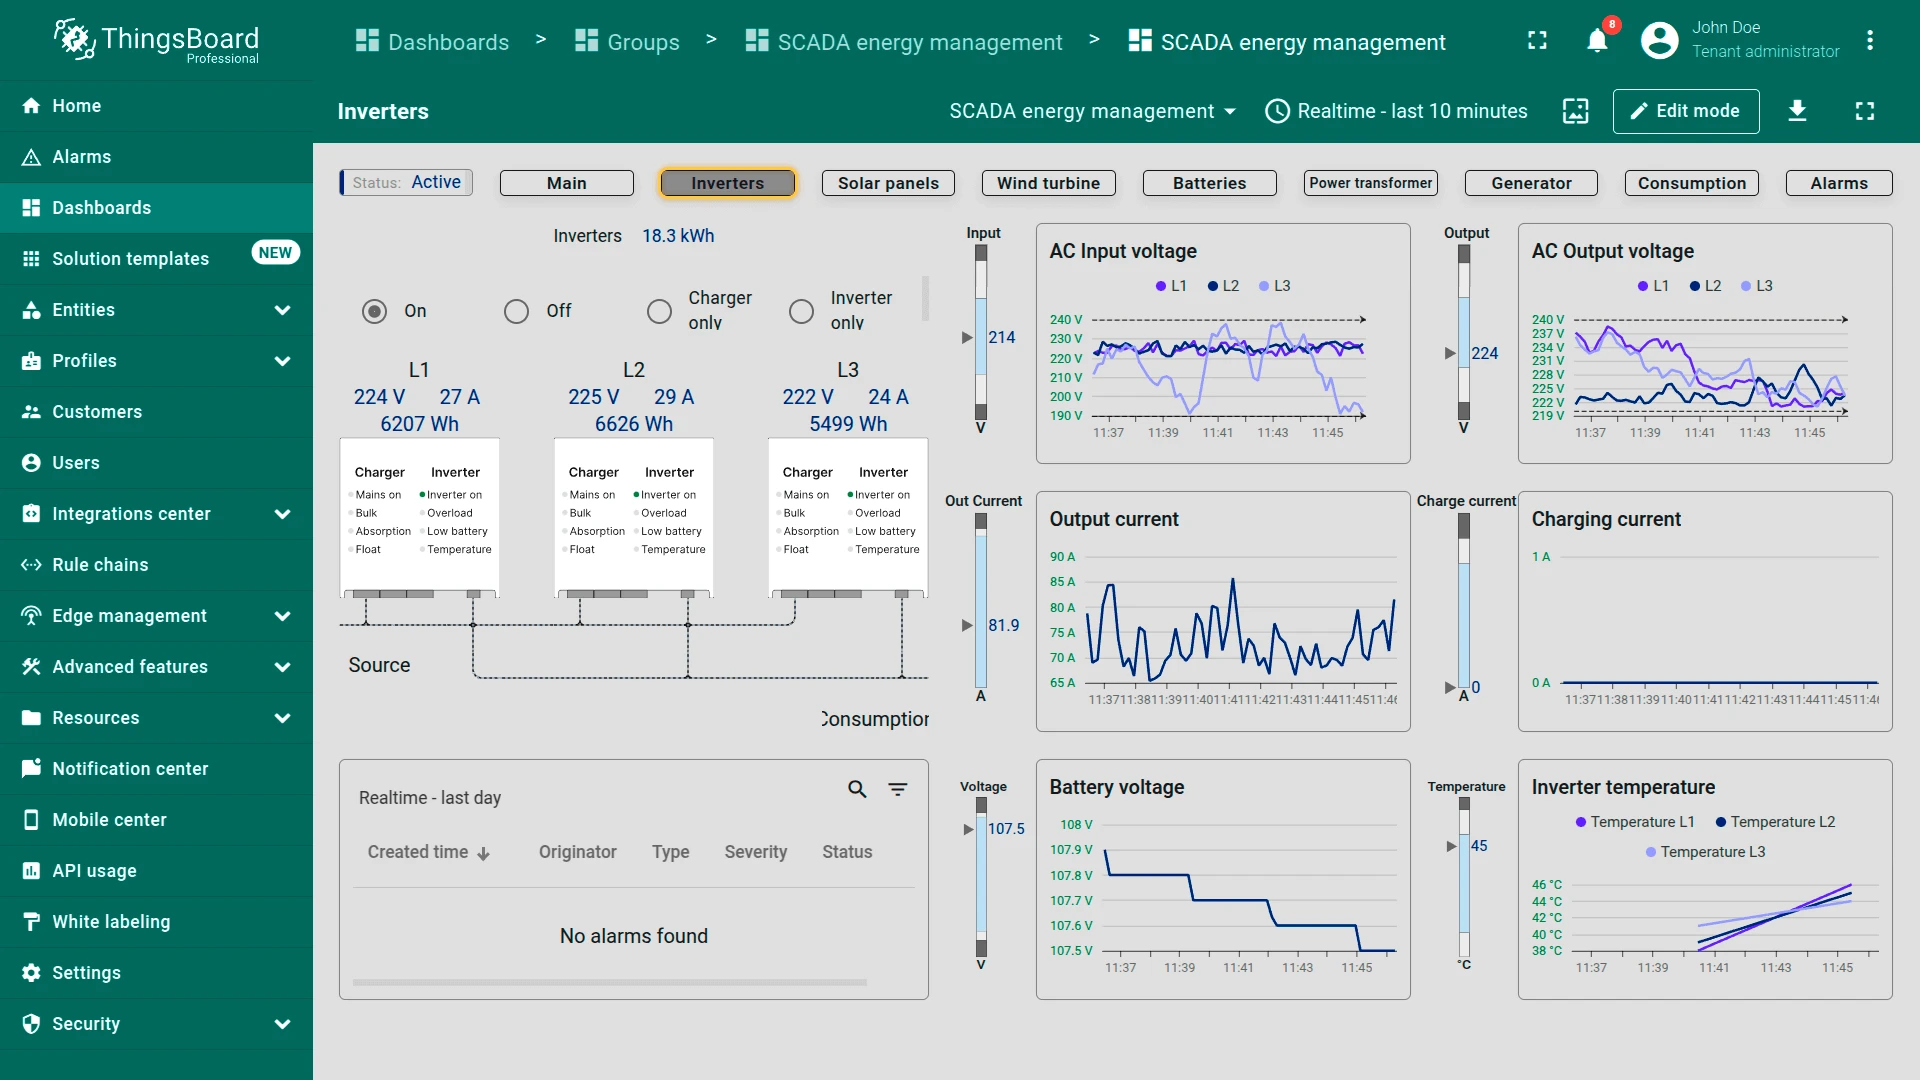
- Inverters state: Focuses on inverter performance and load distribution. Displays voltage, current, and power output for each phase (L1, L2, L3), with real-time graphs and an alarm section for issues like overload or overheating
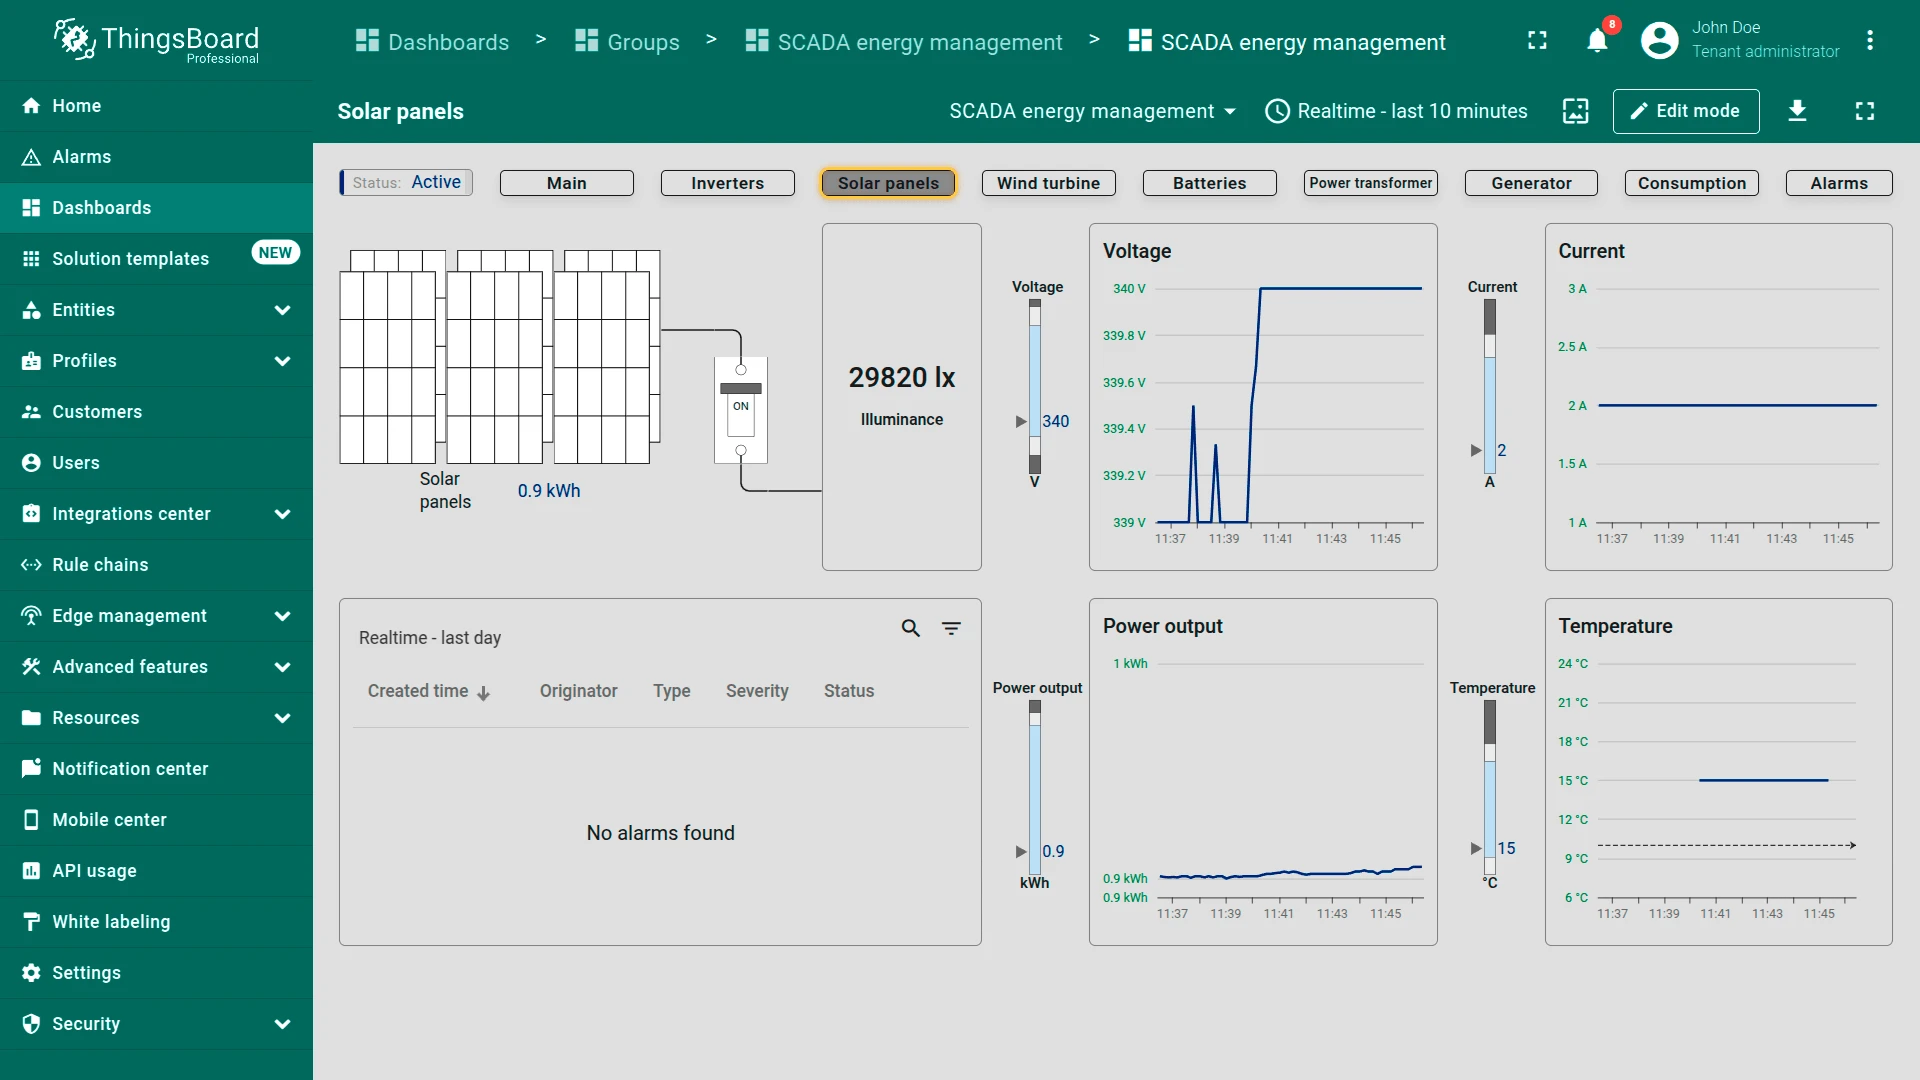
- Solar panels state: Monitors solar panel performance in real time: illumination, voltage, and power output. Includes historical trends for voltage, current, and temperature, plus alerts for generation issues
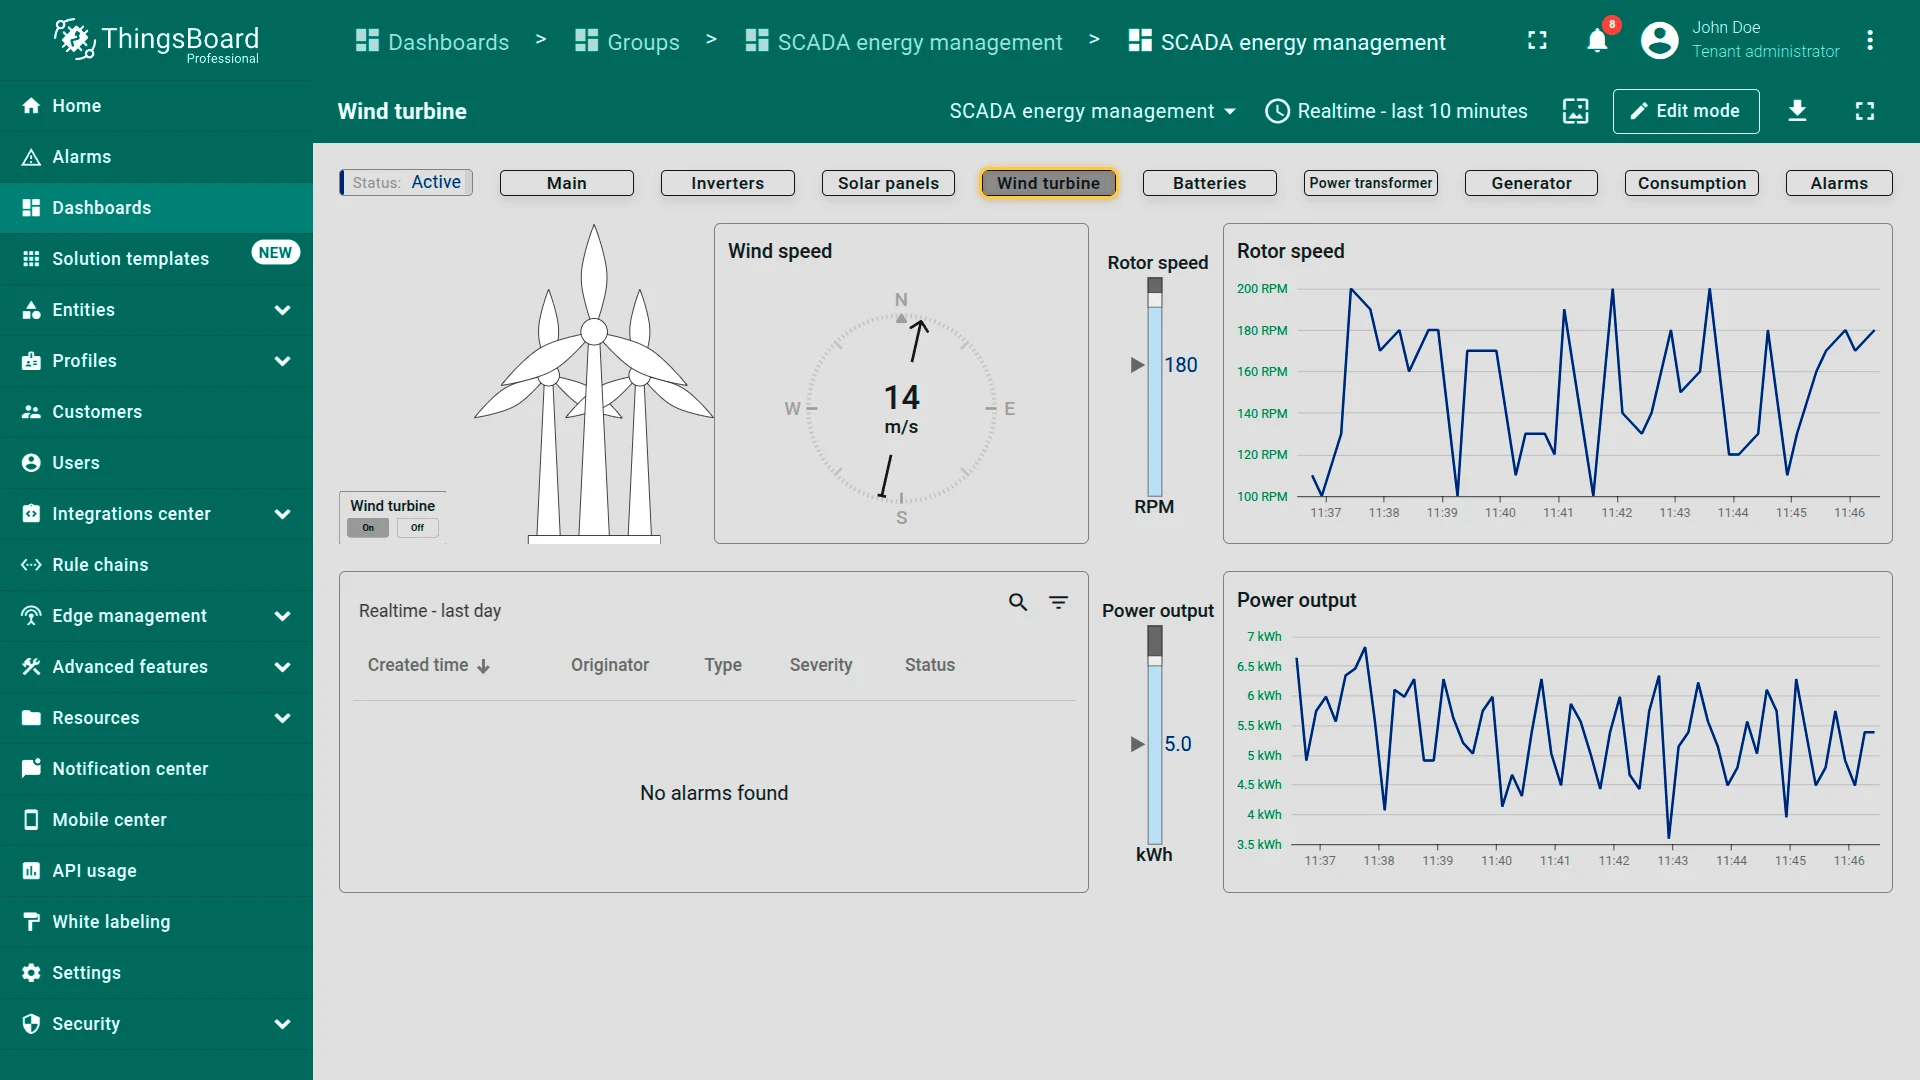
- Wind turbine state: Tracks wind turbine data: wind speed, rotor speed, and power output. Graphs show rotor speed and energy trends over time. Alerts notify users of issues like excessive vibrations or speed spikes
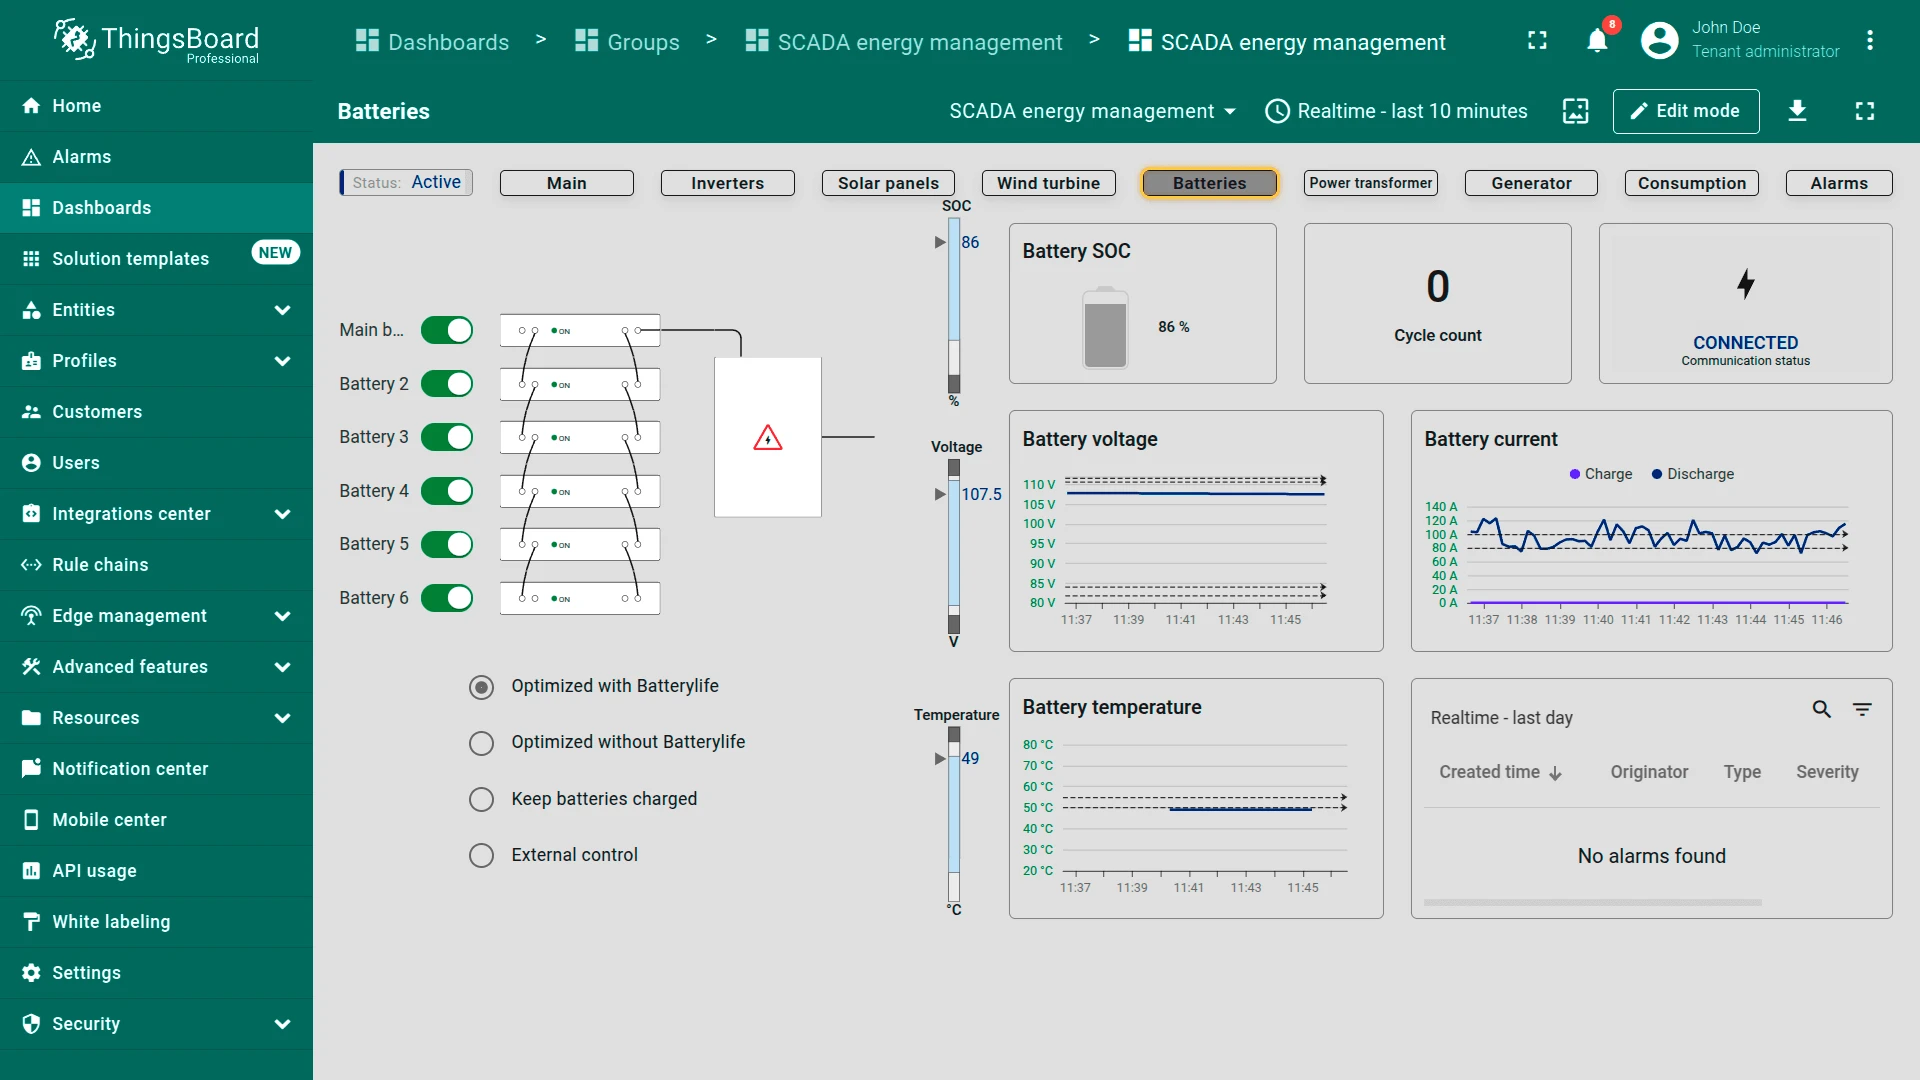
- Batteries state: Shows battery storage status including charge level (SOC), cycle count, and voltage. Graphs track charging and discharging currents, temperature, and voltage trends. The alarm section highlights battery health or operation problems
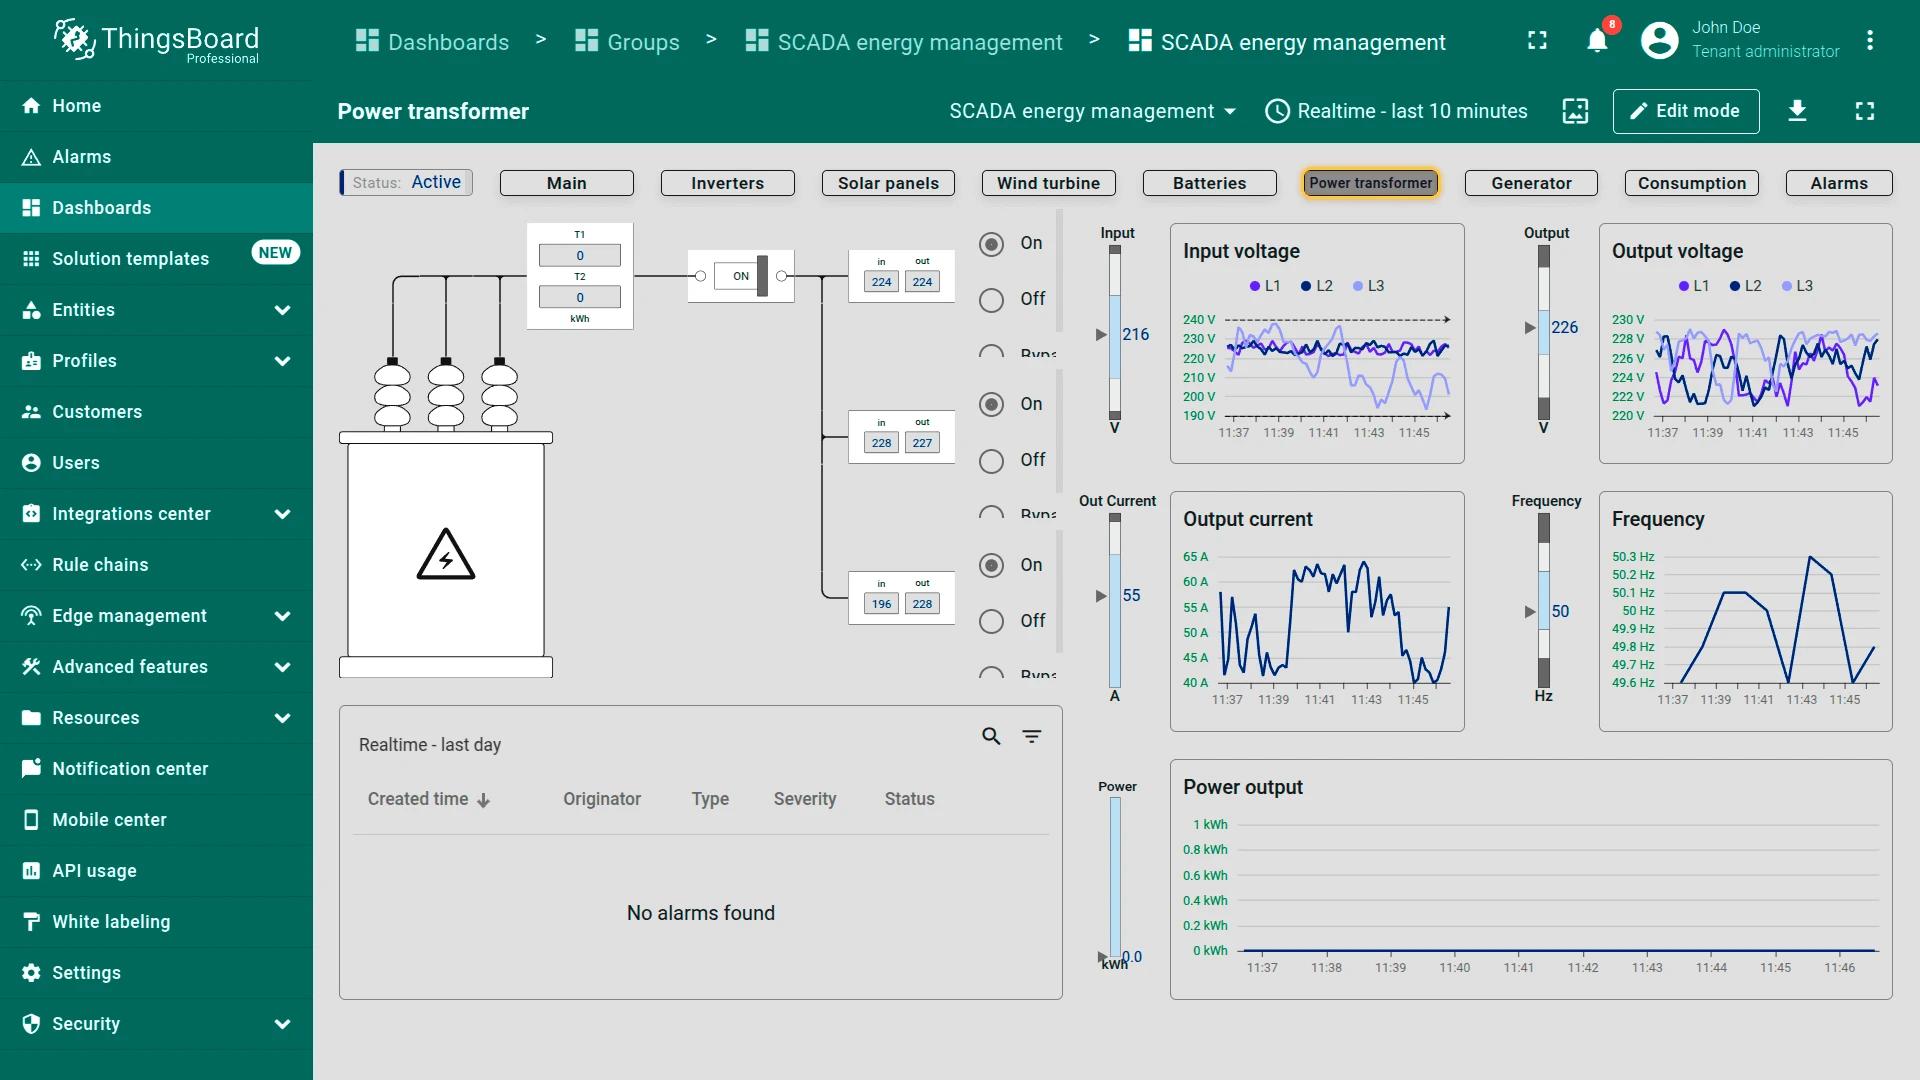
- Power transformer state: Displays transformer performance: input and output voltage, current, and frequency. Real-time energy flow monitoring is supported by historical graphs and alerts for transformer faults or instabilities
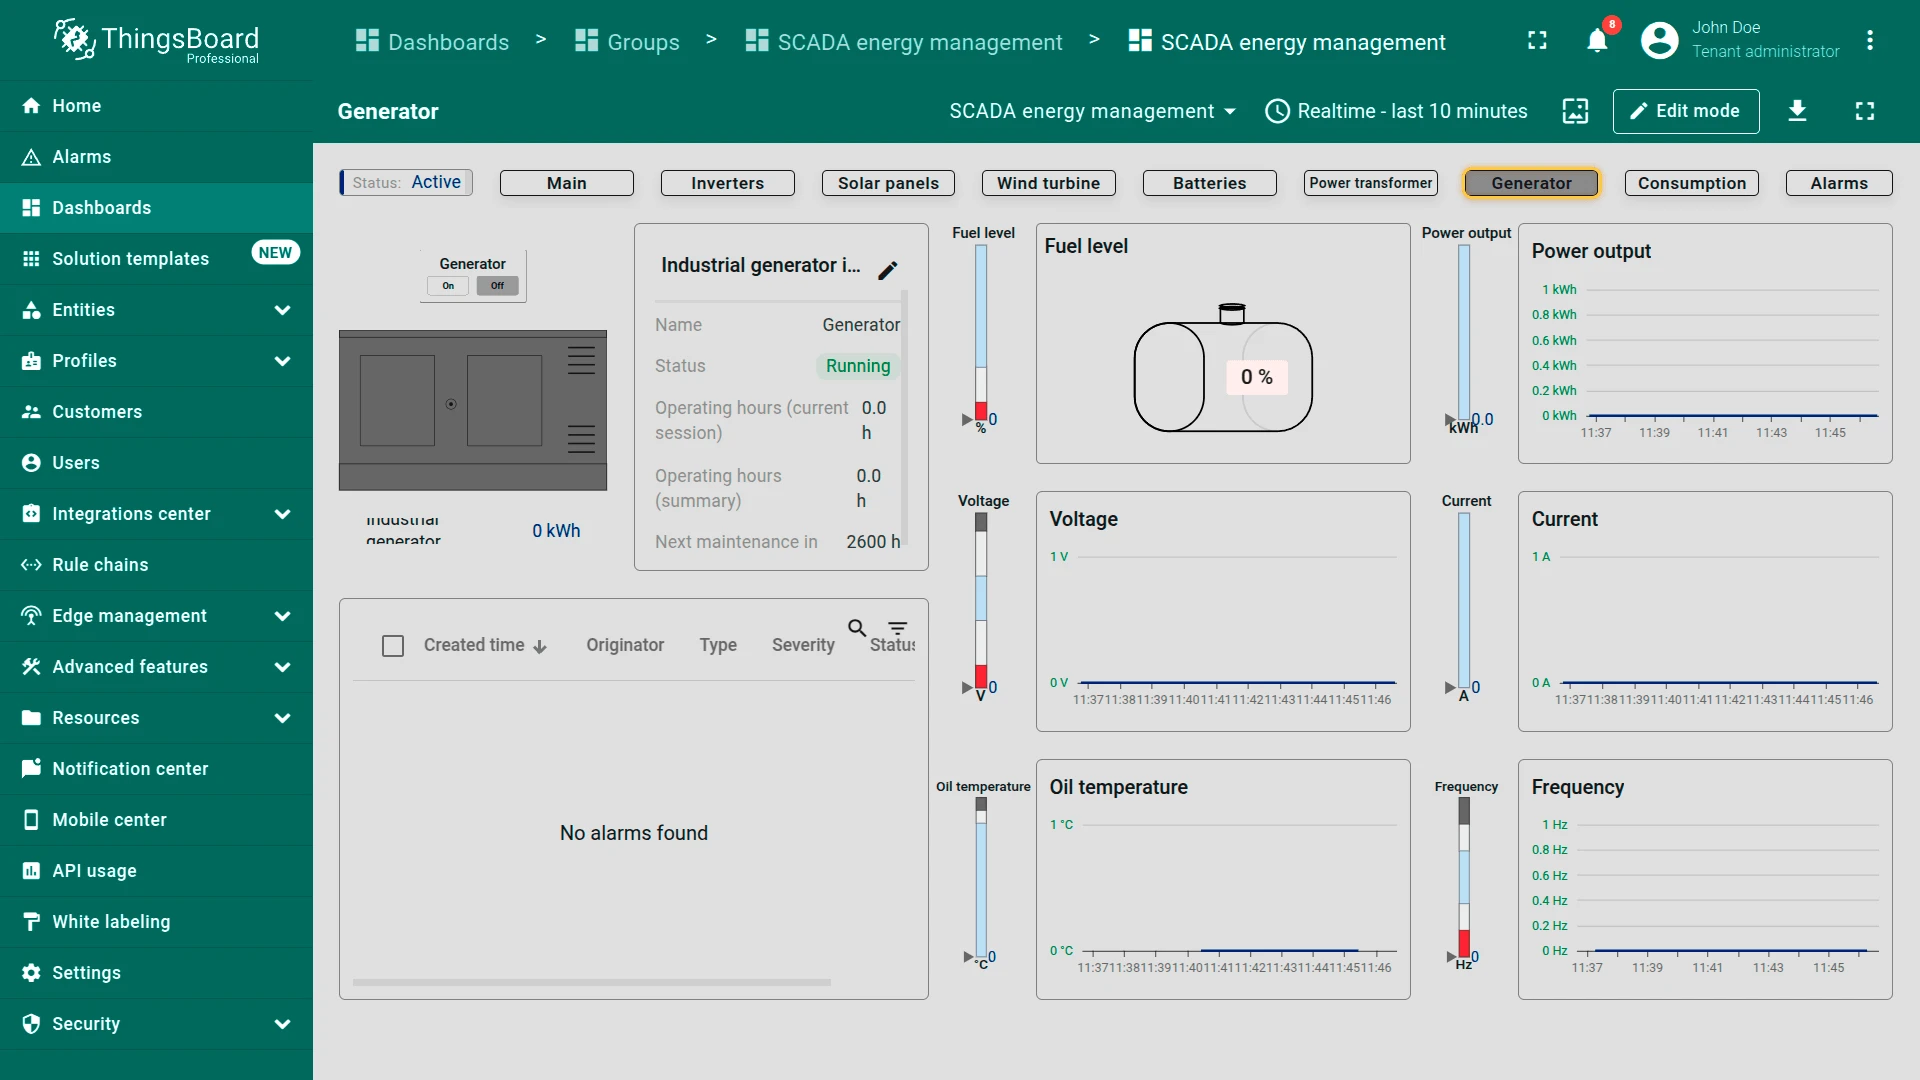
- Generator state: Provides insights into generator operation: fuel levels, voltage, current, and oil temperature. Shows operating hours, maintenance status, and alerts for critical conditions to ensure reliable backup power
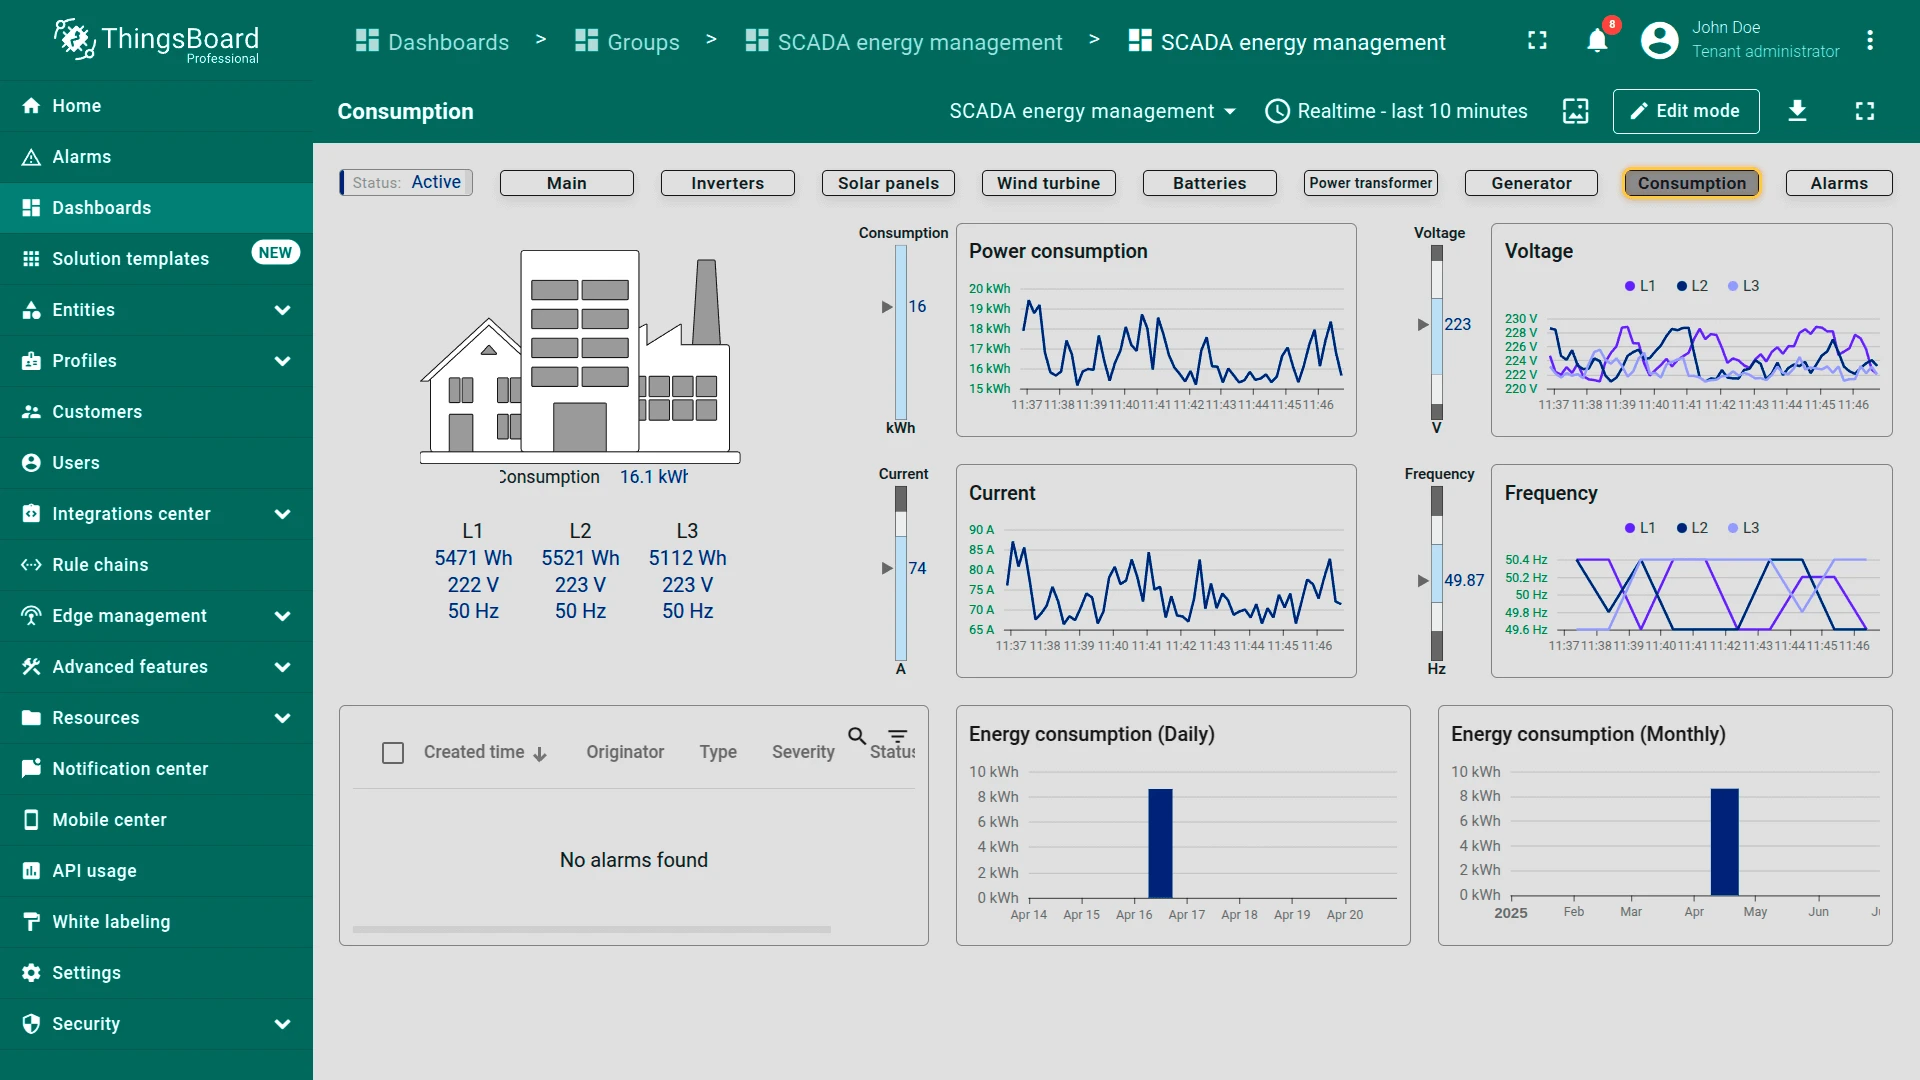
- Consumption state: Visualizes energy usage over daily and monthly periods. Graphs show consumption, voltage, current, and frequency to help optimize efficiency. Alarms flag unusual consumption patterns or system issues
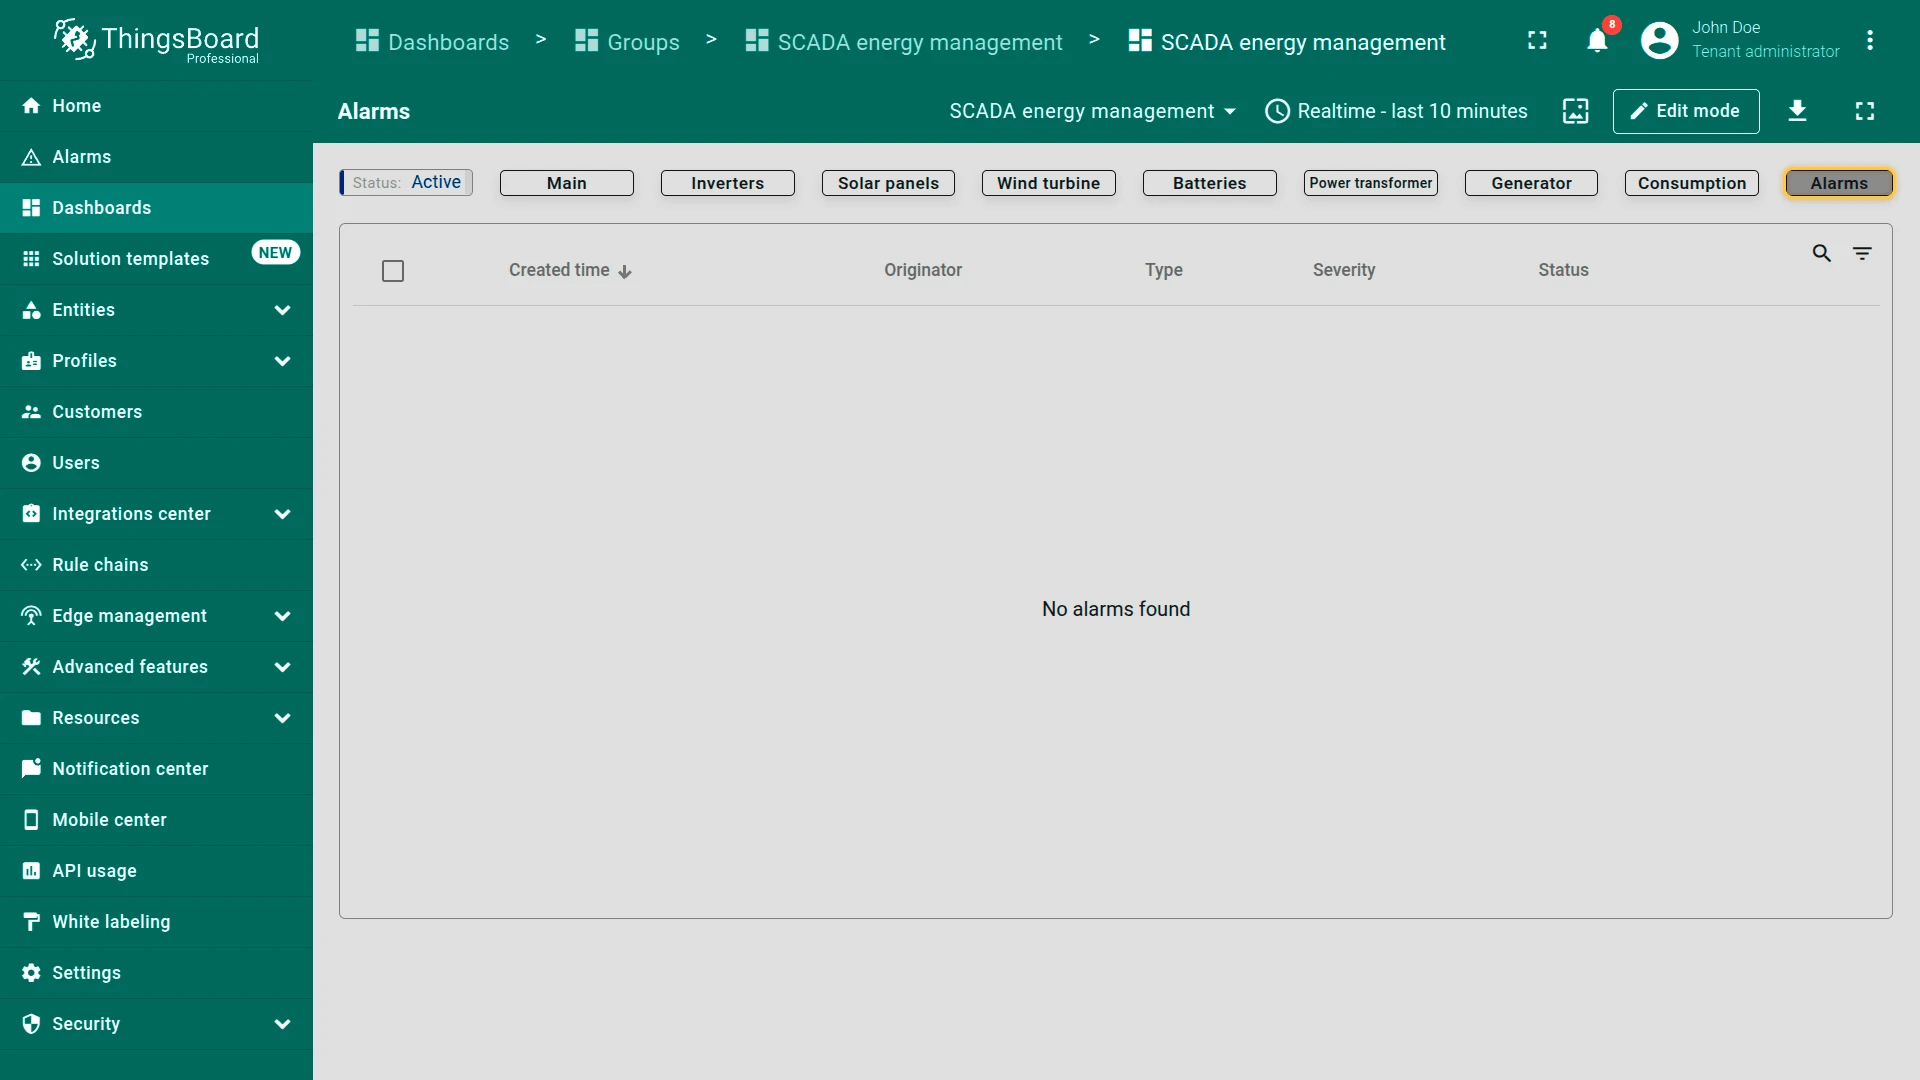
- Alarms state: Lists all active and historical system alarms with timestamps, severity, and status. Users can acknowledge or resolve alerts related to faults, vibrations, and performance deviations
The dashboard supports responsive layouts for tablets and smartphones.
The dashboard can be fully customized using the dashboard development tools.
Devices
Section titled “Devices”The solution configures the Energy Management Gateway and creates seven devices via the ThingsBoard IoT Gateway with the Modbus connector:
| Category | Devices |
|---|---|
| Generation | Solar panels, Wind turbine, Generator |
| Storage and conversion | Batteries, Inverter |
| Grid and load | Power transformer, Consumption |
Alarms
Section titled “Alarms”Alarm generation is handled by alarm rules configured in the device profiles. The solution includes 28 alarm rules across seven device profiles, each with Warning and Critical severity levels:
- Batteries (5 rules) — temperature, voltage, discharge current, charge current, level
- Inverter (5 rules) — overload (Critical only), current, input average voltage, output average voltage, average temperature
- Solar Panels (4 rules) — power output, temperature, current, voltage
- Power Transformer (4 rules) — frequency, current, input voltage, output voltage
- Generator (4 rules) — voltage, frequency, oil temperature, fuel level
- Consumption (3 rules) — frequency, current sum ampere, average voltage
- Wind Turbine (3 rules) — wind speed, output power, rotor speed
All alarms check whether the device is in a running state before evaluating thresholds.
Calculated fields
Section titled “Calculated fields”The solution uses 12 calculated fields to compute derived metrics from raw Modbus telemetry.
3-phase averaging
Modbus devices report separate values for each electrical phase (L1, L2, L3). Seven calculated fields average these per-phase readings into single values for simplified dashboard display and alarm evaluation:
- Inverter: Average input voltage, output voltage, and temperature
- Power Transformer: Average input voltage and output voltage
- Consumption: Average voltage and average frequency
Power and load
Four calculated fields derive power metrics that the devices do not report directly:
- Output Power: Battery discharge power (voltage × discharge current)
- Flow Charge-Discharge: Net battery current direction — positive means charging, negative means discharging
- Overload: Compares actual consumption against power demand on the inverter to calculate available headroom
- Current sum ampere: Total system current, summing per-phase values (I = P/V for each phase) on the consumption meter
Cross-device data
The Battery telemetry calculated field on the Inverter profile pulls battery level and temperature from the Battery device, allowing the inverter dashboard state to show battery status alongside inverter metrics without switching between views.
Conclusion
Section titled “Conclusion”The SCADA Energy management solution template delivers a monitoring and control system with real-time visualization of energy infrastructure, interactive dashboard states for each subsystem, calculated fields for power quality analysis, and 28 pre-configured alarm rules. It enables fast onboarding through the included Modbus emulator and serves as a foundation for both demonstrations and production energy management use cases.
Was this helpful?