Air quality monitoring
The Air quality monitoring solution template represents a solution for general air pollution monitoring and device management. With this template, you can monitor pollutants like Ozone, PM2.5, PM10, CO, SO2, and NO2 across specific regions using pollution measuring stations and determine the Air Quality Index (AQI) based on those readings.
The system includes a public-facing dashboard for citizens (embeddable, no login required) and an administration dashboard for managing sensors, alarms, and device health. AQI values are automatically computed from raw pollutant data using calculated fields.
Key application areas
Section titled “Key application areas”This solution template can be used as a baseline for:
- Smart cities: Informing residents about outdoor activity safety and reducing urban health risks
- Industrial zones: Monitoring emissions in real time for environmental regulation compliance
- Campus safety: Tracking air quality across universities or school districts during high-pollution events
Install solution template
Section titled “Install solution template”To understand how the Air quality monitoring solution works, start by installing the solution template.
- Go to Solution templates in the main menu.
- Find Air quality monitoring and click Install.
- Follow the provided configuration instructions and click Close.
- The Air Quality Monitoring dashboard opens automatically.
After installation, a fully functional air quality monitoring simulation is created automatically. No devices, integrations, or custom code are required to start exploring the solution.
System components
Section titled “System components”The Air quality monitoring solution includes:
- Dashboards: A public Air Quality Monitoring dashboard for citizens and an administration dashboard for sensor fleet management
- Devices: Five pre-provisioned air quality sensor devices populated with demo historical data
- Device profile: A predefined AQI Sensor device profile with calculated fields for AQI computation and pre-configured alarm rules for battery and connectivity monitoring
- Entity groups: AQI city asset group and AQI Sensor device group for organizing infrastructure
Edge support. The solution can optionally be deployed to ThingsBoard Edge for local data processing and reduced latency. Edge is available as an add-on for your license or subscription. The edge computing instructions appear in the solution instructions dialog when the Edge add-on is active.
Dashboards
Section titled “Dashboards”The solution creates two dashboards: a public dashboard for end-users and an administration dashboard for Tenant Administrators.
Public dashboard
Section titled “Public dashboard”The public dashboard is designed for end-users and requires no login. It is pre-configured to monitor Los Angeles and operates in two main views within the same interface. The dashboard layout consists of an interactive map on the right and a dynamic information sidebar on the left.
The public dashboard can be shared via a public link or embedded into your website. For details, see make dashboard public.
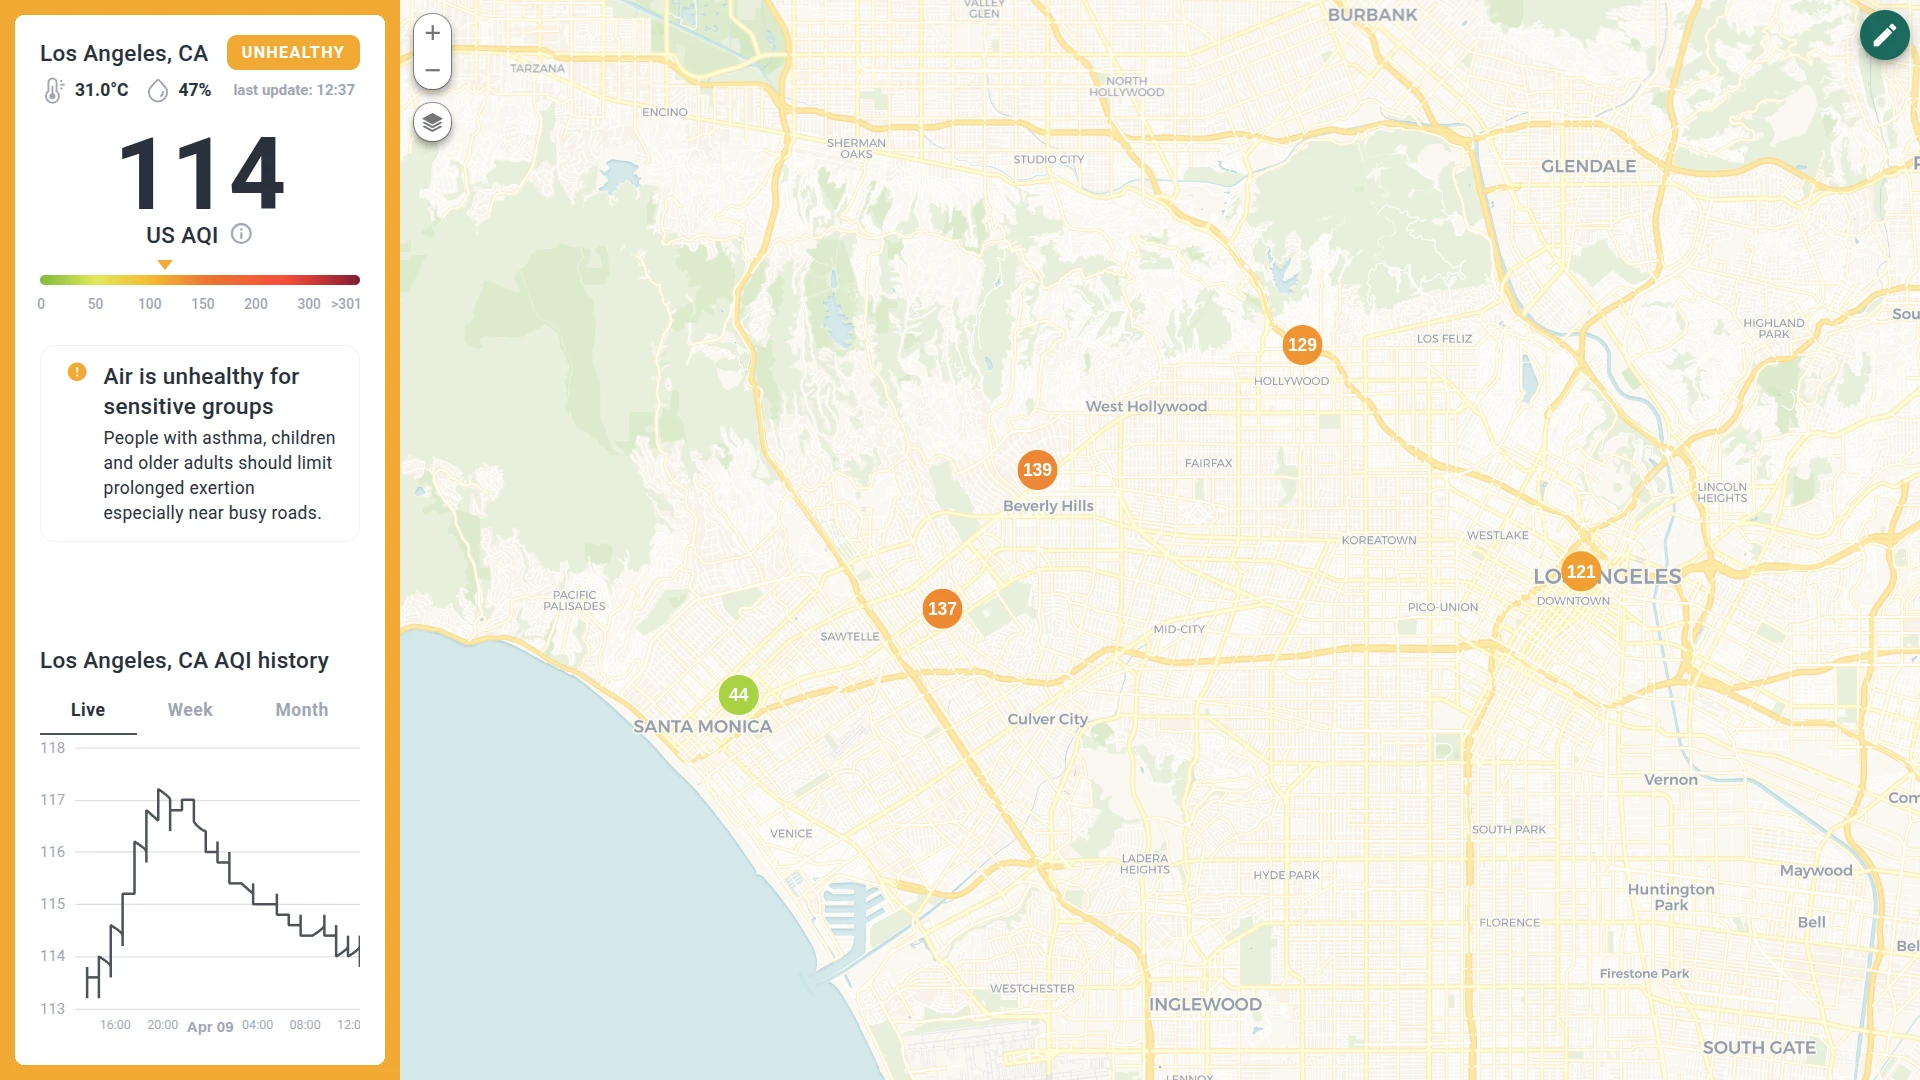
City state (aggregate view)
This view represents the overall air pollution monitoring of the city. It calculates values based on data received from all city sensors.
- City details: Displays the city name along with real-time temperature and humidity
- Pollution status: Shows the current status according to EPA standards (like “Clean” or “Unhealthy”)
- AQI scale: Displays the average AQI value based on all sensors in the city, visualized on a color-coded scale
- Legend info: Click the info icon under the AQI value to open a popup with the full legend of pollutants
- Recommendations: General recommendations for sensitive groups based on the current pollution level
- History: A chart displaying AQI level trends in live, weekly, and monthly ranges
- Interactive map: Shows air pollution monitoring stations across the city. The markers are color-coded depending on their specific AQI level
Click on any sensor marker on the map to instantly update the dashboard with data for that specific district. You can switch between districts by clicking different markers.
Sensor state (district view)
When a marker is selected, the sidebar updates to show the local state of that specific district.

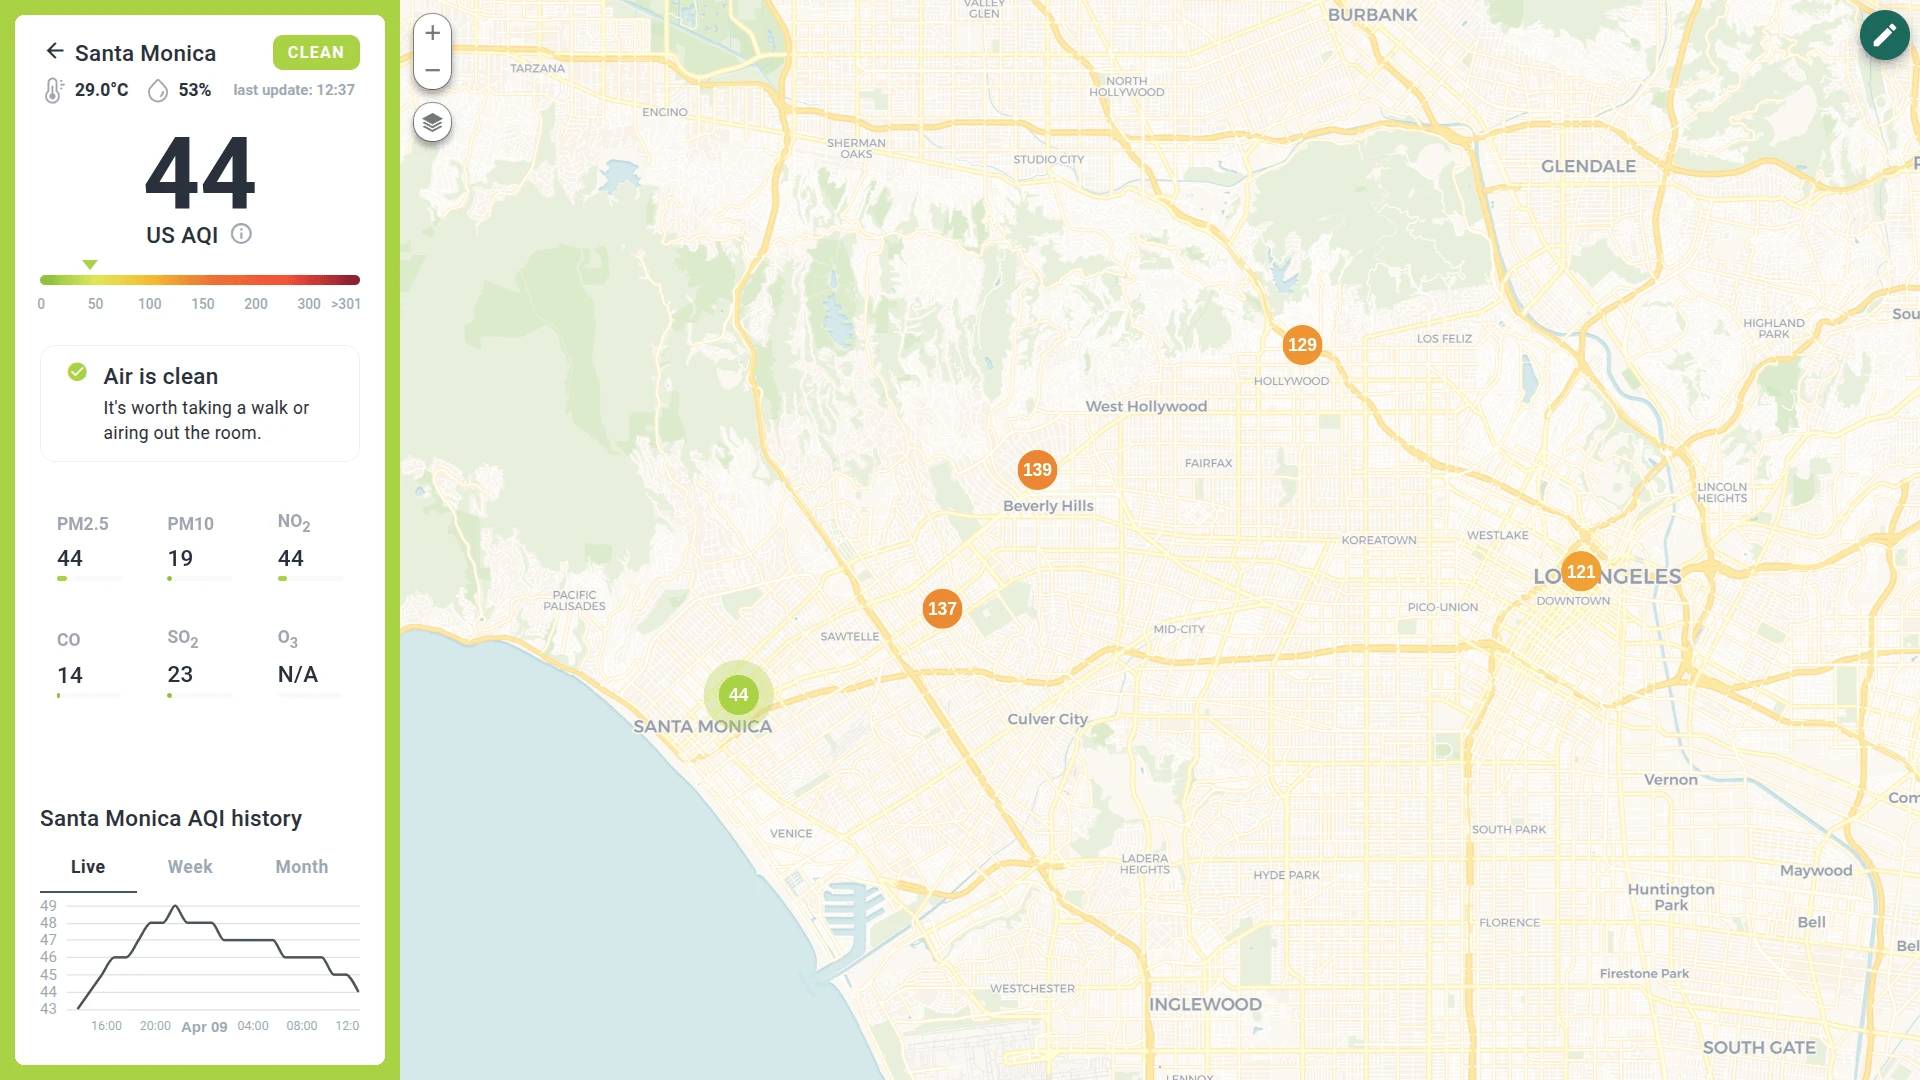
- Local data: Displays the same metrics as the city state (temperature, humidity, recommendations), but the values are specific to the selected sensor
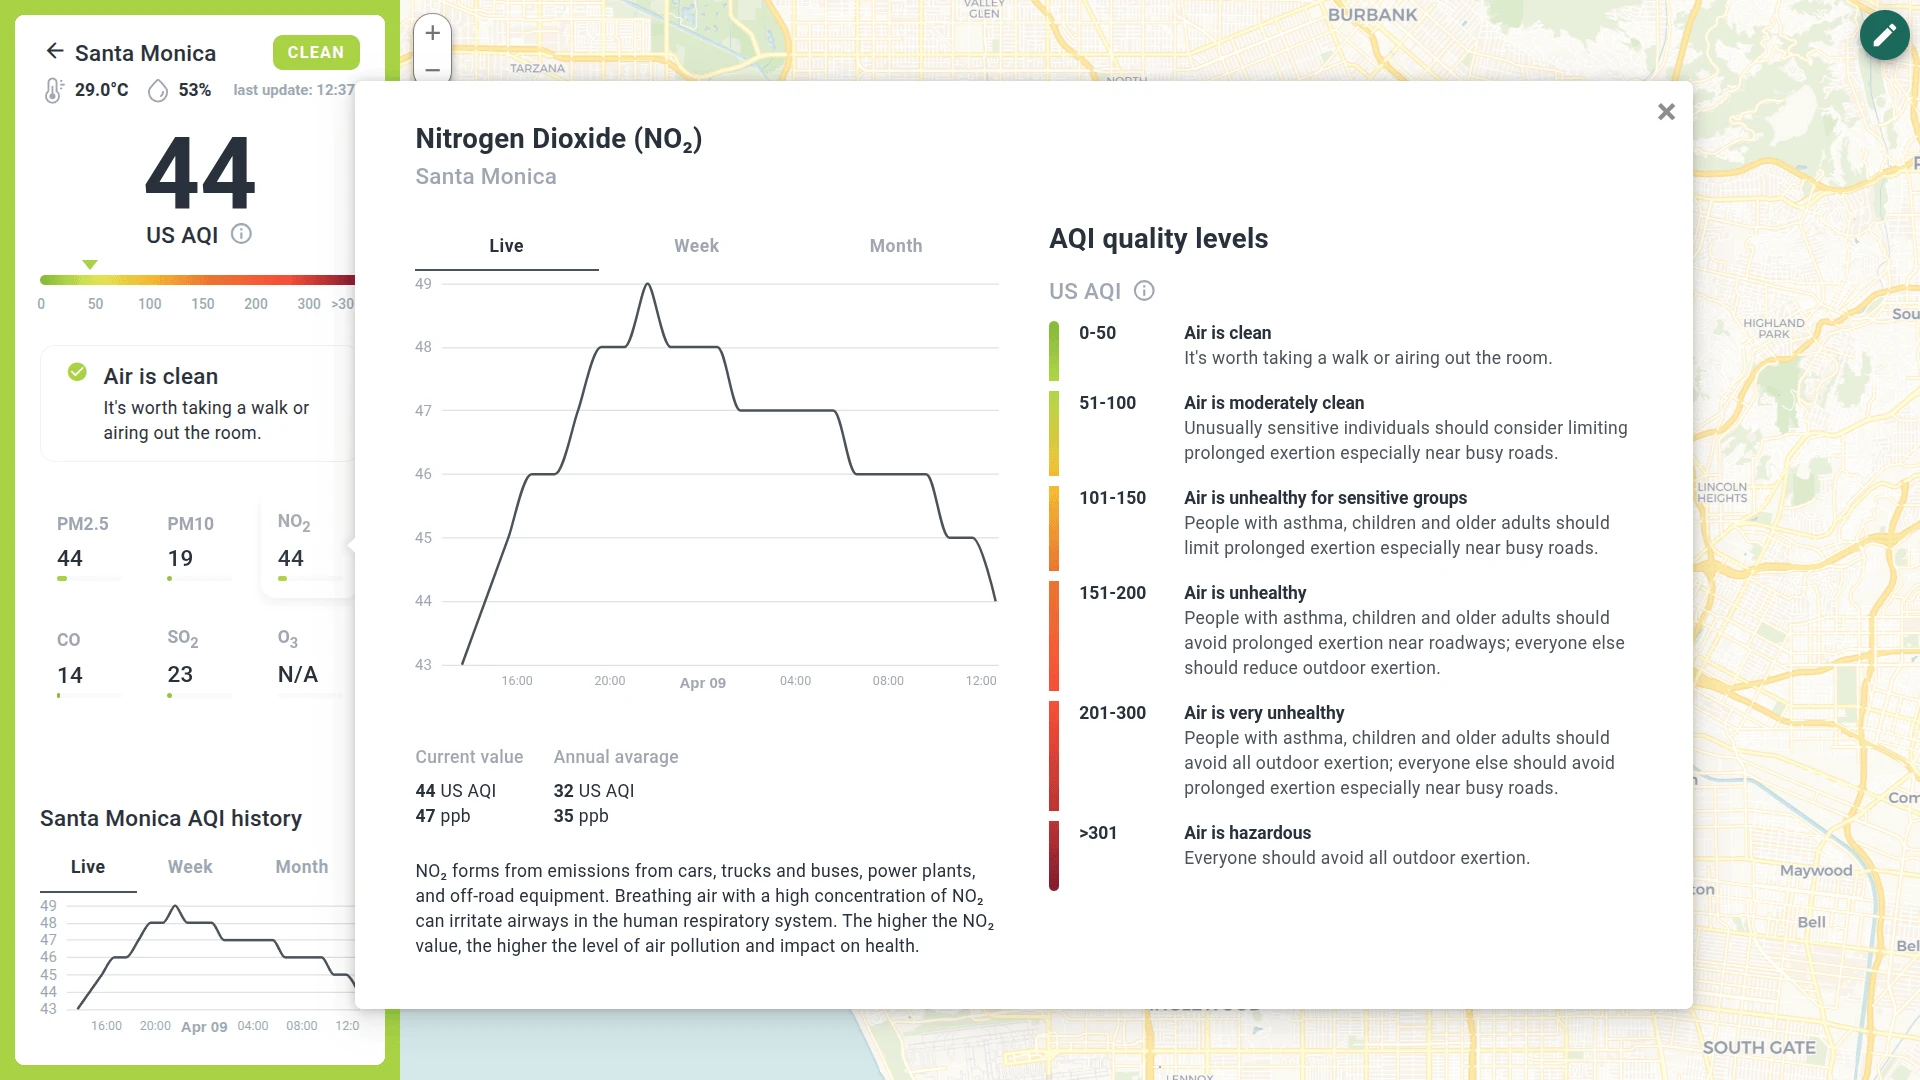
- Specific pollutants: A dedicated section of tiles displaying values for PM2.5, PM10, NO2, CO, SO2, and O3. Click on any tile to view a description, specific recommendations, and statistics for that pollutant
Administration dashboard
Section titled “Administration dashboard”This dashboard is designed for Tenant Administrators to oversee the entire sensor fleet. It allows you to add new devices, monitor technical health (battery, connectivity), and configure alarm rules.
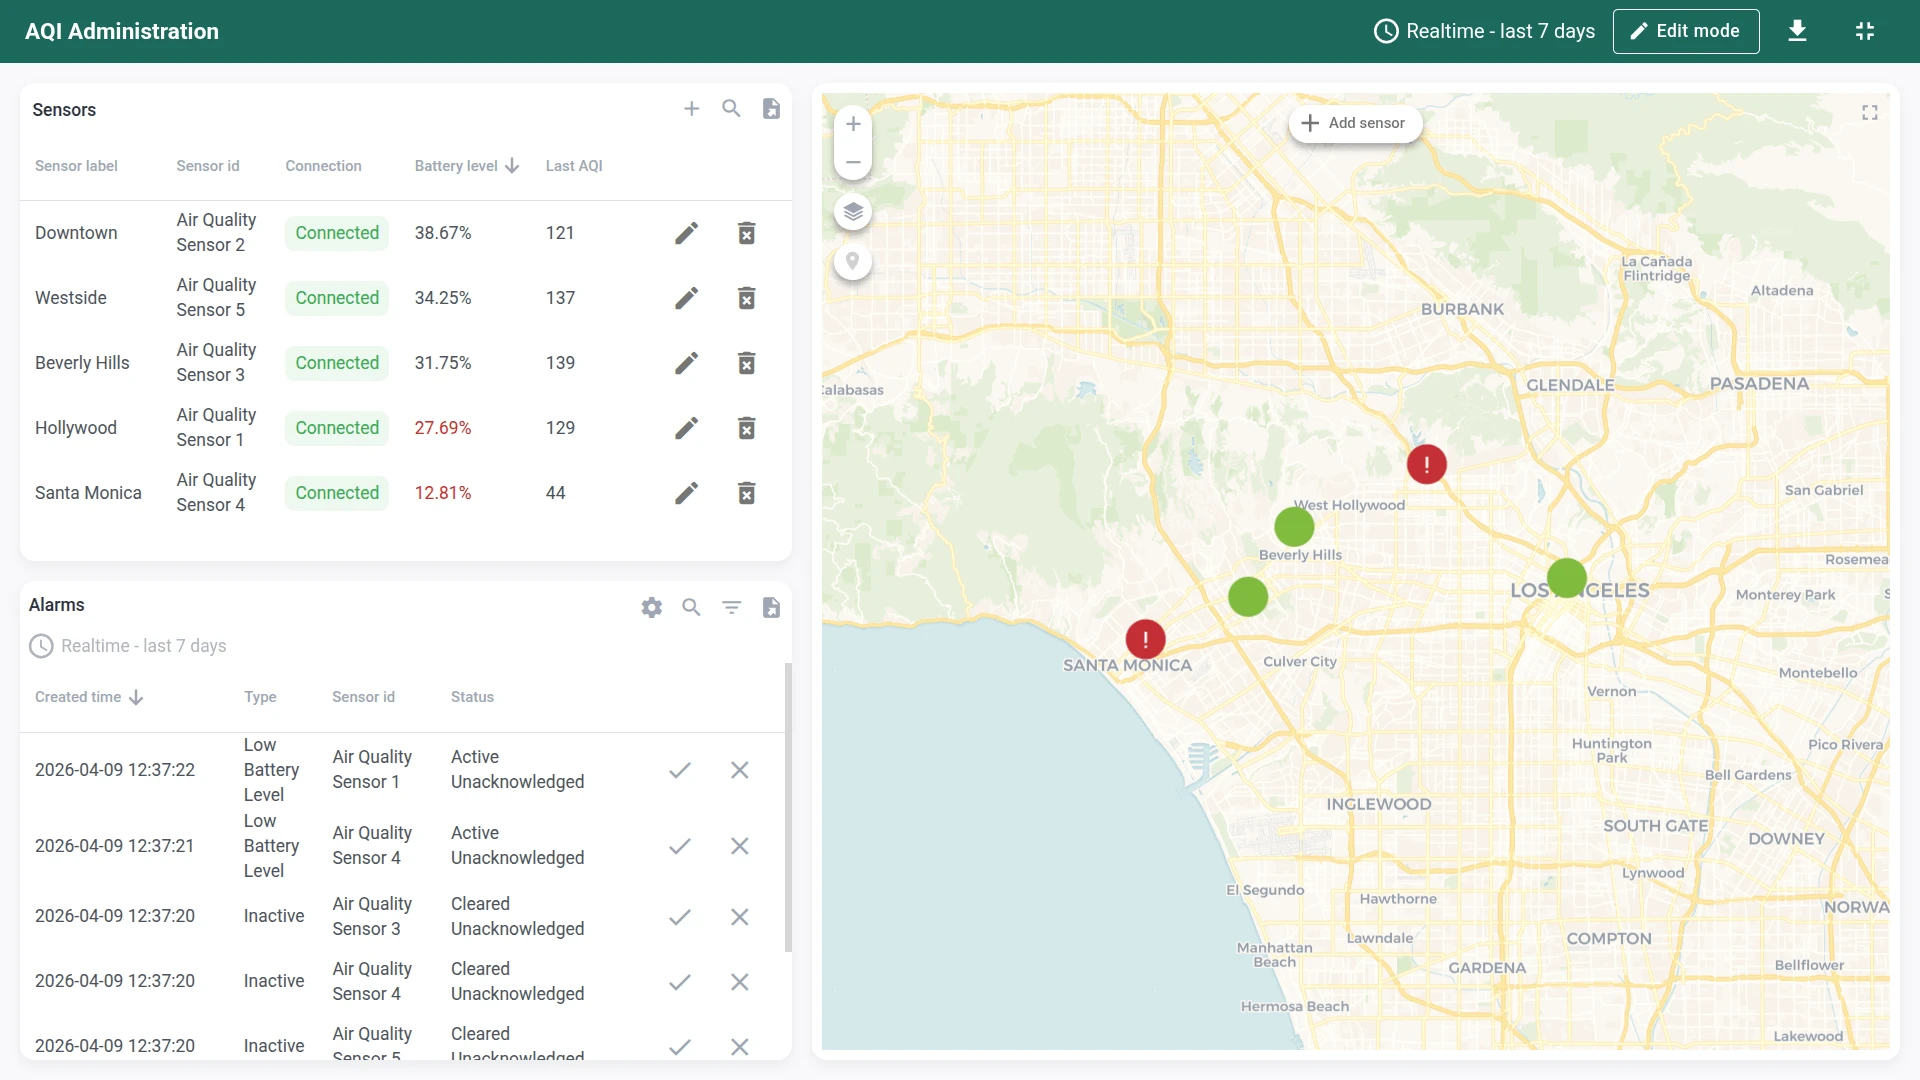
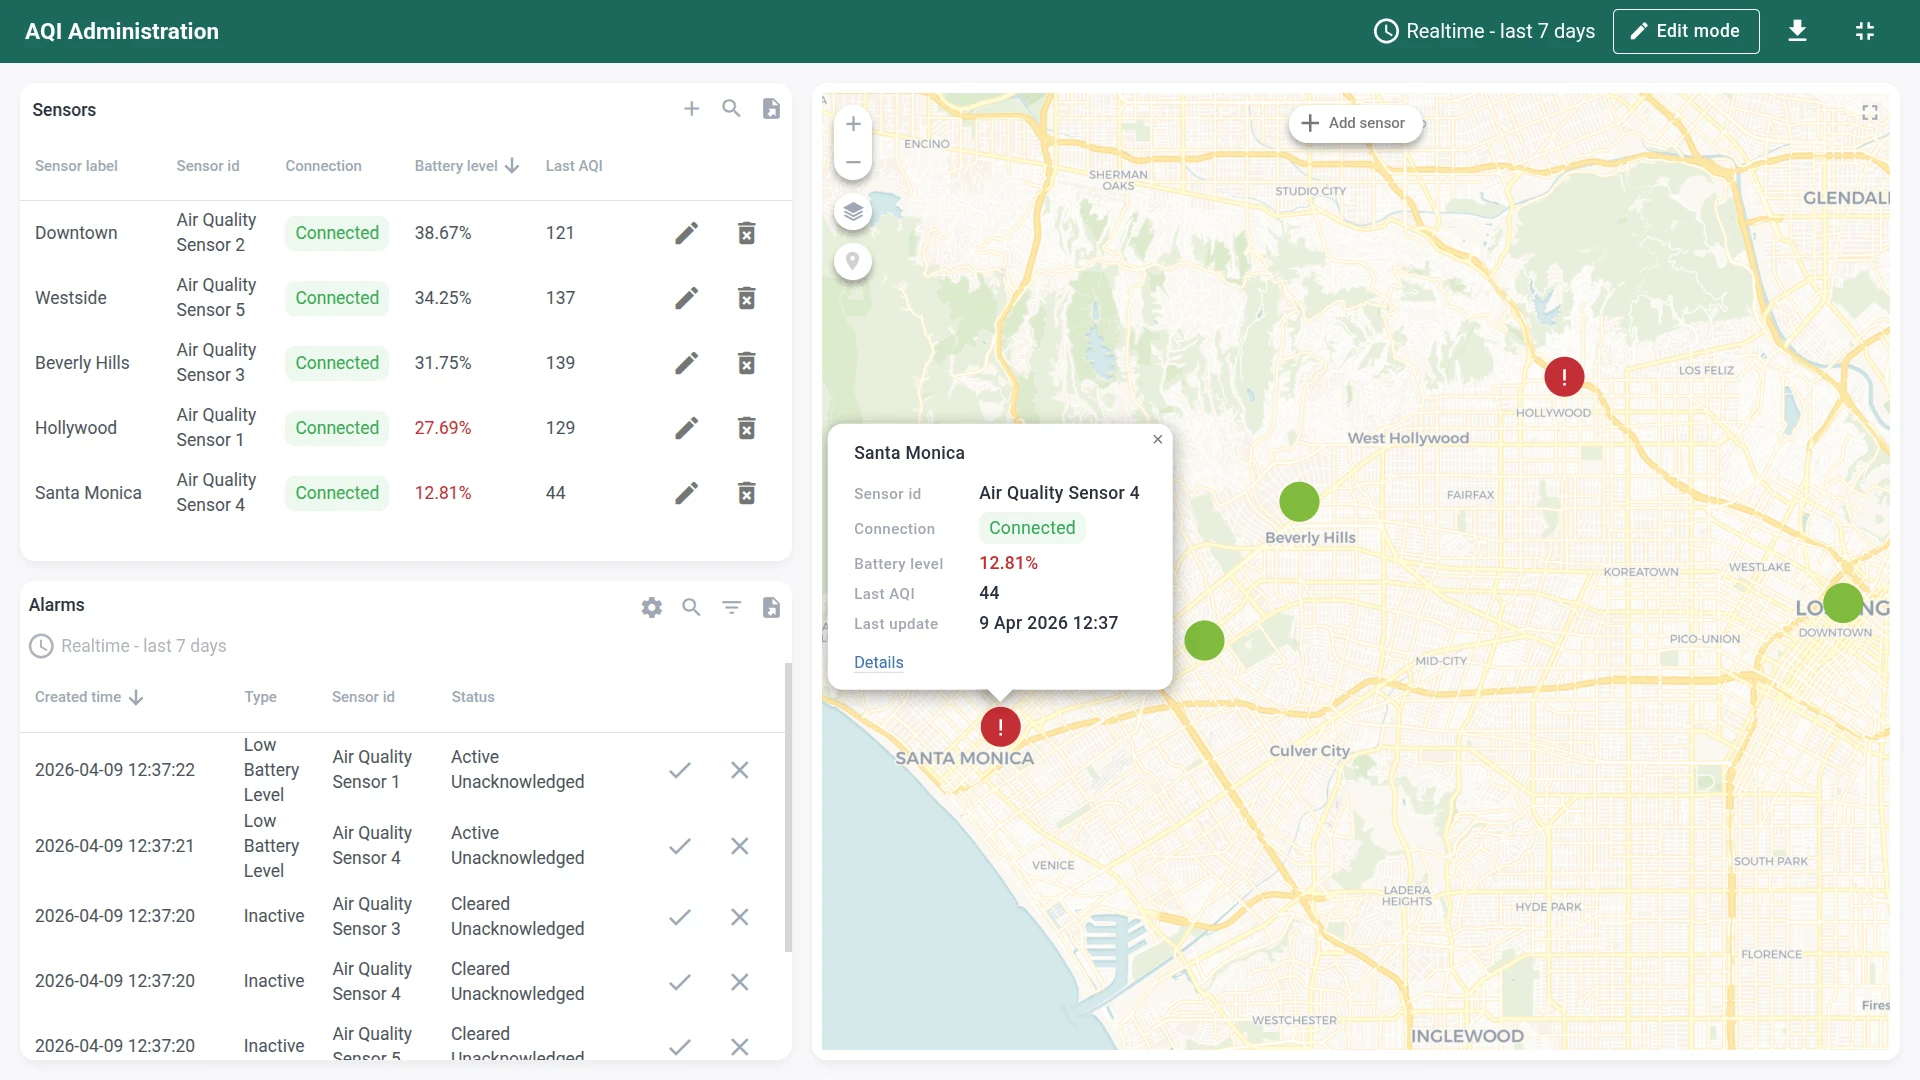
Main state
- Sensors list: A table displaying the technical status of every device — sensor label, connection status (connected/disconnected), battery level, and last AQI reading. Use the icons to edit or delete sensors, or provision new devices using the + button
- Alarms console: A real-time log of all active and cleared alerts. Click the settings icon to configure global thresholds like minimum battery level or connection loss timeout
- Interactive map: Visualizes the physical location and status of your AQI sensors. Markers are color-coded: red for active alarms, green for normal, gray for no data. Click + Add sensor to provision a new device and place it on the map
Sensor state (drill down)
Click a sensor row in the table or the Details link in a map marker popup to access deep diagnostics for a single sensor.
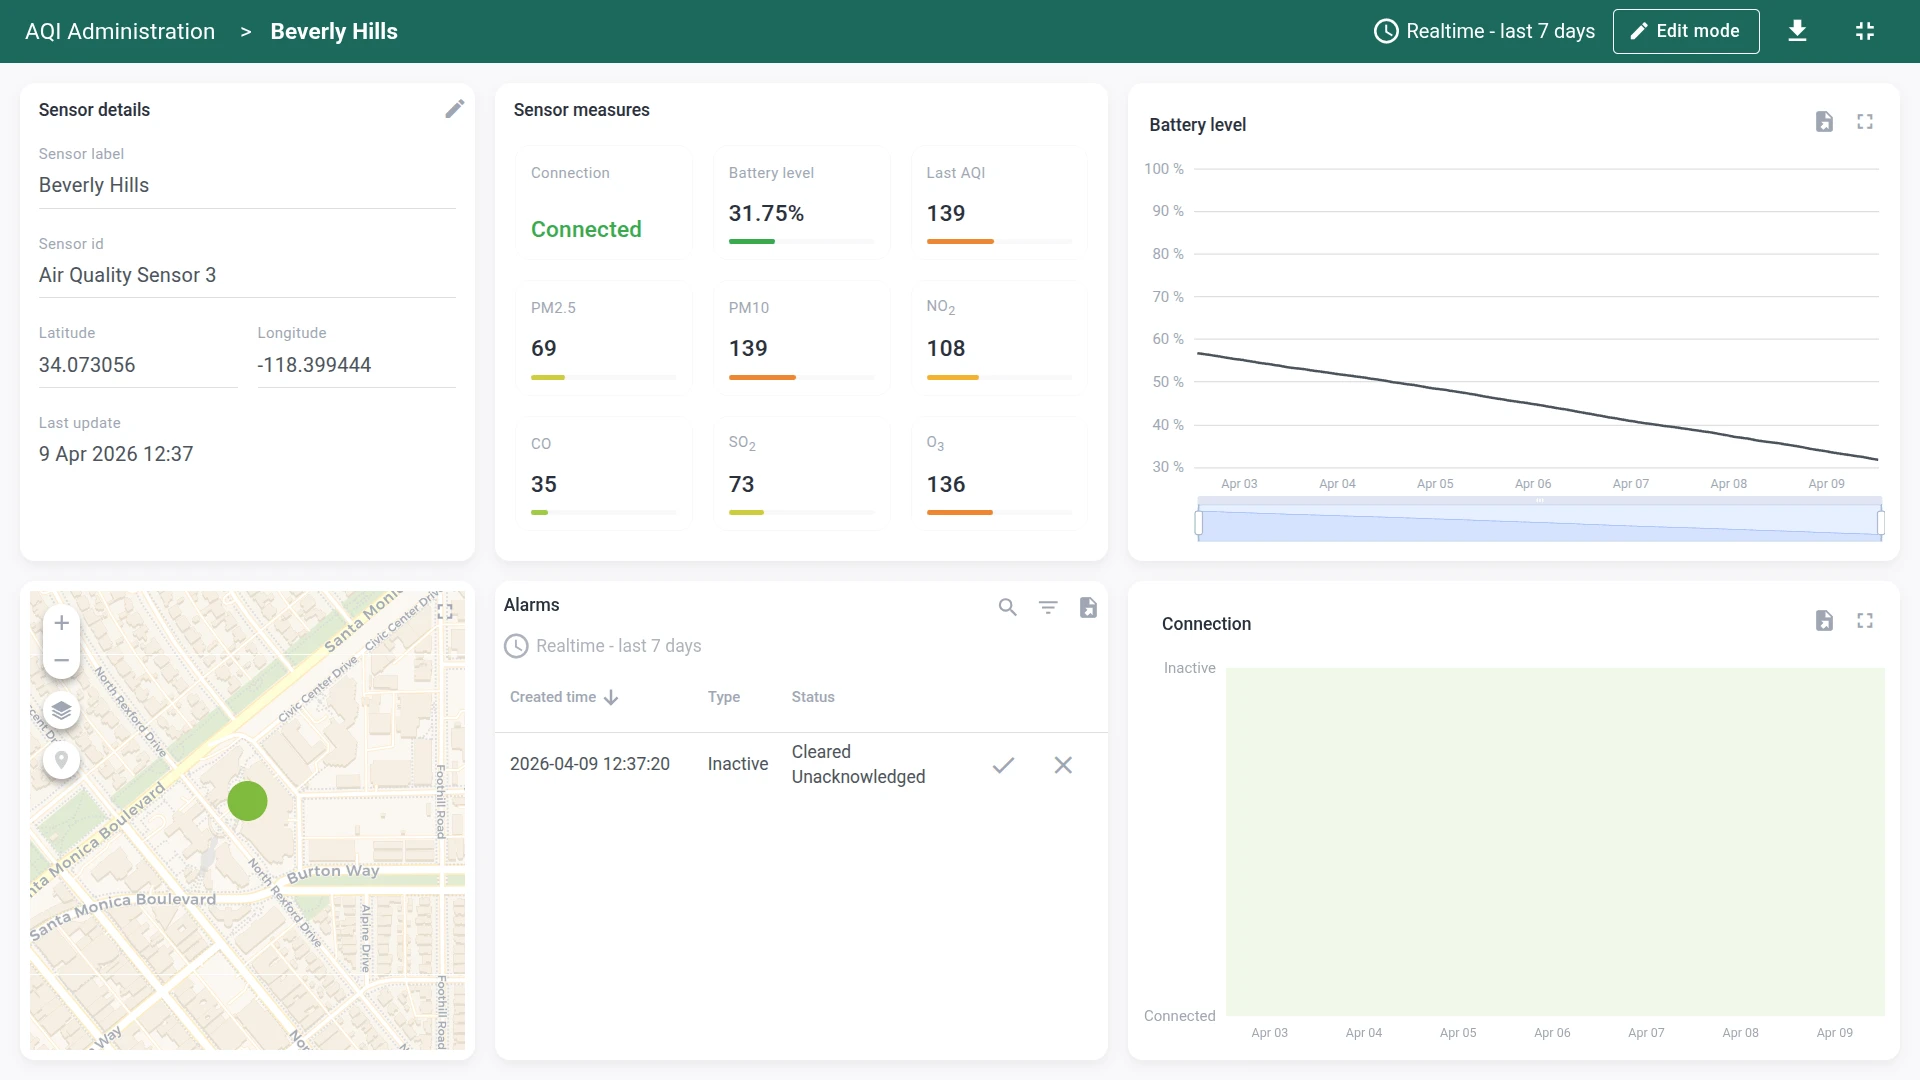
- Diagnostics: Detailed charts for battery level history and connection status uptime
- Telemetry: A live stream of all incoming data points (PM2.5, CO, NO2, etc.)
- Location management: An embedded map allowing you to drag-and-drop the sensor to update its coordinates
- Device alarms: A filtered list showing only the alarms relevant to this specific sensor
The dashboards can be fully customized using the dashboard development tools.
Devices
Section titled “Devices”Five demo air quality sensor devices are created automatically with demo data.
The solution expects devices to publish telemetry data in JSON format using the following keys:
{ "temperature": 42, "humidity": 73, "pm25": 24.4, "pm10": 30, "no2": 13, "co": 2.8, "so2": 7, "o3": 0.164, "batteryLevel": 77}Replace $ACCESS_TOKEN with the actual access token of the device you want to send data to:
curl -v -X POST \-d '{"temperature": 42, "humidity": 73, "pm25": 24.4, "pm10": 30, "no2": 13, "co": 2.8, "so2": 7, "o3": 0.164, "batteryLevel": 77}' \http://thingsboard.cloud/api/v1/$ACCESS_TOKEN/telemetry \--header "Content-Type:application/json"The example uses the HTTP API. Other connectivity options (MQTT, CoAP, LwM2M, etc.) are supported as well. See connecting devices for details.
Alarms
Section titled “Alarms”Alarm generation is handled by alarm rules configured in the AQI Sensor device profile. The solution monitors low battery level and device inactivity conditions.
The low battery alarm uses a dynamic threshold (batteryLevelThreshold device attribute). You can toggle alarms on/off and adjust thresholds from the administration dashboard using the settings icon in the alarms section.
Calculated fields
Section titled “Calculated fields”The solution uses four calculated fields:
- AQI calculation: A script that identifies the highest pollutant concentration among O3, PM2.5, PM10, CO, SO2, and NO2 and converts it to a standardized Air Quality Index value using EPA breakpoint tables
- AQI sensor aggregation: A related entities aggregation that computes city-level AQI metrics from individual sensor readings
- Save activity status: A script that tracks whether a sensor is actively reporting data, used by the “Inactive” alarm rule
- Propagate thresholds to AQI sensors: A propagation calculated field that pushes alarm threshold settings from the city asset down to individual sensor devices
Conclusion
Section titled “Conclusion”The Air quality monitoring solution template delivers a dual-dashboard system for tracking pollution levels with automatic AQI computation, configurable alarms, and sensor fleet management. It enables fast onboarding and serves as a foundation for both demonstrations and production air quality monitoring use cases.
Was this helpful?