Water metering
The Water metering solution template represents a generic water metering solution. With this template you get interactive dashboards that allow administrators and end users to browse the state of water meters and aggregated water consumption statistics. Users can define thresholds and enable alarms and notifications over SMS or email.
The system includes a tenant dashboard for managing the entire meter network and customer base, and a user dashboard for end-users to monitor their consumption. Calculated fields aggregate raw meter pulses into daily and weekly consumption values.
Key application areas
Section titled “Key application areas”This solution template can be used as a baseline for:
- Municipal utilities: Automating meter reading and providing citizens with a transparency portal for usage monitoring
- Commercial real estate: Implementing sub-metering for tenant units in shopping malls or office parks
- Industrial facilities: Monitoring water usage in manufacturing to detect inefficiencies or leaks
Install solution template
Section titled “Install solution template”To understand how the Water metering solution works, start by installing the solution template.
- Go to Solution templates in the main menu.
- Find Water metering and click Install.
- Follow the provided configuration instructions and click Close.
- The Water Metering dashboard opens automatically.
After installation, a fully functional water metering simulation is created automatically. No devices, integrations, or custom code are required to start exploring the solution.
System components
Section titled “System components”The Water metering solution includes:
- Dashboards: A tenant dashboard (Water Metering Tenant Dashboard) for managing the entire meter network and a user dashboard (Water Metering User Dashboard) for end-users to monitor their consumption
- Devices: Three pre-provisioned water meter devices populated with demo historical data
- Device profile: A predefined Water Meter device profile with calculated fields for consumption aggregation and pre-configured alarm rules for leakage detection, consumption thresholds, low battery, low temperature, and device inactivity
- Asset profiles: City and Location asset profiles with calculated fields that aggregate consumption metrics up the hierarchy (Device → Location → City → Tenant)
- Rule chains: Three rule chains for telemetry processing and alarm notification routing via SMS and email
- Customers and users: Demo customers with automatically generated user accounts and role-based access control
Edge support. The solution can optionally be deployed to ThingsBoard Edge for local data processing and reduced latency. Edge is available as an add-on for your license or subscription. The edge computing instructions appear in the solution instructions dialog when the Edge add-on is active.
Dashboards
Section titled “Dashboards”The solution creates two dashboards: a tenant dashboard for managing the entire hierarchy and a user dashboard for end-users.
Tenant dashboard
Section titled “Tenant dashboard”The tenant dashboard provides a full management interface for monitoring water meters, analyzing consumption, managing customers, and configuring alarms.
The tenant dashboard consists of multiple views:
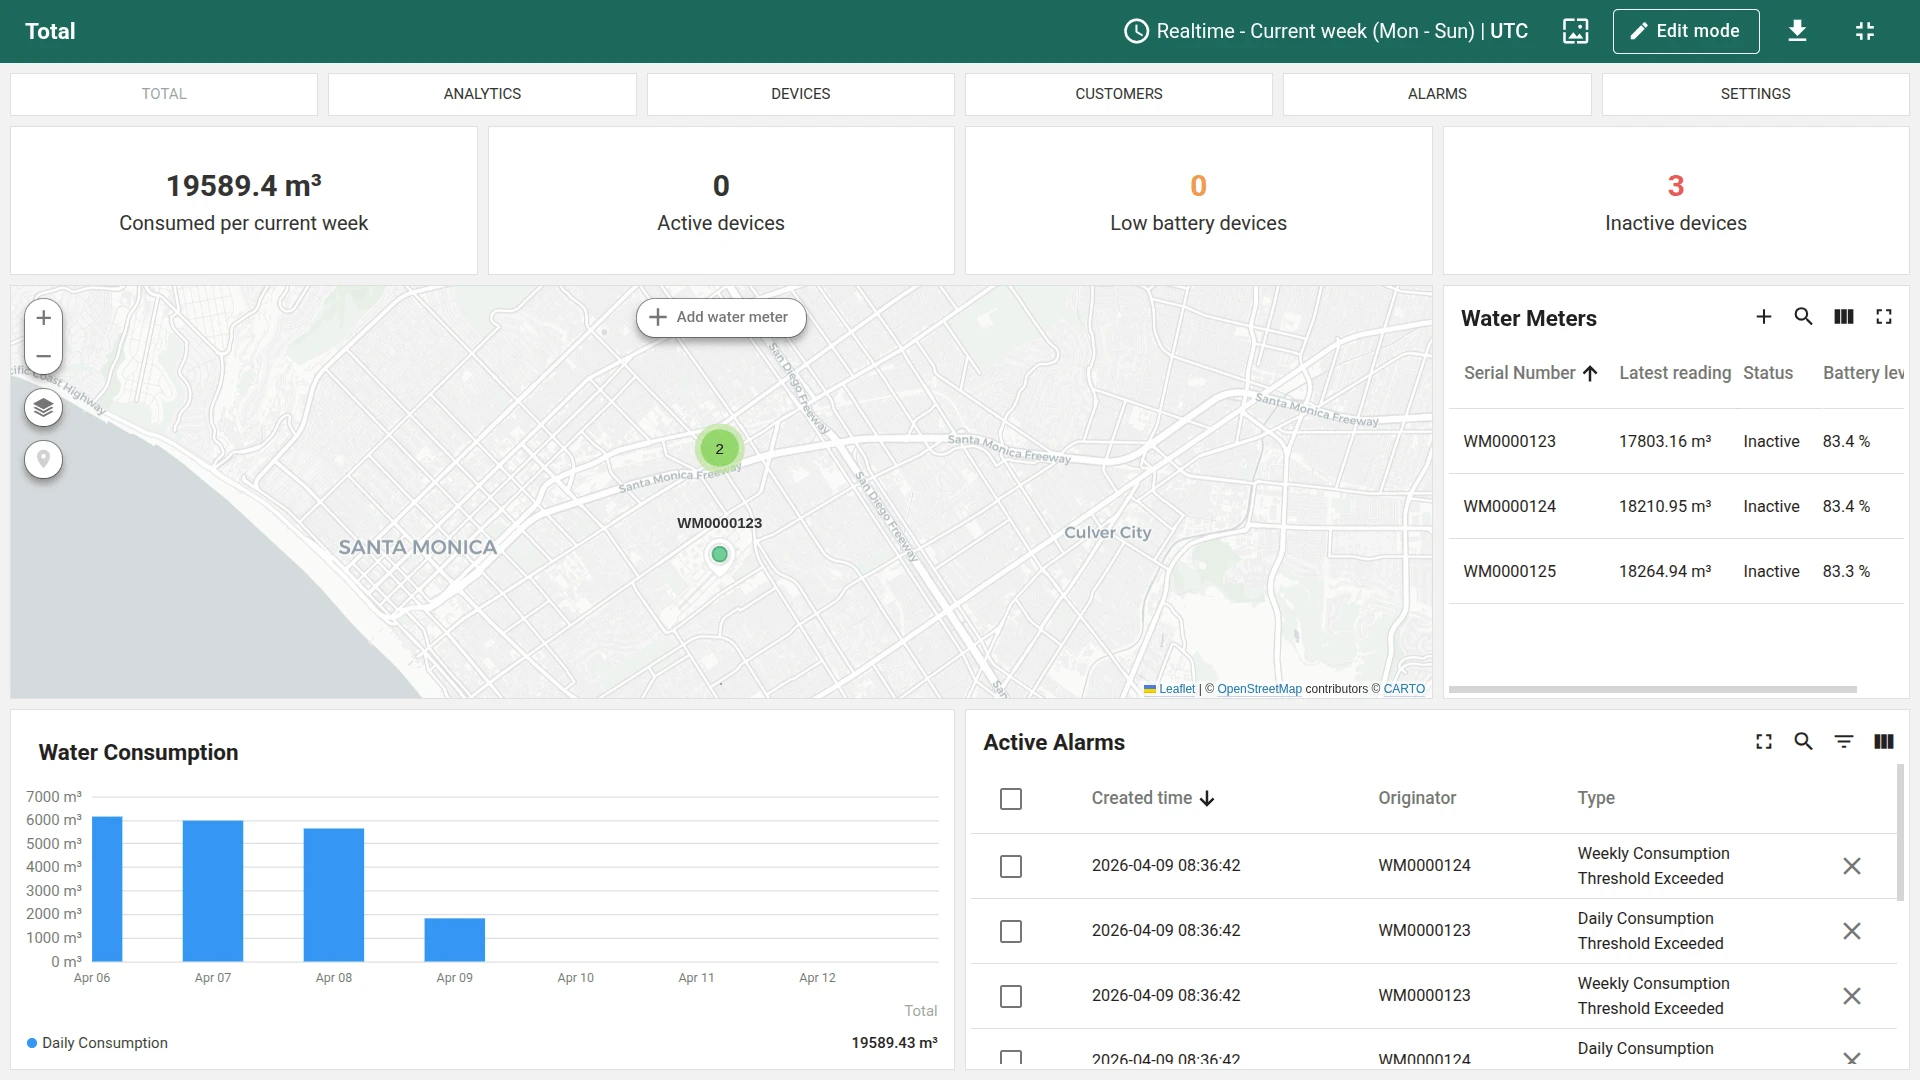
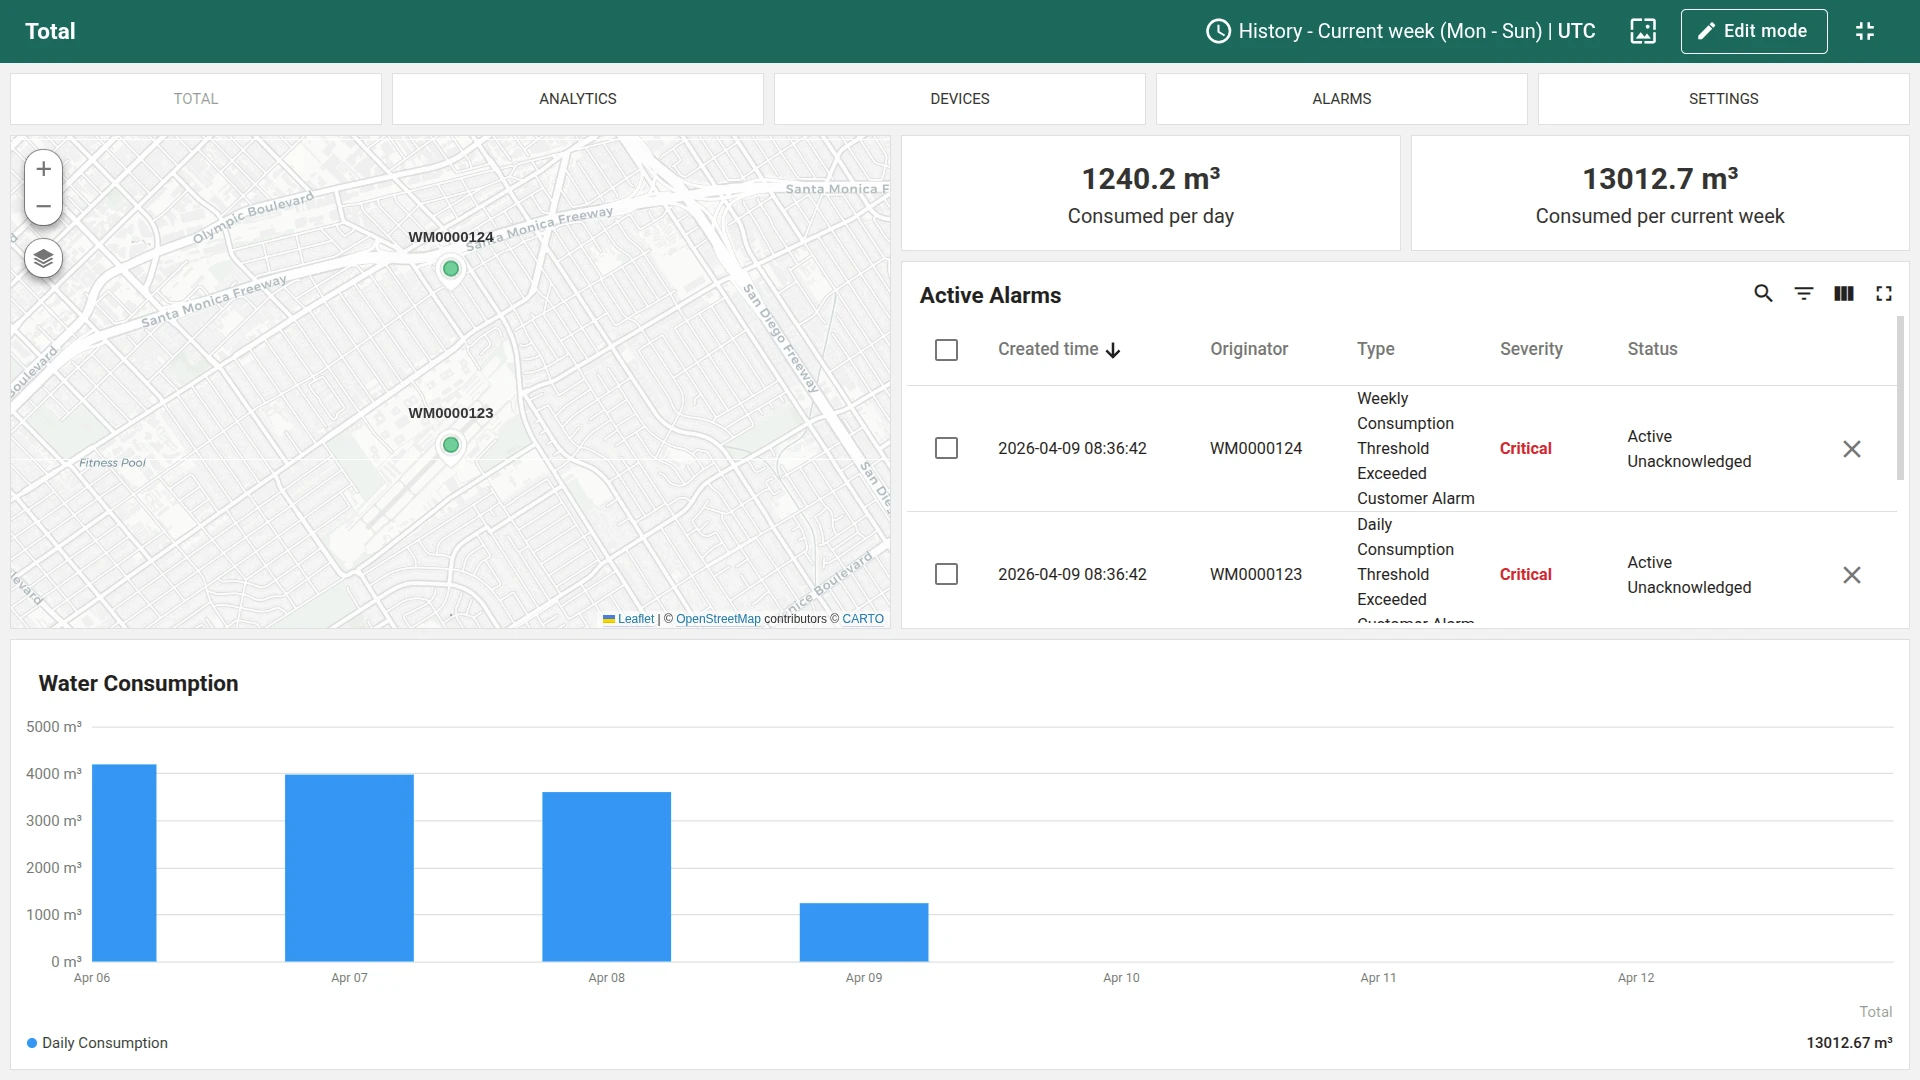
- Total (overview): KPI cards showing total consumption, active alarms, and meter count. A clustered map displays all water meters with an Add water meter button for provisioning new devices. Includes a consumption chart and active alarms list
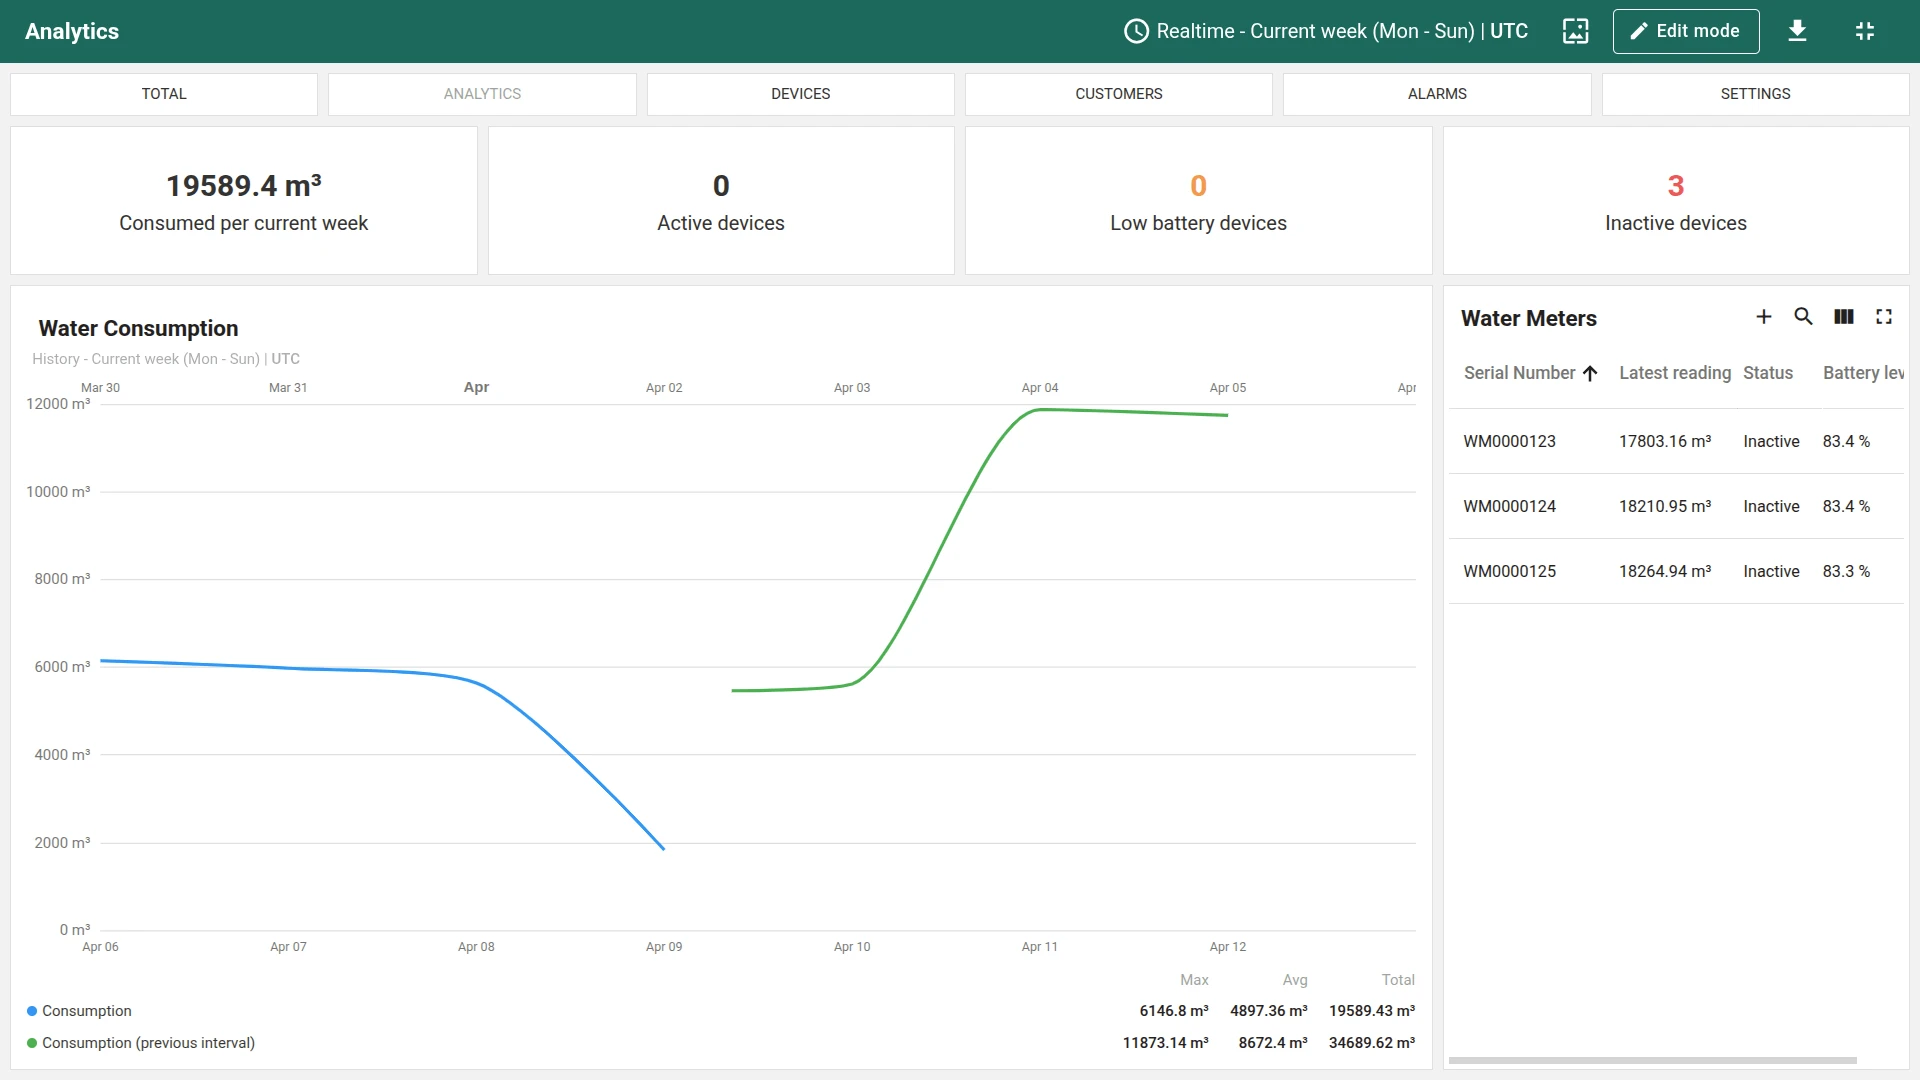
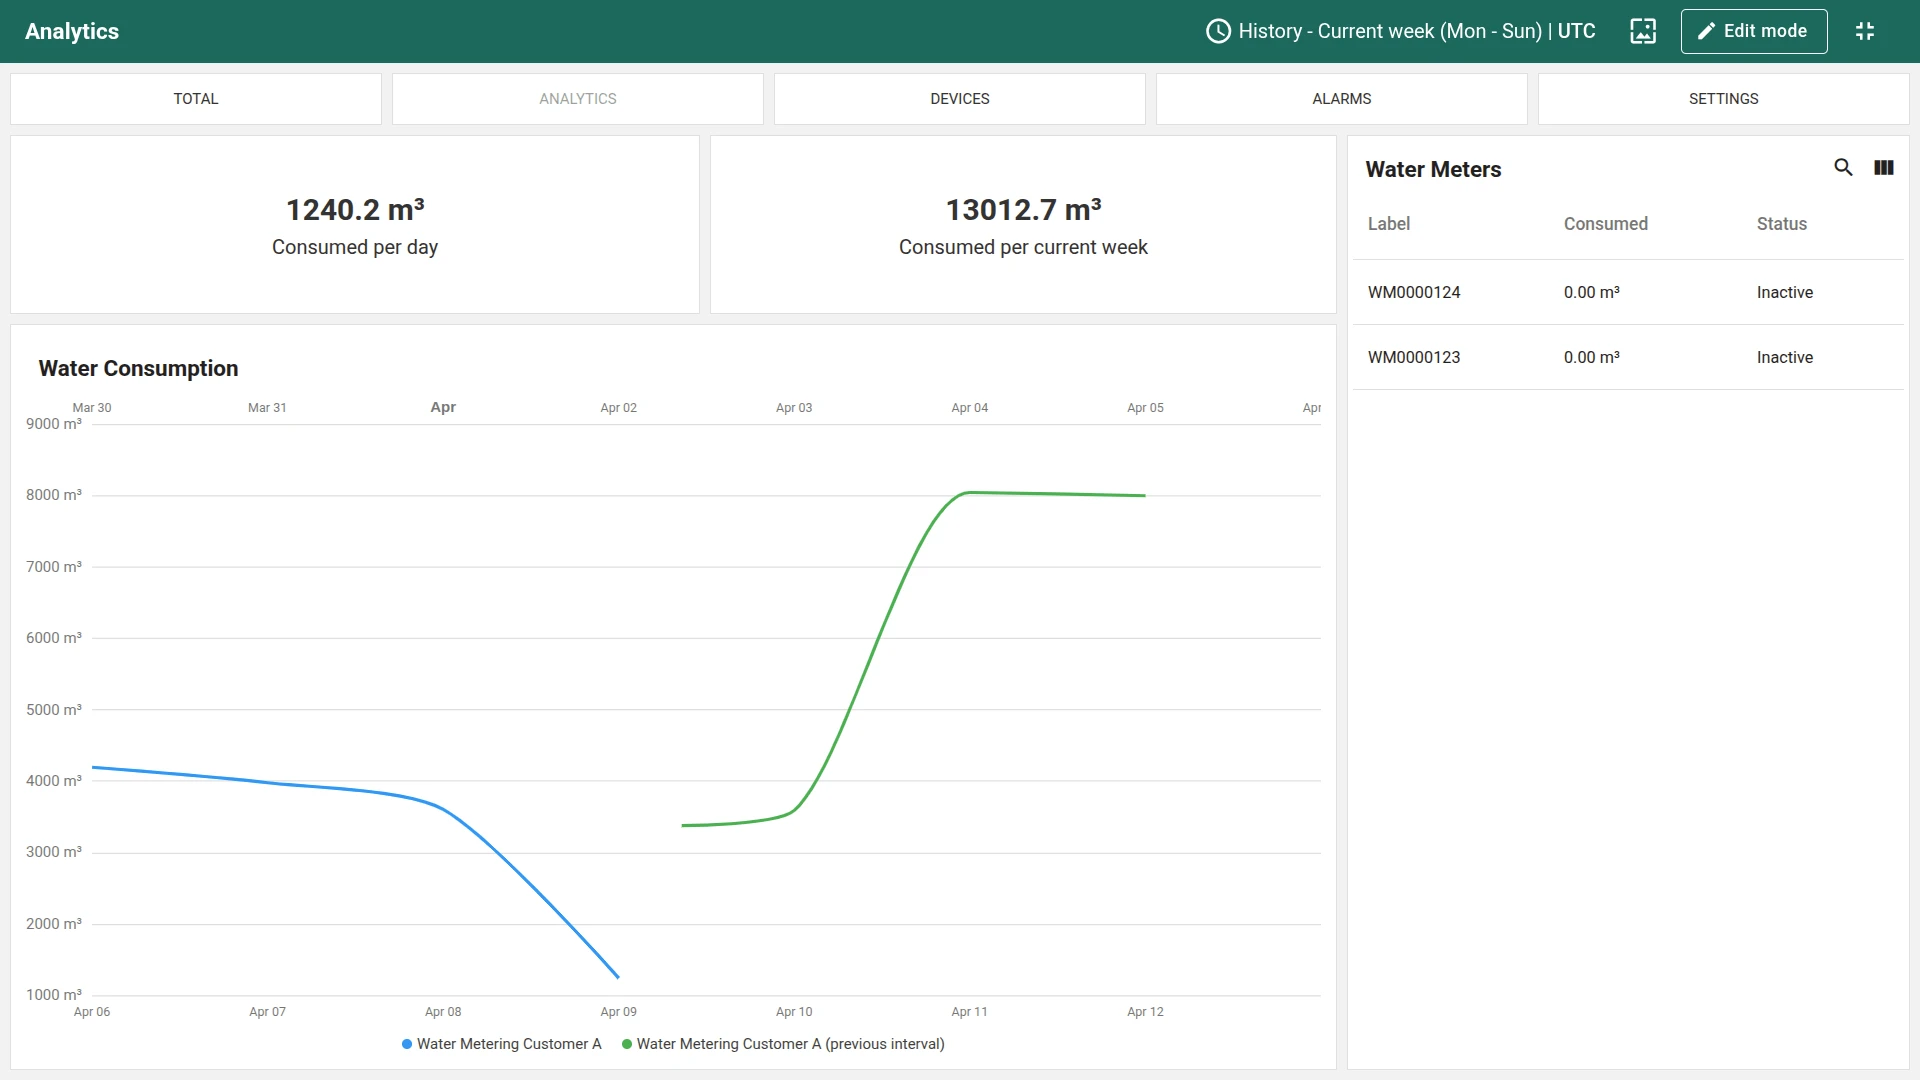
- Analytics: Detailed consumption comparison between current and previous intervals (daily and weekly)
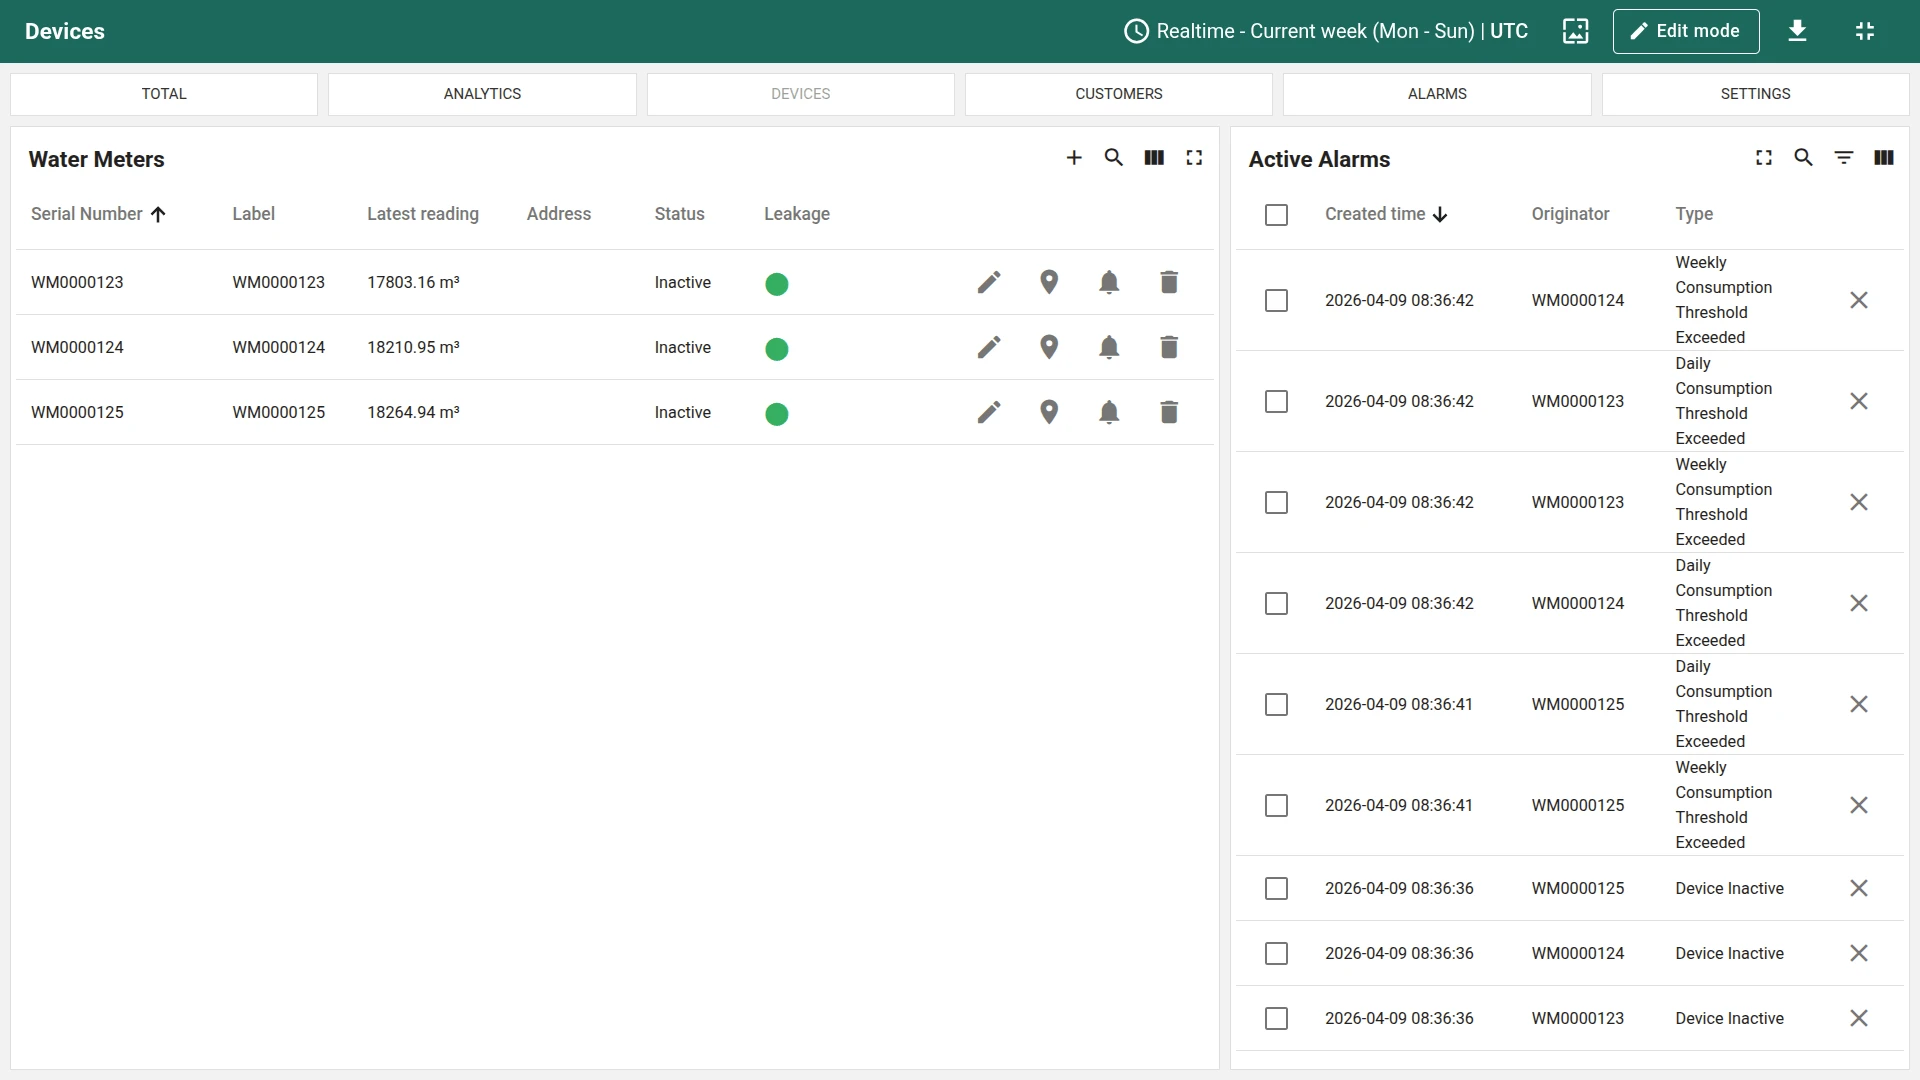
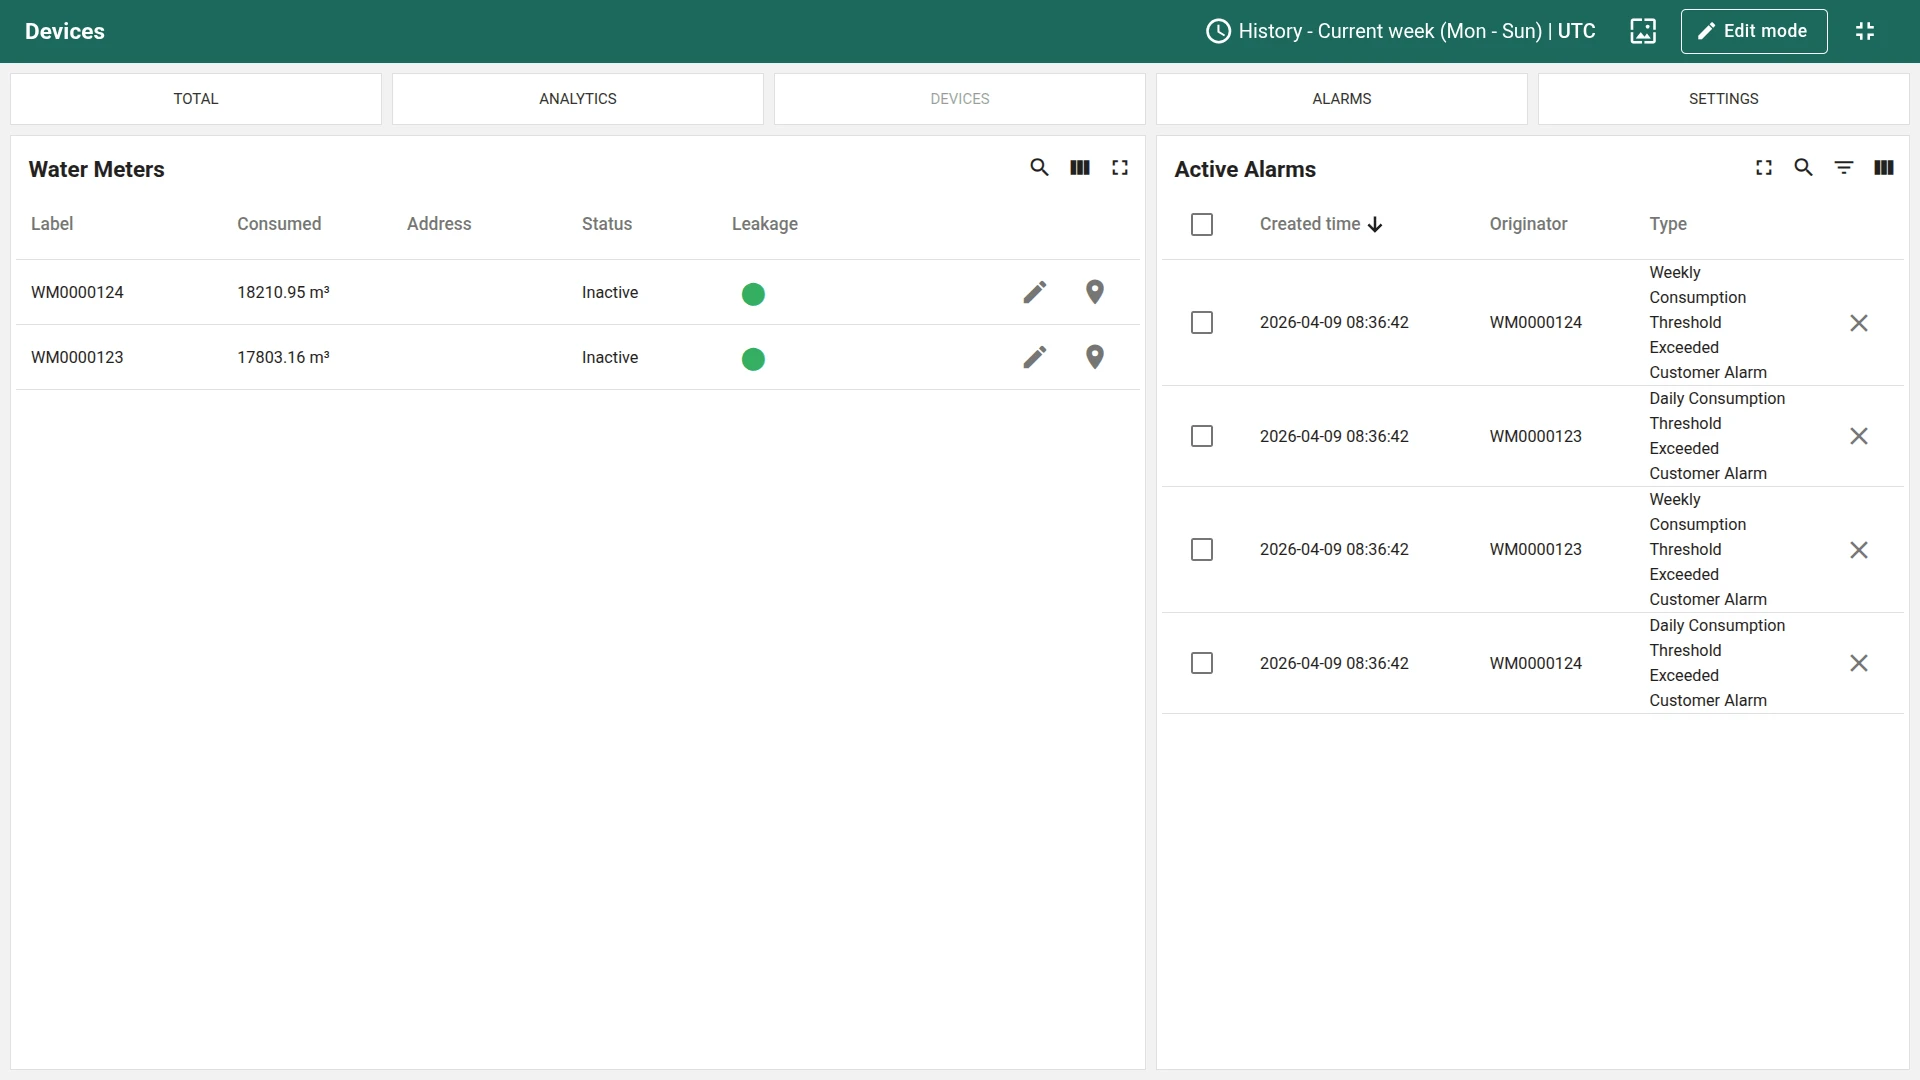
- Devices: Meter table with serial number, latest reading, address, connection status, and leakage indicator. Use this view to create new devices, assign them to customers, and configure alarm thresholds
- Device details: Water consumption history, active alarms, meter location and photo, and device configuration. Navigate here by clicking a meter row in the Devices view
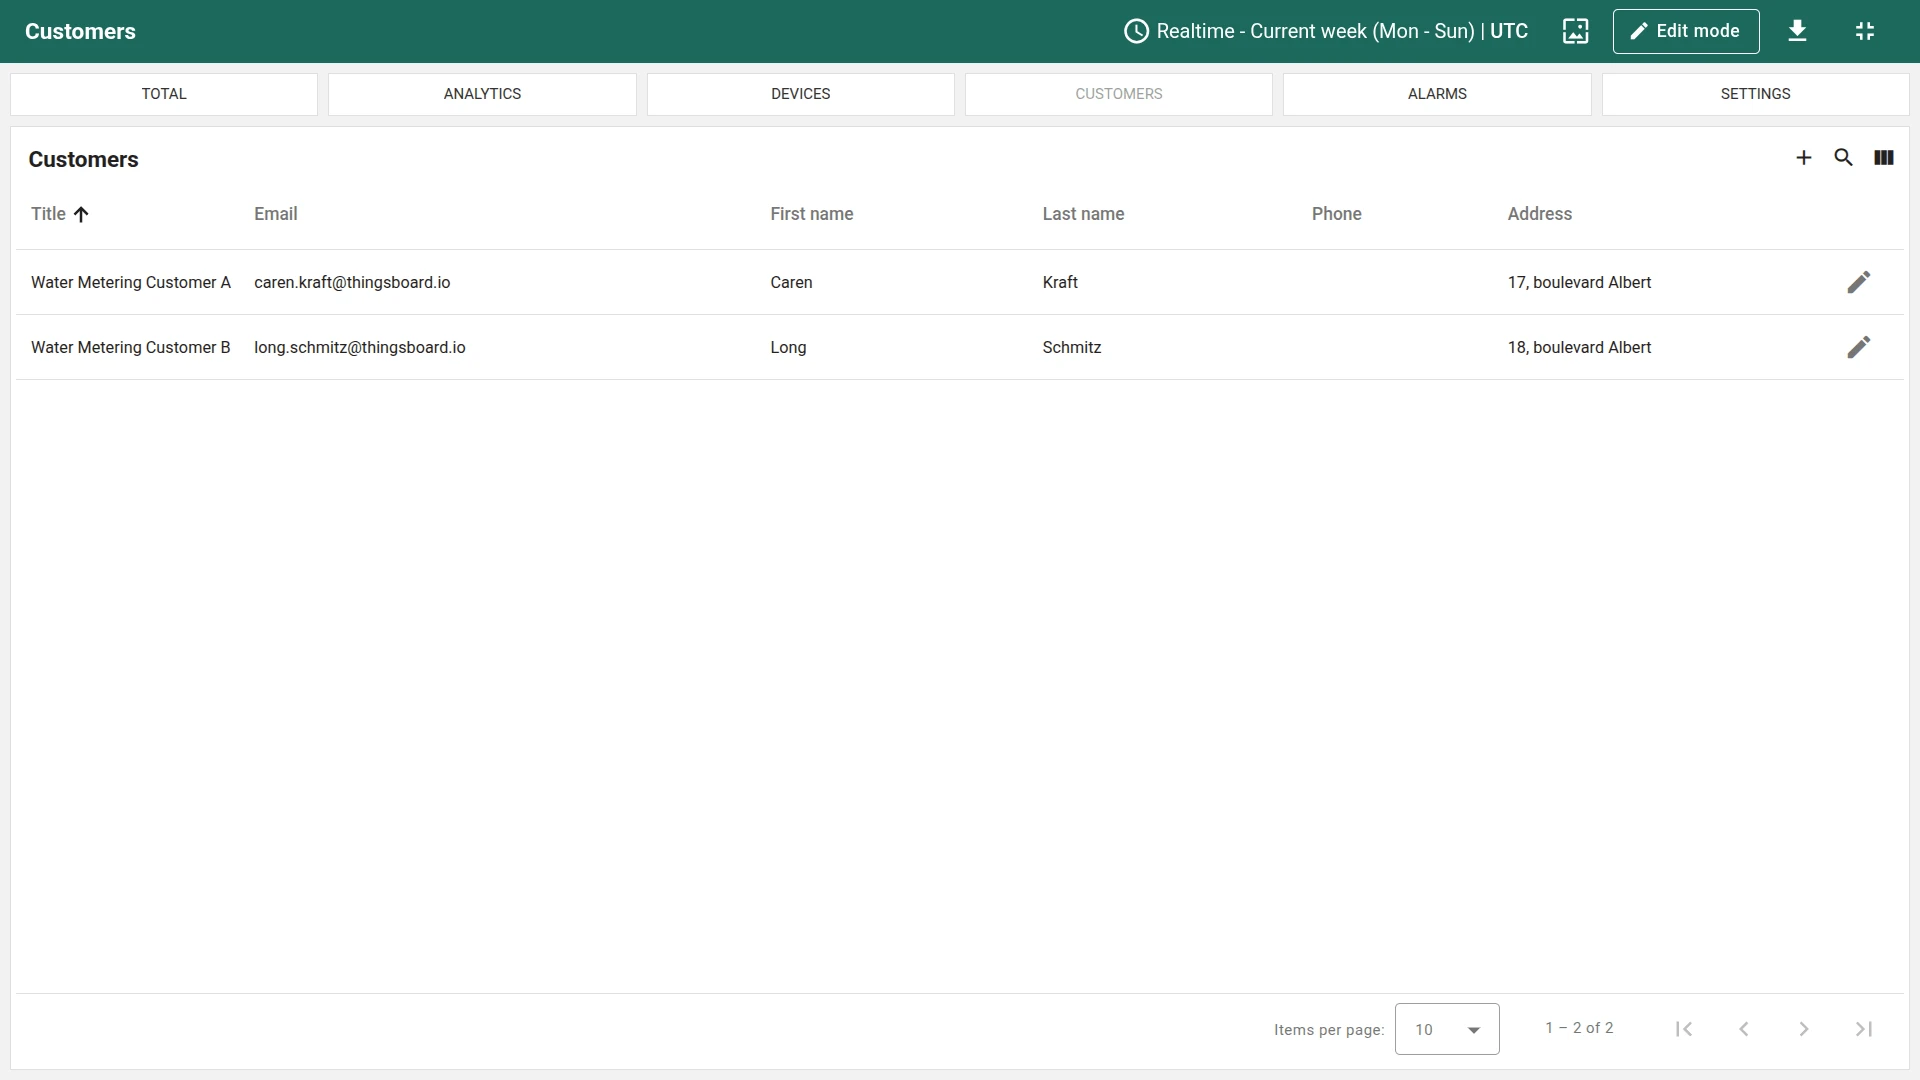
- Customers: Manage customers and their assigned water meters
- Users: Add tenant administrators that receive notifications about alarms
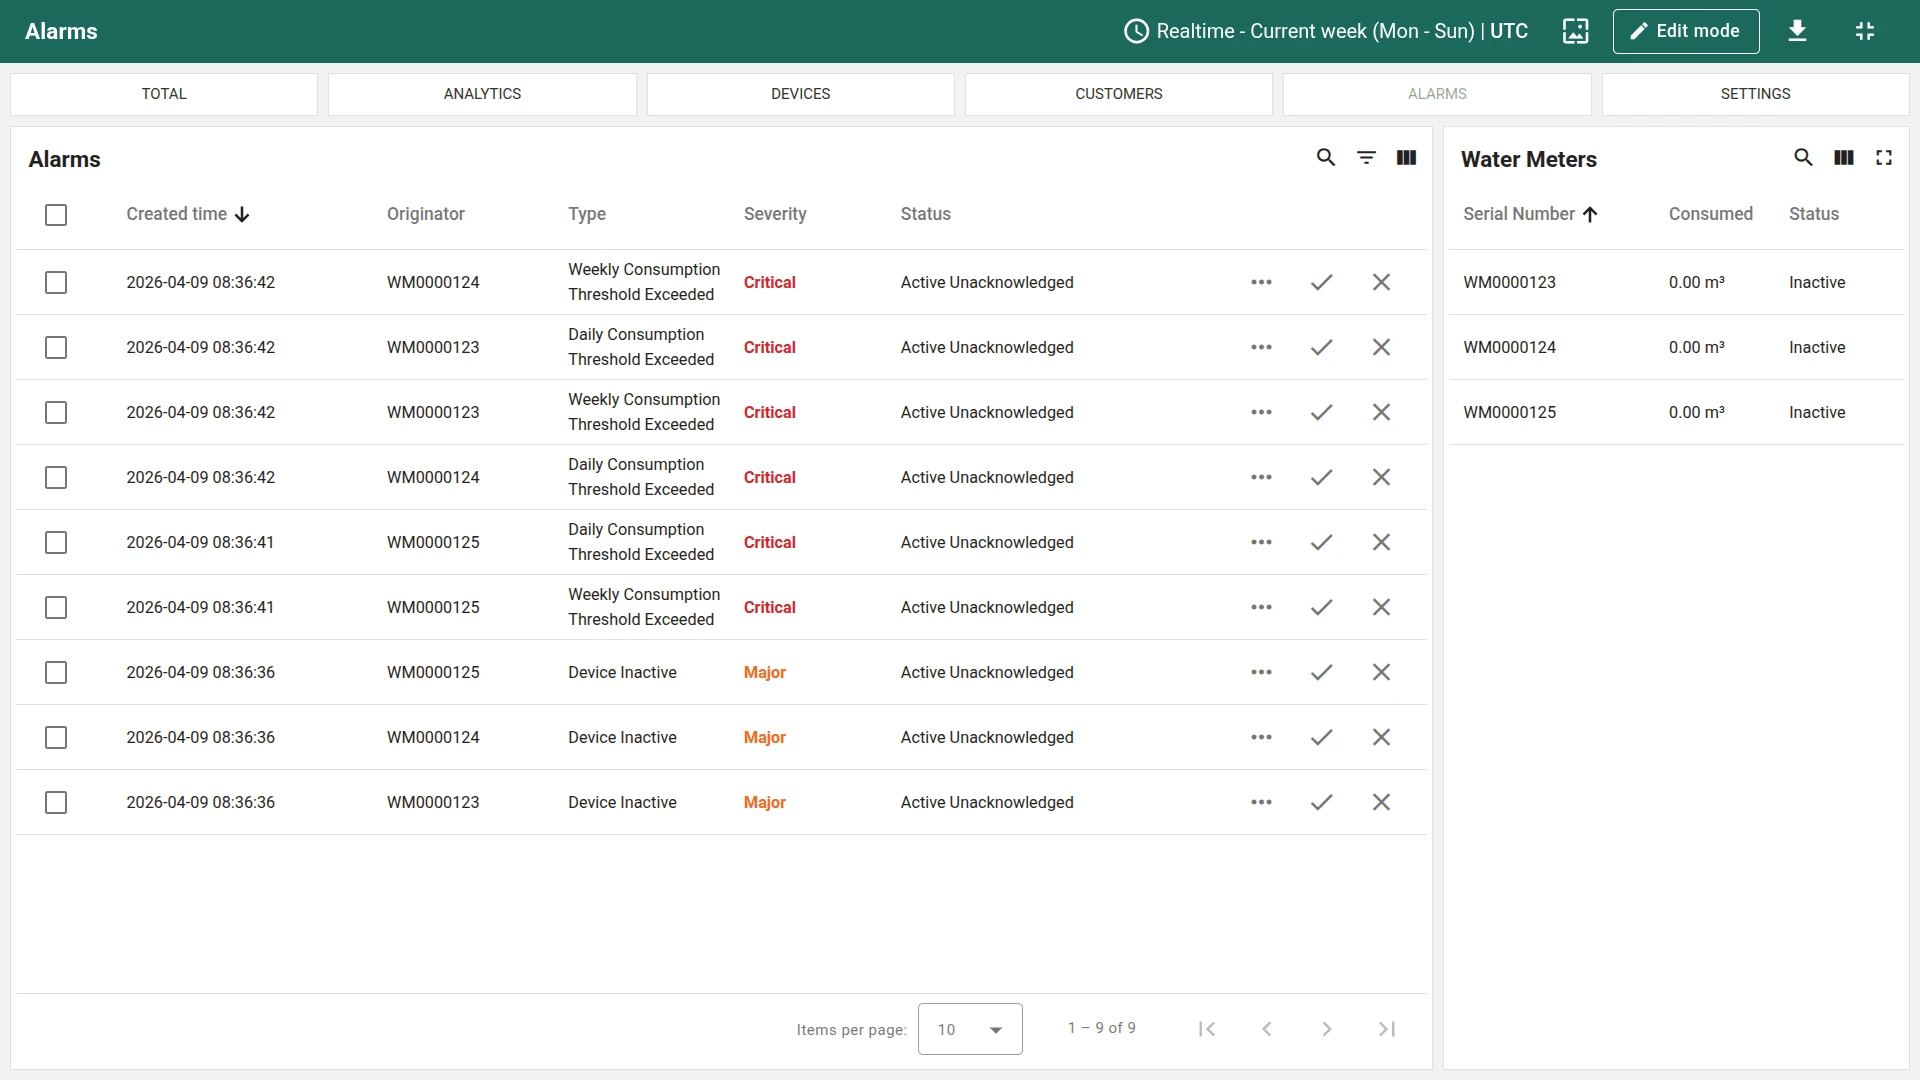
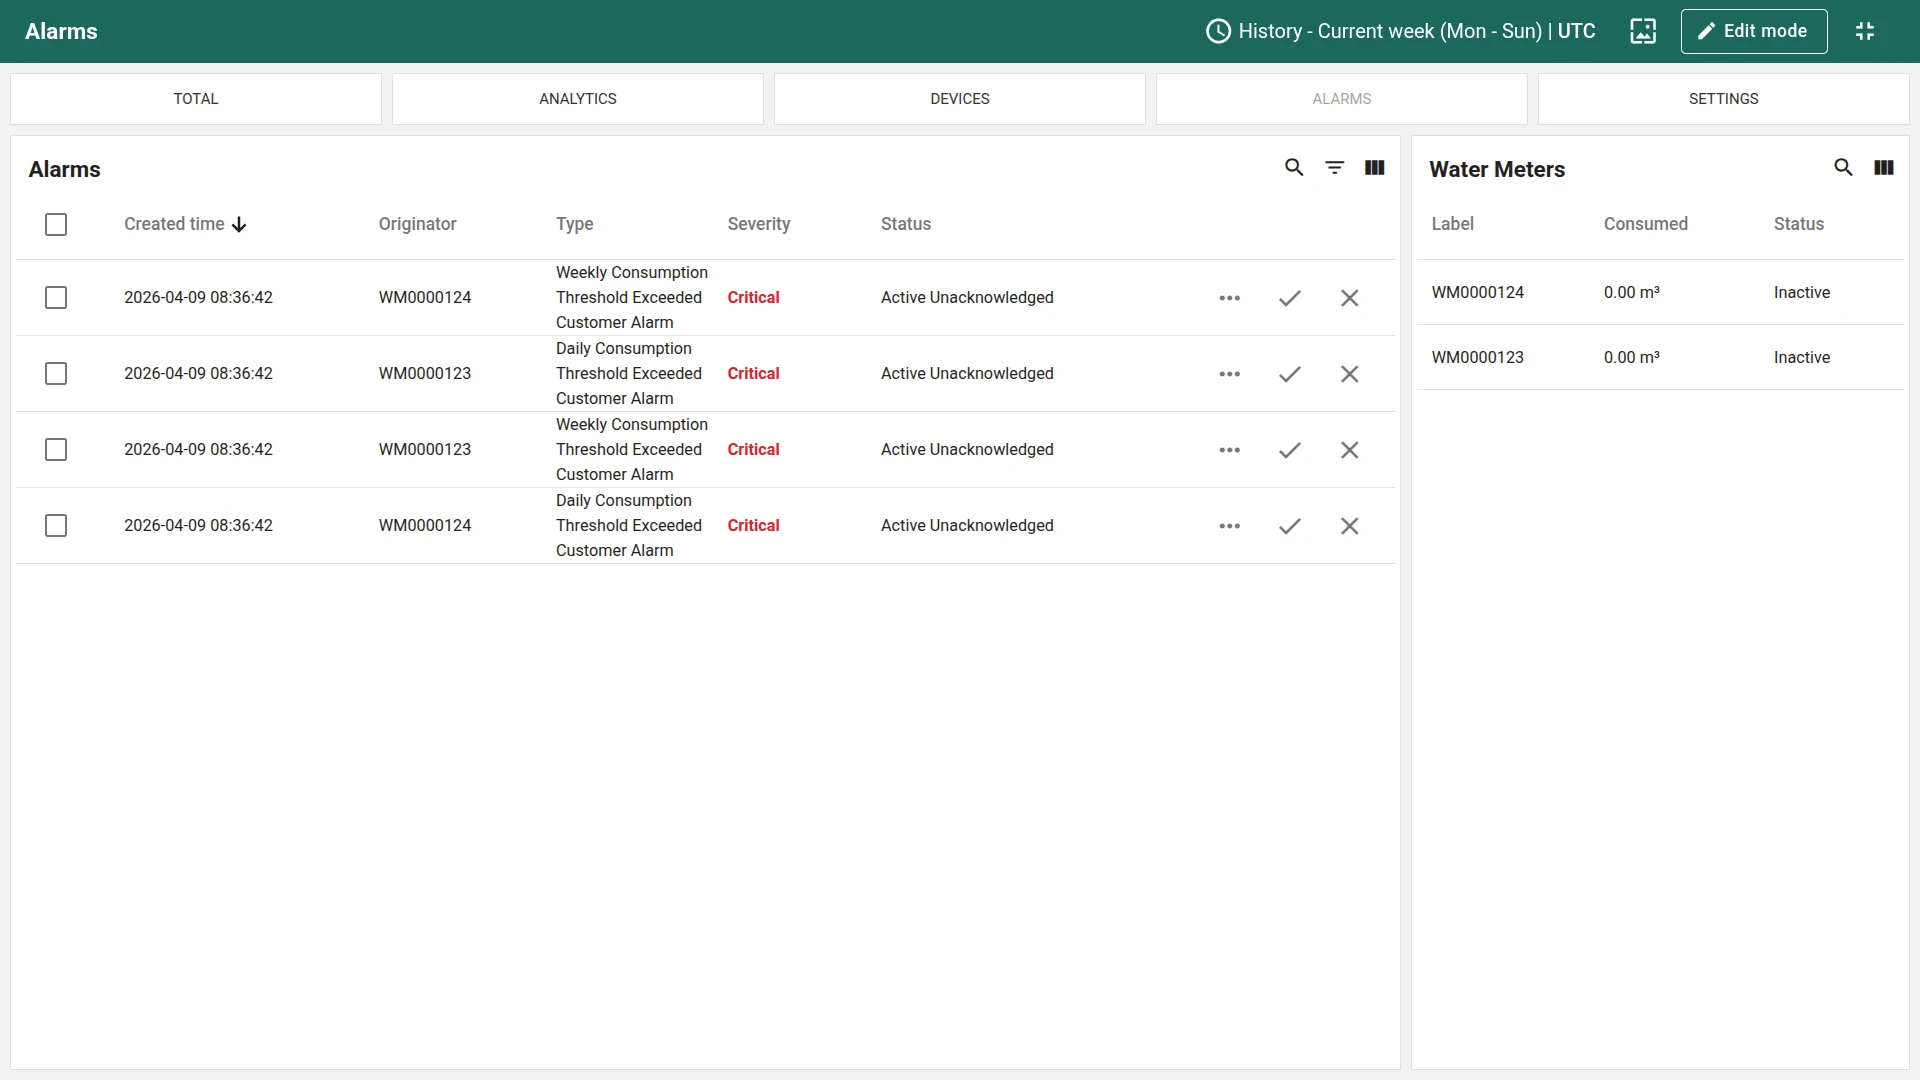
- Alarms: Browse and clear alarms from water meters
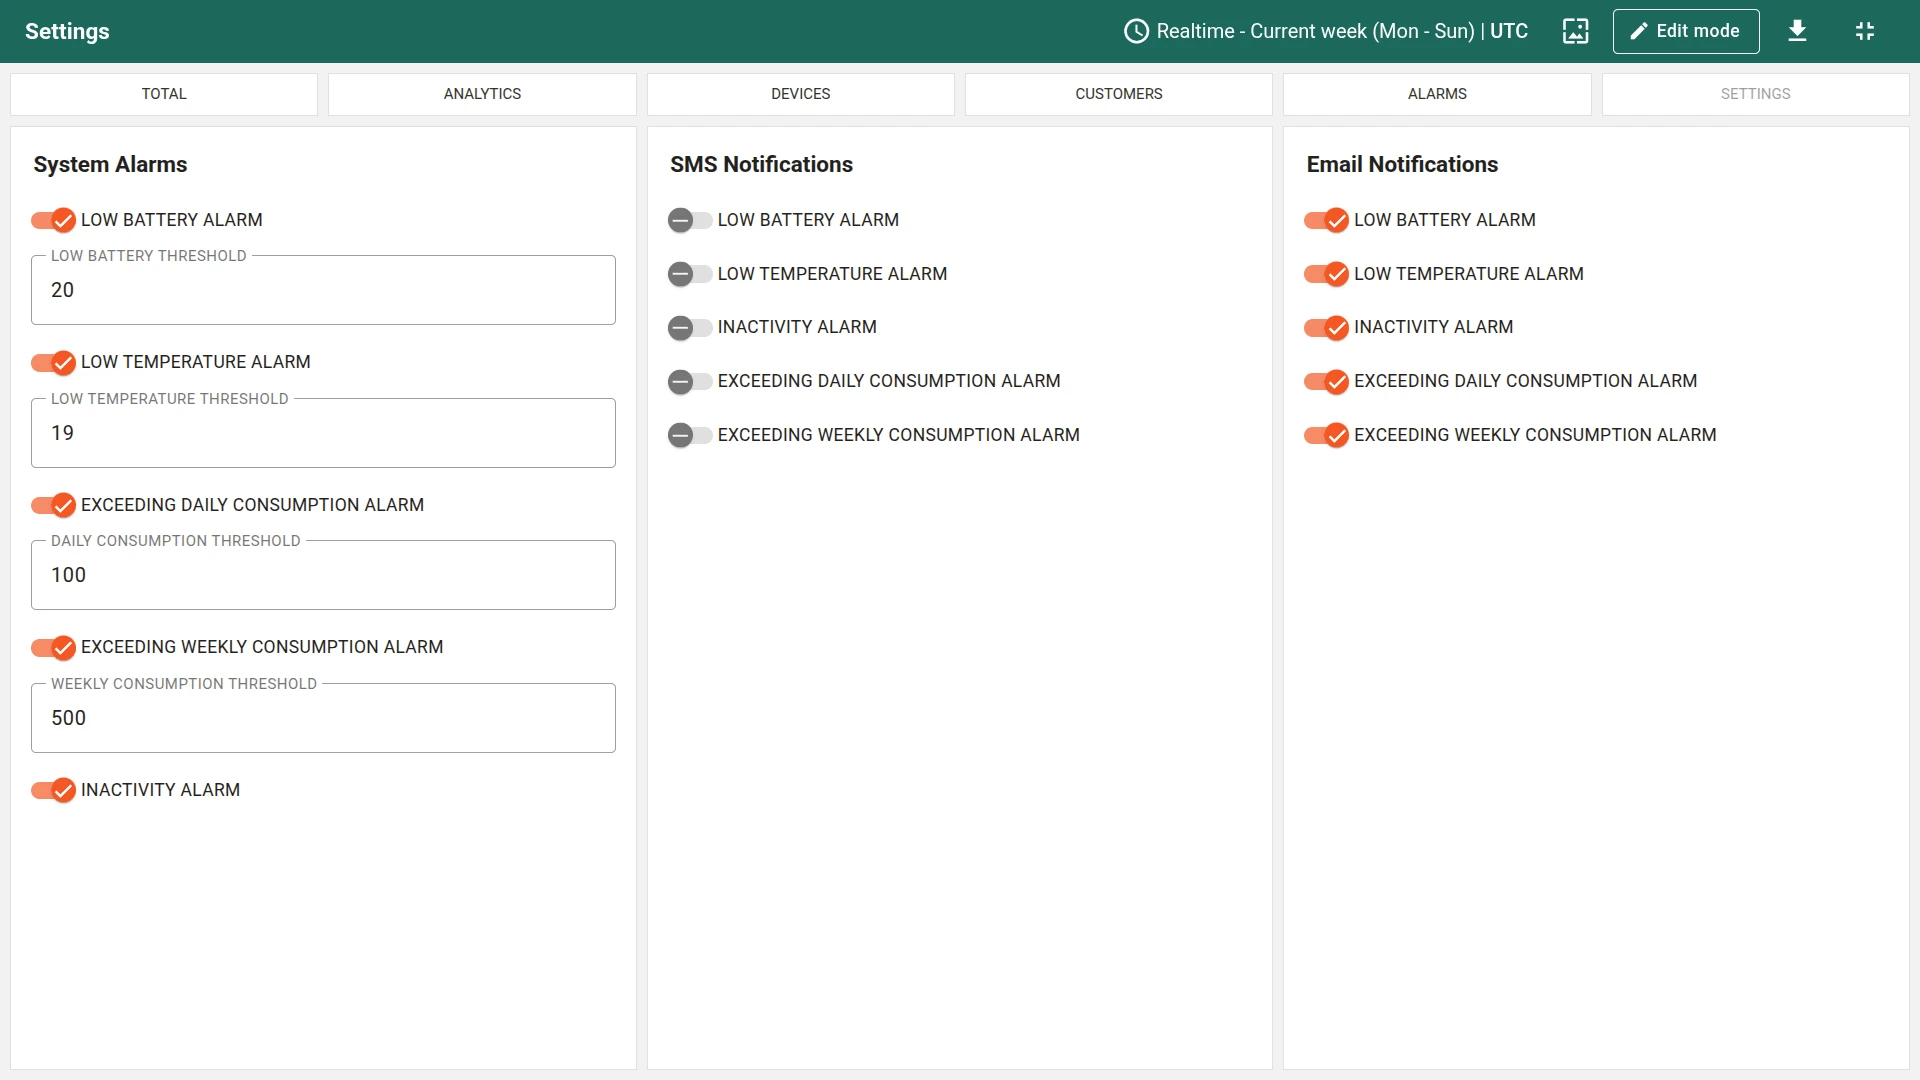
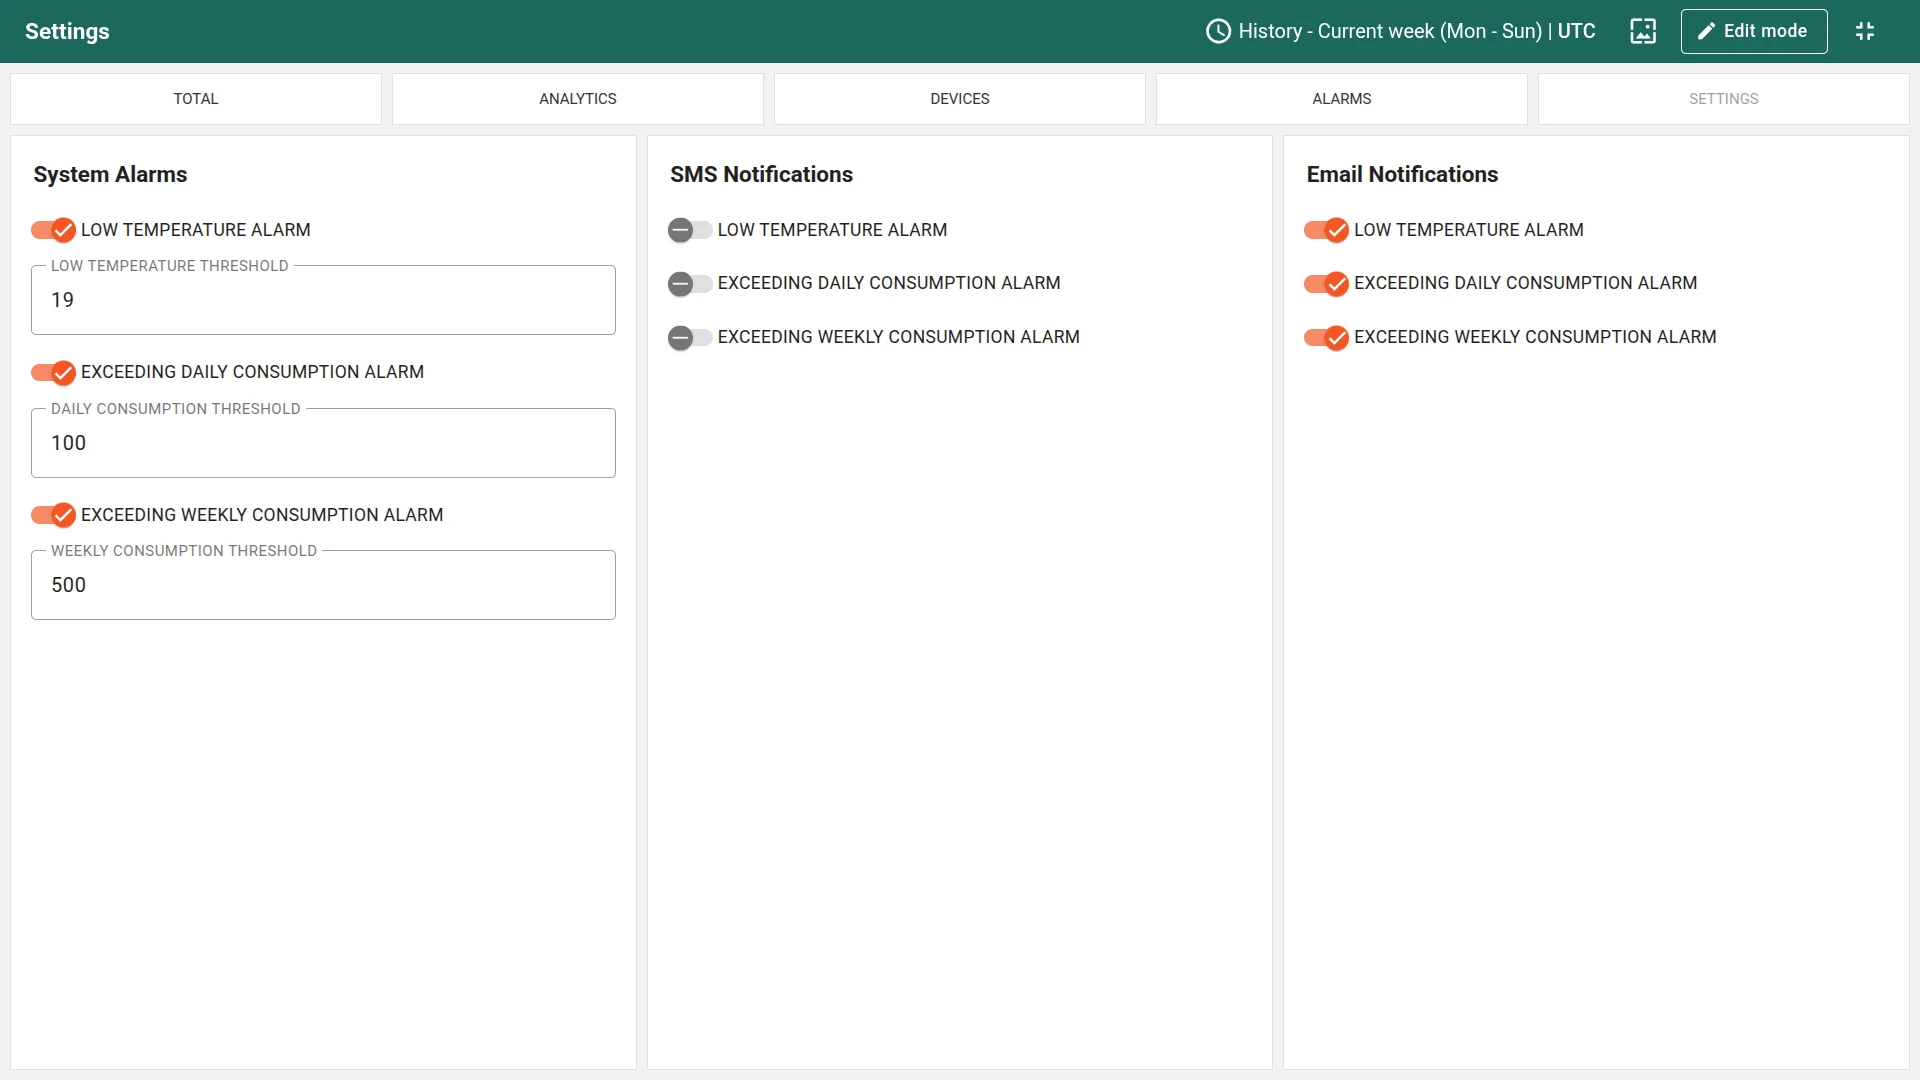
- Settings: Turn system alarms on and off, define thresholds, and configure SMS and email notifications
User dashboard
Section titled “User dashboard”The user dashboard is visually similar to the tenant dashboard but with restricted permissions and data scoped to the customer’s assigned devices. It has four views:
- Total (customer view): Consumption KPIs (consumed per day, consumed per current week) and a read-only map showing only the customer’s meters. The Add water meter button is not available
- Analytics: Compare current usage against previous periods to track consumption efficiency
- Devices (read-only): View the list of assigned meters with status and consumption. Add and delete actions are removed; only edit label and locate actions are available
- Device details: Click a meter row to open the details state with consumption history, meter details, raw data readings, and location
- Settings (restricted): Toggle alarms and adjust thresholds for Low Temperature, Daily Consumption, and Weekly Consumption. Device health alarms (Low Battery, Inactivity) are managed by the tenant and not visible to customer users. Customers can also toggle SMS or email notifications for their available alarms
The dashboards can be fully customized using the dashboard development tools.
Devices
Section titled “Devices”Three demo water meter devices are created automatically with demo data.
The solution expects devices to publish telemetry data in JSON format using the following keys:
{ "pulseCounter": 1234, "temperature": 42, "battery": 85, "leakage": false}Replace $ACCESS_TOKEN with the actual access token of the device you want to send data to:
curl -v -X POST \-d '{"pulseCounter": 1234, "temperature": 42, "battery": 85, "leakage": false}' \http://THINGSBOARD_HOST_NAME/api/v1/$ACCESS_TOKEN/telemetry \--header "Content-Type:application/json"The example uses the HTTP API. Other connectivity options (MQTT, CoAP, LwM2M, etc.) are supported as well. Most water meters use LoRaWAN, Sigfox, or NB-IoT technology. See connecting devices for details.
Alarms
Section titled “Alarms”Alarm generation is handled by alarm rules configured in the Water Meter device profile. The solution includes nine alarm rules that cover both operational monitoring (tenant-level) and customer-facing alerts. Alarm notifications are sent via SMS or email through dedicated notification rule chains.
The alarm rules are organized into tenant-level and customer-level pairs. Tenant alarms notify administrators about infrastructure issues, while customer alarms notify end-users about consumption and environmental conditions at their locations.
- Leakage (Critical) — the “Leakage Detected” alarm triggers when telemetry indicates an active leak
- Consumption thresholds (Critical) — “Daily Consumption Threshold Exceeded” and “Weekly Consumption Threshold Exceeded” each have a tenant-level and a customer-level variant with separate thresholds
- Low Battery (Warning) — triggers when battery level drops below the configured threshold
- Low Temperature (Warning) — tenant-level and customer-level variants for detecting freezing conditions
- Device Inactive (Major) — triggers when no data is received within the configured inactivity period
All alarm thresholds are dynamic, referencing device or tenant attributes rather than static values. You can toggle alarms on/off and adjust thresholds directly from the dashboard using the Settings view.
Rule chains
Section titled “Rule chains”The solution uses three rule chains to process telemetry data and route alarm notifications:
- Water Metering Solution Main: Processes incoming telemetry from water meters, saves attributes and time series data, and forwards alarm messages to the notification rule chains
- Water Metering Solution Tenant Alarm Routing: Forwards notifications via email or SMS to all tenant administrators for operational alarms (Leakage Detected, Device Inactive, Low Battery, Low Temperature)
- Water Metering Solution Customer Alarm Routing: Forwards notifications via email or SMS to all customer users for consumption and temperature alarms (Daily/Weekly Consumption Threshold Exceeded, Low Temperature)
Calculated fields
Section titled “Calculated fields”The solution uses 11 calculated fields across three profiles to aggregate raw pulse counter data into consumption metrics. The data flows up the asset hierarchy: Device → Location → City → Tenant.
Meter-level consumption
Each water meter reports a cumulative pulse counter. The “Calculate consumption” script extracts the reading delta by comparing consecutive pulse counter values. Two entity aggregation fields, “Calculate water meter daily consumption” and “Calculate water meter weekly consumption”, sum these deltas into daily and weekly totals for each meter.
Location-level aggregation
Each location groups the water meters at a customer’s property. Two related entities aggregation fields, “Calculate location daily consumption” and “Calculate location weekly consumption”, sum consumption from all meters at the location. Two propagation fields then push these values to the owning customer, so customer users can see their total consumption on the user dashboard.
City-level aggregation
The city asset sits at the top of the hierarchy and follows the same pattern. Two related entities aggregation fields sum consumption from all locations in the city, and two propagation fields push the city-level daily and weekly totals to the tenant for the overview dashboard.
Customers
Section titled “Customers”To demonstrate multi-tenancy and data isolation, the solution creates sample customers with assigned water meters. Customer users have access to the Water Metering User Dashboard and can only see devices owned by their customer. You can find the generated user credentials in the solution instructions.
Additional customers and users can be created via the administration UI. The solution also creates a shared dashboard group so that all customer users can browse (but not edit) the user dashboard. See advanced RBAC for more information.
Conclusion
Section titled “Conclusion”The Water metering solution template delivers a utility monitoring system with real-time visualization, automated consumption aggregation across a City → Location → Device hierarchy, nine configurable alarm rules with SMS and email notifications via dedicated rule chains, and built-in multi-tenant access control. It enables fast onboarding and serves as a foundation for both demonstrations and production water metering use cases.
Was this helpful?