Alarms Table
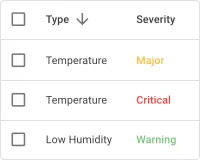
The Alarms table widget displays a real-time list of alarms for one or more entities — each row showing originator, type, severity, status, and assignee — and updates automatically as alarm states change. Use it as the primary alarm monitoring panel on any dashboard where operators need to triage, acknowledge, clear, and assign alarms without leaving the dashboard.
Key Capabilities
Section titled “Key Capabilities”- Monitor alarms from a single device or across multiple entities simultaneously using an entity alias.
- Filter by status, severity, type, or assignee — filters can be combined.
- Per-row controls: acknowledge, clear, and assign alarms directly from the table without leaving the dashboard.
- Configurable columns: add, remove, reorder, and apply custom JS cell style or content functions.
- Propagated alarm support: child entity alarms (like a device alarm surfacing on its parent asset) can be included.
- Toolbar controls: search, alarm filter, column visibility toggle, data export, and fullscreen.
Adding the Widget
Section titled “Adding the Widget”- In dashboard edit mode, click Add widget in the top toolbar, or click the Add new widget icon in the center of an empty dashboard.
- In the widget bundle selection dialog, find and click Alarm widgets.
- Select the Alarms table widget.
- Configure the alarm source, filters, and appearance, then click Add.
Configuration
Section titled “Configuration”All settings in this section use Basic mode — a quick-start configuration covering the essentials. For finer widget controls like title font, card style, and tooltip, switch to the Advanced tab.
Time Window
Section titled “Time Window”Set the time range for which alarms are displayed, like Realtime – last 30 days or a fixed date interval. A widget can use its own time window or inherit the dashboard’s global value. Learn more in the Time Window guide.
Alarm Source
Section titled “Alarm Source”Select the entity or alias that alarms are loaded from:
- Device — a specific device; shows only alarms originating from this device.
- Entity alias — a set of entities matched by an entity alias; use this to monitor alarms across multiple devices or assets at once.
Filter
Section titled “Filter”The Filter section controls which alarms appear in the table. Multiple criteria can be combined.
| Filter | Description |
|---|---|
| Alarm status list | Show only alarms with the selected statuses: Active, Cleared, Acknowledged, Unacknowledged. |
| Alarm severity list | Show only alarms at the selected severity levels: Critical, Major, Minor, Warning, Indeterminate. |
| Alarm type list | Restrict display to selected alarm types, like High temperature or Device offline. The list is populated from alarm types present in the system. |
| Assignee | Show only alarms assigned to a specific user. |
| Search propagated alarms | When enabled, includes alarms propagated from child entities, like a device alarm surfacing on its parent asset. |
Columns
Section titled “Columns”The Columns section defines the alarm fields shown as table columns. Default columns are: Created time, Originator, Type, Severity, Status, and Assignee.
Each column entry has a key (the alarm field name) and a label (the column header text). Reorder columns by dragging, remove them with the delete icon, and add new ones with Add column.
Column Settings
Section titled “Column Settings”Click the gear icon on a column to open the Data key configuration dialog.
General — set the field key and the column header label.
Advanced — fine-tune column behavior:
| Setting | Description |
|---|---|
| Custom header title | Override the column header with a custom label. |
| Column width | Fixed width in pixels or percent (0px = auto). |
| Default column visibility | Visible — always shown; Hidden — hidden by default; Hidden in mobile mode — hidden on small screens. |
| Column selection in ‘Columns to Display’ | Enabled — user can toggle this column via the toolbar; Disabled — always shown. |
| Include column in export | Always, Only if column visible, or Never. |
| Disable sorting | Prevents sorting the table by this column. |
| Use cell style function | A JavaScript function f(value, alarm, ctx) that returns a CSS style object for the cell. |
| Use cell content function | A JavaScript function f(value, alarm, ctx) that returns custom HTML for the cell. Enable Use cell content function on export to also apply it to exported data. |
Appearance
Section titled “Appearance”Controls the widget header.
| Setting | Description |
|---|---|
| Card title | Text displayed in the widget header. |
| Card icon | Icon shown next to the title. |
Table Buttons
Section titled “Table Buttons”Table buttons add per-row action controls displayed as icons at the end of each alarm row.
| Button | Description |
|---|---|
| Display alarm activity | Opens the alarm activity log — a timeline of lifecycle events: creation, acknowledgment, clearing, and comments. |
| Display alarm details | Opens the alarm details panel with all metadata: originator, severity, type, status, duration, and assignee. |
| Allow alarms assignment | Enables assigning the alarm to a user directly from the row. |
| Allow alarms acknowledgment | Adds a one-click acknowledge button to each row. Acknowledging marks the alarm as reviewed; it remains active until cleared. |
| Allow alarms clear | Adds a one-click clear button to each row. Clearing resolves the alarm and removes it from the active list. |
Pagination
Section titled “Pagination”Pagination settings are on the Advanced tab of the widget configuration dialog.
| Setting | Description |
|---|---|
| Display pagination | Shows page navigation controls below the table. Enabled by default. |
| Page step settings | Available page sizes in the page-size dropdown, like 10, 25, 50. |
| Default page size | Number of rows shown per page on initial load. |
Card Appearance
Section titled “Card Appearance”Controls the widget toolbar and card styling.
| Setting | Description |
|---|---|
| Search | Opens a text search bar to filter displayed rows. |
| Alarm filter | Toolbar button to filter by severity or status without entering configuration. |
| Columns to display | Toolbar button letting users show or hide individual columns at runtime. |
| Data export | Toolbar button to download the table data. Available on PE, PaaS, and PaaS/EU only. |
| Fullscreen | Expands the widget to fullscreen mode. |
| Text color | Color of all text inside the widget. |
| Background color | Widget card background color. |
Actions
Section titled “Actions”The Alarms table supports widget actions on the following sources:
- Action cell button — a custom button inside a specific table cell.
- On cell click — triggered when the user clicks a cell.
- On row click — triggered when the user clicks a row.
- Widget header button — a button added to the widget header bar.
Example
Section titled “Example”Critical Alarm Monitor for a Device Fleet
Section titled “Critical Alarm Monitor for a Device Fleet”Scenario: A fleet of Smart Sensor devices has alarm rules defined for fault conditions. You want a dashboard widget that shows only active, critical alarms across all devices of that type for the past day, with one-click acknowledge and clear controls.
Prerequisites: An alarm rule must be defined for devices of the smart-sensor device profile.
Step 1. Add the widget. Open the dashboard in edit mode, click Add widget, select Alarm widgets, then choose Alarms table.
Step 2. Set the time window. Set the period to Realtime – last 1 day.
Step 3. Configure the alarm source. Set the source to Entity alias. Create an alias named All Smart Sensors with Filter type — Device type ⇾ smart-sensor.
Step 4. Configure filters. Set Alarm status list to Active and Alarm severity list to Critical.
Step 5. Configure appearance. Set Card title to Critical smart device alarms.
Step 6. Enable table buttons. Enable Allow alarms acknowledgment and Allow alarms clear so operators can act on alarms directly from the table.
Step 7. Save. Click Add, resize and reposition as needed, then click Save on the dashboard toolbar.
Result: The table shows all active critical alarms from Smart Sensor devices in real time, updated automatically as alarm states change. Each row has acknowledge and clear buttons for immediate action.
Troubleshooting
Section titled “Troubleshooting”No Alarms Appear in the Table
| Cause | Solution |
|---|---|
| Time window too narrow | Extend the time range — alarms older than the window are excluded. |
| Alarm source resolves to no entities | Open Entity aliases in the dashboard and verify the alias returns results. |
| Filter excludes all alarms | Check Alarm status list and Alarm severity list — if set, only matching alarms are shown. Clear filters to confirm alarms exist. |
| No alarm rules defined | Verify the device profile has alarm rules configured and that alarms have been triggered. |
Expected Alarms Are Missing
| Cause | Solution |
|---|---|
| Alarm status filtered out | The alarm may be Cleared or Acknowledged while the filter shows only Active. Add the relevant status to the filter. |
| Alarm type not in filter | If Alarm type list is set, only listed types are shown. Add the missing type or clear the filter. |
| Propagated alarms not showing | Enable Search propagated alarms to include alarms from child entities. |
Row Action Buttons Are Not Visible
| Cause | Solution |
|---|---|
| Table buttons not enabled | Open widget configuration → Table buttons and enable the desired buttons (acknowledge, clear, assign). |
Widget Is Slow, Fails to Load, or Older Alarms Are Missing
| Cause | Solution |
|---|---|
| Display pagination disabled | Re-enable Display pagination on the Advanced tab. With it off the widget builds up to 1024 rows at once instead of one page, and alarms past that are left out. |
| Time window too wide | Narrow the window so the widget subscribes to fewer alarms. |
| Too many columns | Every column adds a cell to every row. Remove columns that are not needed, or set Default column visibility to Hidden for them. |
| Alarm history has grown large | A widget that scans many entities or a wide time window can time out against a large alarm table and fail to load instead of showing data. Narrow the entity list, severity, type, or time window filters, or set Alarms TTL days in the Tenant profile Data Retention settings to bound alarm history growth. |
Was this helpful?