Time Series Table
The Time series table widget displays telemetry values over time in a tabular format. Unlike chart widgets that visualize trends graphically, it presents exact numeric values with timestamps — ideal for analyzing historical and live data, comparing multiple parameters, detecting anomalies, or exporting time-stamped records for reporting.
Adding the widget
Section titled “Adding the widget”- Open the dashboard in edit mode. Click Add widget in the top toolbar, or click the Add new widget icon in the center of an empty dashboard.
- In the widget bundle selection dialog, find and click Tables.
- Select the Time series table widget.
- Configure the time window, datasource, columns, and appearance, then click Add.
Configuration
Section titled “Configuration”The widget configuration dialog has Basic and Advanced tabs. The Basic tab groups settings into: Time window, Datasource, Columns, Card appearance, and Actions.
Time window
Section titled “Time window”Define the time period for which telemetry data is displayed. Options:
- Realtime — continuously updated with new data as it arrives.
- Last N — a relative range such as Last 24 hours or Last 7 days.
- Custom — an absolute date/time range.
Enable data aggregation to display summarized values grouped by a chosen interval (e.g., hourly, daily). Aggregation functions: Average, Sum, Min, Max, Count.
See Time window for full configuration details.
Datasource
Section titled “Datasource”The Time series table supports one or multiple datasources. For each datasource, select:
- Device — data from a single specific device.
- Entity alias — data for all entities matched by an entity alias. Use this to display telemetry across a group of devices simultaneously.
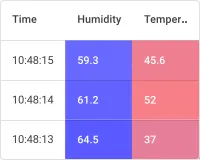
Columns
Section titled “Columns”Each column maps to a data key representing a telemetry value. For each column row you configure:
| Field | Description |
|---|---|
| Source | Data type: Time series — timestamped telemetry history; Latest — the most recent value only. |
| Key | Telemetry key name (e.g., temperature, humidity). |
| Label | Column header text. Defaults to the key name. |
| Units | Optional unit suffix shown after the value (e.g., °C, %). |
| Decimals | Number of decimal places for numeric values. |
Click Add column to add columns. Drag the handle on the right of any column row to reorder.
Column settings
Section titled “Column settings”Click the pencil icon on a column row to open the Data key configuration dialog. It has two tabs: General and Advanced.
General tab
| Setting | Description |
|---|---|
| Key | Telemetry key name. |
| Label | Column header text. |
| Units | Unit suffix displayed after the value. |
| Decimals | Number of decimal places. |
| Use data post-processing function | JavaScript function applied to each value before display. Signature: f(value, ctx). |
Advanced tab (Column settings)
| Setting | Description |
|---|---|
| Default column visibility | Controls whether the column is shown by default. Visible — always shown; Hidden — not displayed by default; Hidden in mobile mode — visible on desktop, hidden on mobile. |
| Column selection in “Columns to Display” | Whether the user can toggle this column in the Columns to Display panel. Enabled — user can show/hide it; Disabled — column cannot be toggled. |
| Include column in export | Controls whether the column is included when exporting data. Always — always exported; Only if column visible — exported only when visible; Never — never exported. |
| Disable sorting | Prevents sorting by this column. Useful for columns with complex or non-numeric content. |
| Use cell style function | JavaScript function for per-cell styling. Signature: f(value, rowData, ctx). Must return a CSS style object (e.g., { color: 'red', fontWeight: 'bold' }). |
| Use cell content function | JavaScript function for custom cell content rendering. Signature: f(value, rowData, ctx). Return a formatted value or an HTML string. Enable Use cell content function on export to apply the same logic during data export. |
Card appearance
Section titled “Card appearance”| Setting | Description |
|---|---|
| Card title | Title text displayed in the widget header. |
| Card icon | Optional icon shown next to the title. |
| Show card buttons | Toolbar buttons: Search — full-text filter; Columns to display — column toggle panel; Data export — download table data; Fullscreen — fullscreen view. |
| Text color | Color applied to all text within the widget. |
| Background color | Widget card background color. |
Actions
Section titled “Actions”The Time series table widget supports the following action sources:
| Action source | When triggered |
|---|---|
| Action cell button | A button appended to the end of each row. |
| On row click | User clicks anywhere in a row. |
| Widget header button | A button in the widget header, used for global actions. |
See Widget Actions for the full list of action types and configuration options.
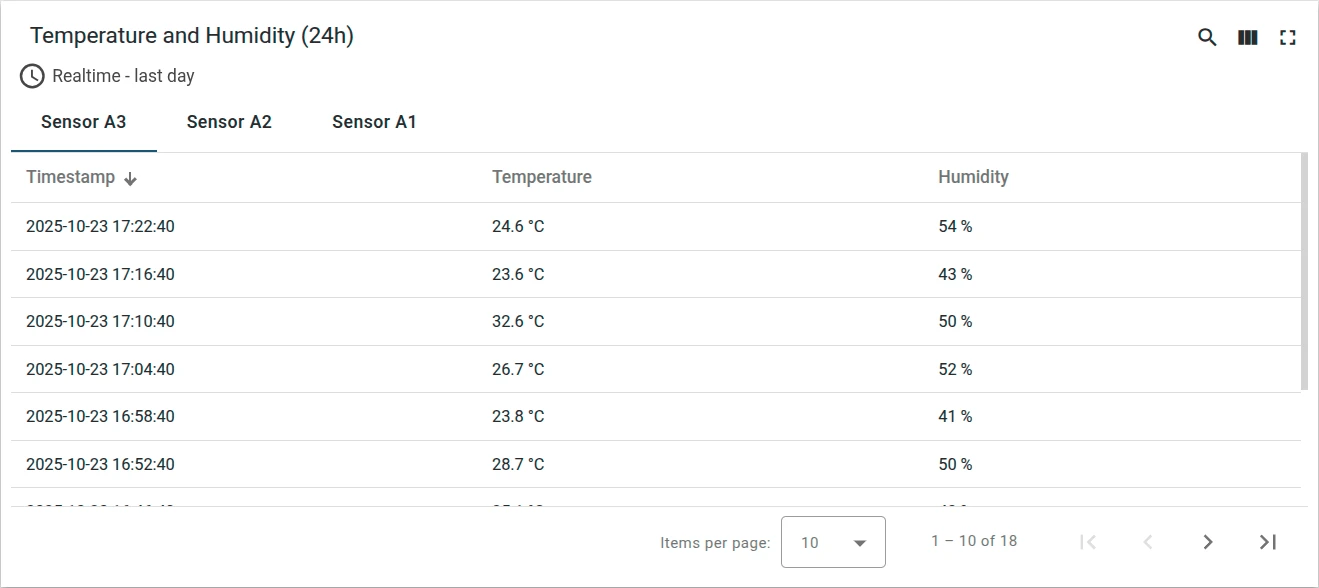
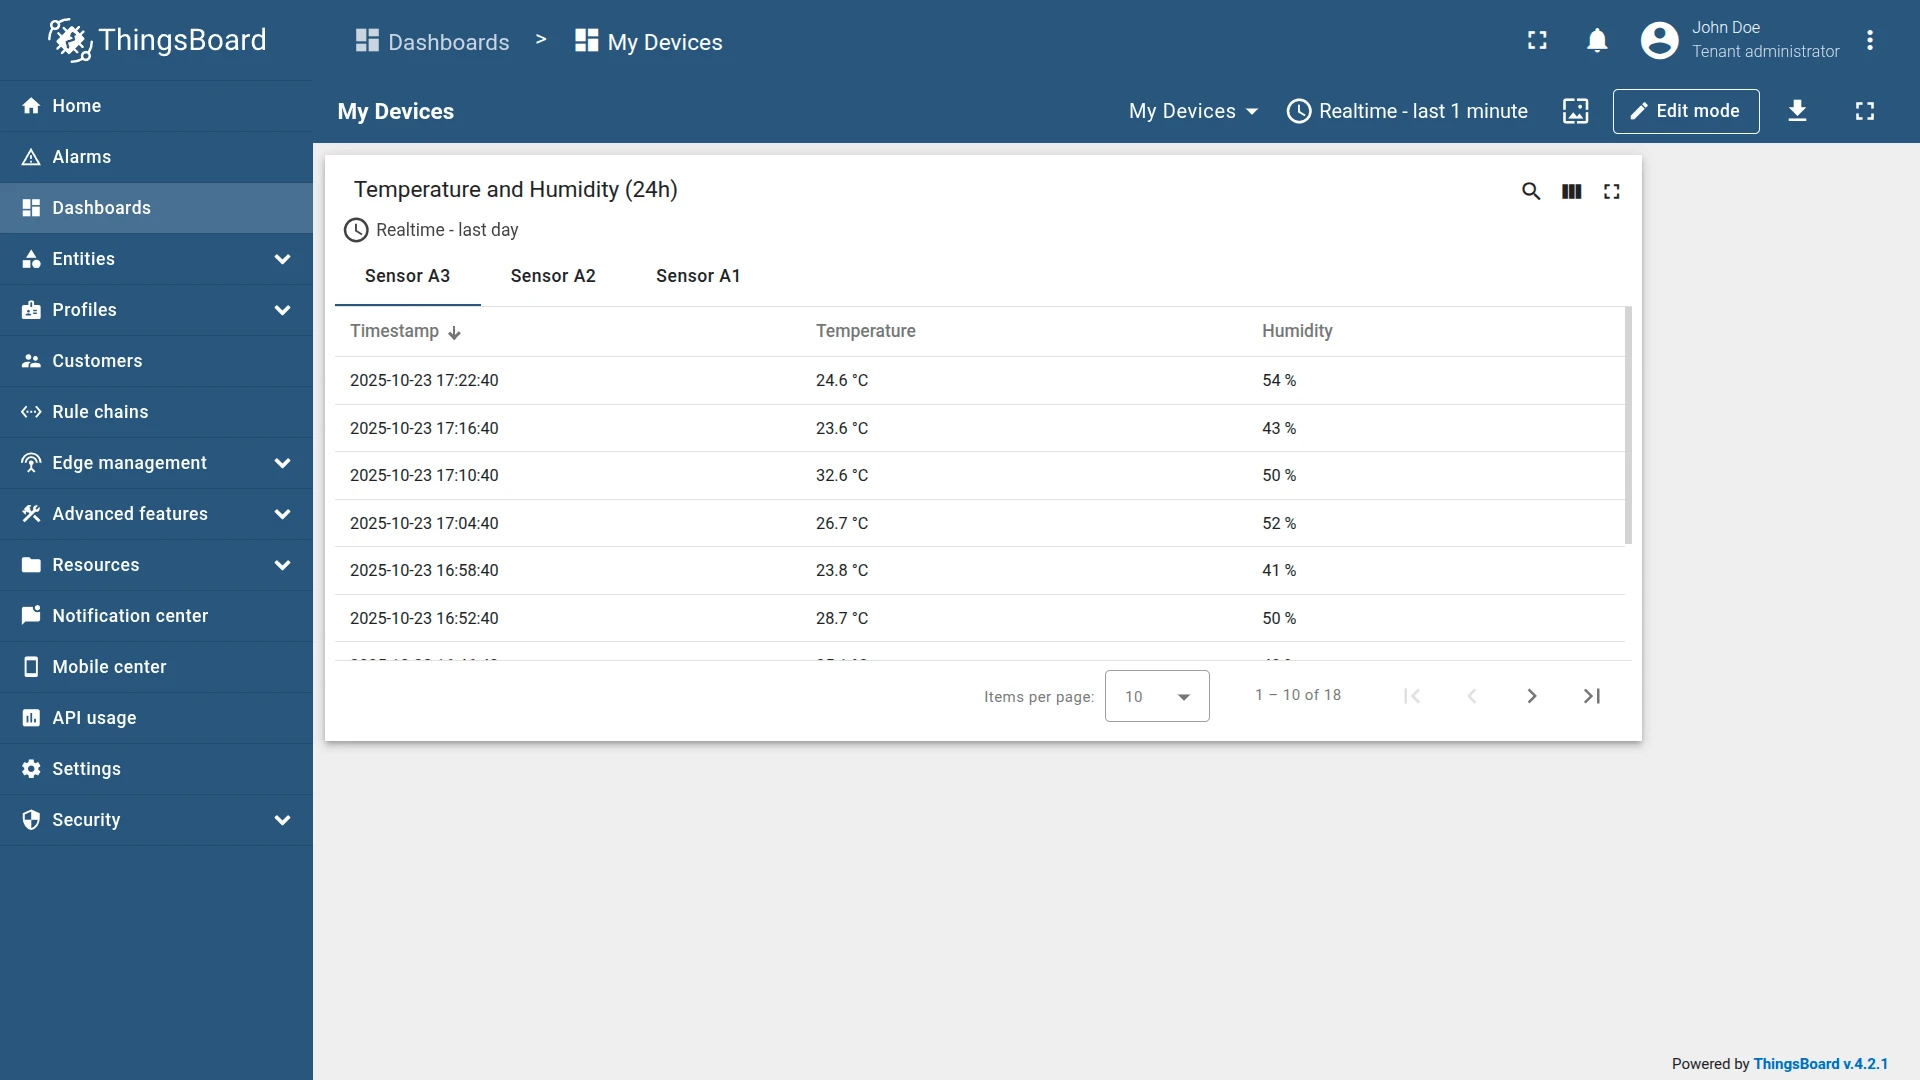
Example: Temperature and humidity over 24 hours
Section titled “Example: Temperature and humidity over 24 hours”Goal: Display temperature and humidity telemetry for all devices over the past 24 hours in a time-ordered table.
Prerequisites
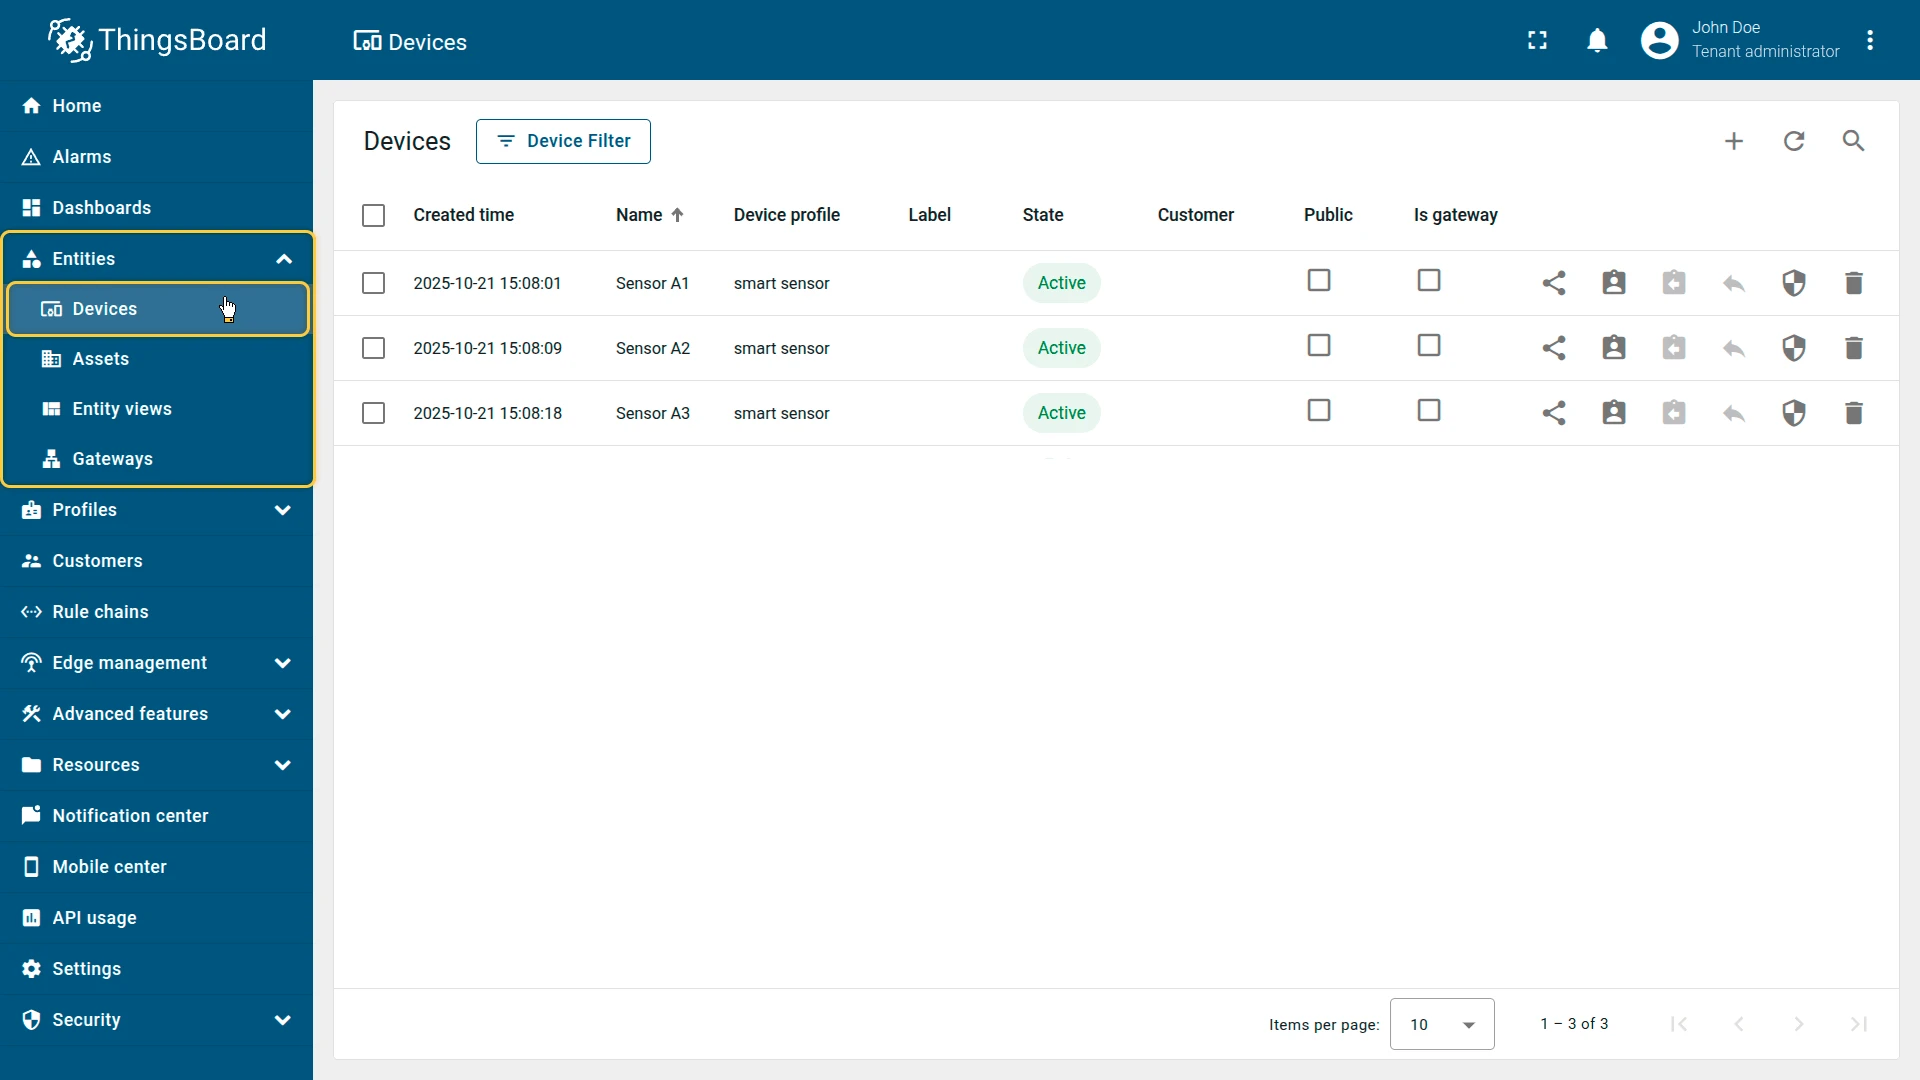
Prepare several devices that send temperature and humidity as telemetry keys to ThingsBoard.
Step 1. Add the widget
Open your dashboard in edit mode. Click Add widget, select the Tables bundle, then choose Time series table.
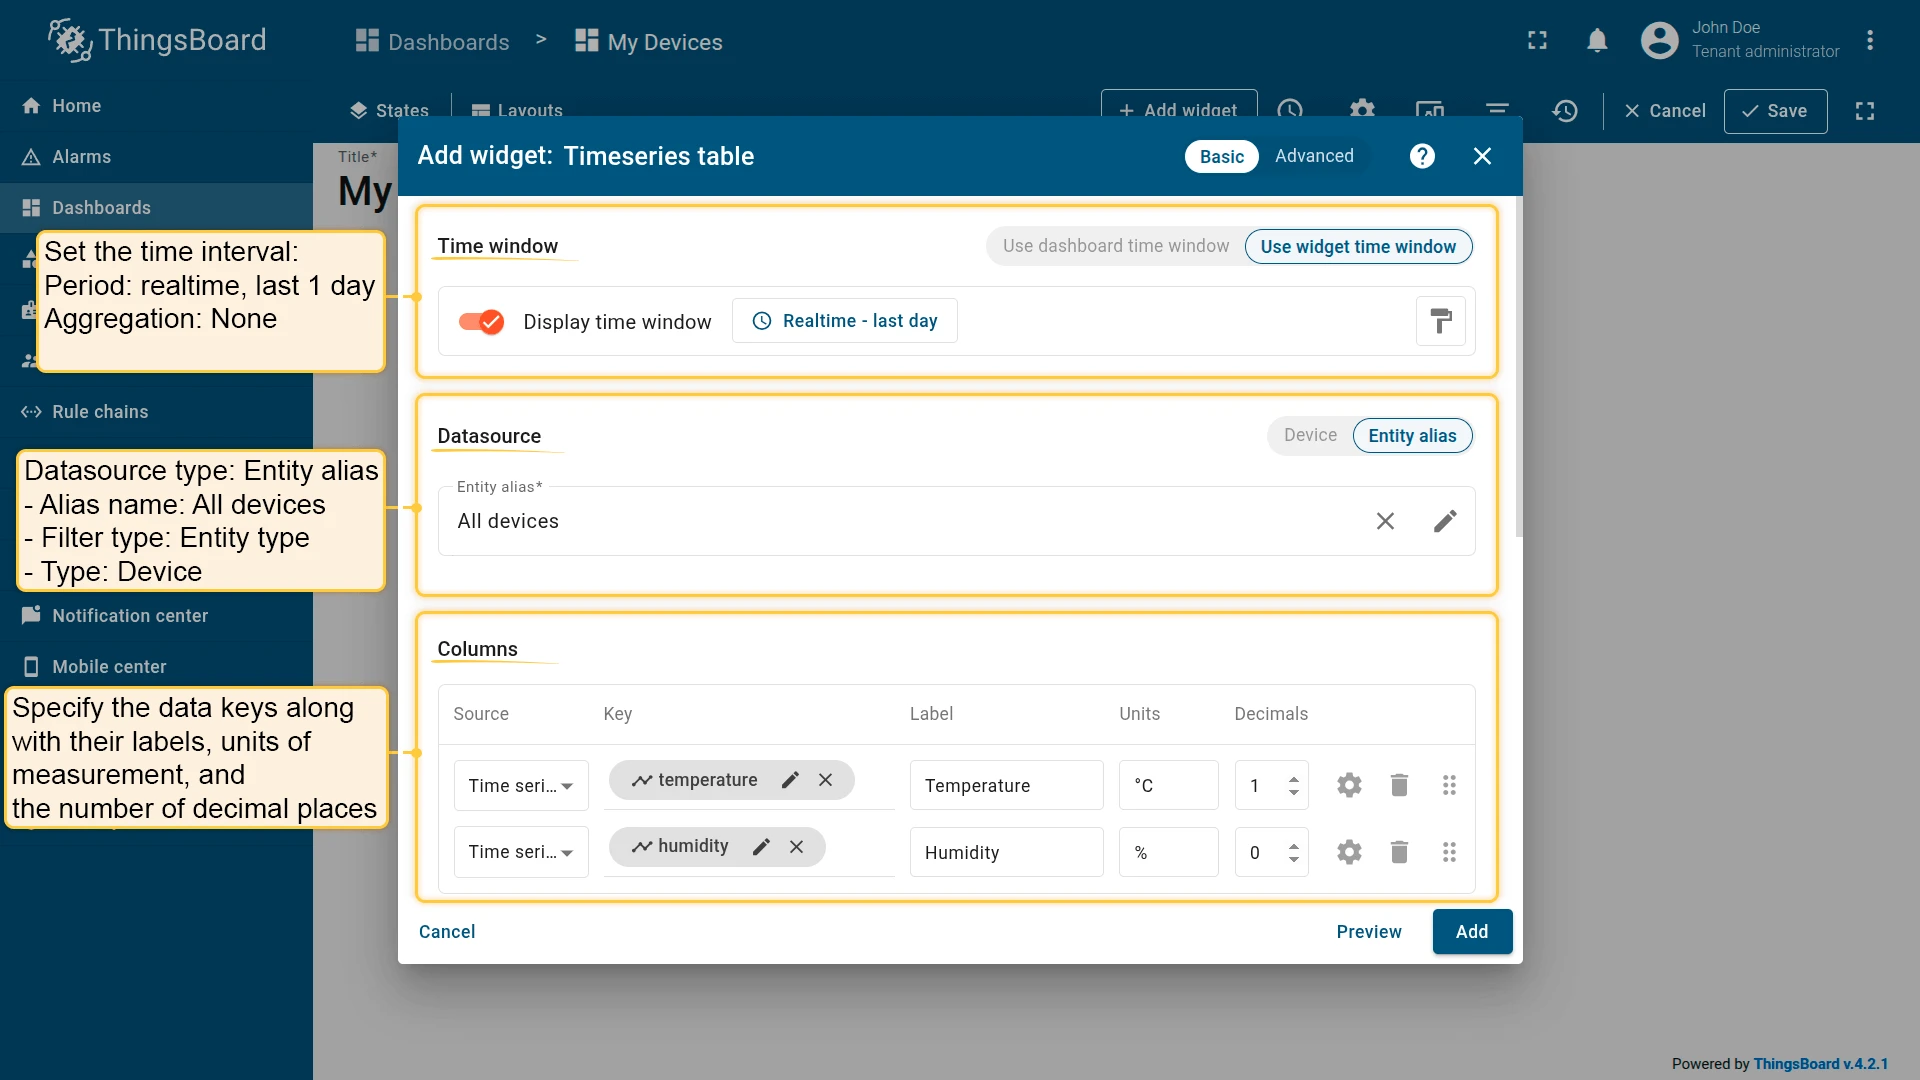
Step 2. Configure the time window
In the Time window section set:
- Period: Realtime, last 1 day
- Aggregation: None
Step 3. Configure the datasource
Select Entity alias as the datasource type, then choose or create an alias:
- Alias type: Filter-based
- Filter type: Entity type → Device
This resolves to all devices in the tenant.
Step 4. Configure columns
Click Add column for each of the following:
| Key | Label | Units | Decimals |
|---|---|---|---|
temperature | Temperature | °C | 1 |
humidity | Humidity | % | 0 |
Step 5. Set the card title
In the Card appearance section, enable Card title and enter:
Temperature and Humidity (24h)Set the font size to 18 px.
Step 6. Save
Click Add to place the widget on the dashboard. Resize and reposition as needed, then click Save on the dashboard toolbar.
Result
The Time series table displays a chronological list of telemetry readings for each device. Users can:
- View precise values with timestamps for each entity.
- Sort results by any column.
- Export the dataset for offline use.
Troubleshooting
Section titled “Troubleshooting”Widget not showing data
| Cause | Solution |
|---|---|
| Incorrect datasource or entity alias | Verify the correct Device or Entity alias is selected in the datasource configuration. |
| Wrong data key name | Confirm the key name matches the telemetry key sent by the device. Key names are case-sensitive. |
| Device not sending data | Open Devices → Latest telemetry and check for recent values. If empty, verify the device transport config and token. |
| No telemetry in the selected time window | Extend the time range or switch to a longer Last N period. |
| Rule chain misconfiguration | Check that the Rule Chain has a Save time series node routing device telemetry to the database. |
Wrong or missing time window
| Cause | Solution |
|---|---|
| Incorrect time window type | Switch between Realtime and Last N as appropriate. |
| Aggregation interval too large | Reduce the grouping interval for finer granularity, or set Aggregation to None for raw values. |
Missing or incorrect columns
| Cause | Solution |
|---|---|
| Data key not added | Open the Columns section and confirm each telemetry key is added as a column. |
| Column hidden by default | Open column settings and set Default column visibility to Visible. |
| Column hidden in “Columns to Display” | Ensure Column selection in “Columns to Display” is Enabled for the relevant column. |
| Column missing from export | Open column settings and set Include column in export to Always or Only if column visible. |
Was this helpful?