Time-Series Widget
Time-Series widgets subscribe to historical data within the configured time window. The platform calls self.onDataUpdated() with the full dataset each time the time window changes or new data arrives. Unlike Latest Values, data[i].data can contain many [timestamp, value] pairs covering the entire window.
When to Use Time-Series
Section titled “When to Use Time-Series”Use this type when you need to visualize how a value changes over time:
- Line charts, bar charts, area charts
- Trend analysis and anomaly detection
- Heatmaps aggregated by time period
- Custom chart libraries (ECharts, D3) wrapping platform data
If you only need the most recent value, use the Latest Values type instead — it’s simpler and avoids unnecessary data transfer.
Example 1: Embedded Chart with Key Selector
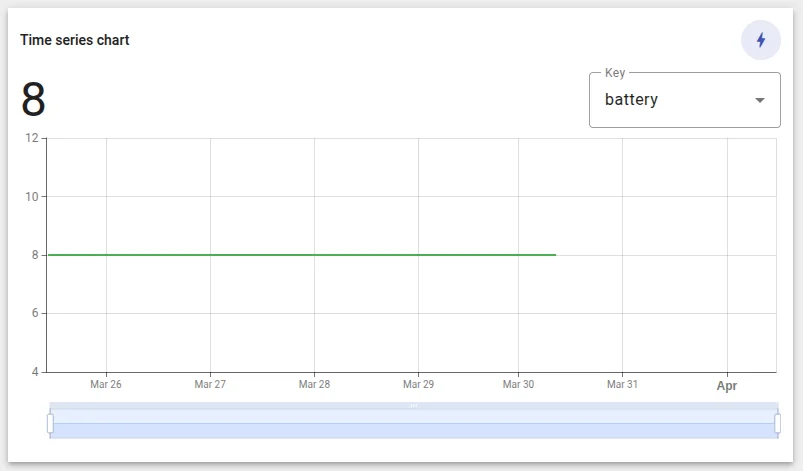
Section titled “Example 1: Embedded Chart with Key Selector”A widget that wraps the platform’s built-in <tb-time-series-chart-widget> and adds a dropdown to switch which data key is charted, plus a large current-value display above the chart.
This example teaches how to embed a platform chart component, create dynamic subscriptions at runtime, and use Angular Reactive Forms for user input.
-
Open Widget Library → open your bundle → click + → select Time-Series as the type.
-
In the HTML tab, paste:
<div class="ts-chart-root flex flex-col w-full h-full" *ngIf="showChart"><!-- Title bar + icon --><div class="flex items-center justify-between"><span class="ts-chart-title">{{title}}</span><div class="icon-wrapper flex items-center justify-center w-10 h-10 shrink-0"><mat-icon class="icon-inner">bolt</mat-icon></div></div><!-- Value (left) + key selector (right) --><div class="flex items-center justify-between mt-3"><div class="flex items-baseline gap-1"><span class="value">{{value}}</span><span class="units">{{units}}</span></div><div class="w-48" *ngIf="dataKeysFormControl"><mat-form-field appearance="outline" color="primary" class="w-full"><mat-label>Key</mat-label><mat-select [formControl]="dataKeysFormControl"panelClass="custom-select-panel"placeholder="Select key"><mat-option *ngFor="let key of allDataKeys" [value]="key.name">{{key.label}}</mat-option></mat-select></mat-form-field></div></div><!-- Chart --><div class="flex-1"><tb-time-series-chart-widget [ctx]="ctx"></tb-time-series-chart-widget></div></div>Key details:
<span class="ts-chart-title">{{title}}</span>— renders the widget title read fromself.ctx.widget.config.titleinonInit. The platform’s built-in title bar is hidden by settingshowTitle = falseand callingupdateWidgetParams(), giving this element full control over title placement.<mat-select [formControl]="dataKeysFormControl">— single-select dropdown bound to a Reactive Forms control.<tb-time-series-chart-widget [ctx]="ctx">— embeds the platform’s built-in time-series chart.*ngIf="showChart"on the root — toggled off/on to force chart re-initialization when the subscription changes.
-
In the CSS tab, paste:
/* Time-Series widget containers are transparent by default — set an explicitbackground so the widget looks correct on all dashboard themes. */.ts-chart-root {background-color: #fff;}.icon-wrapper {background-color: var(--tb-primary-50);border-radius: 50%;}.icon-inner {font-size: 20px;width: 20px;height: 20px;color: var(--tb-primary-500);}.value {color: #212121;font-size: 48px;line-height: 44px;}.units {color: #212121;font-size: 24px;font-weight: 500;line-height: 32px;}.mat-mdc-form-field-subscript-wrapper {display: none !important;}.ts-chart-title {font-size: 14px;font-weight: 500;color: #212121;}.tb-time-series-chart-panel {gap: 0 !important;} -
In the JavaScript tab, paste:
function createCustomSubscription(dataKeyName) {const dataKeys = self.ctx.$scope.allDataKeys.filter(key => key.name === dataKeyName);const datasources =self.ctx.defaultSubscription.datasources.map(ds => ({...ds,dataKeys}));const options = {type: 'timeseries',datasources,callbacks: {onDataUpdated: () => { self.onDataUpdated(); }}};if (self.ctx.$scope.customSubscription) {self.ctx.$scope.customSubscription.unsubscribe();}self.ctx.$scope.customSubscription =self.ctx.subscriptionApi.createSubscription(options, true).subscribe(subscription => {subscription.timeWindowConfig =self.ctx.defaultSubscription.timeWindowConfig;self.ctx.defaultSubscription = subscription;self.ctx.data = subscription.data;self.ctx.datasources = subscription.datasources;self.ctx.defaultSubscription.update();self.ctx.$scope.units =self.ctx.data[0]?.dataKey.units || '';// Force chart re-init by toggling visibilityself.ctx.$scope.showChart = false;self.ctx.detectChanges();setTimeout(() => {self.ctx.$scope.showChart = true;self.ctx.detectChanges();}, 0);});}self.onInit = function() {if (self.ctx.$scope.timeSeriesChartWidget) {self.ctx.$scope.timeSeriesChartWidget.onInit();self.ctx.$scope.timeSeriesChartWidget.timeSeriesChart.onResize();}self.ctx.$scope.title = self.ctx.widget.config.title;self.ctx.widget.config.showTitle = false;self.ctx.updateWidgetParams();self.ctx.$scope.allDataKeys =self.ctx.widget.config.datasources[0].dataKeys;self.ctx.$scope.dataKeysFormControl =self.ctx.$scope.fb.control(self.ctx.$scope.allDataKeys[0].name);createCustomSubscription(self.ctx.$scope.dataKeysFormControl.value);self.ctx.$scope.dataKeysFormControl.valueChanges.subscribe(value => {createCustomSubscription(value);});};self.onDataUpdated = function() {const data = self.ctx.data[0]?.data;if (data && data.length) {const last = data[data.length - 1];const decimals = self.ctx.data[0].dataKey.decimals;self.ctx.$scope.value = (decimals != null && decimals >= 0)? parseFloat(last[1]).toFixed(decimals): last[1];}if (self.ctx.$scope.timeSeriesChartWidget) {self.ctx.$scope.timeSeriesChartWidget.onDataUpdated();self.ctx.detectChanges();}};self.typeParameters = function() {return {embedTitlePanel: true,hasAdditionalLatestDataKeys: true};};How custom subscriptions work:
createCustomSubscription(dataKeyName)is the core technique. When the user picks a different key from the dropdown:- Filter
allDataKeysto the selected key only - Build new
datasourceswith the filtered keys - Call
subscriptionApi.createSubscription(options, true)to create a new subscription - Replace
self.ctx.defaultSubscriptionwith the new one - Toggle
showChartoff/on to force the embedded chart to reinitialize with new data
embedTitlePanel: true— injects the widget title bar as a template reference (widgetTitlePanel) you can place anywhere via*ngTemplateOutlet.hasAdditionalLatestDataKeys: true— allows the widget to accept extra latest-value data keys alongside the time-series keys. - Filter
-
In the Settings form tab, you can either leave it empty (no settings panel) or set the Settings schema selector to
tb-time-series-chart-widget-settingsto inherit the built-in chart’s full settings form. Set the Data key settings form selector totb-time-series-chart-key-settingsfor per-key chart options. -
Click Save → name it “Chart with Key Selector”.
-
Add to a dashboard → select a device → add multiple data keys (e.g.,
temperature,humidity,pressure). The dropdown lists all keys; switching replaces the chart and updates the current value display.
Example 2: ECharts Heatmap
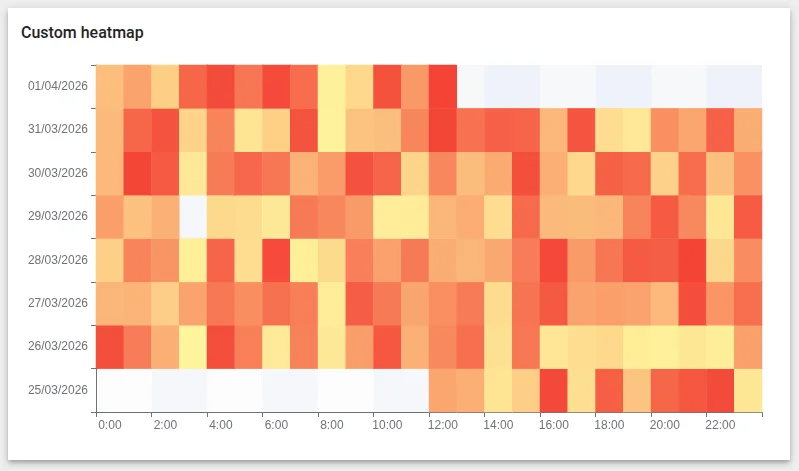
Section titled “Example 2: ECharts Heatmap”A custom time-series heatmap using the ECharts library — visualizing value intensity across hour of day (X axis) and date (Y axis). This example shows how to transform the platform’s [timestamp, value] data into a two-dimensional grid, compute a dynamic color scale, and properly clean up on destroy.
A heatmap is well-suited for spotting recurring daily patterns: e.g., temperature peaks at midday, traffic spikes in the morning rush, or energy usage patterns across the week.
-
Open Widget Library → open your bundle → click + → select Time-Series as the type.
-
In the Resources tab, click + and add:
https://cdn.jsdelivr.net/npm/echarts@5/dist/echarts.min.jsThis loads ECharts before your code runs. The global
echartsobject is then available in JavaScript. -
In the HTML tab, paste:
<div class="chart-wrap"><div class="chart"></div></div> -
In the CSS tab, paste:
.chart-wrap,.chart {width: 100%;height: 100%;} -
In the JavaScript tab, paste:
let chart;self.onInit = function() {let el = self.ctx.$container[0].querySelector('.chart');chart = echarts.init(el);};self.onDataUpdated = function() {if (!self.ctx.data.length || !self.ctx.data[0].data.length) return;let settings = self.ctx.settings || {};let minColor = settings.minColor || '#5cb85c'; // green = low valueslet maxColor = settings.maxColor || '#d9534f'; // red = high valueslet rawData = self.ctx.data[0].data;let key = self.ctx.data[0].dataKey;// Collect unique dates for the Y axis (sorted ascending)let daysSet = new Set();rawData.forEach(function(p) {daysSet.add(new Date(p[0]).toLocaleDateString('en-GB'));});let days = Array.from(daysSet).sort(function(a, b) {return new Date(a.split('/').reverse().join('-'))- new Date(b.split('/').reverse().join('-'));});// X axis: hours 0–23let hours = [];for (let h = 0; h < 24; h++) {hours.push(h + ':00');}// Build [xIndex (hour), yIndex (day), value] tripleslet heatData = rawData.map(function(p) {let d = new Date(p[0]);let hour = d.getHours();let dayStr = d.toLocaleDateString('en-GB');return [hour, days.indexOf(dayStr), parseFloat(p[1]) || 0];});let values = heatData.map(function(d) { return d[2]; });let minVal = Math.min.apply(null, values);let maxVal = Math.max.apply(null, values);chart.setOption({tooltip: {position: 'top',formatter: function(params) {let hour = params.value[0];let day = days[params.value[1]];let val = params.value[2];let units = key.units || '';return day + ' ' + hour + ':00 — <b>' + val + ' ' + units + '</b>';}},grid: { top: 20, left: 80, right: 20, bottom: 40 },xAxis: {type: 'category',data: hours,splitArea: { show: true }},yAxis: {type: 'category',data: days,splitArea: { show: true }},visualMap: {show: false,min: minVal,max: maxVal,inRange: {color: [minColor, maxColor]}},series: [{name: key.label,type: 'heatmap',data: heatData,label: { show: false },emphasis: {itemStyle: {shadowBlur: 10,shadowColor: 'rgba(0, 0, 0, 0.5)'}}}]});};self.onResize = function() {chart.resize();};self.onDestroy = function() {chart.clear();};self.typeParameters = function() {return { maxDataKeys: 1 };};How the data is transformed:
The platform delivers
self.ctx.data[0].dataas flat[timestamp_ms, value]pairs. To build a heatmap grid the code:- Collects all unique dates (formatted
DD/MM/YYYY) from the timestamps — these become the Y axis. - Uses hour of day (0–23) as the X axis — always a fixed 24-slot range.
- Maps each raw point to
[hour, dayIndex, numericValue]— the format EChartsheatmapseries expects. - Computes
min/maxacross all values sovisualMapscales the color gradient to the actual data range.
Key lifecycle integration:
Lifecycle ECharts action onInitecharts.init(element)— create the chart instanceonDataUpdatedrebuild axes and call chart.setOption(...)with the full new datasetonResizechart.resize()— fit to the new container sizeonDestroychart.clear()— release memory - Collects all unique dates (formatted
-
In the Settings tab, open the Settings form sub-tab.
First, clear the Settings form selector and Data key settings form selector fields if they contain any platform defaults — those selectors inject a built-in form that will conflict with the custom schema below.
Then paste the following into the Settings schema field:
[{"id": "minColor","name": "Low value color","type": "color","default": "#5cb85c"},{"id": "maxColor","name": "High value color","type": "color","default": "#d9534f"}]This adds two color pickers to the widget’s settings panel.
minColoris applied to the lowest end of the gradient (defaults to green) andmaxColorto the highest end (defaults to red). The JavaScript reads both fromself.ctx.settingsand falls back to the same defaults when no settings have been saved yet. -
Click Run (or
Ctrl+Enter) to preview. You should see a green-to-red gradient heatmap with dates on the Y axis and hours on the X axis. Click Save → name it “ECharts Heatmap”. -
Add to a dashboard → select a device and a single numeric key (e.g.,
temperature) → set the time window to last 7 days and aggregation to 1 hour. Open the widget’s settings panel to change the gradient colors — the chart re-renders immediately on the next data update.
Data Model
Section titled “Data Model”self.ctx.data has the same per-key structure as Latest Values, but each key carries many data points instead of one:
self.ctx.data = [ { dataKey: { name: 'temperature', // raw key name label: 'Temperature', // display label type: 'timeseries', units: '°C', decimals: 1, settings: {} // values from the Data key settings form }, data: [ [1710000000000, '22.1'], // oldest point in the time window [1710000060000, '22.4'], [1710000120000, '23.0'], // ...one entry per aggregation interval [1710003600000, '24.5'] // newest point ] }];Points are sorted ascending by timestamp — data[0] is the oldest, data[data.length - 1] is the newest. To read the latest value:
let last = self.ctx.data[0].data[self.ctx.data[0].data.length - 1];let latestTs = last[0]; // timestamp mslet latestValue = parseFloat(last[1]); // always a string — convert before mathPoint count depends on the time window and aggregation interval set in the dashboard. A 1-hour window with 1-minute aggregation produces ~60 points. A 24-hour window with 1-hour aggregation produces ~24 points. The platform handles aggregation — your widget receives the pre-aggregated series.
onDataUpdated fires on time window changes — not just on new telemetry. When the user shifts the time window in the dashboard, the platform re-fetches the full dataset and calls onDataUpdated with the new range. Your chart should replace its data entirely, not append to it.
Comparing Latest Values vs Time-Series data:
| Latest Values | Time-Series | |
|---|---|---|
data[i].data length | 1 (most recent only) | N (full time window) |
onDataUpdated trigger | New telemetry arrives | New telemetry or time window change |
| Typical use | Current state display | Historical trend, chart |
Next Steps
Section titled “Next Steps”- Latest Values — sensor cards, multi-key status panels, current-state display
- RPC Control — send commands to devices and handle responses
- Advanced Topics — ECharts gauge, client-side aggregation, dark mode
- Widget Patterns — multi-select filtering, timewindow management
- Widget API Reference — full reference for
subscriptionApi, data structures, and lifecycle
Was this helpful?