- Prerequisites
- Step 1. Provision device
- Step 2. Connect device
- Step 3. Create dashboard
- Step 4. Configure alarm rules
- Step 5. Create alarm
- Step 6. Alarm notifications
- Step 7. Assign device and dashboard to customer
- Next steps
- Your feedback
This guide demonstrates basic usage of popular ThingsBoard features. You will learn how to:
- Connect devices to ThingsBoard
- Push data from devices to ThingsBoard
- Build real-time dashboards
- Create a Customer and assign the dashboard with them.
- Define thresholds and trigger alarms
- Set up notifications.
For simplicity, we'll visualize data from a temperature sensor.
Prerequisites
You will need a ThingsBoard server up and running:
- ThingsBoard Cloud: The fastest way to start with zero setup. Click for the North America or Europe region (these links lead to a separate “Getting Started” guide for our managed service).
- Self-Managed Installation: Alternatively, you can manually install ThingsBoard using our guides for Windows (Docker) or Linux and MacOS (Docker).
Step 1. Provision device
Let's add a device that sends temperature data to ThingsBoard:
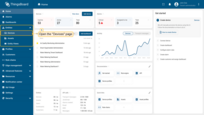
- Log in to ThingsBoard and navigate to the "Devices" page of the "Entities" section.
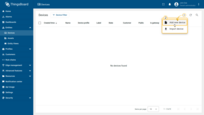
- Click on the "+" icon in the top right corner of the table and select "Add new device" from drop-down menu.
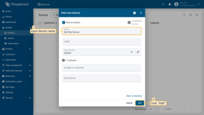
- Enter a device name (e.g., "My New Device") No other changes required at this time. Click "Add".
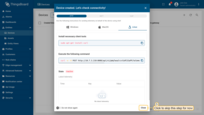
- A window for checking the device connection will open — we'll skip this step for now and return to connection checking in the next step.
- Congratulations, you've added your first device! As you add more devices, they will be added at the top of the table, as the table automatically sorts devices by their creation time, with the newest ones listed first.
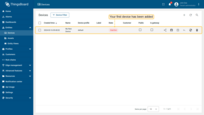
You will also receive a notification upon adding devices. Click the bell icon (top right) to view notifications.
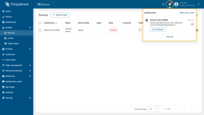
Learn more about notifications here.
Additional provisioning methods
- Bulk provisioning: Import multiple devices via CSV through the UI.
- Device provisioning: Configure devices to self-register automatically.
- REST API provisioning: Manage devices programmatically through APIs.
Step 2. Connect device
Let's verify your device's connection to ThingsBoard:
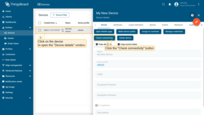
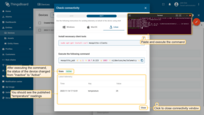
- Click on your device, then click the "Check connectivity” button in the "Device details" window.
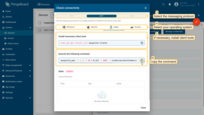
- In the opened window, choose your messaging protocol and operating system. Install any necessary client tools and copy the provided command.
- Execute the copied command in Terminal. Once telemetry data (e.g., temperature readings) is successfully published, the device status will change from "Inactive" to "Active," and you'll see the data displayed. You can now close the connectivity window.
Explore ThingsBoard API reference. Here you will find more detailed information about all supported protocols for connecting devices.
Step 3. Create dashboard
A dashboard in ThingsBoard allows users to visualize and monitor data collected from IoT devices.
Let's create a dashboard and add three widgets to it in order to display a list of entities and their latest values, as well as show alarm signals related to the specified entity.
Step 3.1 Create an empty dashboard
To create a new dashboard, follow these steps:
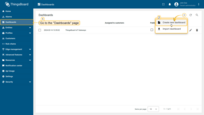
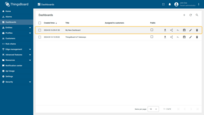
- Navigate to the "Dashboards" page through the main menu on the left of the screen. Then, click the "+" sign in the upper right corner of the screen, and select "Create new dashboard" from the drop-down menu.
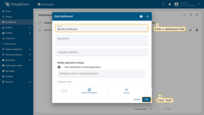
- In the opened dialog, it is necessary to enter a dashboard title, description is optional. Click "Add".
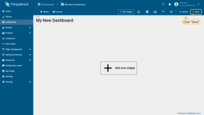
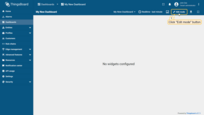
- After creating the dashboard, it will open automatically, and you can immediately start adding widgets to it. To save the dashboard, click "Save" button in the upper right corner.
- Your first dashboard has been successfully created. As you continue to add new dashboards, they will appear at the top of the list. This default sorting is based on the creation timestamp.
Step 3.2 Add an Entities table widget
The “Entities table” widget displays a list of entities and their latest values. The list of entities corresponds to selected devices or other entities, and filters with the ability of additional full-text search and pagination options.
To add the table widget we need to select it from the widget library. Widgets are grouped into widget bundles. Each widget has a data source. This is how the widget “knows” what data to display. To see the latest value of our “temperature” data that we sent during step 2, we should configure the data source.
Let's add your first widget:
- Enter dashboard edit mode. Simply open the dashboard and click the "Edit mode" button found in the upper right corner of the screen;
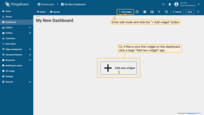
- Click the "Add widget" button at the top of the screen or click the large "Add new widget" icon in the center of the screen (if this is your first widget on this dashboard);
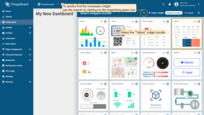
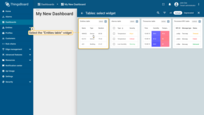
- Find the "Tables" widget bundle and click on it;
- Select the "Entities table" widget;
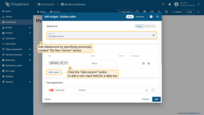
- The "Add Widget" window will appear. Specify the previously created device "My New Device" as the data source in the "Device" field. The "name" key has already been added to the "Columns" section, which is responsible for the column with the device name. You need to add another column that will display the value of the "temperature" key. To do this, click "Add column" to add a new field to enter the data key;
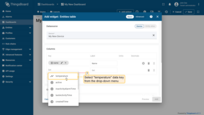
- Click on the newly appeared data key input field. A list of available data keys will open. Select "temperature" data key;
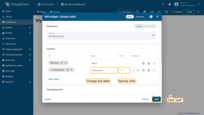
- Click the "Add" button in the bottom right corner of the widget to complete adding the widget.
- To make the widget slightly larger, simply grab the bottom right corner and drag it. Once you're happy with the new size, don't forget to click "Save" to save your changes to the dashboard.
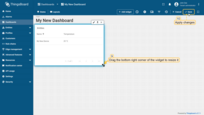
Congratulations! You've added your first widget.
In the “Entities table” widget, there are two columns. The first column displays the device's name, and the second column displays the value of the “temperature” key (device telemetry). So, each column corresponds to an added key.
Now you are able to send a new telemetry reading (as in Step 1), and it will immediately appear in the table.
Step 3.3 Add a Chart widget
Chart widgets allow you to display time series data with customizable line charts and bar charts.
To add the chart widget we need to select it from the widget library. Chart widget displays multiple historical values of the same data key (“temperature” in our case). We should also configure the time window to use the chart widget.
- Enter edit mode and click the "Add new widget" button at the top of the screen;
- Find the "Charts" widget bundle and click on it;
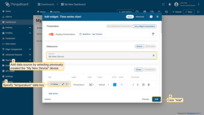
- Select the "Time series сhart" widget;
- Specify the previously created device "My New Device" as the data source in the "Device" field. In the "Series" section, specify the data key "temperature" to start monitoring the temperature values of the device. Then, click "Add";
- Resize the widget and apply changes. Publish different telemetry values multiple times, as in Step 2. Note that the widget displays only one minute of data by default. Click "Save" to apply changes;
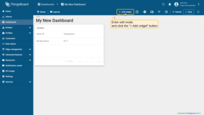
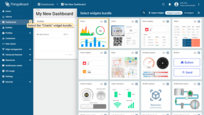
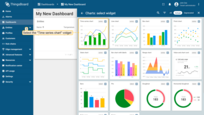
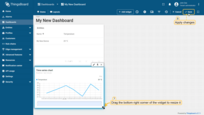
Congratulations! You have added the chart widget. Now you are able to send a new telemetry reading, and it will immediately appear in the chart.
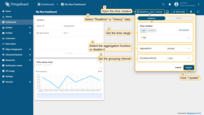
You can also adjust the time interval for displaying data in the widget, change the aggregation function, and specify the grouping interval. To do this, open the Time window and make the necessary adjustments. Update the time window settings by clicking the “Update” button.
Step 3.4 Add an Alarms table widget
The alarms table widget displays alarms related to the specified entity in the certain time window. Alarm widget is configured by specifying an entity as the alarm source, and the corresponding alarm fields.
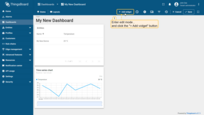
- Enter edit mode and click the "Add new widget" button at the top of the screen;
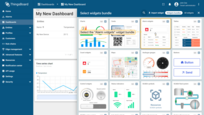
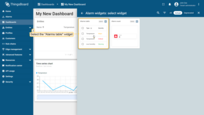
- Find the "Alarm widgets" bundle and click on it;
- Select "Alarms table" widget;
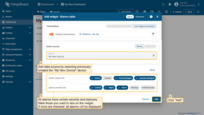
- Specify the previously created device "My New Device" as the data source in the "Device" field. Next, we will configure the filters. All alarms have specific severities and statuses. Mark those you want to see in the widget. If none are marked, all alarms will be displayed regardless of their status or severity;
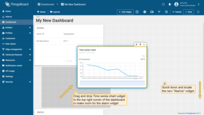
- Congratulations! You have added the alarm widget. By default, new widgets are added one below the other, stacking downwards. Let's organize our widgets a bit to tidy up their arrangement. Drag the "Time series chart" widget to the top right corner of the dashboard to make room for the "Alarms table" widget;
- Scroll down, find the "Alarms table" widget, and drag it over to a free spot. Adjust its size to fit your needs. After you're done tweaking, click "Save" to save the dashboard.
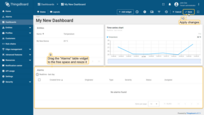
Now it's time to configure alarm rules and raise some alarms.
Note: in this documentation, we are using a single device as a data source for the widgets. To use dynamic entities (for example, devices of a certain type or related to a certain asset) as data source, you should use the alias. Alias is a reference to a single entity or a group of entities that are used in the widgets. You may learn more about different aliases here.
Step 4. Configure alarm rules
We will use the alarm rules feature to define a rule that triggers when the temperature exceeds 25°C.
Alarm rules can be configured either at the device level or at the device profile level used by the target device.
Recommendation: If the same rule needs to be applied to multiple devices, create it at the Device profile level.
This ensures centralized alarm logic management, simplifies maintenance, and eliminates configuration duplication.
In this example, we will configure the alarm rule directly on the device “My New Device”.
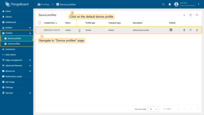
Step 4.1 Open the device settings
- Go to the Devices page in the Entities section.
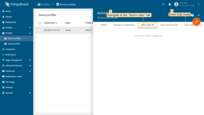
- Click My New Device to open its details.
- Navigate to the Alarm rules tab.
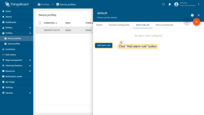
- Click the “+” button and select Create new alarm rule.
Step 4.2 Configure the General parameters
In the General section, specify the alarm type — High temperature (or any other name you prefer) — which serves as both the name and the unique identifier of the alarm.
Step 4.3 Add argument
Before defining the alarm trigger condition, you must add at least one argument — the data source that the rule will use.
In the Arguments section, click Add argument and fill in:
- Entity type: Current entity
- Argument type: Latest telemetry
- Time series key: temperature
- Argument name: temperature
- Click Add.
This creates the temperature variable that will be used in the alarm rule conditions.
Step 4.4 Configure the alarm trigger condition
In the Trigger condition section, click Add trigger condition.
- Severity: Critical
- Condition
- Click Add condition.
- In the configuration window, click Add argument filter and specify:
- General block:
- Argument: temperature (the argument added earlier)
- Value type: Numeric
- Filters block:
- Click Add
- Operation: greater than
- Value source: Static
- Value: 25
- Click Add.
- General block:
- Type: Simple
- Click Save.
As a result, the alarm will trigger immediately when the temperature exceeds 25°C.
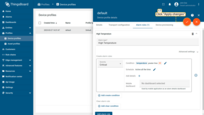
Save the rule
Click the Add button to save the new alarm creation rule.
The rule takes effect immediately after it is saved.

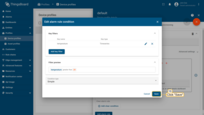
Click My New Device to open its details, and navigate to the Alarm rules tab.
Click the "+" button, and select Create new alarm rule.
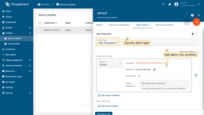
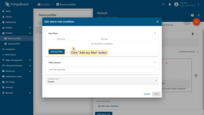
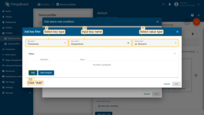
Filters: Click Add; Operation: greater than; Value source: Static; Value: 25.
Click Add.
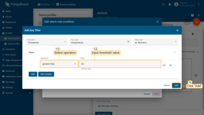
Save condition.
We also recommend reviewing the alarm rule configuration examples
Step 5. Create alarm
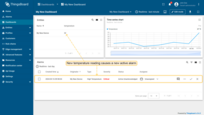
Now that the alarm rule is active (see Step 4), you need to send new telemetry data from the device (see Step 2) to trigger the alarm.
Important: The alarm will be created only when the temperature value exceeds the threshold of 25°C defined in the alarm creation condition.
What happens after sending telemetry
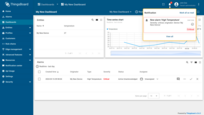
- As soon as a new temperature value goes above the threshold, a new active alarm will appear on the dashboard.
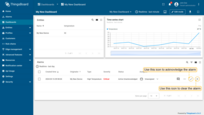
- You can acknowledge and clear alarms using the Alarm table widget.
- After the alarm is created, you will also receive a notification in the Notification center. Click the bell icon in the top-right corner to view the latest notifications.
Step 6. Alarm notifications
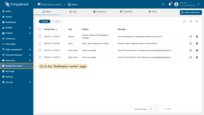
The ThingsBoard Notification center allows personalized notifications to end-users regarding device activities, environmental changes, or events in your IoT ecosystem, and more. Notifications can be delivered via email, SMS, or integrated third-party systems.
Additionally, ThingsBoard Mobile Application provides instant push notifications directly to your smartphone, ensuring you're always informed of critical events wherever you are.
Follow this guide to install the ThingsBoard mobile app and set up notifications.
Enjoy exploring ThingsBoard!
Step 7. Assign device and dashboard to customer
One of the most important ThingsBoard features is the ability to assign Dashboards to Customers. You may assign different devices to different customers. Then, you may create a Dashboard(s) and assign it to multiple customers. Each customer user will see his own devices and will not be able to see devices or any other data that belongs to a different customer.
We have already created a Device (see Step 1), and a Dashboard (see Step 3). Now it's time to create a Customer and a Customer User and make sure they will have access to the device’s data and the dashboard.
Step 7.1 Create customer
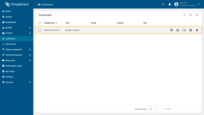
Let's create a customer with the title “My New Customer”. Please see the instruction below:
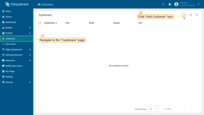
- Navigate to the Customers page. Click the "+" sign to add a customer;
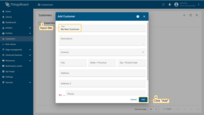
- Input customer title and click "Add".
- The new customer has been created.
Step 7.2 Assign the device to customer
Let's assign device to the customer. The customer users will have ability to read and write telemetry and send commands to devices.
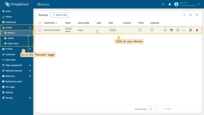
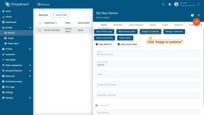
- Open "Devices" page, then select your device to open its details;
- Click "Assign to customer" button;
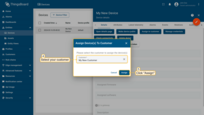
- Select the customer to whom you want to assign the device, and then click "Assign";
- You have changed the owner of the device. In the "Customer" column, you can see the owners name of the device;
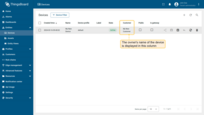
Make sure that the device is assigned to your customer.
- Navigate to "Customers" page to make sure that the device is assigned to your customer. Find your customer in the list of customers and then click on the "Manage customer devices" icon;
- The device is with your client.

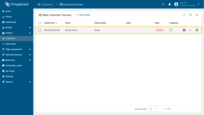
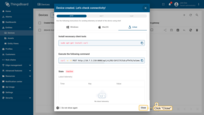
You can make the customer the owner of the device during its creation stage. To do this, follow this steps:
- Click on the "+" icon in the top right corner of the table and then select "Add new device" from drop-down menu;
- Input device name (for example, "Thermostat") and select the customer in the "Assign to customer" field to whom you want to assign the new device. Then, click "Add";
- Close check connectivity window;
- The device has been created, and it immediately belongs to the selected customer.
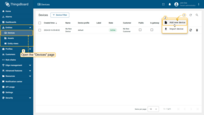
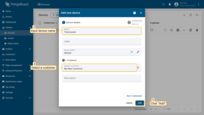

Step 7.3 Assign the dashboard to customer
Let's share our dashboard with the customer. The customer users will have read-only access to the dashboard.
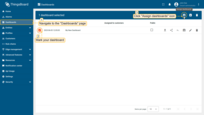
- Open "Dashboards" page. Mark your dashboard and click the "Assign dashboards" icon;
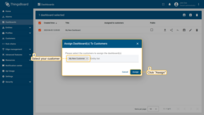
- Mark "My New Customer" and click "Assign";
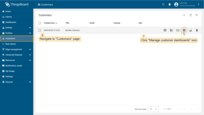
- Navigate to the "Customers" page. Click "Manage customer dashboards" icon for "My New Customer";
- "My New Dashboard" is assigned to your customer.

Step 7.4 Create customer user
Now, let's create a user that will belong to the customer and will have read-only access both to the dashboard and the device.
You may optionally configure the dashboard to appear just after user logs in to the platform's web UI.
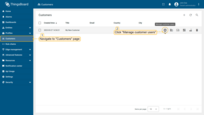
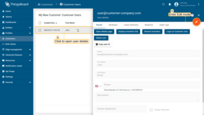
- Navigate to "Customers" page. Find your customer in the list of customers and then click on the "Manage customer users" icon;
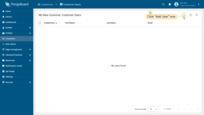
- Click the "Add user" icon in the top right corner of the table;
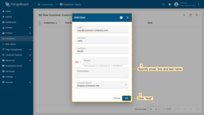
- Specify email that you will use to login as a customer user and click "Add";
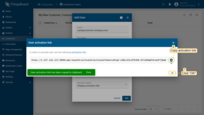
- Copy the activation link and save it to a safe place. You will use it later to set the password. Click "OK";
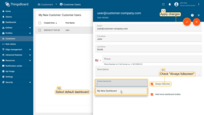
- Click on the created user to open details. Click "pencil" icon to enter edit mode;
- Select your "My New Dashboard" as default dashboard and check "Always fullscreen". Apply changes.
Step 7.5 Activate customer user
Finally, log in to ThingsBoard as a customer user.
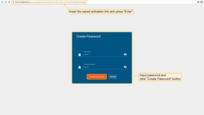
- Paste the previously copied link into a new browser tab and press the "Enter" key. Now create a password by entering it twice and clicking "Create Password".
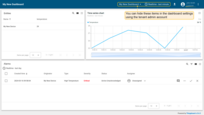
- You are now logged in as a customer user. You may browse the data and acknowledge/clear alarms.
Next steps
-
Connect your device - Learn how to connect devices based on your connectivity technology or solution.
-
Data visualization - These guides contain instructions on how to configure complex ThingsBoard dashboards.
-
Data processing & actions - Learn how to use ThingsBoard Rule Engine.
-
IoT Data analytics - Learn how to use rule engine to perform basic analytics tasks.
-
Advanced features - Learn about advanced ThingsBoard features.
-
Contribution and Development - Learn about contribution and development in ThingsBoard.
Your feedback
Don't hesitate to star ThingsBoard on github to help us spread the word. If you have any questions about this sample, please contact us.